suppressPackageStartupMessages({
  library(tidyverse)
  library(Seurat)
  library(magrittr)
  library(dplyr)
  library(purrr)
  library(ggplot2)
  library(here)
  library(runSeurat3)
  library(SingleCellExperiment)
  library(RColorBrewer)
  library(pheatmap)
  library(scater)
  library(scran)
  library(ggsci)
})merge and charaterize adult mLN plus iLN
load packages
heatmap function
avgHeatmap <- function(seurat, selGenes, colVecIdent, colVecCond=NULL,
                       ordVec=NULL, gapVecR=NULL, gapVecC=NULL,cc=FALSE,
                       cr=FALSE, condCol=FALSE){

  selGenes <- selGenes$gene

  ## assay data
  clusterAssigned <- as.data.frame(Idents(seurat)) %>%
  dplyr::mutate(cell=rownames(.))
  colnames(clusterAssigned)[1] <- "ident"
  seuratDat <- GetAssayData(seurat)

  ## genes of interest
  genes <- data.frame(gene=rownames(seurat)) %>%
    mutate(geneID=gsub("^.*\\.", "", gene)) %>% filter(geneID %in% selGenes)

  ## matrix with averaged cnts per ident
  logNormExpres <- as.data.frame(t(as.matrix(
    seuratDat[which(rownames(seuratDat) %in% genes$gene),])))
  logNormExpres <- logNormExpres %>% dplyr::mutate(cell=rownames(.)) %>%
    dplyr::left_join(.,clusterAssigned, by=c("cell")) %>%
    dplyr::select(-cell) %>% dplyr::group_by(ident) %>%
    dplyr::summarise_all(mean)
  logNormExpresMa <- logNormExpres %>% dplyr::select(-ident) %>% as.matrix()
  rownames(logNormExpresMa) <- logNormExpres$ident
  logNormExpresMa <- t(logNormExpresMa)
  rownames(logNormExpresMa) <- gsub("^.*?\\.","",rownames(logNormExpresMa))

  ## remove genes if they are all the same in all groups
  ind <- apply(logNormExpresMa, 1, sd) == 0
  logNormExpresMa <- logNormExpresMa[!ind,]
  genes <- genes[!ind,]

  ## color columns according to cluster
  annotation_col <- as.data.frame(gsub("(^.*?_)","",
                                       colnames(logNormExpresMa)))%>%
    dplyr::mutate(celltype=gsub("(_.*$)","",colnames(logNormExpresMa)))
  colnames(annotation_col)[1] <- "col1"
  annotation_col <- annotation_col %>%
    dplyr::mutate(cond = gsub(".*_","",col1)) %>%
    dplyr::select(cond, celltype)
  rownames(annotation_col) <- colnames(logNormExpresMa)

  ann_colors = list(
      cond = colVecCond,
      celltype=colVecIdent)
  if(is.null(ann_colors$cond)){
    annotation_col$cond <- NULL
  }

  ## adjust order
  logNormExpresMa <- logNormExpresMa[selGenes,]
  if(is.null(ordVec)){
    ordVec <- levels(seurat)
  }
  logNormExpresMa <- logNormExpresMa[,ordVec]

  ## scaled row-wise
  pheatmap(logNormExpresMa, scale="row" ,treeheight_row = 0, cluster_rows = cr,
         cluster_cols = cc,
         color = colorRampPalette(c("#2166AC", "#F7F7F7", "#B2182B"))(50),
         annotation_col = annotation_col, cellwidth=15, cellheight=10,
         annotation_colors = ann_colors, gaps_row = gapVecR, gaps_col = gapVecC)
}
set dir and load sample
basedir <- here()
seurat <- readRDS(paste0(basedir, "/data/AllSamplesMerged_seurat.rds"))

colLoc <- c("#61baba", "#ba6161")
names(colLoc) <- unique(seurat$location)

colAge <- c("#440154FF", "#3B528BFF", "#21908CFF", "#5DC863FF", "#FDE725FF")
names(colAge) <- c("E18" , "P7", "3w", "8w","E17to7wk")

colPal <- c("#DAF7A6", "#FFC300", "#FF5733", "#C70039", "#900C3F", "#b66e8d",
            "#61a4ba", "#6178ba", "#54a87f", "#25328a",
            "#b6856e", "#0073C2FF", "#EFC000FF", "#868686FF", "#CD534CFF",
            "#7AA6DCFF", "#003C67FF", "#8F7700FF", "#3B3B3BFF", "#A73030FF",
            "#4A6990FF")[1:length(unique(seurat$RNA_snn_res.0.25))]
names(colPal) <- unique(seurat$RNA_snn_res.0.25)

colCond <- c("#446a7f", "#cb7457")
names(colCond) <- c("LTbR", "WT")

colDat <- colDat <- c(pal_npg()(10),pal_futurama()(12), pal_aaas()(10),
                      pal_jama()(8))[1:length(unique(seurat$dataset))]
names(colDat) <- unique(seurat$dataset)
DimPlot all
clustering
DimPlot(seurat, reduction = "umap", group.by = "RNA_snn_res.0.25",
        cols = colPal, raster = F, shuffle = T)+
  theme_bw() +
  theme(axis.text = element_blank(), axis.ticks = element_blank(),
        panel.grid.minor = element_blank()) +
  xlab("UMAP1") +
  ylab("UMAP2")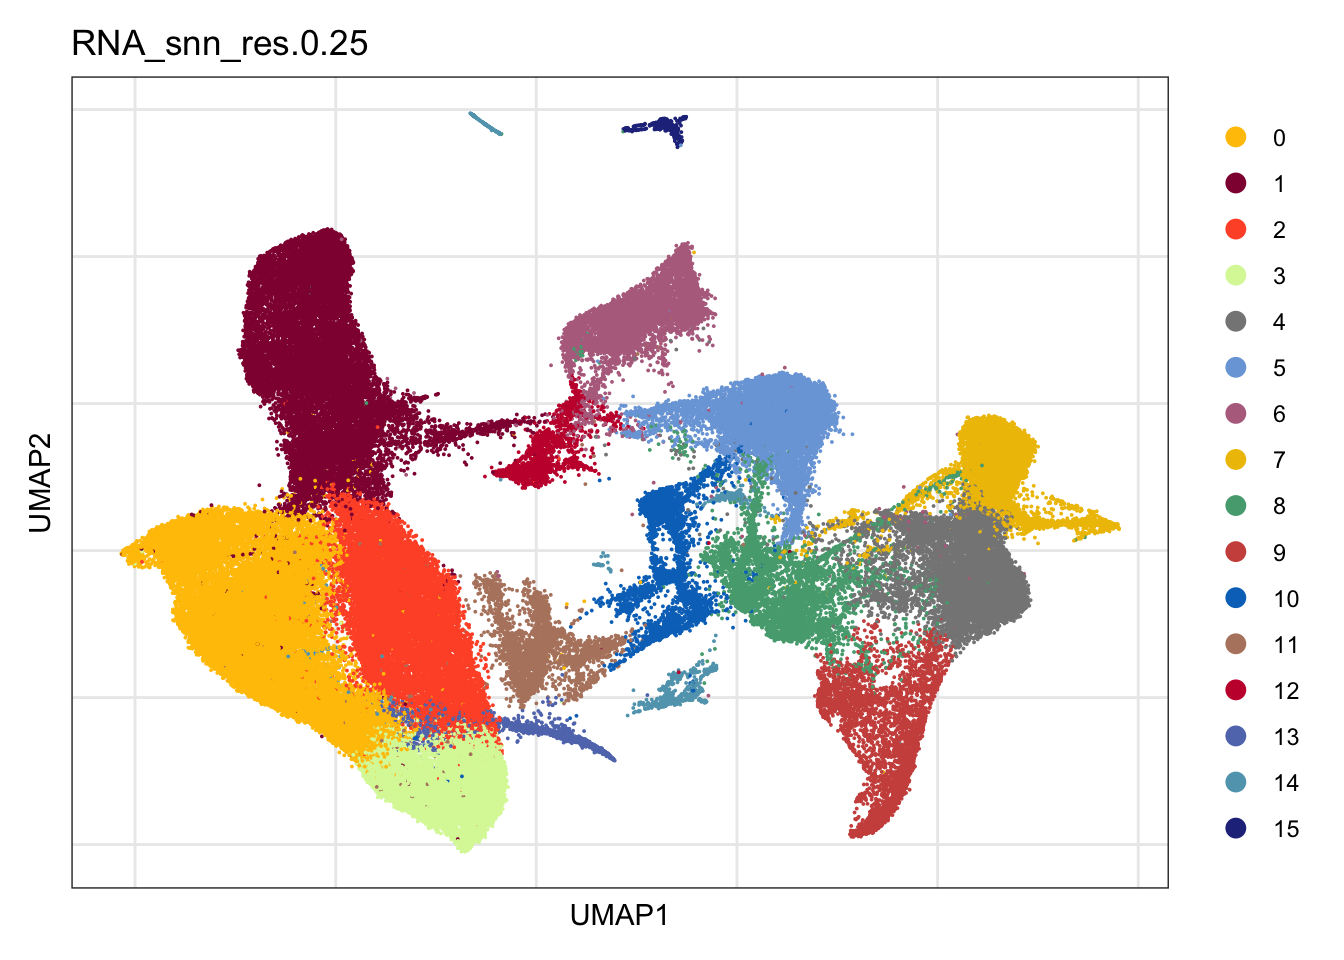
timepoint
DimPlot(seurat, reduction = "umap", group.by = "age", cols = colAge,
        raster = F, shuffle = T)+
  theme_bw() +
  theme(axis.text = element_blank(), axis.ticks = element_blank(),
        panel.grid.minor = element_blank()) +
  xlab("UMAP1") +
  ylab("UMAP2")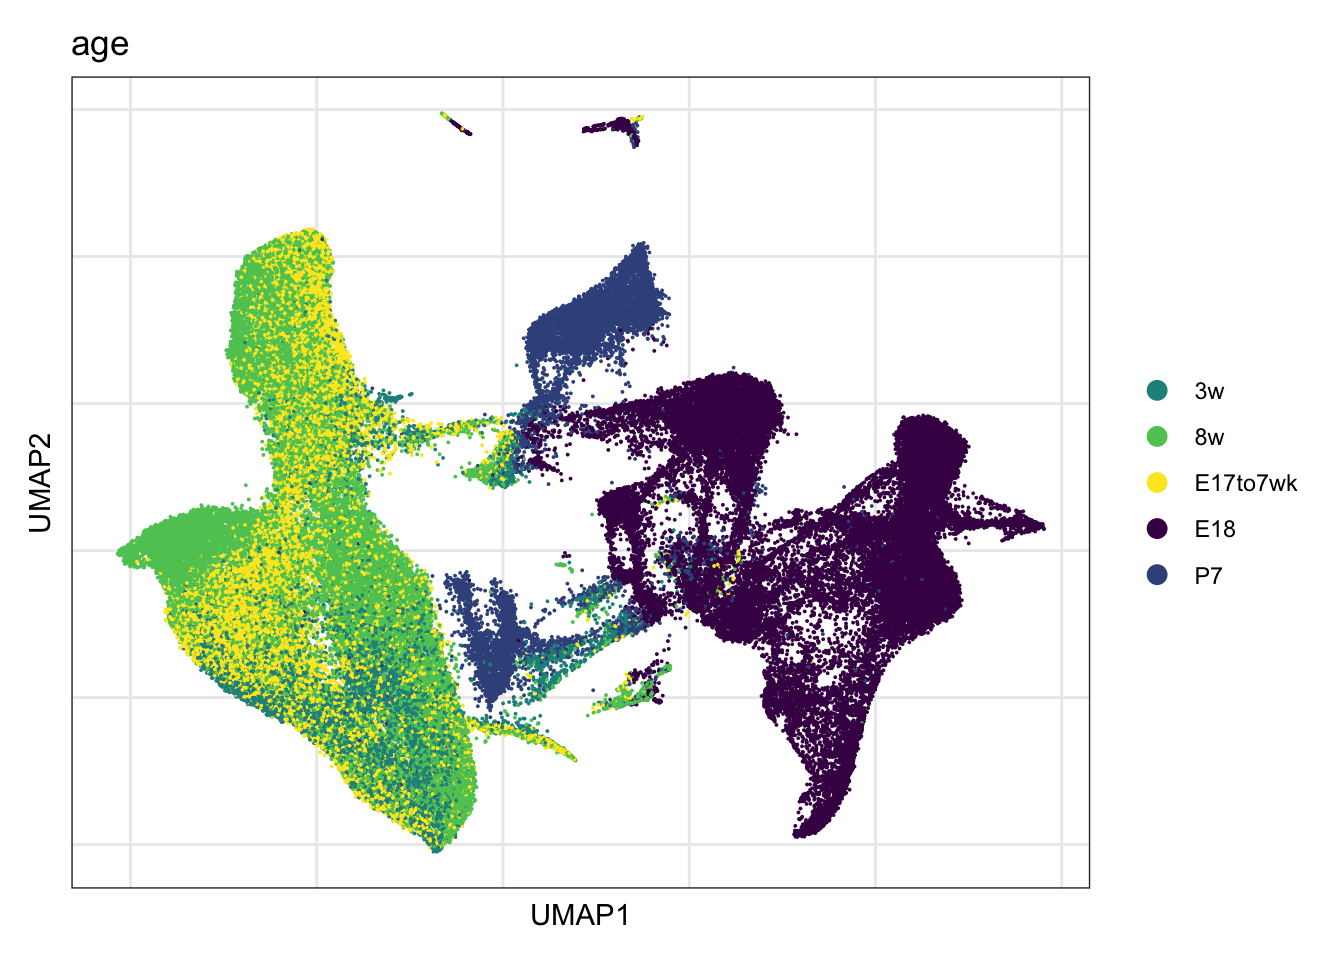
location
DimPlot(seurat, reduction = "umap", group.by = "location", cols = colLoc,
        raster = F, shuffle = T)+
  theme_bw() +
  theme(axis.text = element_blank(), axis.ticks = element_blank(),
        panel.grid.minor = element_blank()) +
  xlab("UMAP1") +
  ylab("UMAP2")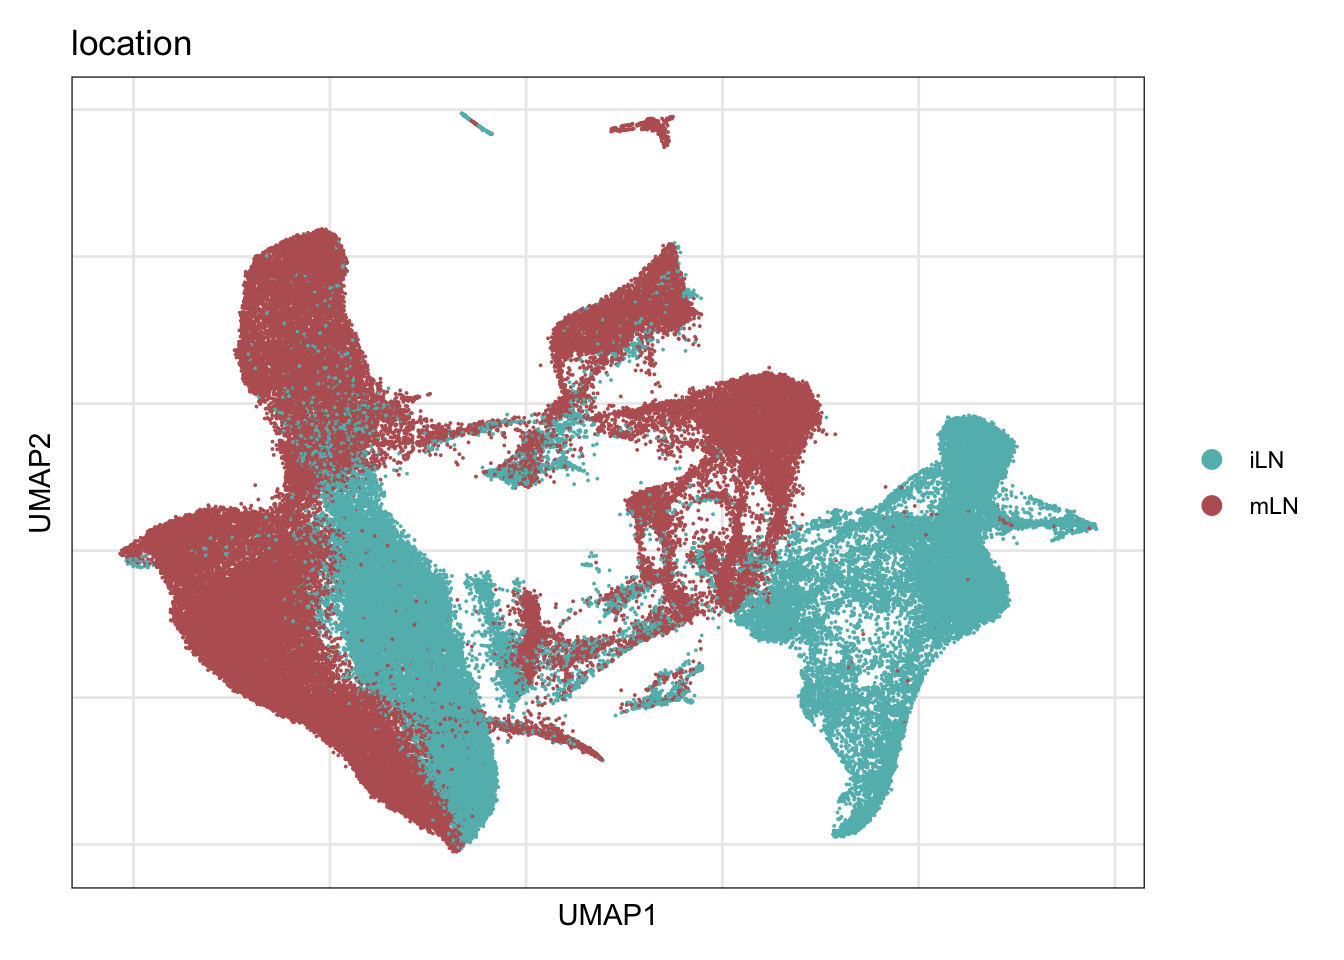
cond
DimPlot(seurat, reduction = "umap", group.by = "cond", cols = colCond,
        raster = F, shuffle = T)+
  theme_bw() +
  theme(axis.text = element_blank(), axis.ticks = element_blank(),
        panel.grid.minor = element_blank()) +
  xlab("UMAP1") +
  ylab("UMAP2")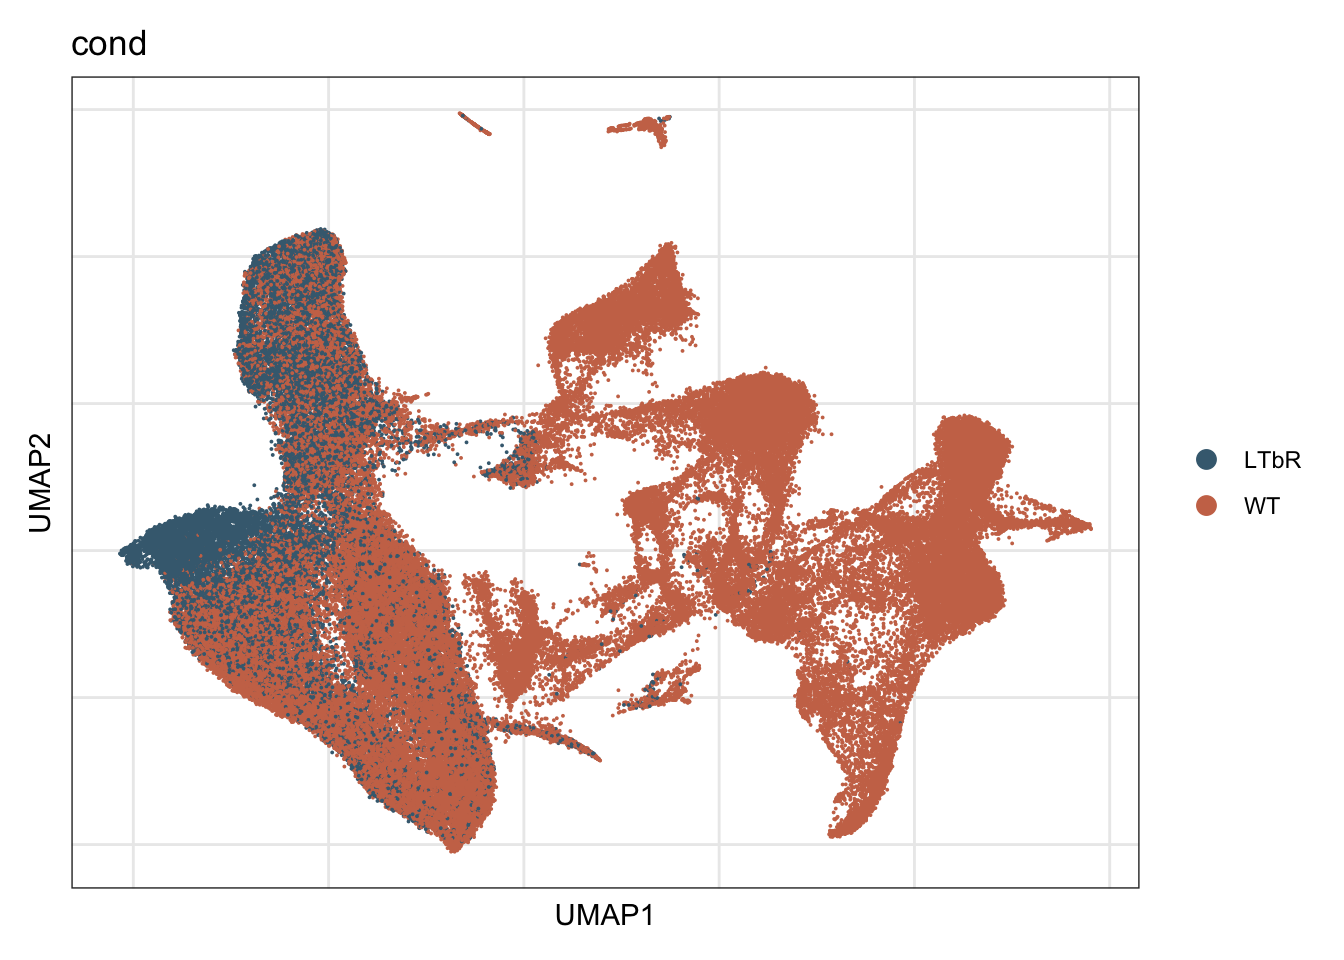
adult WT only
seurat <- subset(seurat, age %in% c("E18", "P7", "3w"), invert=T)
seurat <- subset(seurat, cond %in% c("WT"))

table(seurat$location, seurat$age)
         8w E17to7wk
  iLN 13827     1133
  mLN  8170     8237
transfer label
seuratMLN <- readRDS(paste0(basedir,
                              "/data/WT_adultOnly_mLNonly_filtered",
                              "_labeled_seurat.rds"))

seuratILN <- readRDS(paste0(basedir,
                              "/data/WT_adultOnly_iLNonly_filtered",
                              "_labeled_seurat.rds"))

namMLN <- data.frame(cell=colnames(seuratMLN), labelM=seuratMLN$label)
namILN <- data.frame(cell=colnames(seuratILN), labelI=seuratILN$label)

cellNam <- data.frame(cell=colnames(seurat)) %>% left_join(., namMLN, by="cell") %>%
  left_join(., namILN, by="cell") %>%
  mutate(label=ifelse(is.na(labelM), as.character(labelI), as.character(labelM)))

seurat$label <- cellNam$label

colLab <- c("#42a071", "#900C3F","#b66e8d", "#8F7700FF", "#61a4ba","#003C67FF",
            "#e3953d","#ab5711", "#714542", "#b6856e", "#FFC300")

names(colLab) <- c("FDC", "TRC", "TBRC", "IFRC", "medRC1" , "medRC2",
                   "PRC1", "PRC2", "Pi16+RC", "PRC3", "VSMC")


seurat$label[which(is.na(seurat$label))] <- "notAssigned"
seurat <- subset(seurat, label== "notAssigned", invert=T)

## rerunSeurat
seurat <- NormalizeData(object = seurat)
seurat <- FindVariableFeatures(object = seurat)
seurat <- ScaleData(object = seurat, verbose = FALSE)
seurat <- RunPCA(object = seurat, npcs = 30, verbose = FALSE)
seurat <- RunTSNE(object = seurat, reduction = "pca", dims = 1:20)
seurat <- RunUMAP(object = seurat, reduction = "pca", dims = 1:20)
seurat <- FindNeighbors(object = seurat, reduction = "pca", dims = 1:20)
res <- c(0.8,0.6,0.25,0.4)
for (i in 1:length(res)) {
  seurat <- FindClusters(object = seurat, resolution = res[i],
                         random.seed = 1234)
  }
Modularity Optimizer version 1.3.0 by Ludo Waltman and Nees Jan van Eck
Number of nodes: 29872
Number of edges: 953815
Running Louvain algorithm...
Maximum modularity in 10 random starts: 0.8602
Number of communities: 17
Elapsed time: 5 seconds
Modularity Optimizer version 1.3.0 by Ludo Waltman and Nees Jan van Eck
Number of nodes: 29872
Number of edges: 953815
Running Louvain algorithm...
Maximum modularity in 10 random starts: 0.8773
Number of communities: 13
Elapsed time: 5 seconds
Modularity Optimizer version 1.3.0 by Ludo Waltman and Nees Jan van Eck
Number of nodes: 29872
Number of edges: 953815
Running Louvain algorithm...
Maximum modularity in 10 random starts: 0.9292
Number of communities: 9
Elapsed time: 6 seconds
Modularity Optimizer version 1.3.0 by Ludo Waltman and Nees Jan van Eck
Number of nodes: 29872
Number of edges: 953815
Running Louvain algorithm...
Maximum modularity in 10 random starts: 0.9028
Number of communities: 10
Elapsed time: 5 secondscolPal <- c("#DAF7A6", "#FFC300", "#FF5733", "#C70039", "#900C3F", "#b66e8d",
"#61a4ba", "#6178ba", "#54a87f", "#25328a", "#b6856e",
"#ba6161", "#20714a", "#0073C2FF", "#EFC000FF", "#868686FF",
"#CD534CFF","#7AA6DCFF", "#003C67FF", "#8F7700FF", "#3B3B3BFF",
"#A73030FF", "#4A6990FF")[1:length(unique(seurat$RNA_snn_res.0.4))]
names(colPal) <- unique(seurat$RNA_snn_res.0.4)clustering
DimPlot(seurat, reduction = "umap", group.by = "RNA_snn_res.0.4",
        cols = colPal)+
  theme_bw() +
  theme(axis.text = element_blank(), axis.ticks = element_blank(),
        panel.grid.minor = element_blank()) +
  xlab("UMAP1") +
  ylab("UMAP2")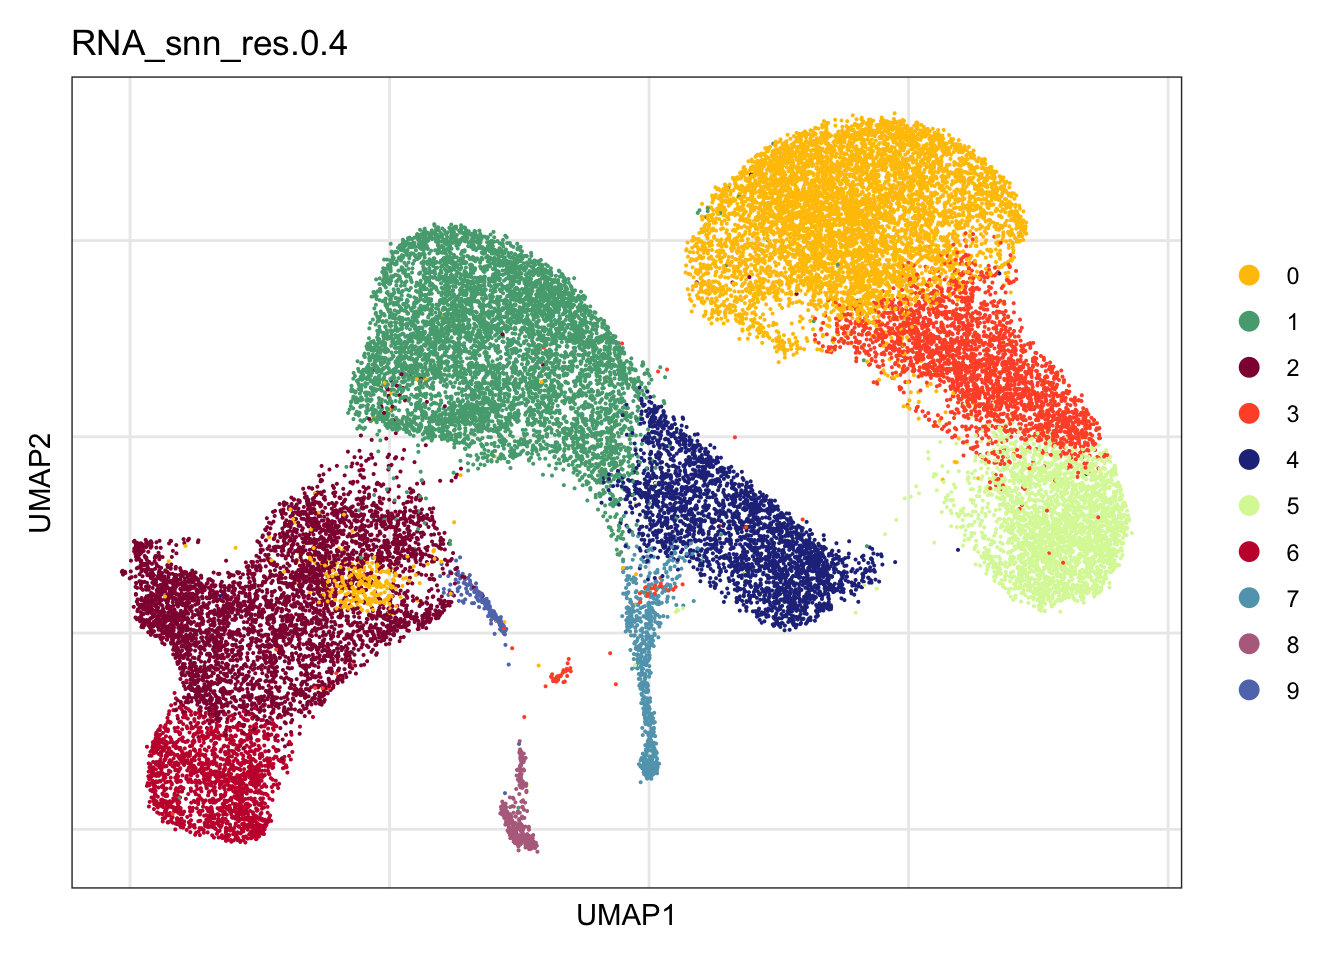
label
DimPlot(seurat, reduction = "umap", group.by = "label", cols = colLab)+
  theme_bw() +
  theme(axis.text = element_blank(), axis.ticks = element_blank(),
        panel.grid.minor = element_blank()) +
  xlab("UMAP1") +
ylab("UMAP2")![]()
DimPlot(seurat, reduction = "umap", group.by = "label", pt.size=0.5,
        cols = colLab)+
theme_void()![]()
label split by location
DimPlot(seurat, reduction = "umap", group.by = "label", cols = colLab,
        split.by = "location")+
  theme_bw() +
  theme(axis.text = element_blank(), axis.ticks = element_blank(),
        panel.grid.minor = element_blank()) +
  xlab("UMAP1") +
  ylab("UMAP2")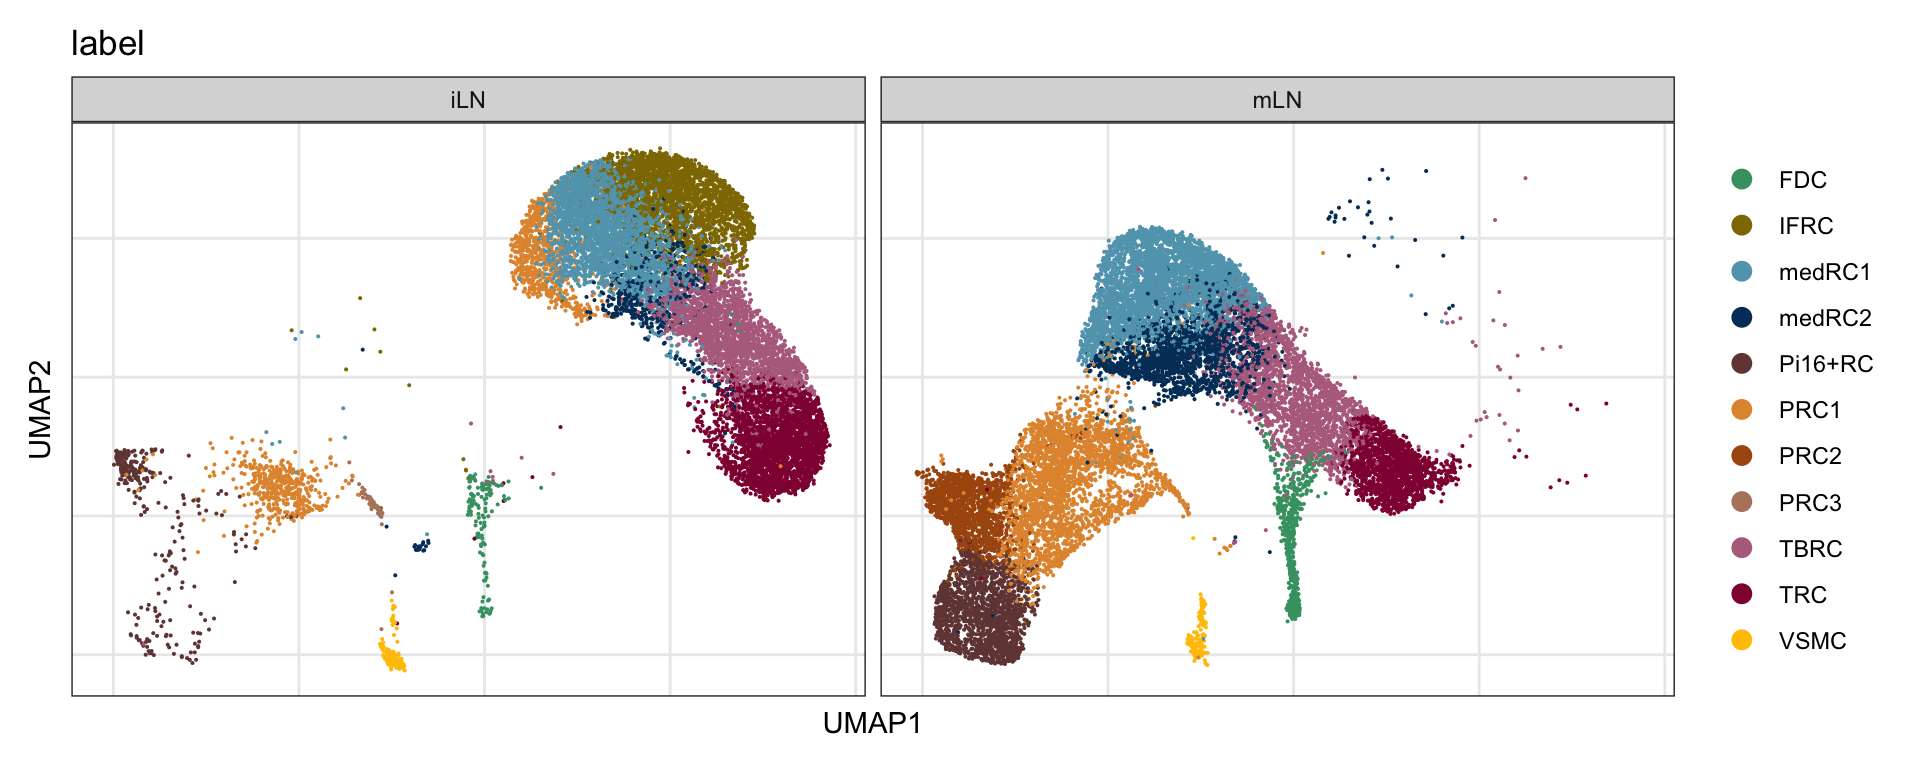
DimPlot(seurat, reduction = "umap", group.by = "label", pt.size=0.5,
        cols = colLab, split.by = "location")+
  theme_void()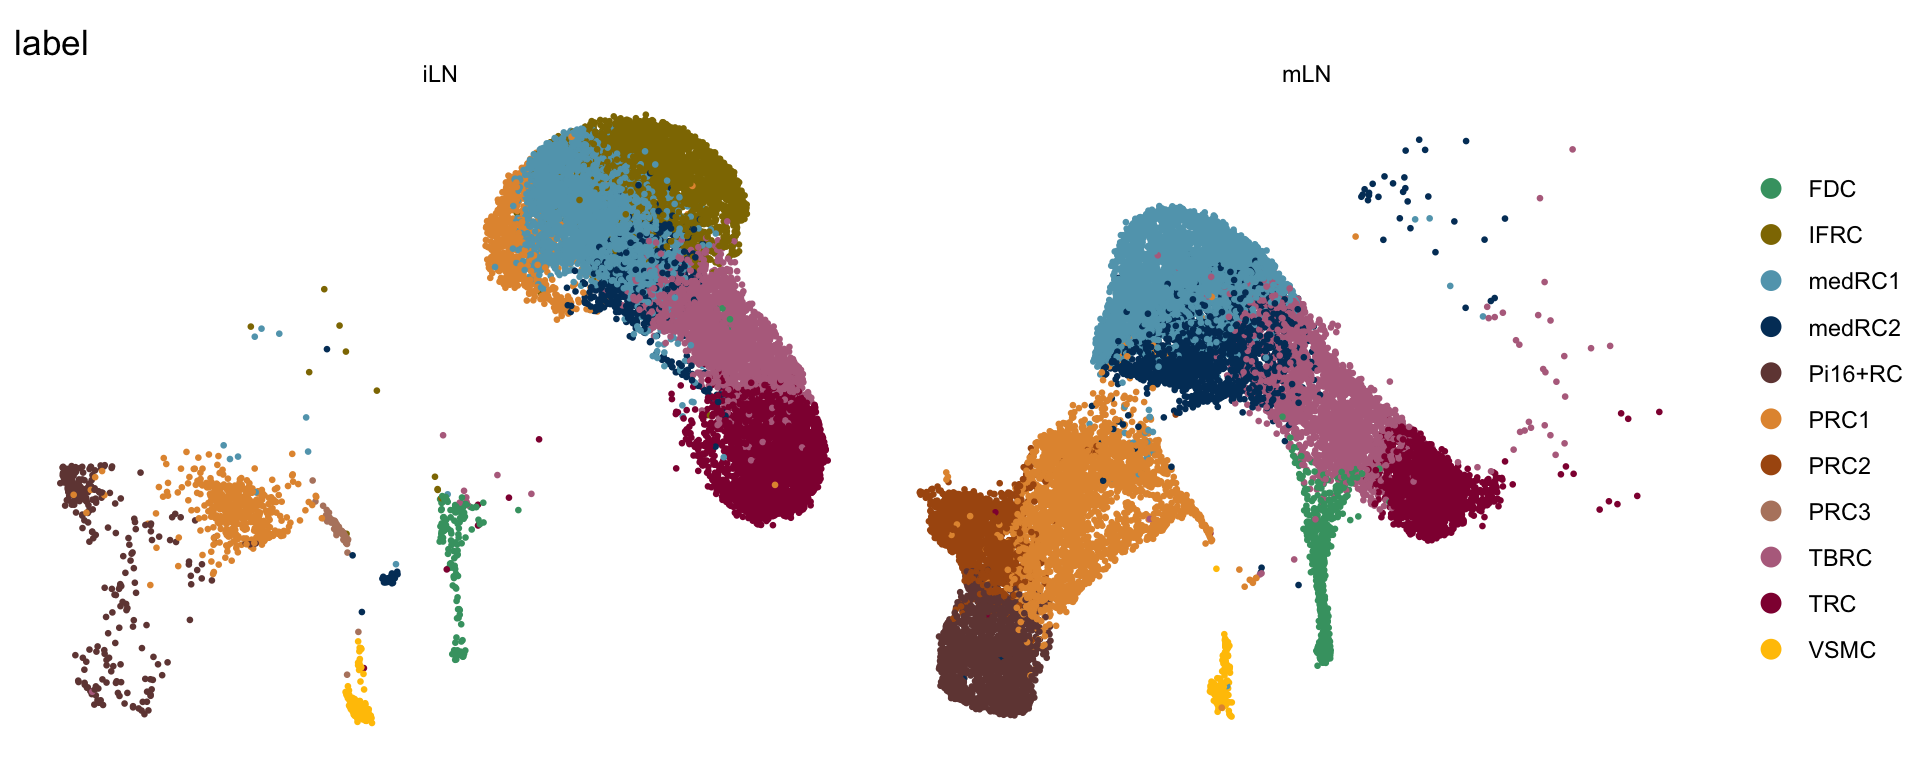
dataset
DimPlot(seurat, reduction = "umap", group.by = "dataset",
        cols = colDat)+
  theme_bw() +
  theme(axis.text = element_blank(), axis.ticks = element_blank(),
        panel.grid.minor = element_blank()) +
  xlab("UMAP1") +
  ylab("UMAP2")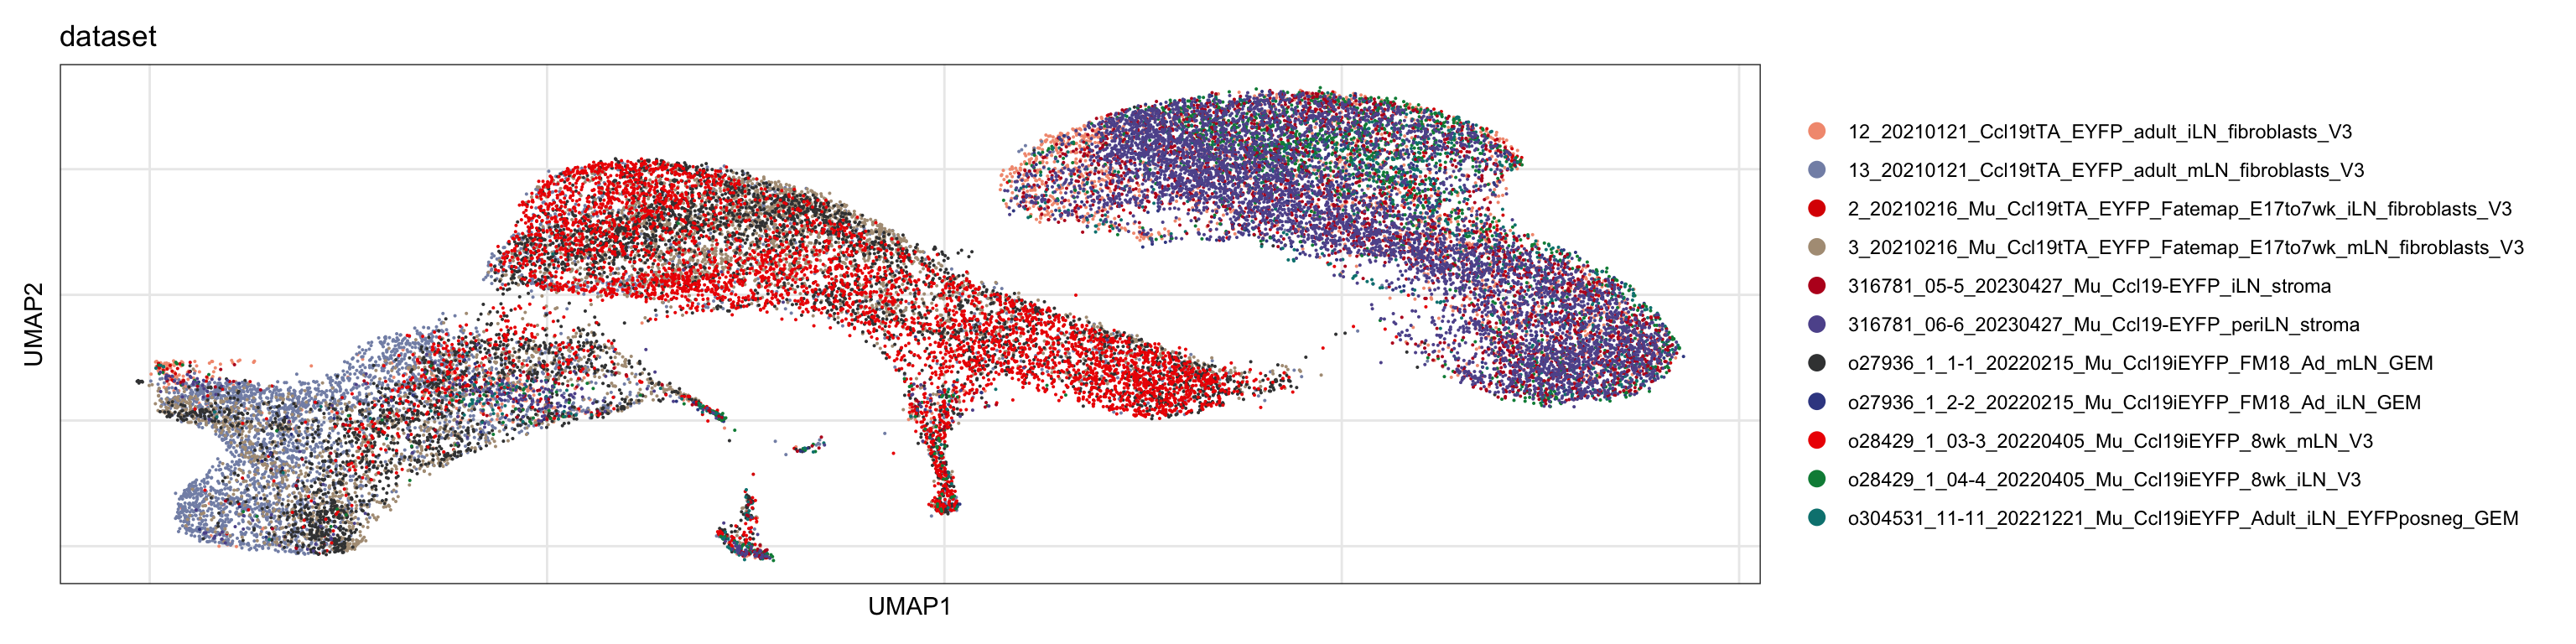
location
DimPlot(seurat, reduction = "umap", group.by = "location", cols = colLoc)+
  theme_bw() +
  theme(axis.text = element_blank(), axis.ticks = element_blank(),
        panel.grid.minor = element_blank()) +
  xlab("UMAP1") +
  ylab("UMAP2")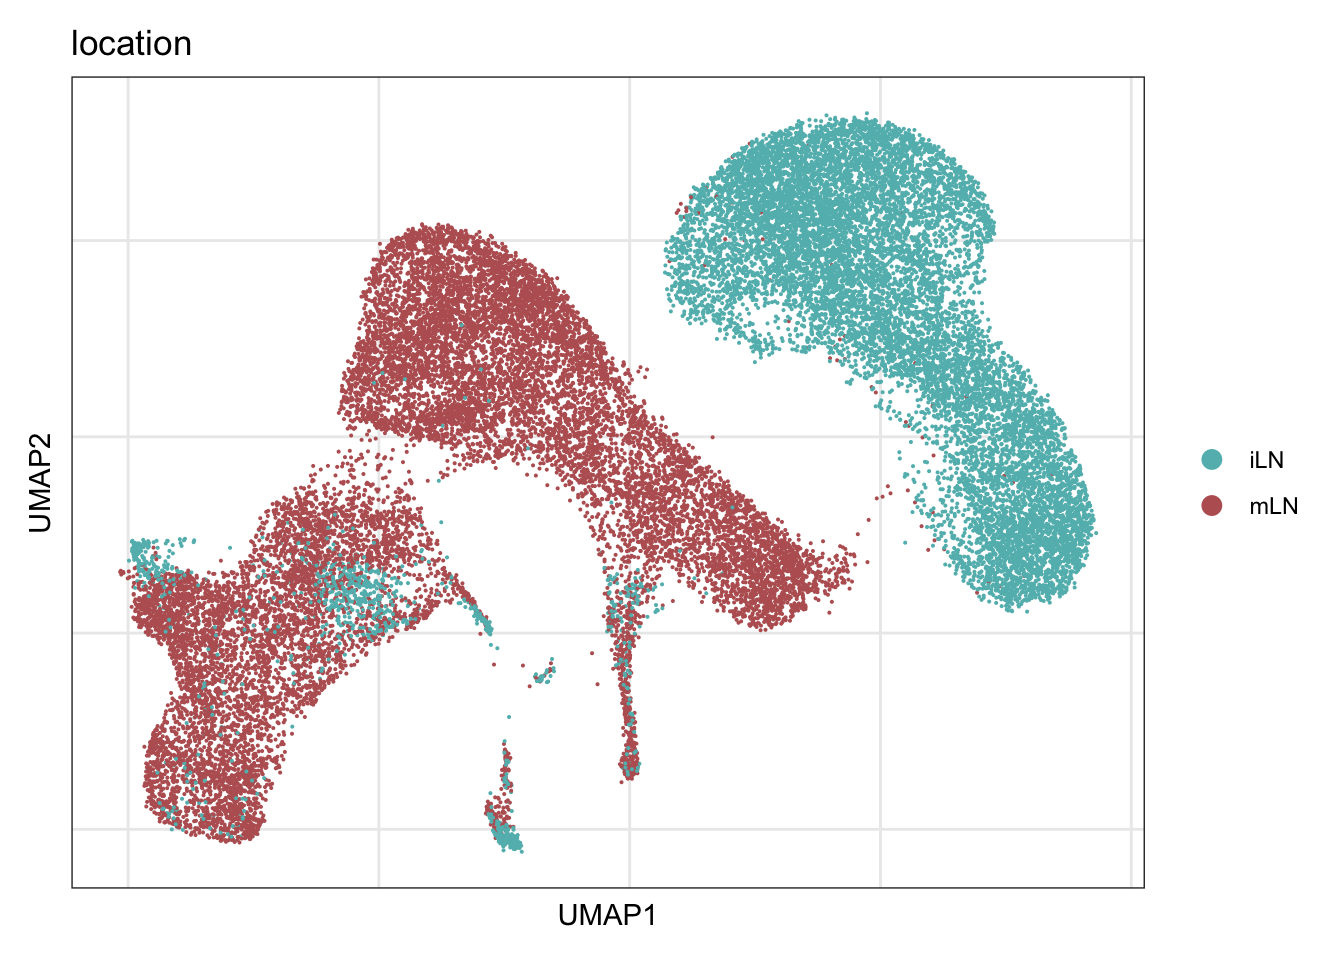
counts
knitr::kable(table(seurat$label, seurat$location))| iLN | mLN | |
|---|---|---|
| FDC | 134 | 603 |
| IFRC | 3023 | 0 |
| medRC1 | 2899 | 3744 |
| medRC2 | 566 | 1968 |
| Pi16+RC | 302 | 1785 |
| PRC1 | 1424 | 2789 |
| PRC2 | 0 | 1464 |
| PRC3 | 88 | 0 |
| TBRC | 2307 | 2257 |
| TRC | 2635 | 1548 |
| VSMC | 175 | 161 |
knitr::kable(table(seurat$location))| Var1 | Freq |
|---|---|
| iLN | 13553 |
| mLN | 16319 |
knitr::kable(table( seurat$label, seurat$EYFP))| neg | pos | |
|---|---|---|
| FDC | 297 | 440 |
| IFRC | 1371 | 1652 |
| medRC1 | 3223 | 3420 |
| medRC2 | 1369 | 1165 |
| Pi16+RC | 2012 | 75 |
| PRC1 | 2922 | 1291 |
| PRC2 | 1396 | 68 |
| PRC3 | 78 | 10 |
| TBRC | 1795 | 2769 |
| TRC | 1237 | 2946 |
| VSMC | 204 | 132 |
## relative abundance per cond
clustCond <- data.frame(table(seurat$location, seurat$label))
colnames(clustCond) <- c("cond", "intCluster", "cnt")
condTot <- data.frame(table(seurat$location))
colnames(condTot) <- c("cond", "tot")
colPaldat <- data.frame(col=colLab) %>%
  rownames_to_column(var = "intCluster")
clustDat2 <- clustCond %>%  left_join(., condTot, by = "cond") %>%
  mutate(relAb = cnt/tot * 100) %>%
  left_join(., colPaldat, by = "intCluster")

knitr::kable(clustDat2)| cond | intCluster | cnt | tot | relAb | col |
|---|---|---|---|---|---|
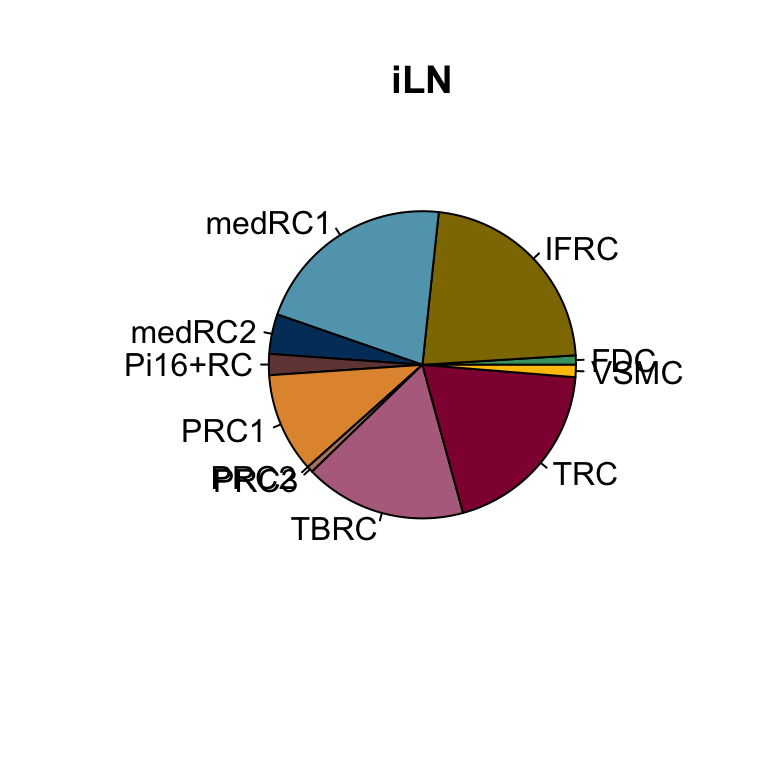
| iLN | FDC | 134 | 13553 | 0.9887110 | #42a071 |
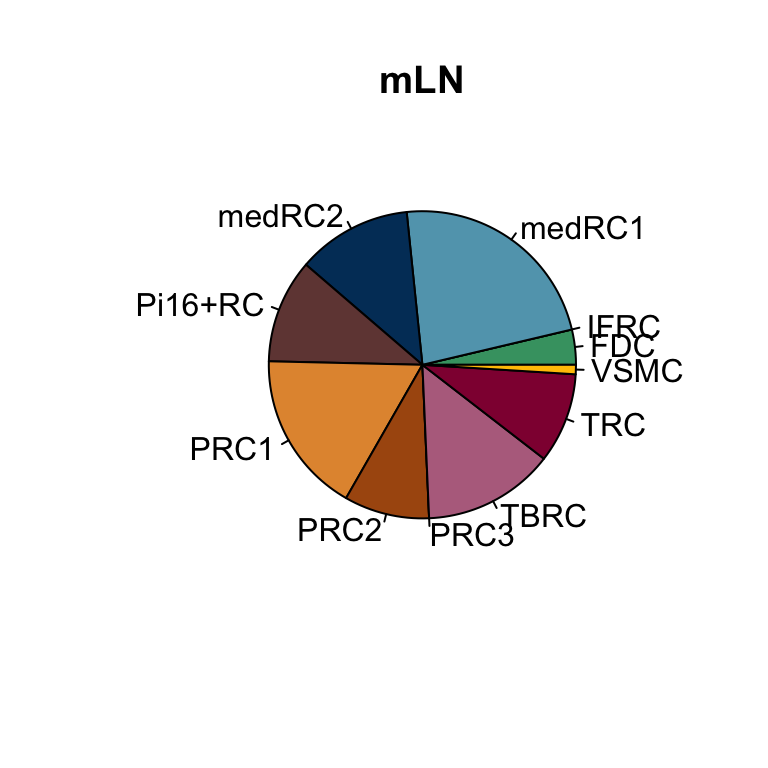
| mLN | FDC | 603 | 16319 | 3.6950794 | #42a071 |
| iLN | IFRC | 3023 | 13553 | 22.3050247 | #8F7700FF |
| mLN | IFRC | 0 | 16319 | 0.0000000 | #8F7700FF |
| iLN | medRC1 | 2899 | 13553 | 21.3900981 | #61a4ba |
| mLN | medRC1 | 3744 | 16319 | 22.9425823 | #61a4ba |
| iLN | medRC2 | 566 | 13553 | 4.1761972 | #003C67FF |
| mLN | medRC2 | 1968 | 16319 | 12.0595625 | #003C67FF |
| iLN | Pi16+RC | 302 | 13553 | 2.2282889 | #714542 |
| mLN | Pi16+RC | 1785 | 16319 | 10.9381702 | #714542 |
| iLN | PRC1 | 1424 | 13553 | 10.5068988 | #e3953d |
| mLN | PRC1 | 2789 | 16319 | 17.0905080 | #e3953d |
| iLN | PRC2 | 0 | 13553 | 0.0000000 | #ab5711 |
| mLN | PRC2 | 1464 | 16319 | 8.9711379 | #ab5711 |
| iLN | PRC3 | 88 | 13553 | 0.6493027 | #b6856e |
| mLN | PRC3 | 0 | 16319 | 0.0000000 | #b6856e |
| iLN | TBRC | 2307 | 13553 | 17.0220615 | #b66e8d |
| mLN | TBRC | 2257 | 16319 | 13.8305043 | #b66e8d |
| iLN | TRC | 2635 | 13553 | 19.4421899 | #900C3F |
| mLN | TRC | 1548 | 16319 | 9.4858754 | #900C3F |
| iLN | VSMC | 175 | 13553 | 1.2912270 | #FFC300 |
| mLN | VSMC | 161 | 16319 | 0.9865801 | #FFC300 |
lapply(names(colLoc), function(co){
  clustDat2sel <- clustDat2 %>% filter(cond==co)
  pie(clustDat2sel$relAb,
      labels = clustDat2sel$intCluster,
      col = clustDat2sel$col,
      main = paste0(co))
})
[[1]]
NULL

[[2]]
NULL
cluster characterization
Idents(seurat) <- seurat$label
seurat_markers <- FindAllMarkers(seurat, only.pos = T, logfc.threshold = 0.25)

### plot DE genes top 10 avg logFC
markerAll <- seurat_markers %>% group_by(cluster) %>%
  mutate(geneID = gene) %>% top_n(10, avg_log2FC) %>%
  mutate(gene=gsub(".*\\.", "",  geneID)) %>%
  filter(nchar(gene)>1)

grpCnt <- markerAll %>% group_by(cluster) %>% summarise(cnt=n())
gapR <- data.frame(cluster=unique(markerAll$cluster)) %>%
  left_join(.,grpCnt, by="cluster") %>% mutate(cumSum=cumsum(cnt))
ordVec <- levels(seurat)

pOut <- avgHeatmap(seurat = seurat, selGenes = markerAll,
                  colVecIdent = colLab,
                  ordVec=ordVec,
                  gapVecR=gapR$cumSum, gapVecC=NULL,cc=T,
                  cr=F, condCol=F)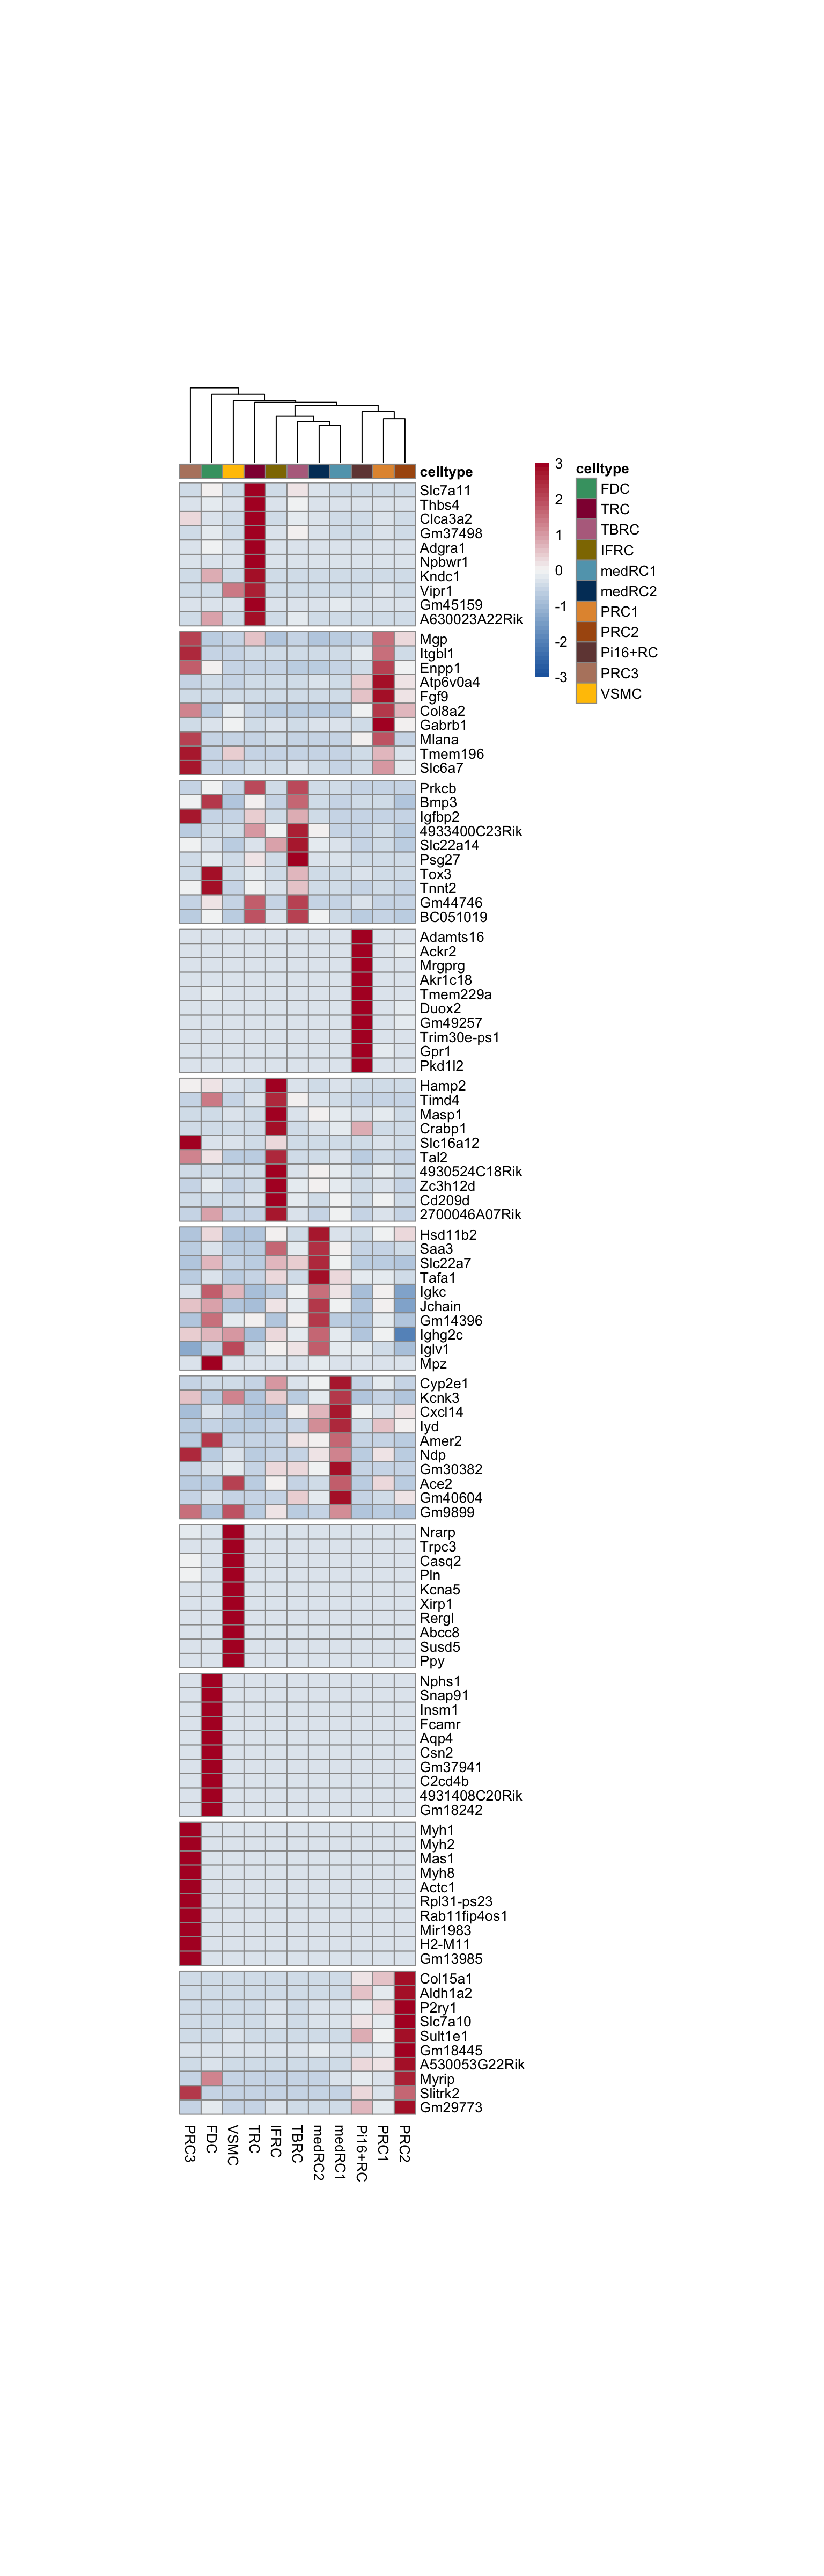
seurat$label_plus_loc <- paste0(seurat$label, "_", seurat$location)
Idents(seurat) <- factor(seurat$label_plus_loc)

ordVec <- levels(seurat)

pOut <- avgHeatmap(seurat = seurat, selGenes = markerAll,
                  colVecIdent = colLab,
                  colVecCond = colLoc,
                  ordVec=ordVec,
                  gapVecR=gapR$cumSum, gapVecC=NULL,cc=F,
                  cr=F, condCol=T)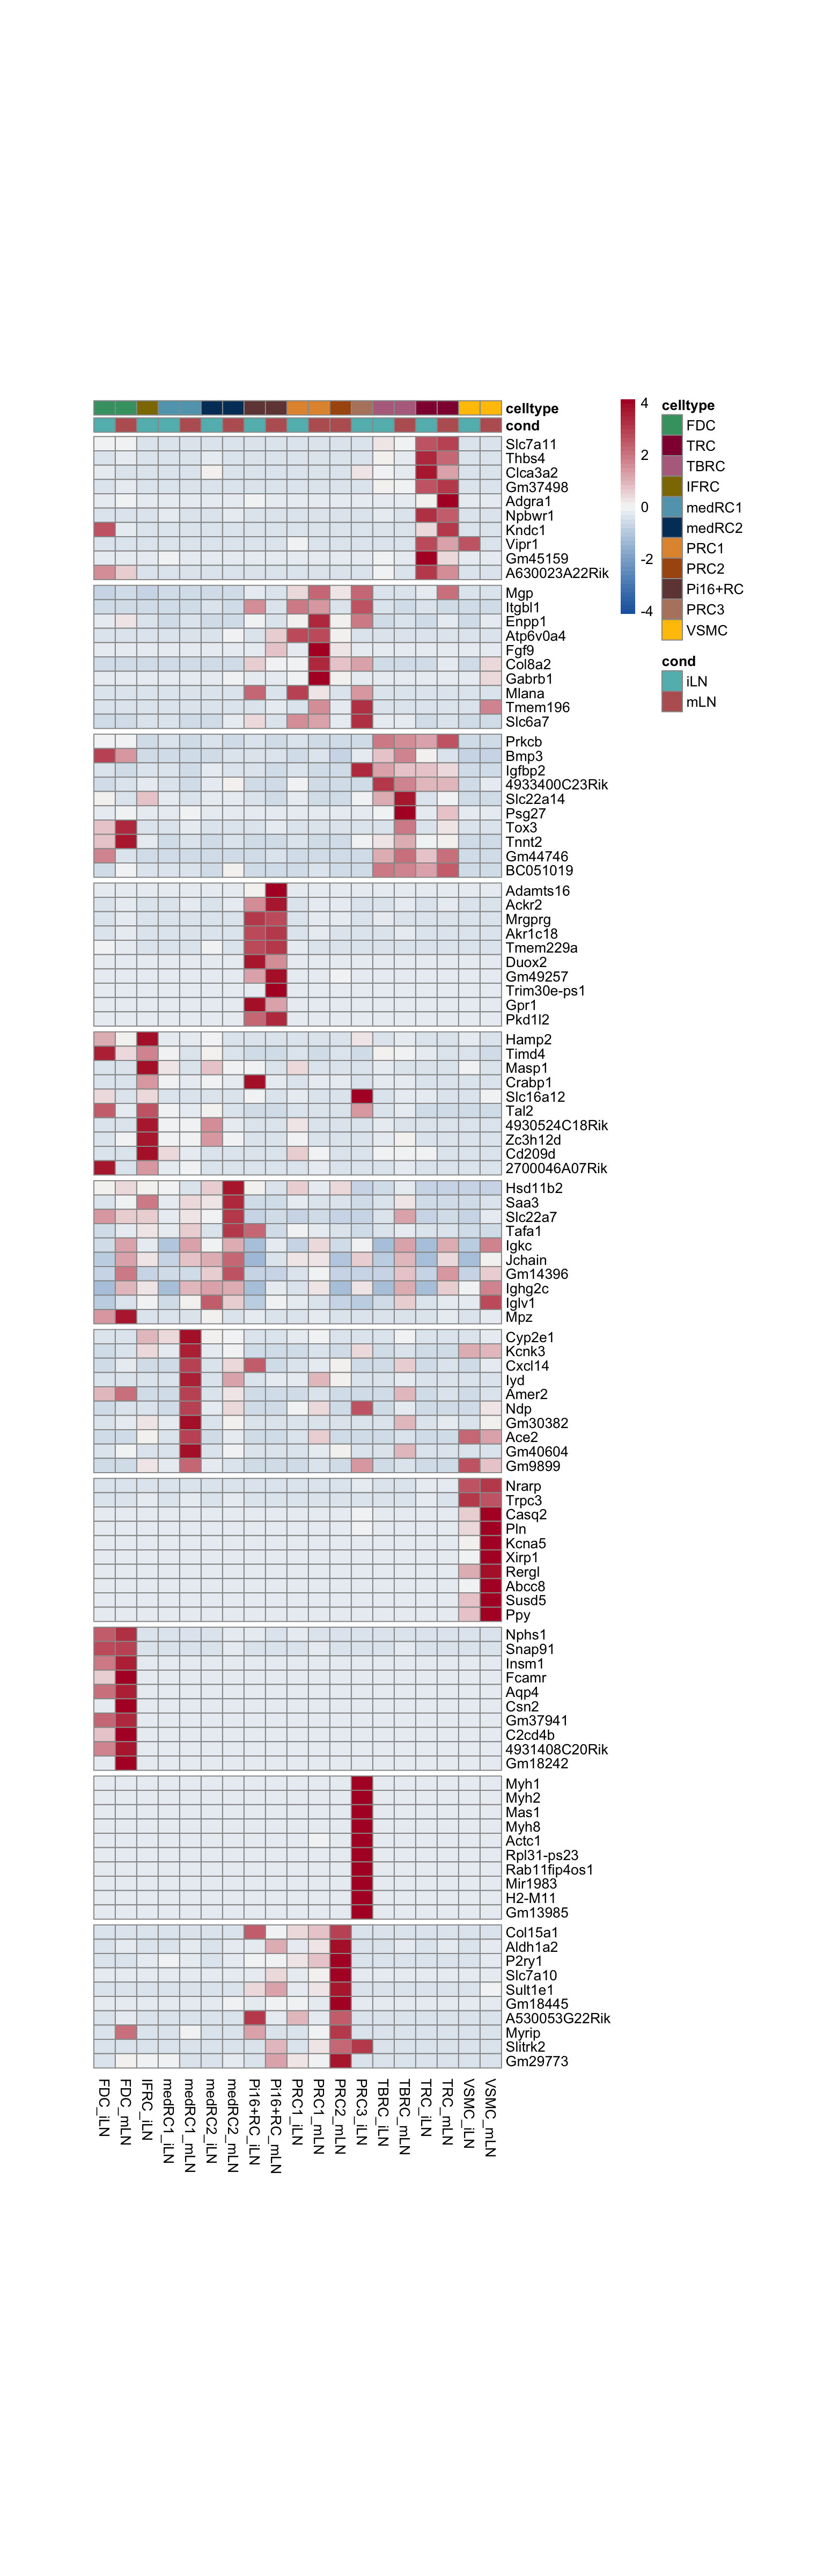
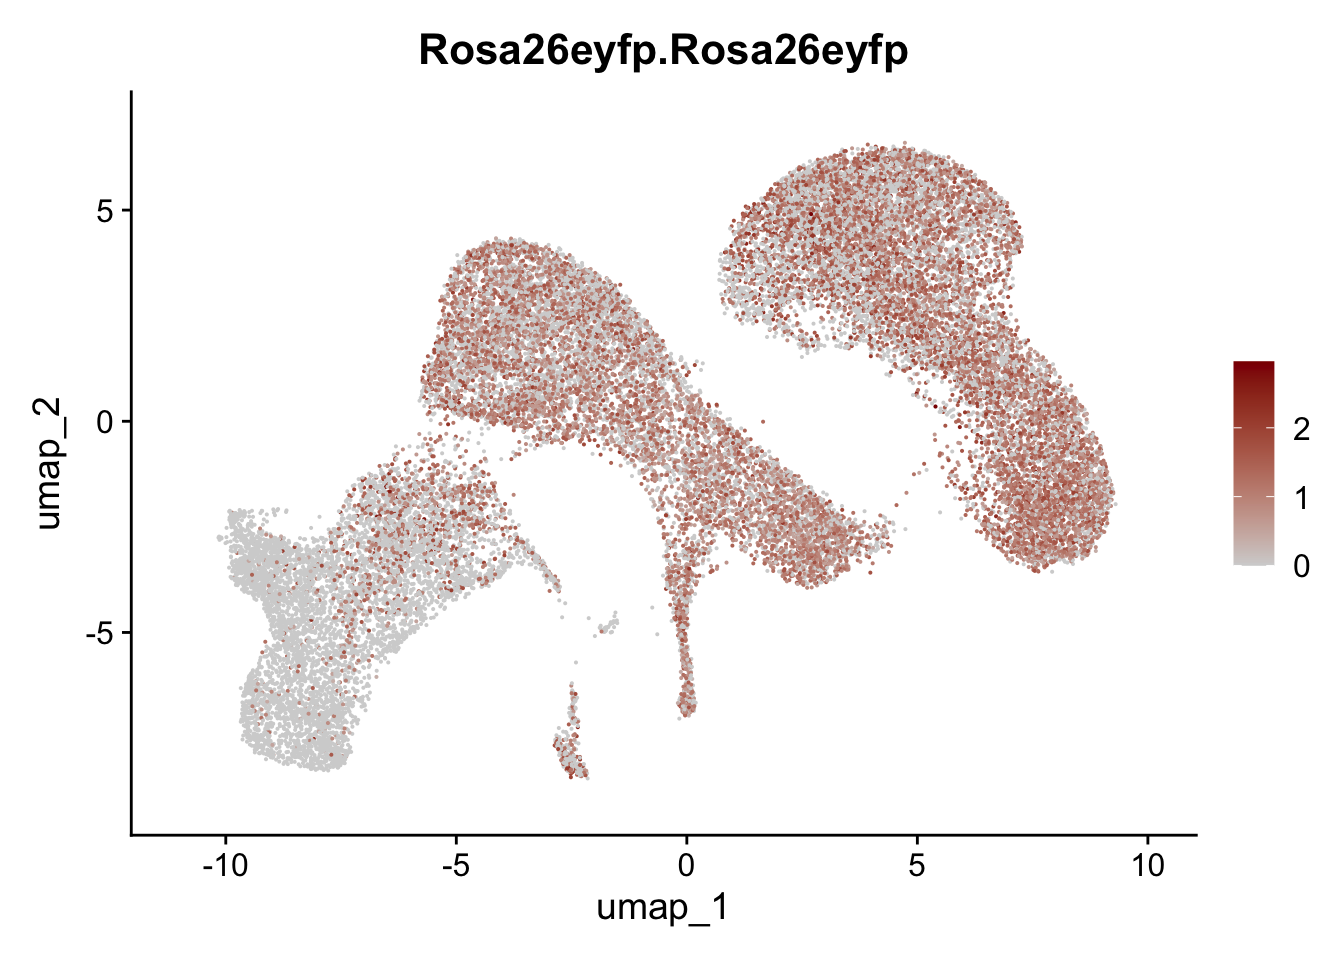
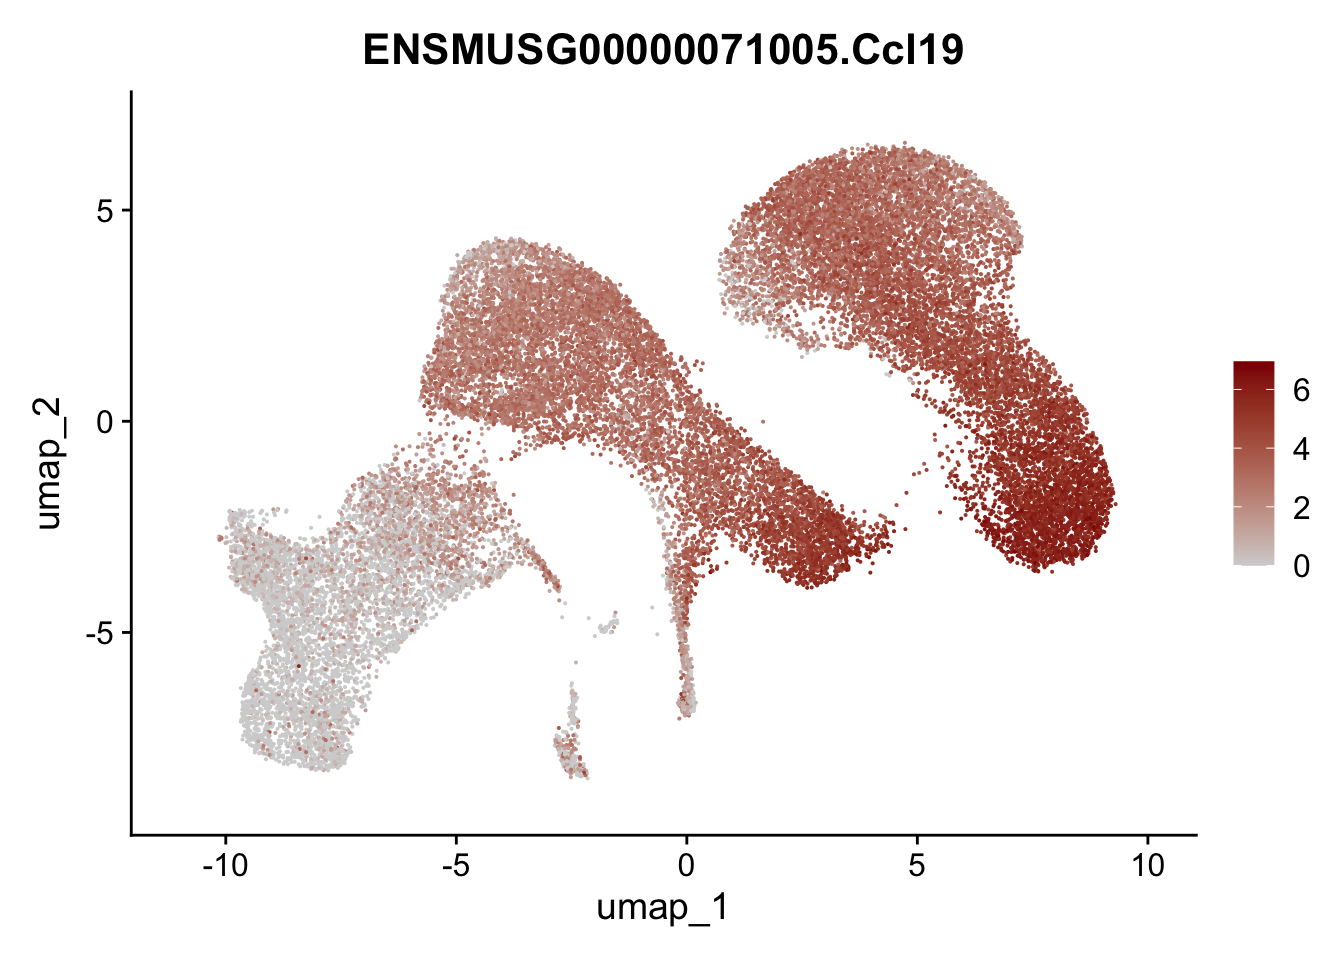
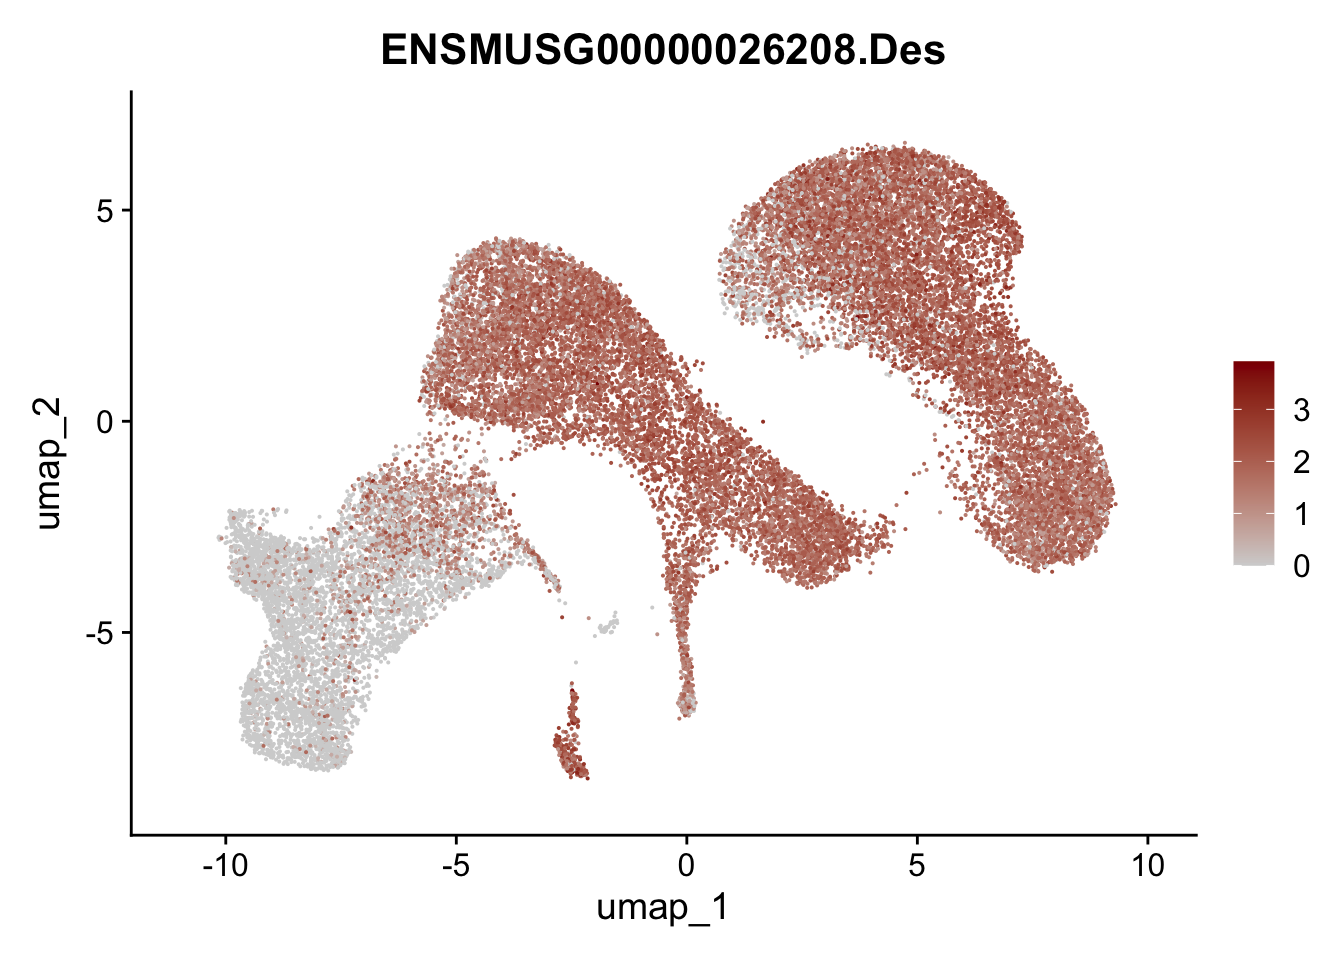
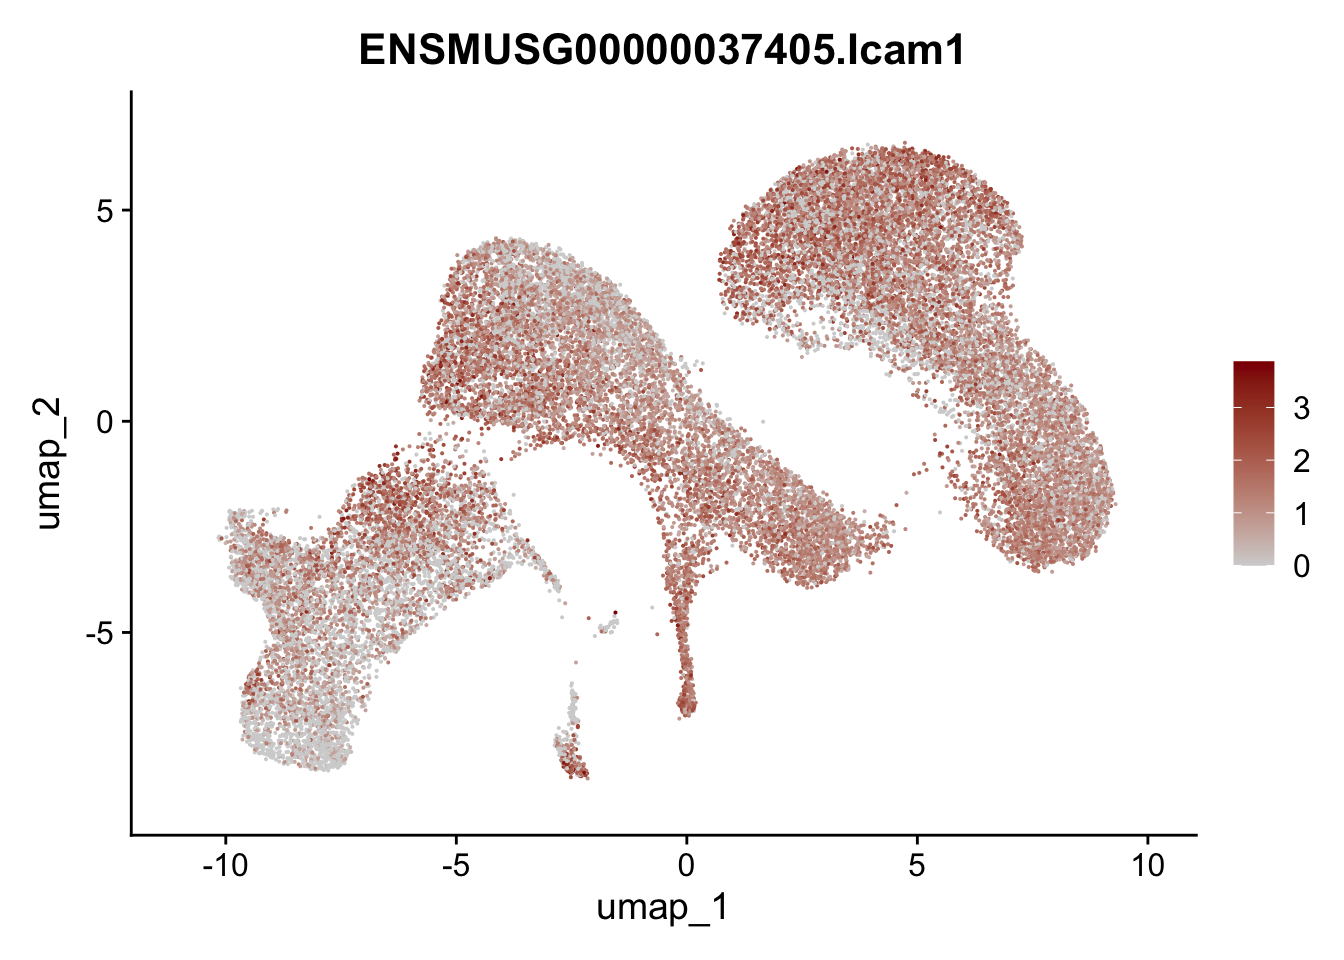
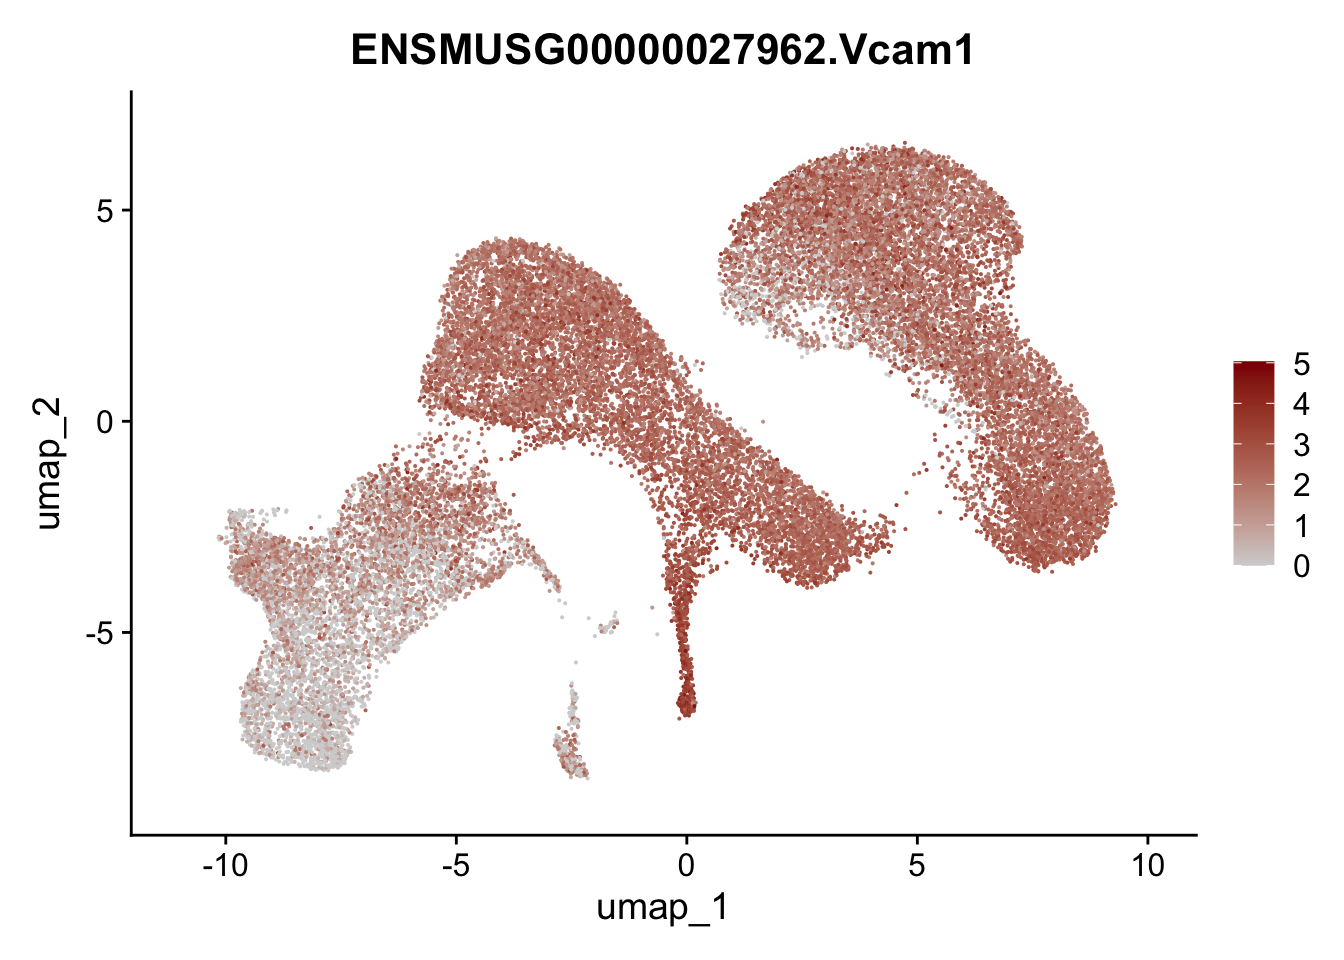
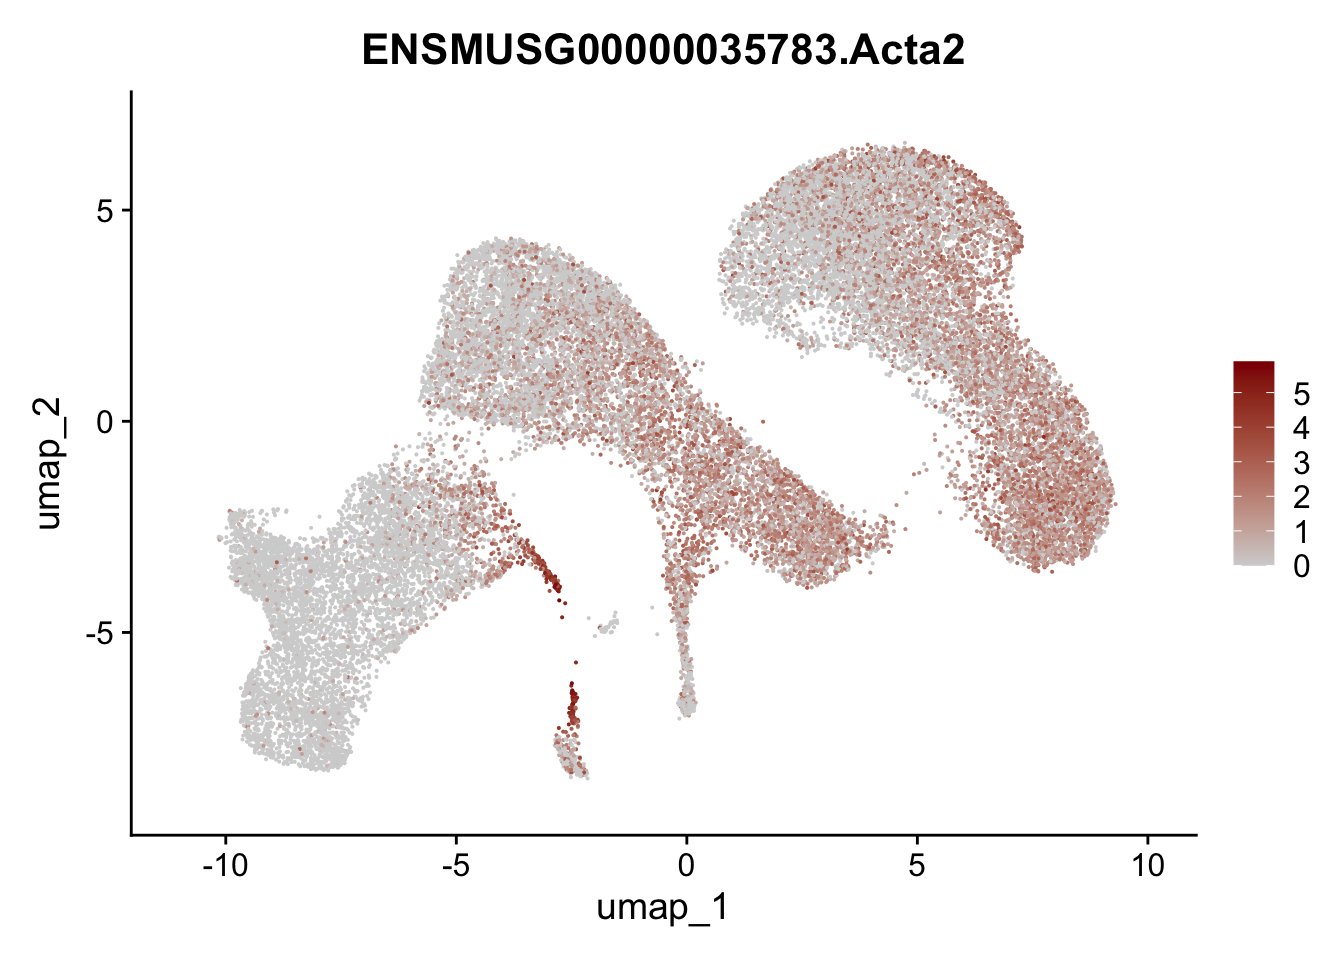
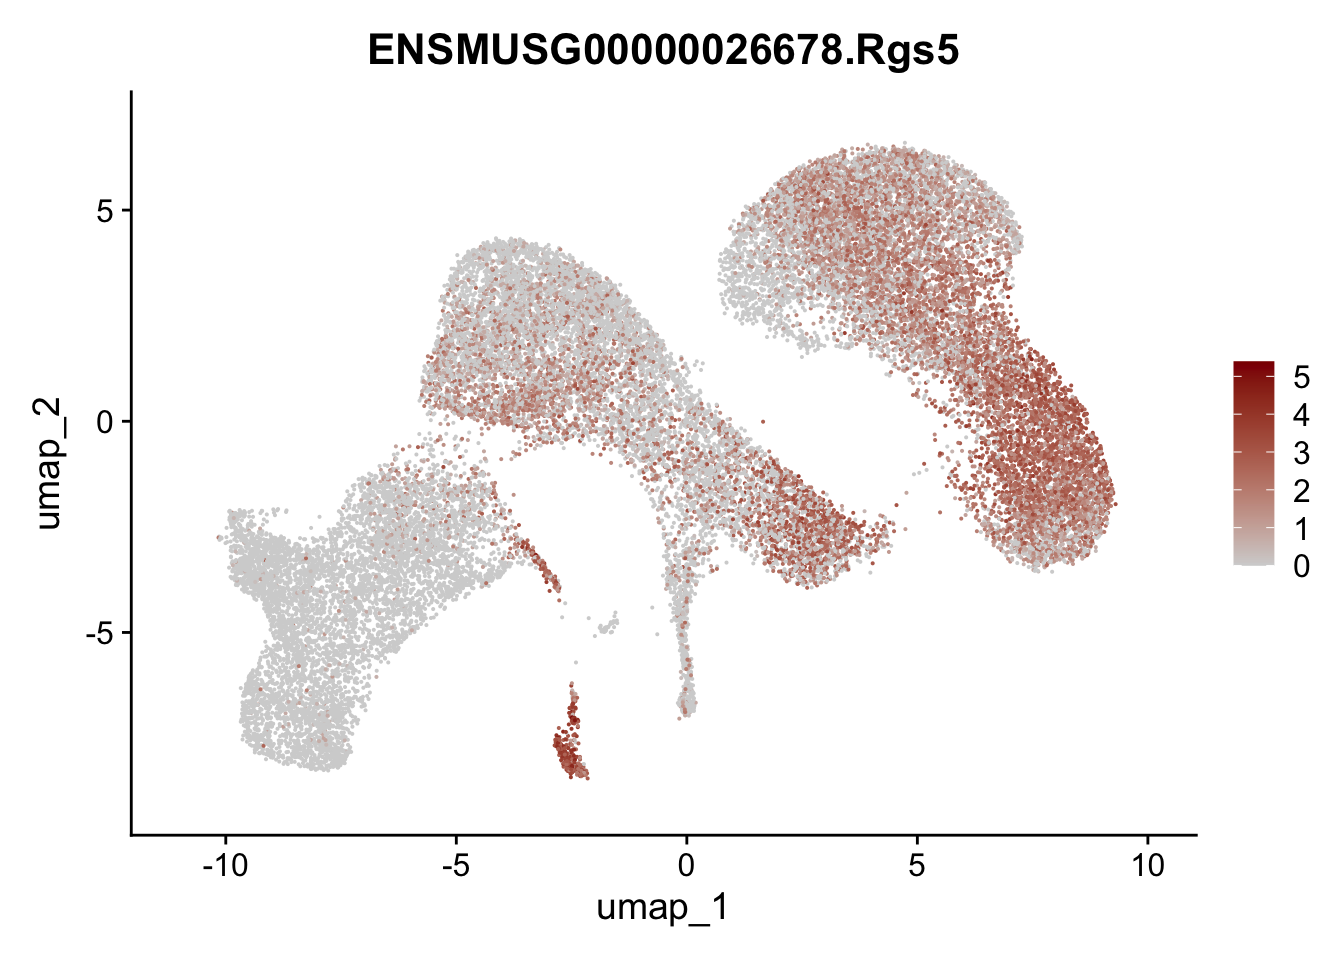
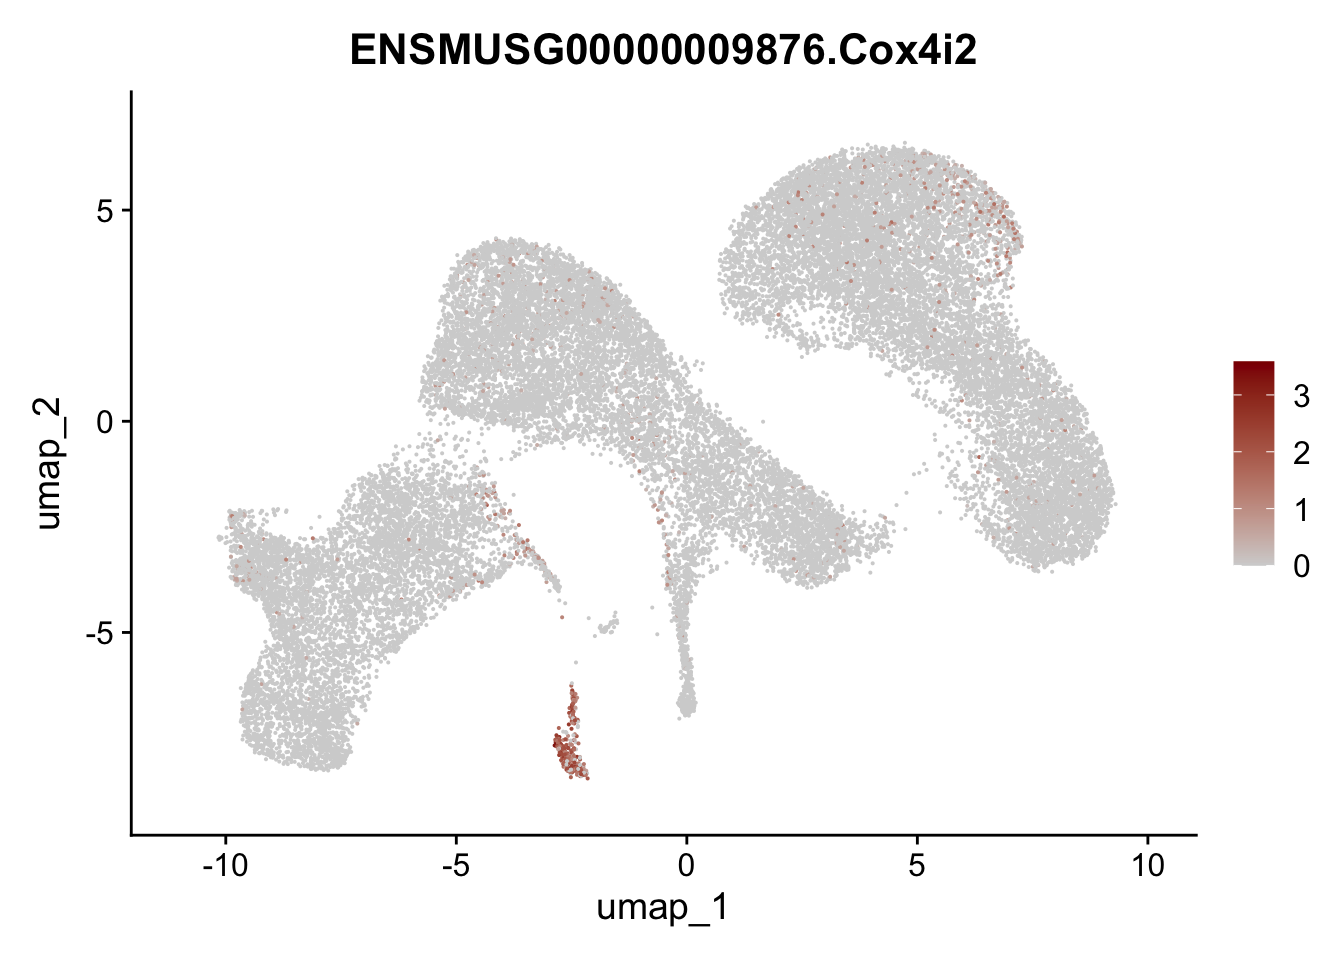
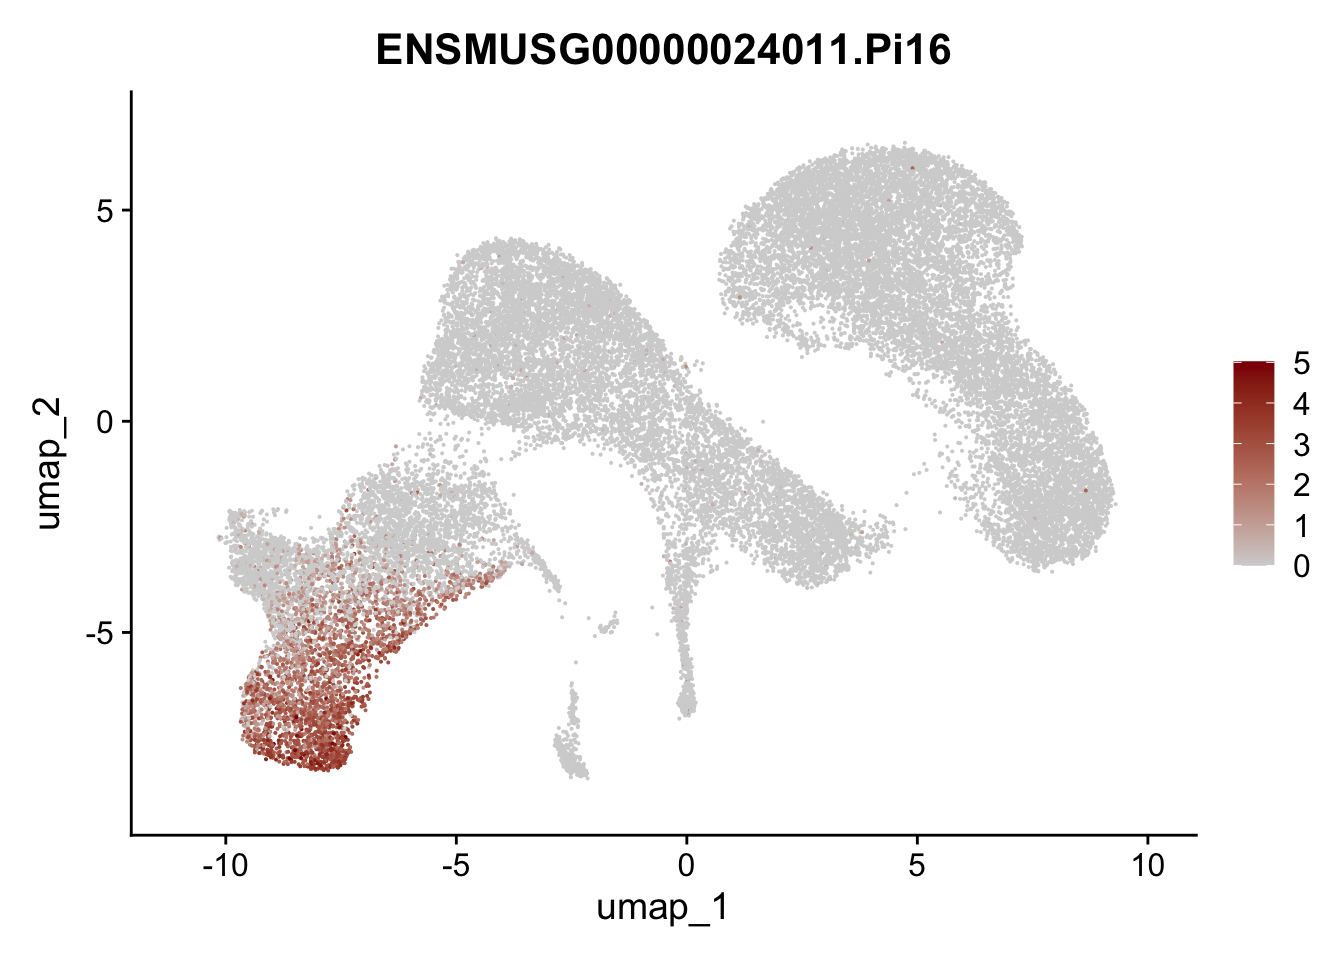
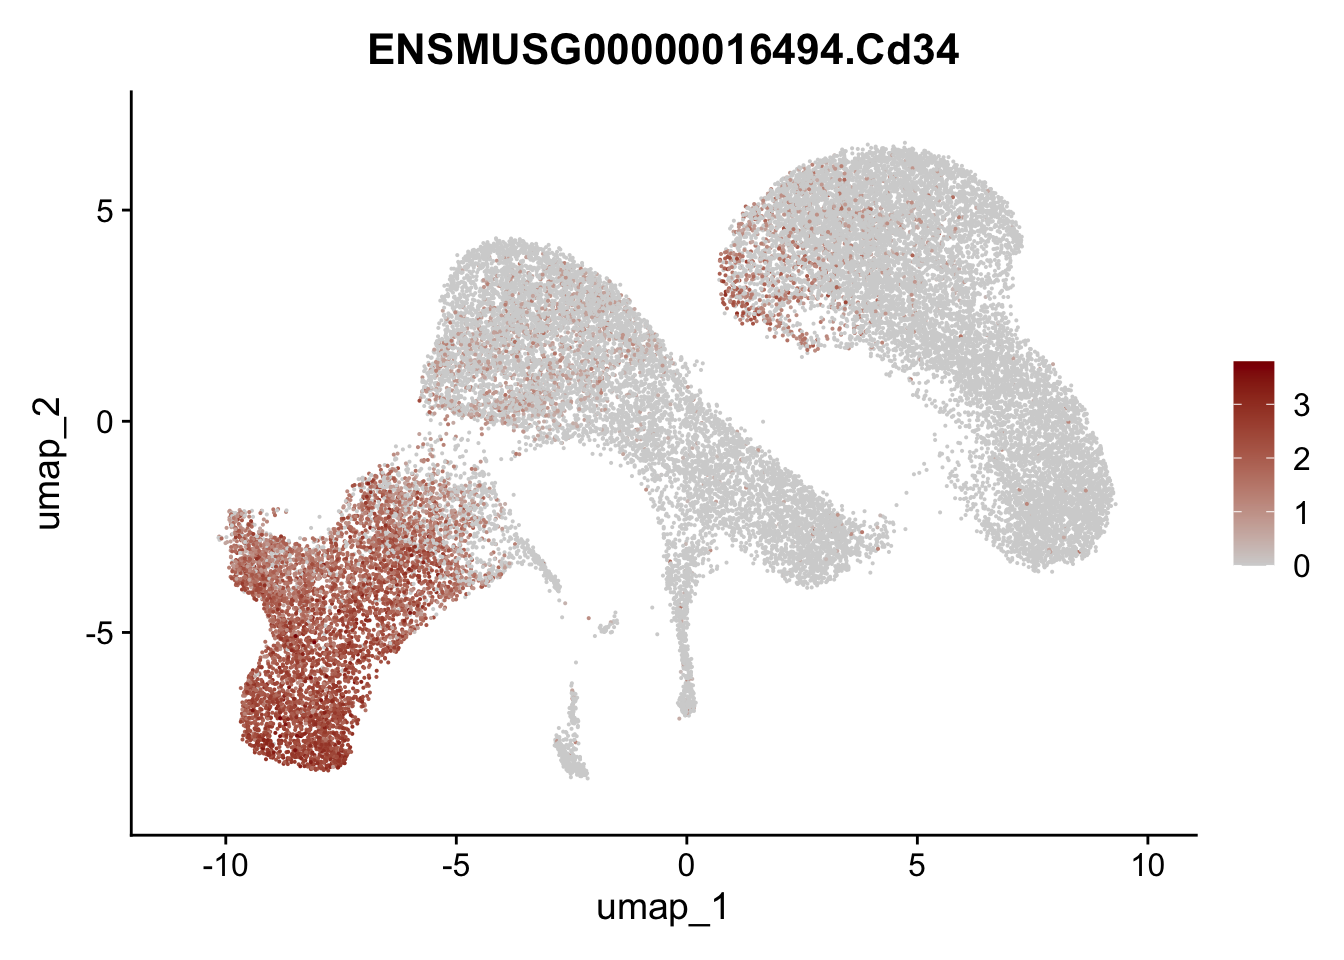
vis selected stroma marker
genes <- data.frame(gene=rownames(seurat)) %>%
    mutate(geneID=gsub("^.*\\.", "", gene))

selGenesAll <- data.frame(geneID=c("Rosa26eyfp", "Ccl19", "Ccl21a", "Des",
                                   "Icam1", "Vcam1", "Cnn1", "Acta2", "Rgs5",
                                   "Cox4i2", "Pi16", "Cd34")) %>%
  left_join(., genes, by = "geneID")

pList <- sapply(selGenesAll$gene, function(x){
p <- FeaturePlot(seurat, reduction = "umap",
            features = x,
            cols=c("lightgrey", "darkred"),
            order = F)+
  theme(legend.position="right")
  plot(p)
})


save seurat
saveRDS(seurat, file = paste0(basedir,
                              "/data/WT_adultOnly_bothLabeled",
                              "_seurat.rds"))
write.table(seurat_markers, quote=F, row.names = T, col.names = T, sep= "\t",
            file = paste0(basedir,
                          "/data/WT_adultOnly_bothLabeled_markerGenes.txt"))
session info
sessionInfo()R version 4.3.0 (2023-04-21)
Platform: x86_64-apple-darwin20 (64-bit)
Running under: macOS Ventura 13.4.1
Matrix products: default
BLAS: /Library/Frameworks/R.framework/Versions/4.3-x86_64/Resources/lib/libRblas.0.dylib
LAPACK: /Library/Frameworks/R.framework/Versions/4.3-x86_64/Resources/lib/libRlapack.dylib; LAPACK version 3.11.0
locale:
[1] en_US.UTF-8/en_US.UTF-8/en_US.UTF-8/C/en_US.UTF-8/en_US.UTF-8
time zone: Europe/Berlin
tzcode source: internal
attached base packages:
[1] stats4 stats graphics grDevices utils datasets methods
[8] base
other attached packages:
[1] ggsci_3.0.1 scran_1.28.2
[3] scater_1.28.0 scuttle_1.10.3
[5] pheatmap_1.0.12 RColorBrewer_1.1-3
[7] SingleCellExperiment_1.22.0 SummarizedExperiment_1.30.2
[9] Biobase_2.60.0 GenomicRanges_1.52.1
[11] GenomeInfoDb_1.36.4 IRanges_2.36.0
[13] S4Vectors_0.40.1 BiocGenerics_0.48.0
[15] MatrixGenerics_1.12.3 matrixStats_1.2.0
[17] runSeurat3_0.1.0 here_1.0.1
[19] magrittr_2.0.3 Seurat_5.0.2
[21] SeuratObject_5.0.1 sp_2.1-3
[23] lubridate_1.9.3 forcats_1.0.0
[25] stringr_1.5.1 dplyr_1.1.4
[27] purrr_1.0.2 readr_2.1.5
[29] tidyr_1.3.1 tibble_3.2.1
[31] ggplot2_3.5.0 tidyverse_2.0.0
loaded via a namespace (and not attached):
[1] RcppAnnoy_0.0.22 splines_4.3.0
[3] later_1.3.2 bitops_1.0-7
[5] polyclip_1.10-6 fastDummies_1.7.3
[7] lifecycle_1.0.4 edgeR_3.42.4
[9] rprojroot_2.0.4 globals_0.16.2
[11] lattice_0.22-5 MASS_7.3-60.0.1
[13] limma_3.56.2 plotly_4.10.4
[15] rmarkdown_2.26 yaml_2.3.8
[17] metapod_1.8.0 httpuv_1.6.14
[19] sctransform_0.4.1 spam_2.10-0
[21] spatstat.sparse_3.0-3 reticulate_1.35.0
[23] cowplot_1.1.3 pbapply_1.7-2
[25] abind_1.4-5 zlibbioc_1.46.0
[27] Rtsne_0.17 presto_1.0.0
[29] RCurl_1.98-1.14 GenomeInfoDbData_1.2.10
[31] ggrepel_0.9.5 irlba_2.3.5.1
[33] listenv_0.9.1 spatstat.utils_3.0-4
[35] goftest_1.2-3 RSpectra_0.16-1
[37] dqrng_0.3.2 spatstat.random_3.2-3
[39] fitdistrplus_1.1-11 parallelly_1.37.1
[41] DelayedMatrixStats_1.22.6 leiden_0.4.3.1
[43] codetools_0.2-19 DelayedArray_0.26.7
[45] tidyselect_1.2.0 farver_2.1.1
[47] viridis_0.6.5 ScaledMatrix_1.8.1
[49] spatstat.explore_3.2-6 jsonlite_1.8.8
[51] BiocNeighbors_1.18.0 ellipsis_0.3.2
[53] progressr_0.14.0 ggridges_0.5.6
[55] survival_3.5-8 tools_4.3.0
[57] ica_1.0-3 Rcpp_1.0.12
[59] glue_1.7.0 gridExtra_2.3
[61] xfun_0.42 withr_3.0.0
[63] fastmap_1.1.1 bluster_1.10.0
[65] fansi_1.0.6 digest_0.6.34
[67] rsvd_1.0.5 timechange_0.3.0
[69] R6_2.5.1 mime_0.12
[71] colorspace_2.1-0 scattermore_1.2
[73] tensor_1.5 spatstat.data_3.0-4
[75] utf8_1.2.4 generics_0.1.3
[77] data.table_1.15.2 httr_1.4.7
[79] htmlwidgets_1.6.4 S4Arrays_1.0.6
[81] uwot_0.1.16 pkgconfig_2.0.3
[83] gtable_0.3.4 lmtest_0.9-40
[85] XVector_0.40.0 htmltools_0.5.7
[87] dotCall64_1.1-1 scales_1.3.0
[89] png_0.1-8 knitr_1.45
[91] rstudioapi_0.15.0 tzdb_0.4.0
[93] reshape2_1.4.4 nlme_3.1-164
[95] zoo_1.8-12 KernSmooth_2.23-22
[97] vipor_0.4.7 parallel_4.3.0
[99] miniUI_0.1.1.1 pillar_1.9.0
[101] grid_4.3.0 vctrs_0.6.5
[103] RANN_2.6.1 promises_1.2.1
[105] BiocSingular_1.16.0 beachmat_2.16.0
[107] xtable_1.8-4 cluster_2.1.6
[109] beeswarm_0.4.0 evaluate_0.23
[111] locfit_1.5-9.9 cli_3.6.2
[113] compiler_4.3.0 rlang_1.1.3
[115] crayon_1.5.2 future.apply_1.11.1
[117] labeling_0.4.3 plyr_1.8.9
[119] ggbeeswarm_0.7.2 stringi_1.8.3
[121] viridisLite_0.4.2 deldir_2.0-4
[123] BiocParallel_1.34.2 munsell_0.5.0
[125] lazyeval_0.2.2 spatstat.geom_3.2-9
[127] Matrix_1.6-5 RcppHNSW_0.6.0
[129] hms_1.1.3 patchwork_1.2.0
[131] sparseMatrixStats_1.12.2 future_1.33.1
[133] statmod_1.5.0 shiny_1.8.0
[135] ROCR_1.0-11 igraph_2.0.2 date()[1] "Wed Apr 3 14:18:03 2024"