suppressPackageStartupMessages({
  library(tidyverse)
  library(Seurat)
  library(magrittr)
  library(dplyr)
  library(purrr)
  library(ggplot2)
  library(here)
  library(runSeurat3)
  library(SingleCellExperiment)
  library(RColorBrewer)
  library(pheatmap)
  library(scater)
  library(scran)
  library(ggsci)
})characterization adult mLN
load packages
heatmap function
avgHeatmap <- function(seurat, selGenes, colVecIdent, colVecCond=NULL,
                       ordVec=NULL, gapVecR=NULL, gapVecC=NULL,cc=FALSE,
                       cr=FALSE, condCol=FALSE){

  selGenes <- selGenes$gene

  ## assay data
  clusterAssigned <- as.data.frame(Idents(seurat)) %>%
  dplyr::mutate(cell=rownames(.))
  colnames(clusterAssigned)[1] <- "ident"
  seuratDat <- GetAssayData(seurat)

  ## genes of interest
  genes <- data.frame(gene=rownames(seurat)) %>%
    mutate(geneID=gsub("^.*\\.", "", gene)) %>% filter(geneID %in% selGenes)

  ## matrix with averaged cnts per ident
  logNormExpres <- as.data.frame(t(as.matrix(
    seuratDat[which(rownames(seuratDat) %in% genes$gene),])))
  logNormExpres <- logNormExpres %>% dplyr::mutate(cell=rownames(.)) %>%
    dplyr::left_join(.,clusterAssigned, by=c("cell")) %>%
    dplyr::select(-cell) %>% dplyr::group_by(ident) %>%
    dplyr::summarise_all(mean)
  logNormExpresMa <- logNormExpres %>% dplyr::select(-ident) %>% as.matrix()
  rownames(logNormExpresMa) <- logNormExpres$ident
  logNormExpresMa <- t(logNormExpresMa)
  rownames(logNormExpresMa) <- gsub("^.*?\\.","",rownames(logNormExpresMa))

  ## remove genes if they are all the same in all groups
  ind <- apply(logNormExpresMa, 1, sd) == 0
  logNormExpresMa <- logNormExpresMa[!ind,]
  genes <- genes[!ind,]

  ## color columns according to cluster
  annotation_col <- as.data.frame(gsub("(^.*?_)","",
                                       colnames(logNormExpresMa)))%>%
    dplyr::mutate(celltype=gsub("(_.*$)","",colnames(logNormExpresMa)))
  colnames(annotation_col)[1] <- "col1"
  annotation_col <- annotation_col %>%
    dplyr::mutate(cond = gsub(".*_","",col1)) %>%
    dplyr::select(cond, celltype)
  rownames(annotation_col) <- colnames(logNormExpresMa)

  ann_colors = list(
      cond = colVecCond,
      celltype=colVecIdent)
  if(is.null(ann_colors$cond)){
    annotation_col$cond <- NULL
  }

  ## adjust order
  logNormExpresMa <- logNormExpresMa[selGenes,]
  if(is.null(ordVec)){
    ordVec <- levels(seurat)
  }
  logNormExpresMa <- logNormExpresMa[,ordVec]

  ## scaled row-wise
  pheatmap(logNormExpresMa, scale="row" ,treeheight_row = 0, cluster_rows = cr,
         cluster_cols = cc,
         color = colorRampPalette(c("#2166AC", "#F7F7F7", "#B2182B"))(50),
         annotation_col = annotation_col, cellwidth=15, cellheight=10,
         annotation_colors = ann_colors, gaps_row = gapVecR, gaps_col = gapVecC)
}
set dir and load sample
basedir <- here()
seurat <- readRDS(paste0(basedir,
                              "/data/WT_adultOnly_bothLabeled_integrated_",
                              "_seurat.rds"))

colLoc <- c("#61baba", "#ba6161")
names(colLoc) <- unique(seurat$location)

colAge <- c("#440154FF", "#3B528BFF", "#21908CFF", "#5DC863FF", "#FDE725FF")
names(colAge) <- c("E18" , "P7", "3w", "8w","E17to7wk")

colPal <- c("#DAF7A6", "#FFC300", "#FF5733", "#C70039", "#900C3F", "#b66e8d",
            "#61a4ba", "#6178ba", "#54a87f", "#25328a",
            "#b6856e", "#0073C2FF", "#EFC000FF", "#868686FF", "#CD534CFF",
            "#7AA6DCFF", "#003C67FF", "#8F7700FF", "#3B3B3BFF", "#A73030FF",
            "#4A6990FF")[1:length(unique(seurat$intCluster))]
names(colPal) <- unique(seurat$intCluster)

colLab <- c("#42a071", "#900C3F","#b66e8d", "#61a4ba", "#424671", "#b1b8fa",
            "#e3953d", "#714542", "#b6856e")

names(colLab) <- c("FDC/MRC", "TRC", "TBRC", "MedRC/IFRC", "MedRC" , "actMedRC",
                   "PRC", "Pi16+RC", "VSMC")

colCond <- c("#446a7f", "#cb7457")
names(colCond) <- c("LTbR", "WT")

colDat <- colDat <- c(pal_npg()(10),pal_futurama()(12), pal_aaas()(10),
                      pal_jama()(8))[1:length(unique(seurat$dataset))]
names(colDat) <- unique(seurat$dataset)
DimPlot all
clustering
DimPlot(seurat, reduction = "umap", group.by = "intCluster",
        cols = colPal, raster = F, shuffle = T)+
  theme_bw() +
  theme(axis.text = element_blank(), axis.ticks = element_blank(),
        panel.grid.minor = element_blank()) +
  xlab("UMAP1") +
  ylab("UMAP2")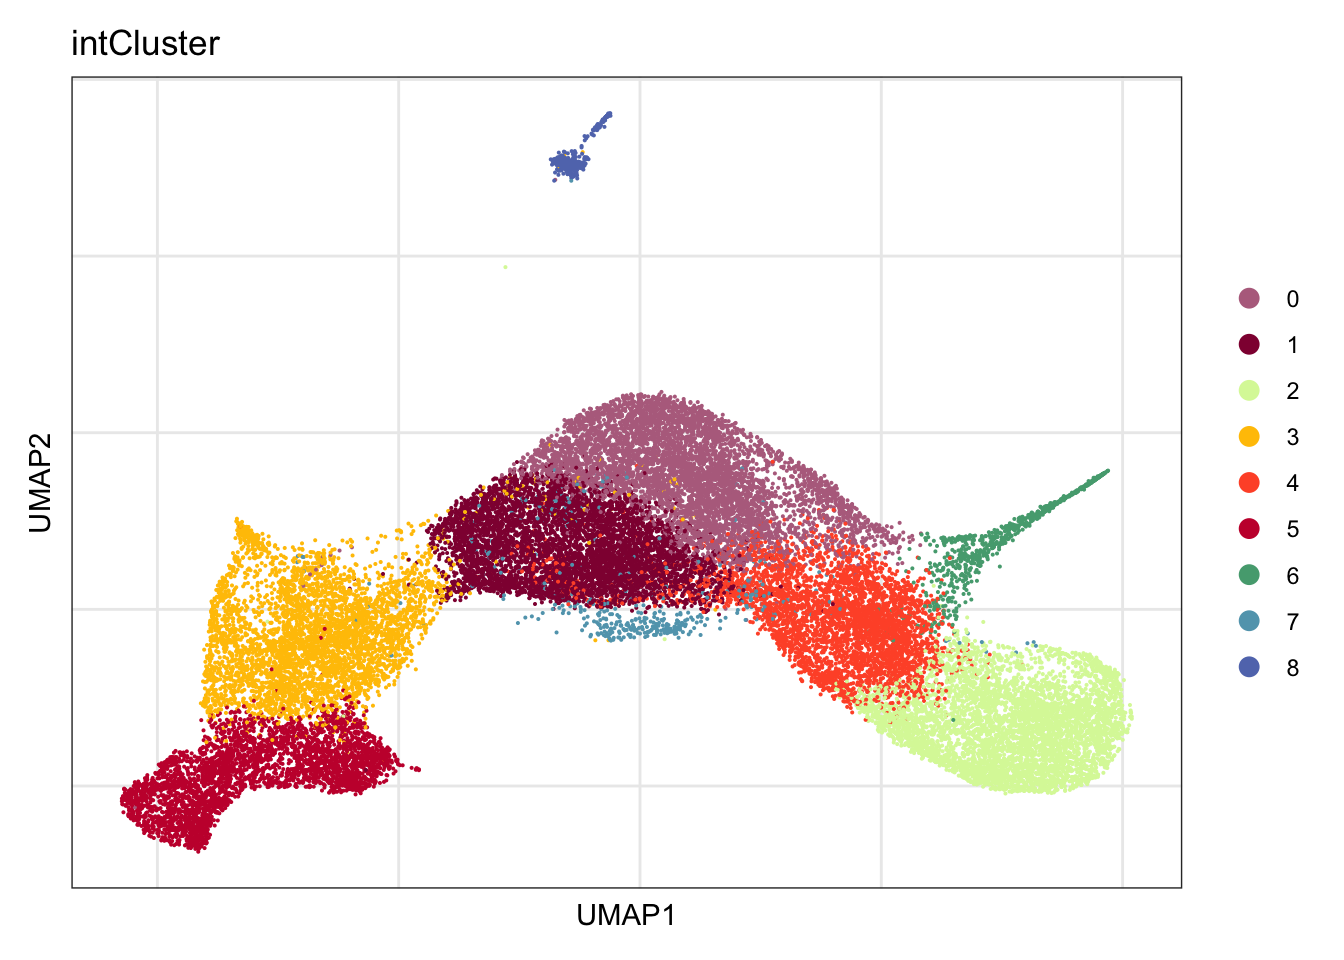
label
DimPlot(seurat, reduction = "umap", group.by = "label",
        cols = colLab, raster = F, shuffle = T)+
  theme_bw() +
  theme(axis.text = element_blank(), axis.ticks = element_blank(),
        panel.grid.minor = element_blank()) +
  xlab("UMAP1") +
  ylab("UMAP2")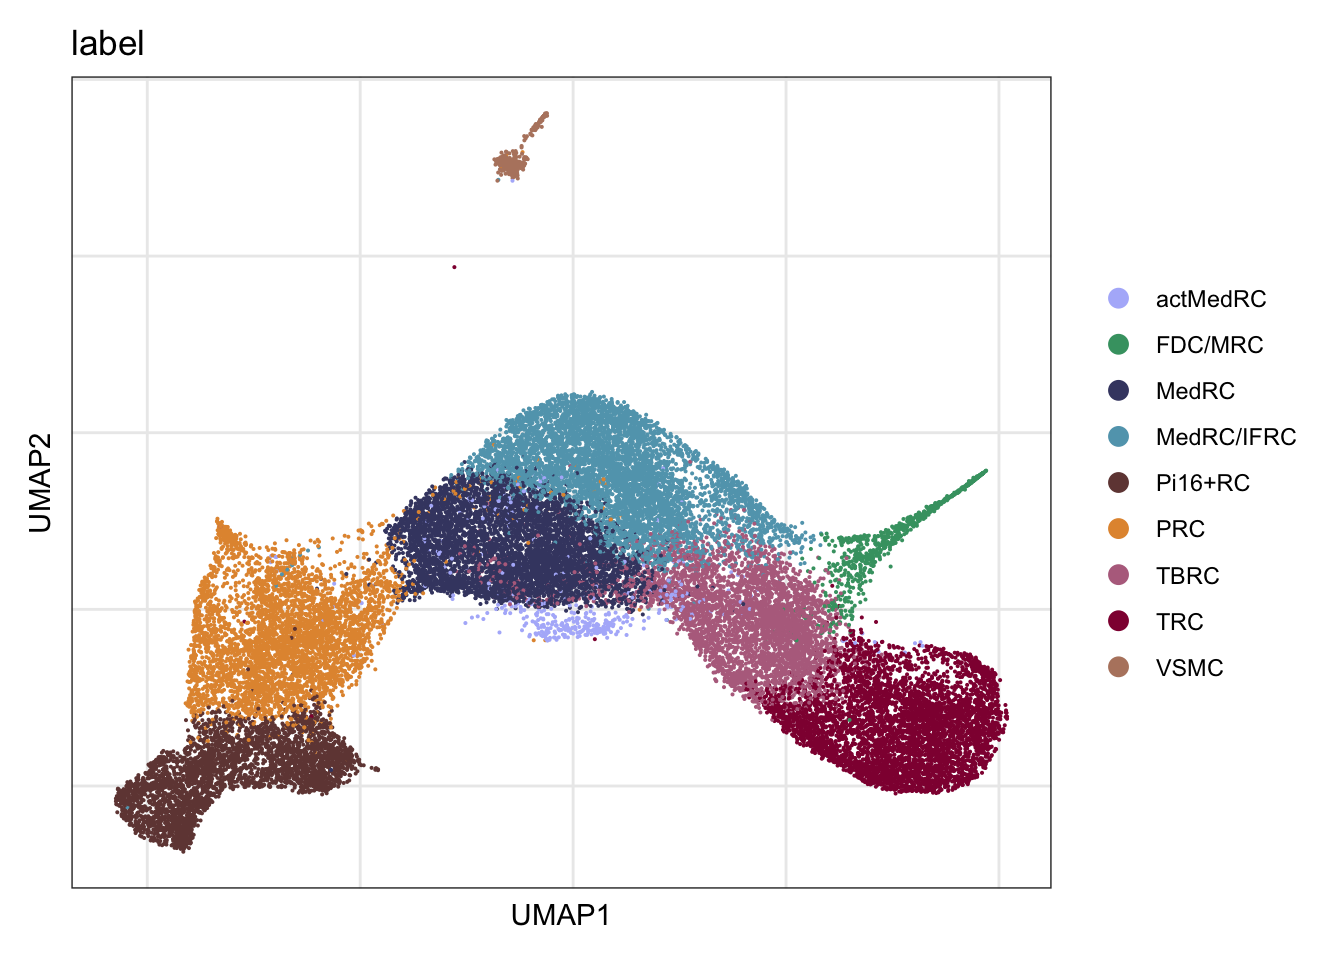
DimPlot(seurat, reduction = "umap", group.by = "label", pt.size=1,
        cols = colLab, shuffle = T)+
  theme_void()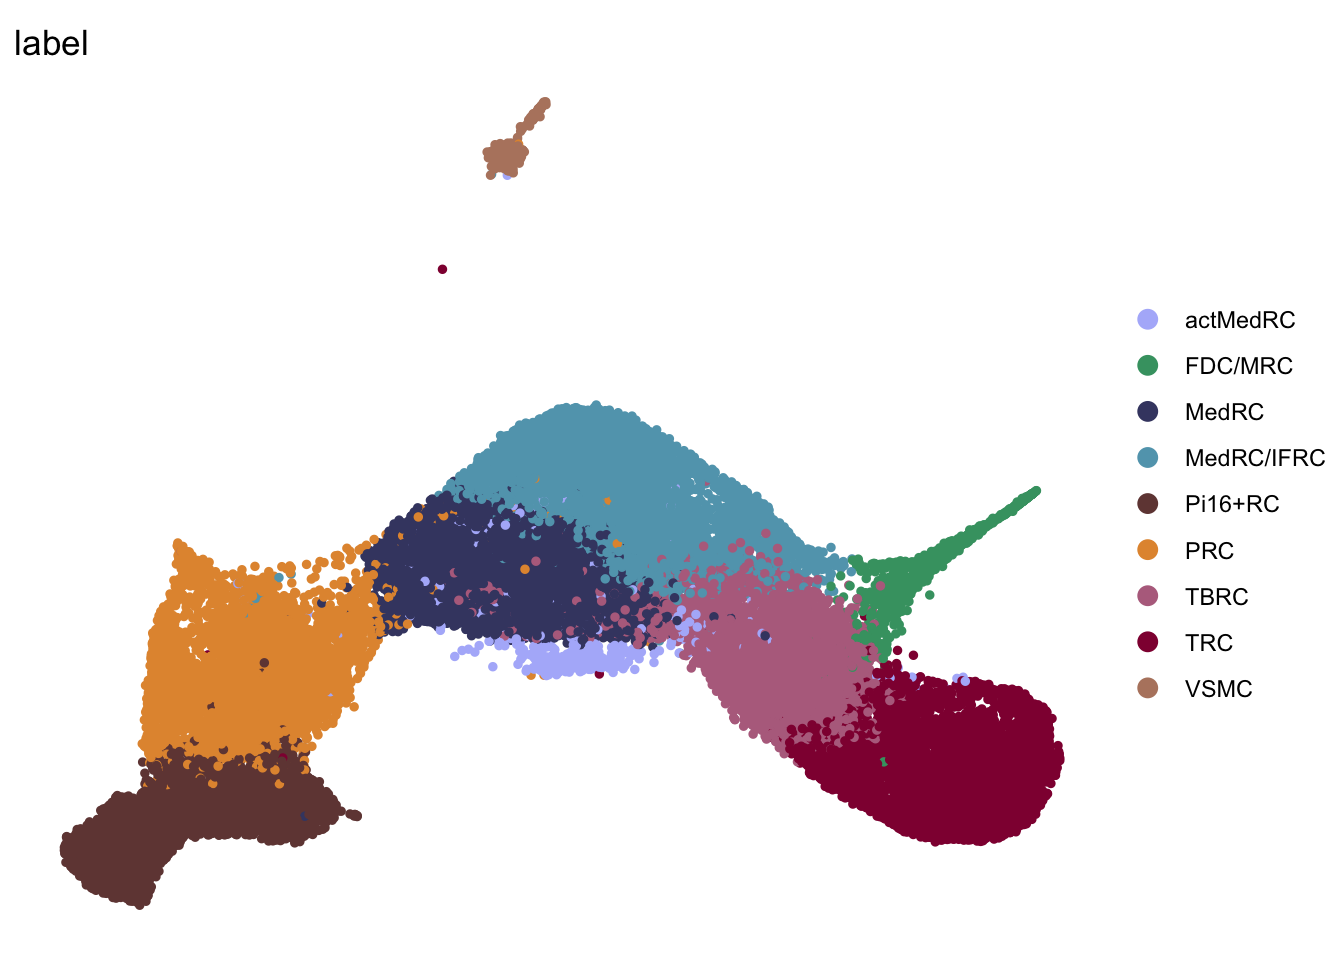
label split by location
DimPlot(seurat, reduction = "umap", group.by = "label", cols = colLab,
        split.by = "location")+
  theme_bw() +
  theme(axis.text = element_blank(), axis.ticks = element_blank(),
        panel.grid.minor = element_blank()) +
  xlab("UMAP1") +
  ylab("UMAP2")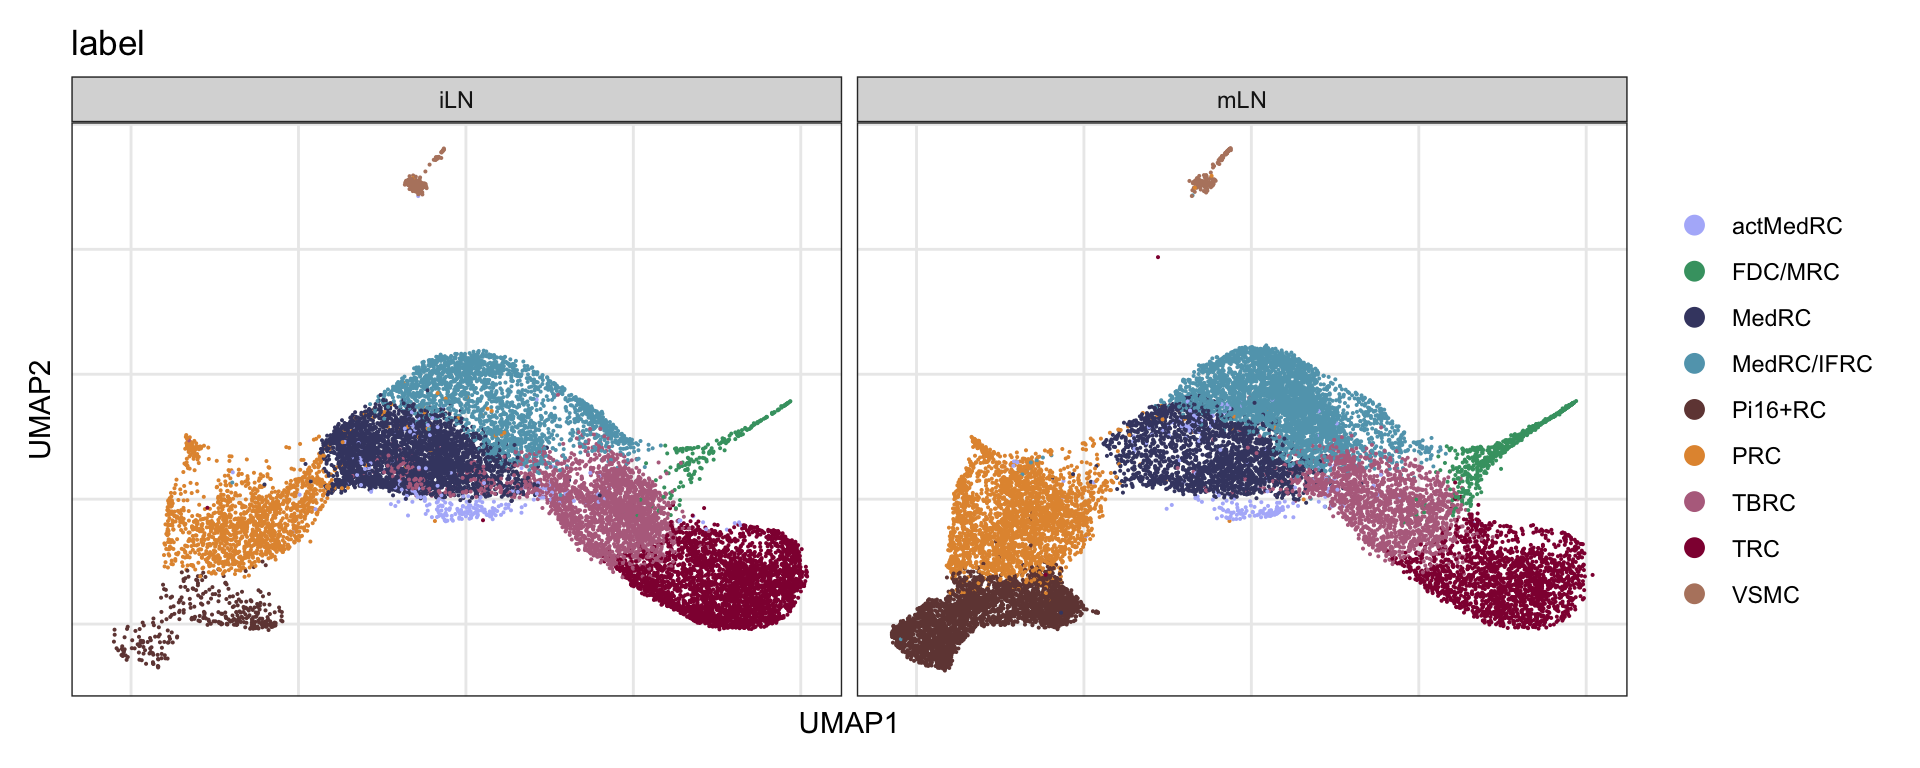
DimPlot(seurat, reduction = "umap", group.by = "label", pt.size=1,
        cols = colLab, split.by = "location", shuffle = T)+
  theme_void()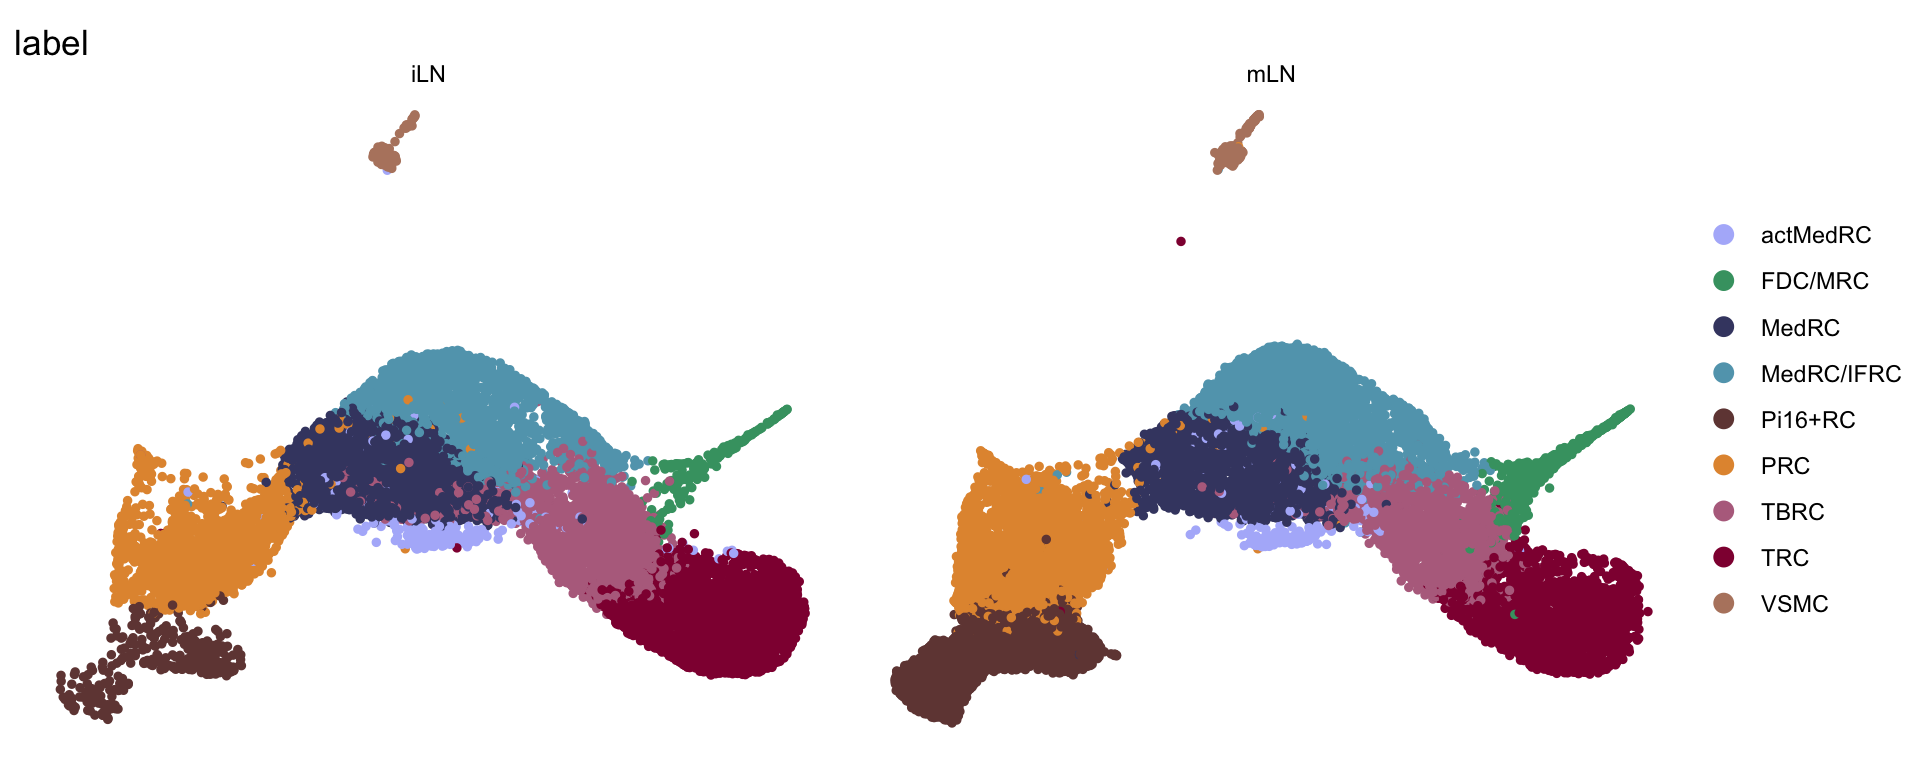
timepoint
DimPlot(seurat, reduction = "umap", group.by = "age", cols = colAge,
        raster = F, shuffle = T)+
  theme_bw() +
  theme(axis.text = element_blank(), axis.ticks = element_blank(),
        panel.grid.minor = element_blank()) +
  xlab("UMAP1") +
  ylab("UMAP2")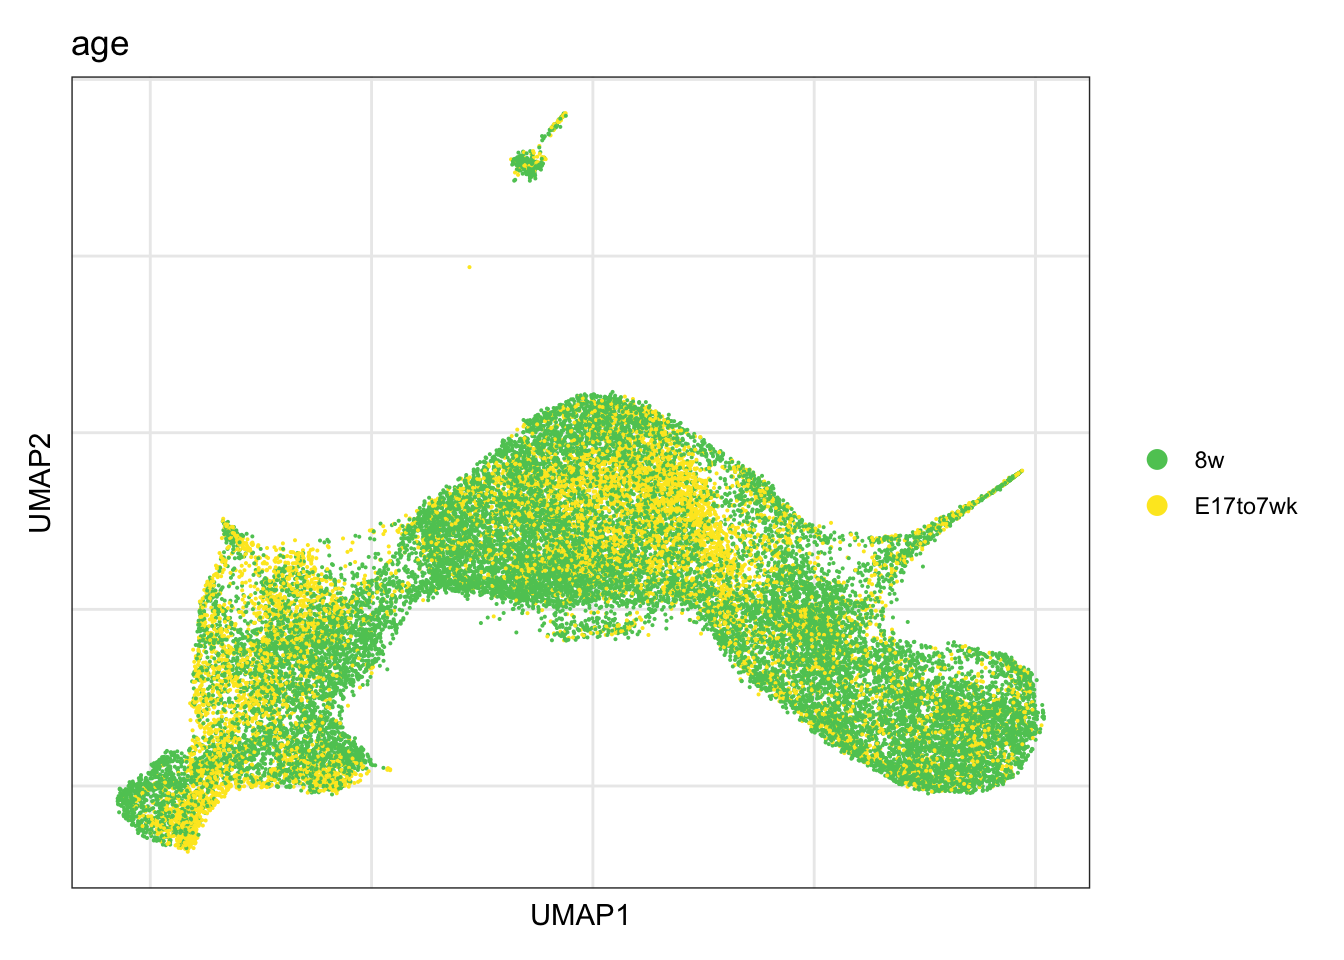
location
DimPlot(seurat, reduction = "umap", group.by = "location", cols = colLoc,
        raster = F, shuffle = T)+
  theme_bw() +
  theme(axis.text = element_blank(), axis.ticks = element_blank(),
        panel.grid.minor = element_blank()) +
  xlab("UMAP1") +
  ylab("UMAP2")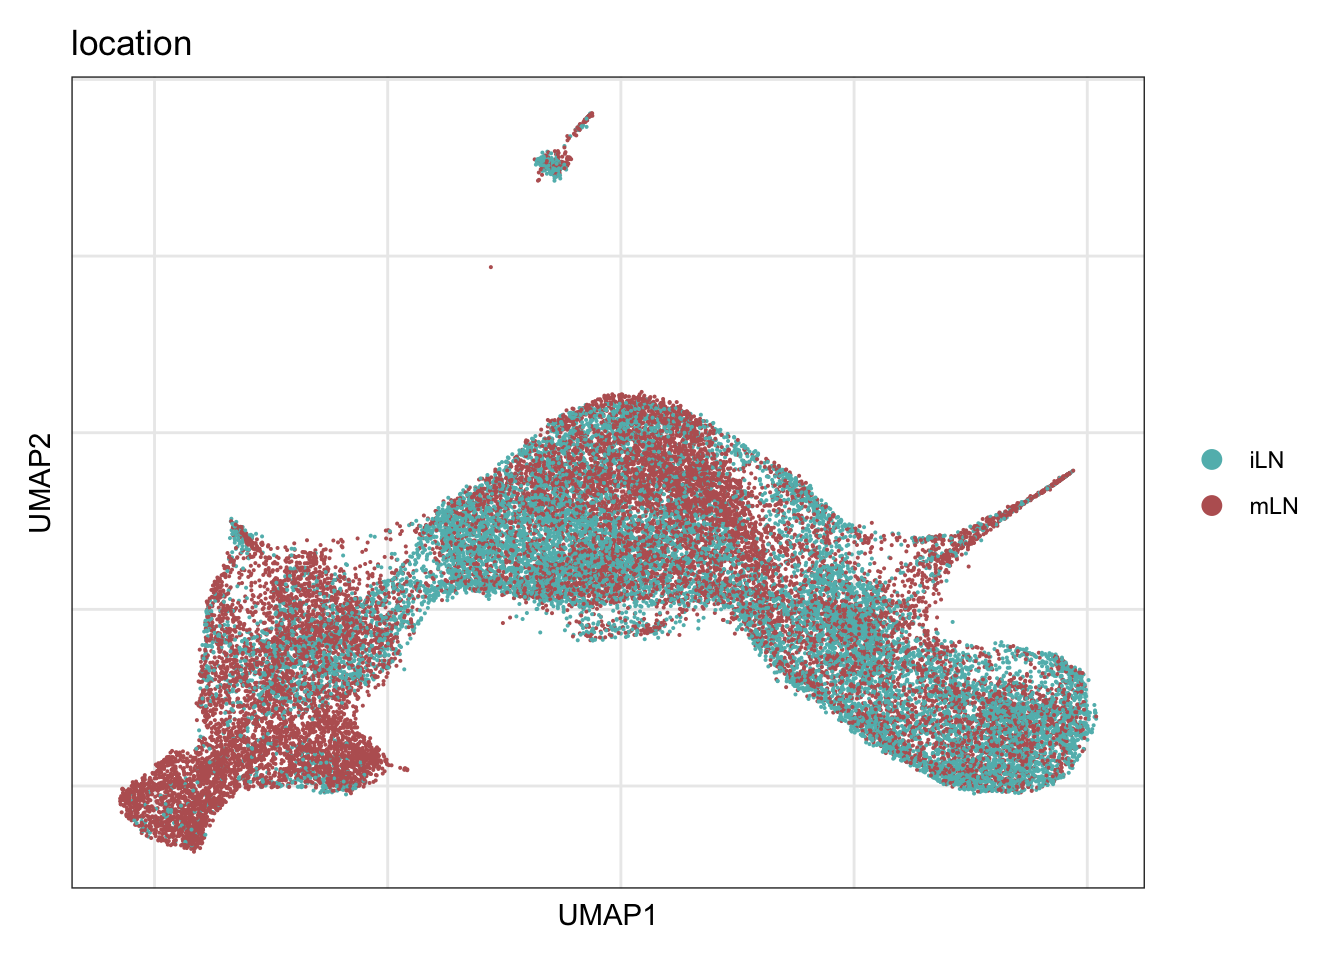
cond
DimPlot(seurat, reduction = "umap", group.by = "cond", cols = colCond,
        raster = F, shuffle = T)+
  theme_bw() +
  theme(axis.text = element_blank(), axis.ticks = element_blank(),
        panel.grid.minor = element_blank()) +
  xlab("UMAP1") +
  ylab("UMAP2")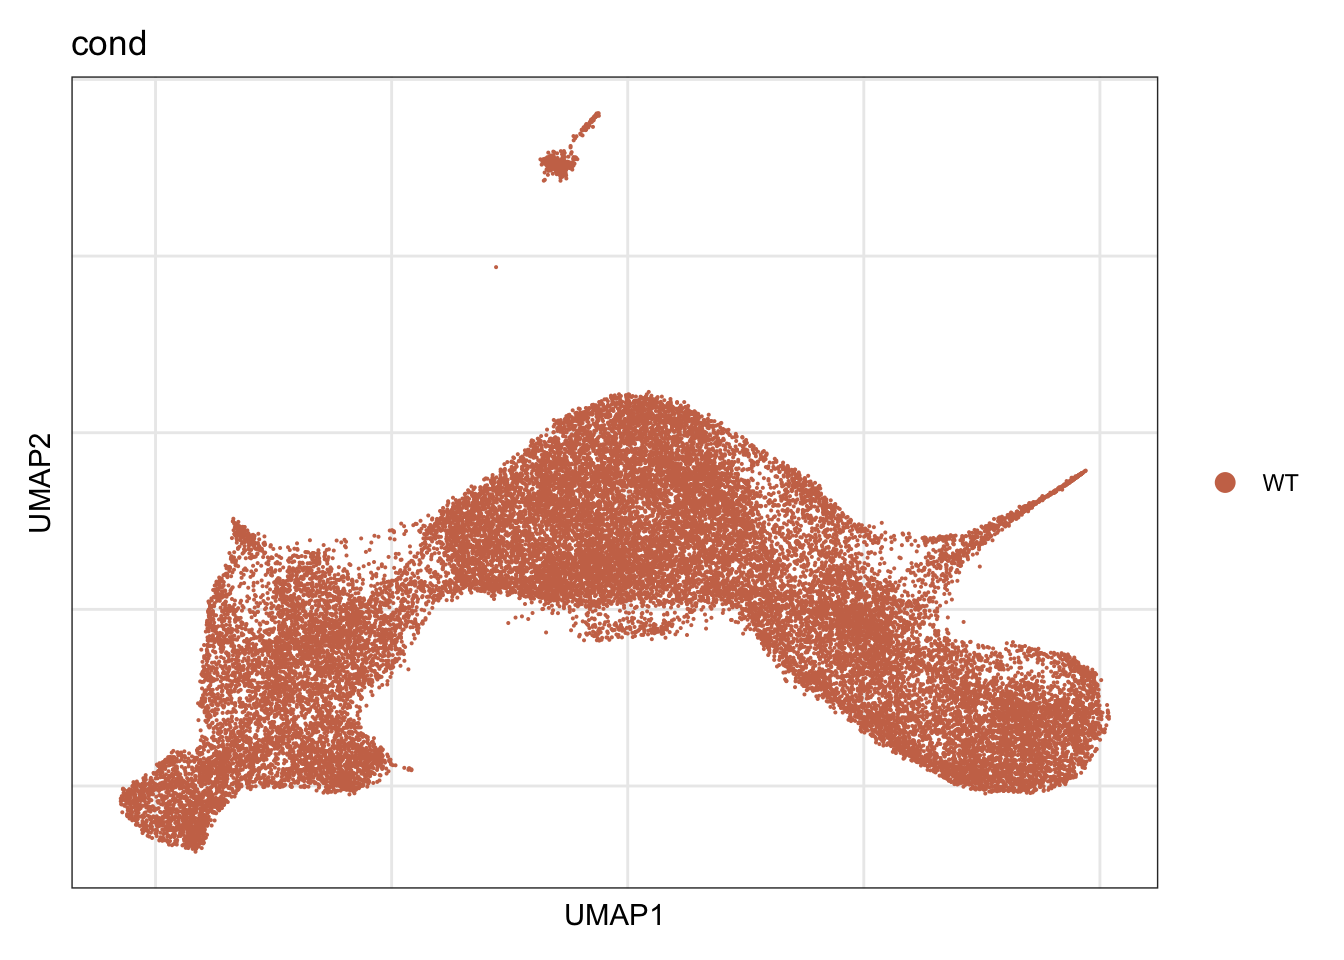
counts
knitr::kable(table(seurat$label, seurat$location))| iLN | mLN | |
|---|---|---|
| actMedRC | 256 | 223 |
| FDC/MRC | 177 | 610 |
| MedRC | 3363 | 2083 |
| MedRC/IFRC | 2044 | 3612 |
| Pi16+RC | 342 | 3269 |
| PRC | 1517 | 2771 |
| TBRC | 2415 | 1657 |
| TRC | 3157 | 1842 |
| VSMC | 174 | 161 |
knitr::kable(table(seurat$location))| Var1 | Freq |
|---|---|
| iLN | 13445 |
| mLN | 16228 |
knitr::kable(table( seurat$label, seurat$EYFP))| neg | pos | |
|---|---|---|
| actMedRC | 207 | 272 |
| FDC/MRC | 302 | 485 |
| MedRC | 2543 | 2903 |
| MedRC/IFRC | 2844 | 2812 |
| Pi16+RC | 3449 | 162 |
| PRC | 3091 | 1197 |
| TBRC | 1613 | 2459 |
| TRC | 1513 | 3486 |
| VSMC | 203 | 132 |
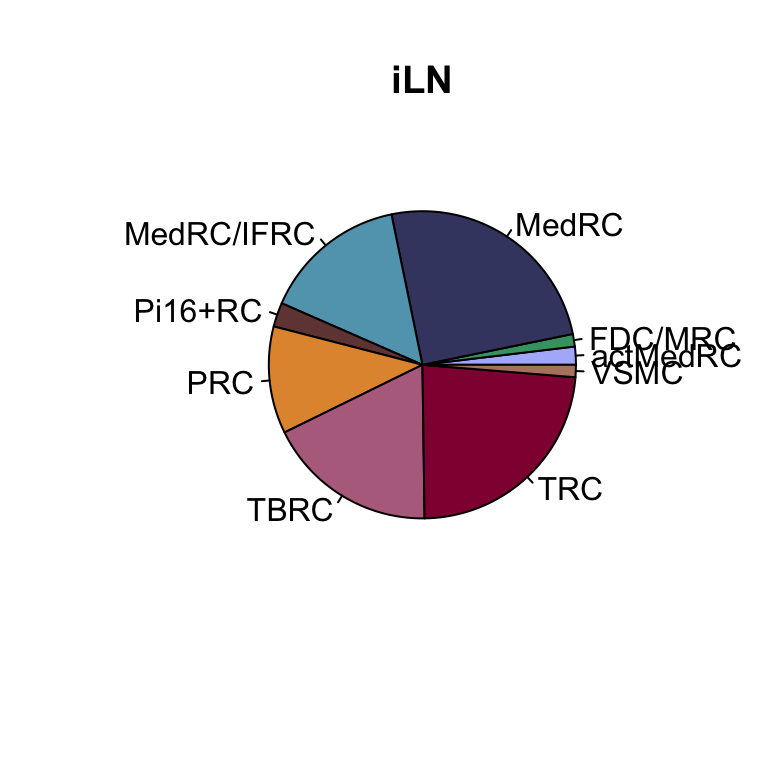
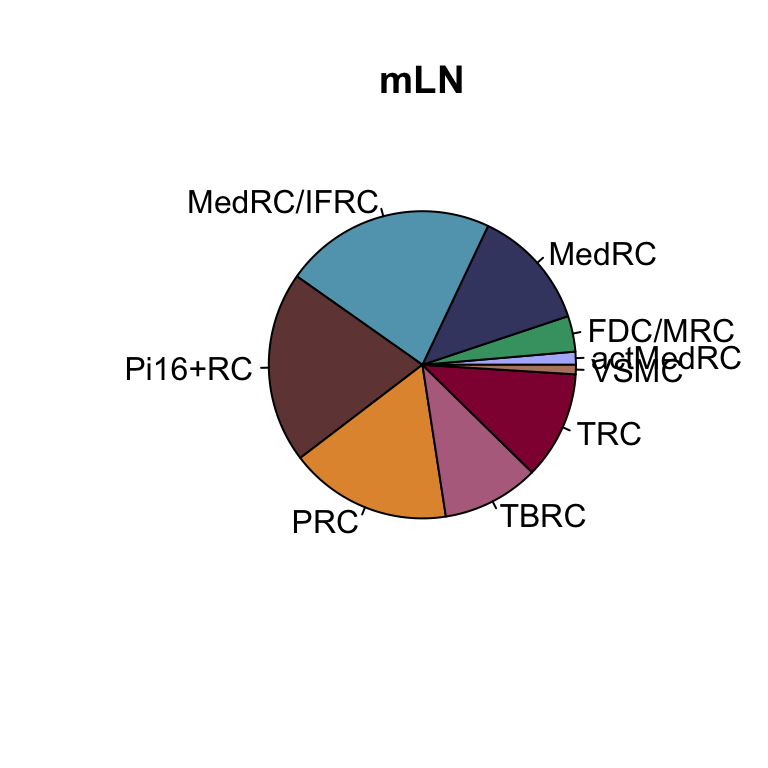
## relative abundance per cond
clustCond <- data.frame(table(seurat$location, seurat$label))
colnames(clustCond) <- c("cond", "intCluster", "cnt")
condTot <- data.frame(table(seurat$location))
colnames(condTot) <- c("cond", "tot")
colPaldat <- data.frame(col=colLab) %>%
  rownames_to_column(var = "intCluster")
clustDat2 <- clustCond %>%  left_join(., condTot, by = "cond") %>%
  mutate(relAb = cnt/tot * 100) %>%
  left_join(., colPaldat, by = "intCluster")

knitr::kable(clustDat2)| cond | intCluster | cnt | tot | relAb | col |
|---|---|---|---|---|---|
| iLN | actMedRC | 256 | 13445 | 1.9040536 | #b1b8fa |
| mLN | actMedRC | 223 | 16228 | 1.3741681 | #b1b8fa |
| iLN | FDC/MRC | 177 | 13445 | 1.3164745 | #42a071 |
| mLN | FDC/MRC | 610 | 16228 | 3.7589352 | #42a071 |
| iLN | MedRC | 3363 | 13445 | 25.0130160 | #424671 |
| mLN | MedRC | 2083 | 16228 | 12.8358393 | #424671 |
| iLN | MedRC/IFRC | 2044 | 13445 | 15.2026776 | #61a4ba |
| mLN | MedRC/IFRC | 3612 | 16228 | 22.2578260 | #61a4ba |
| iLN | Pi16+RC | 342 | 13445 | 2.5436965 | #714542 |
| mLN | Pi16+RC | 3269 | 16228 | 20.1441952 | #714542 |
| iLN | PRC | 1517 | 13445 | 11.2830048 | #e3953d |
| mLN | PRC | 2771 | 16228 | 17.0754252 | #e3953d |
| iLN | TBRC | 2415 | 13445 | 17.9620677 | #b66e8d |
| mLN | TBRC | 1657 | 16228 | 10.2107469 | #b66e8d |
| iLN | TRC | 3157 | 13445 | 23.4808479 | #900C3F |
| mLN | TRC | 1842 | 16228 | 11.3507518 | #900C3F |
| iLN | VSMC | 174 | 13445 | 1.2941614 | #b6856e |
| mLN | VSMC | 161 | 16228 | 0.9921124 | #b6856e |
lapply(names(colLoc), function(co){
  clustDat2sel <- clustDat2 %>% filter(cond==co)
  pie(clustDat2sel$relAb,
      labels = clustDat2sel$intCluster,
      col = clustDat2sel$col,
      main = paste0(co))
})
[[1]]
NULL

[[2]]
NULL
fraction EYFP+ cells
Barplot
## across all
eyfpCnt <- data.frame(table(seurat$label, seurat$EYFP)) %>%
  spread(.,Var2 , Freq) %>% mutate(tot=pos+neg) %>%
  mutate(freqPos=pos*100/tot) %>% mutate(freqNeg=neg*100/tot)

eyfpCntDat <- eyfpCnt %>% select(Var1, freqPos, freqNeg) %>%
  gather(., eyfp, freq, freqPos:freqNeg)

p <- ggpubr::ggbarplot(eyfpCntDat, x="Var1", y="freq", fill="eyfp",
                  palette = c("#9d9f9e","#09983f"),
                  order = rev(names(colLab)),
                  xlab = "", ylab = "Frequency",
                  orientation = "horizontal") +
  theme(legend.position = "right")
p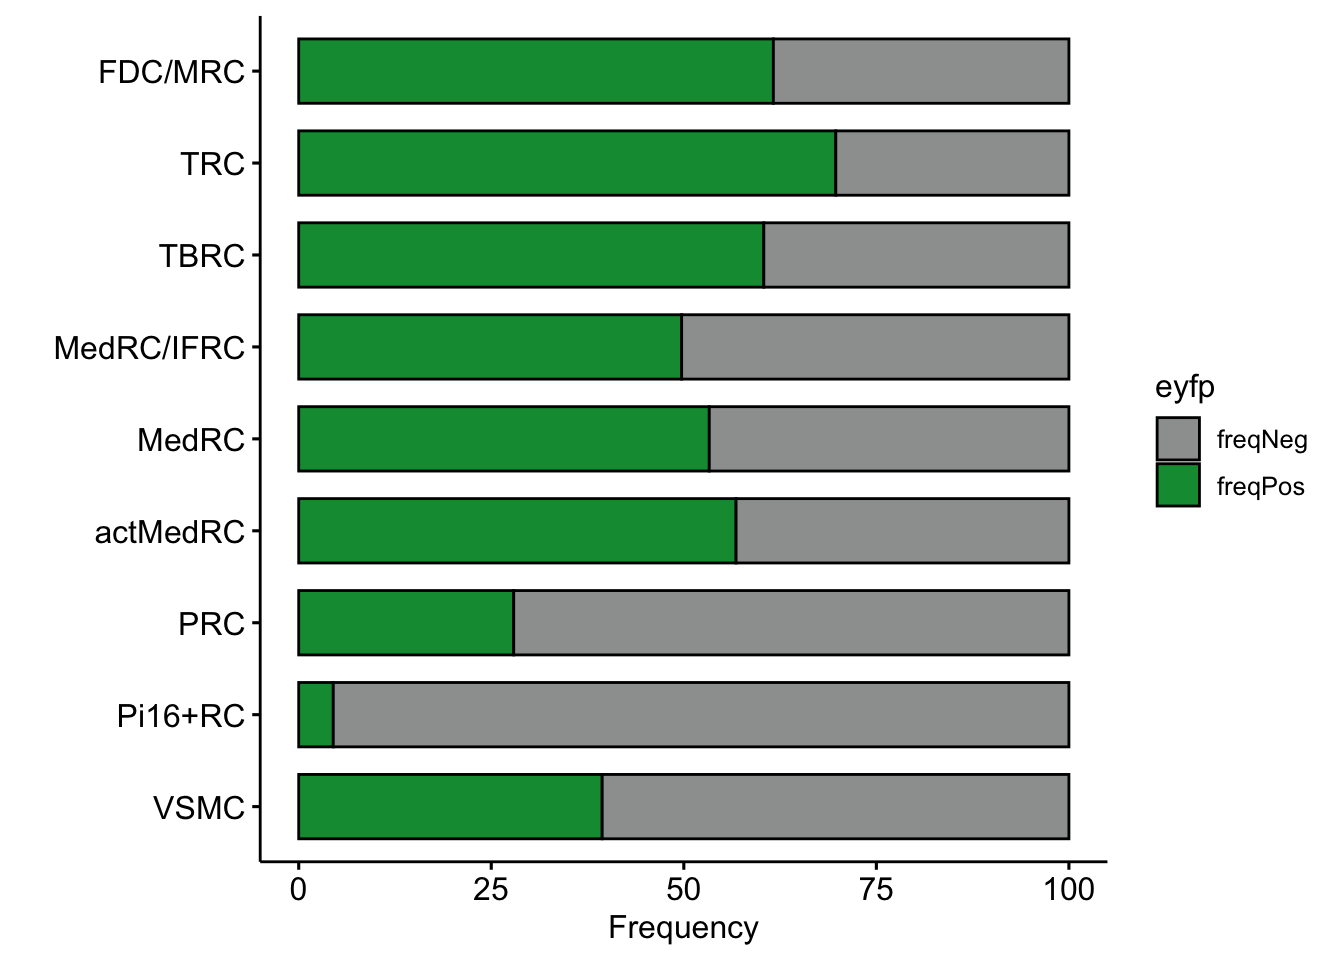
## individual LNs
LNvec <- unique(seurat$location)

lapply(LNvec, function(ln){
  seuratSub <- subset(seurat, location== ln)
  eyfpCnt <- data.frame(table(seuratSub$label, seuratSub$EYFP)) %>%
  spread(.,Var2 , Freq) %>% mutate(tot=pos+neg) %>%
  mutate(freqPos=pos*100/tot) %>% mutate(freqNeg=neg*100/tot)

  eyfpCntDat <- eyfpCnt %>% select(Var1, freqPos, freqNeg) %>%
    gather(., eyfp, freq, freqPos:freqNeg)

  p <- ggpubr::ggbarplot(eyfpCntDat, x="Var1", y="freq", fill="eyfp",
                  palette = c("#9d9f9e","#09983f"),
                  order = rev(names(colLab)),
                  xlab = "", ylab = "Frequency",
                  orientation = "horizontal") +
    theme(legend.position = "right") +
    ggtitle(paste0("Fraction EYFP+ cells - ", ln))
  p

})
[[1]]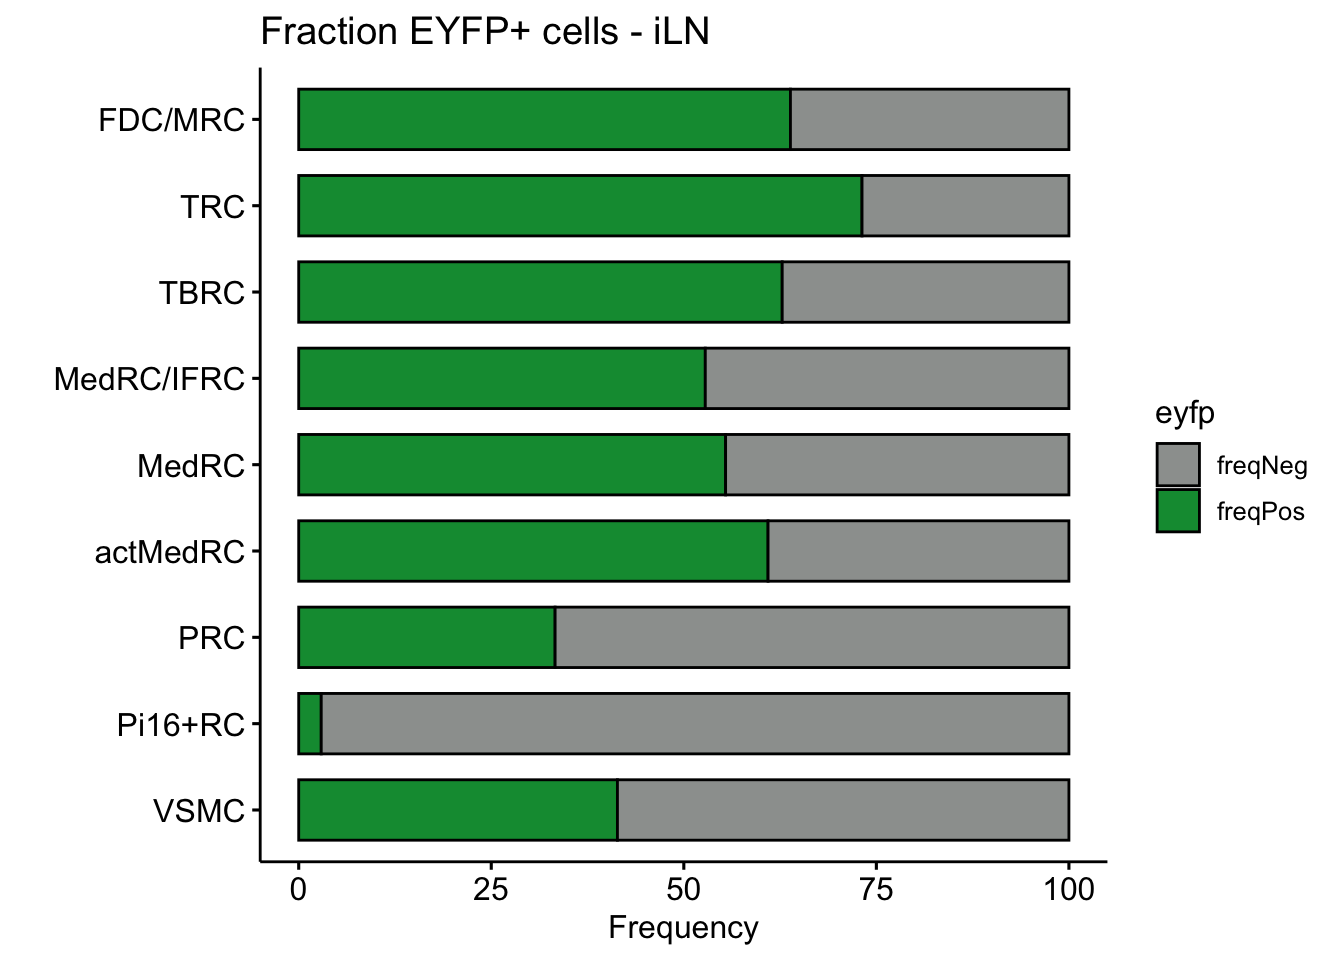
[[2]]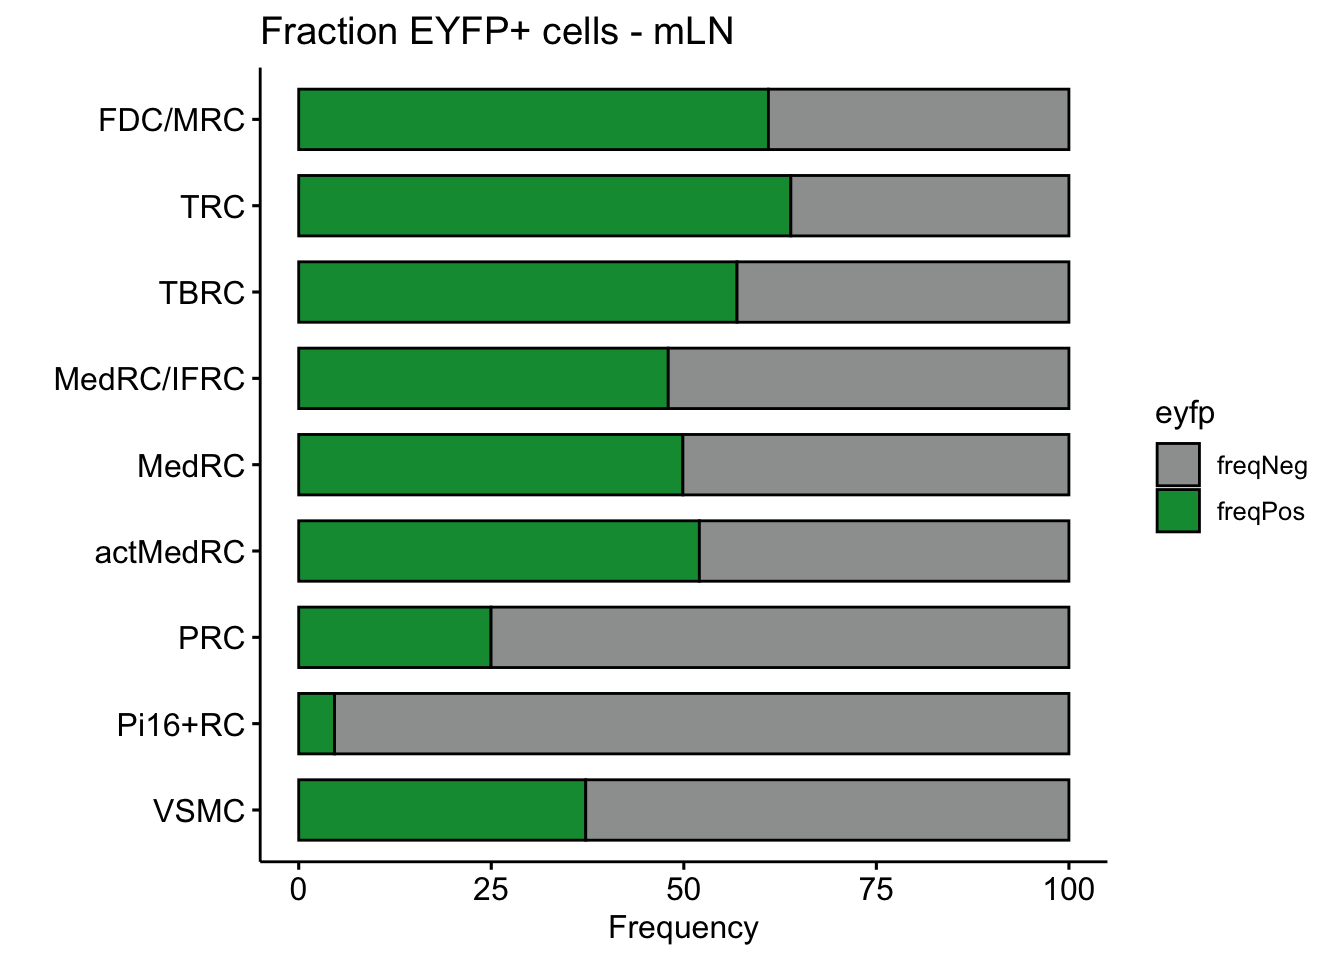
vis FRC marker
avg Heatmap
seurat_markers <- data.frame(gene=c("Fcgr2b","Fcer2a","Cr2","Cxcl13",
                                    "Slc7a11", "Ccl19",
                                    "Ccl21a", "Fmod", "Grem1", "Bmp4",
                                    "Tnfsf11", "Fbn2",
                                    "Pltp" ,"C1rb", "Lepr", "Ptn",
                                     "Nr4a1", "Cxcl10", "Cxcl9",
                                    "F3", "Fbln1", "Gdf10", "Adamtsl1",
                                    "Col15a1",  "Cd34",
                                    "Igfbp6", "Pi16", "Thy1", "Dpp4", "Sema3c",
                                    "Acta2", "Myh11", "Mcam", "Itga7", "Esam", "Rgs4"
                                    ))

genes <- data.frame(geneID=rownames(seurat)) %>%
  mutate(gene=gsub(".*\\.", "",  geneID))

markerAll <- seurat_markers %>% left_join(., genes, by="gene")

ordVec <- names(colLab)
Idents(seurat) <- seurat$label
pOut <- avgHeatmap(seurat = seurat, selGenes = markerAll,
                  colVecIdent = colLab,
                  ordVec=ordVec,
                  gapVecR=NULL, gapVecC=NULL,cc=F,
                  cr=F, condCol=F)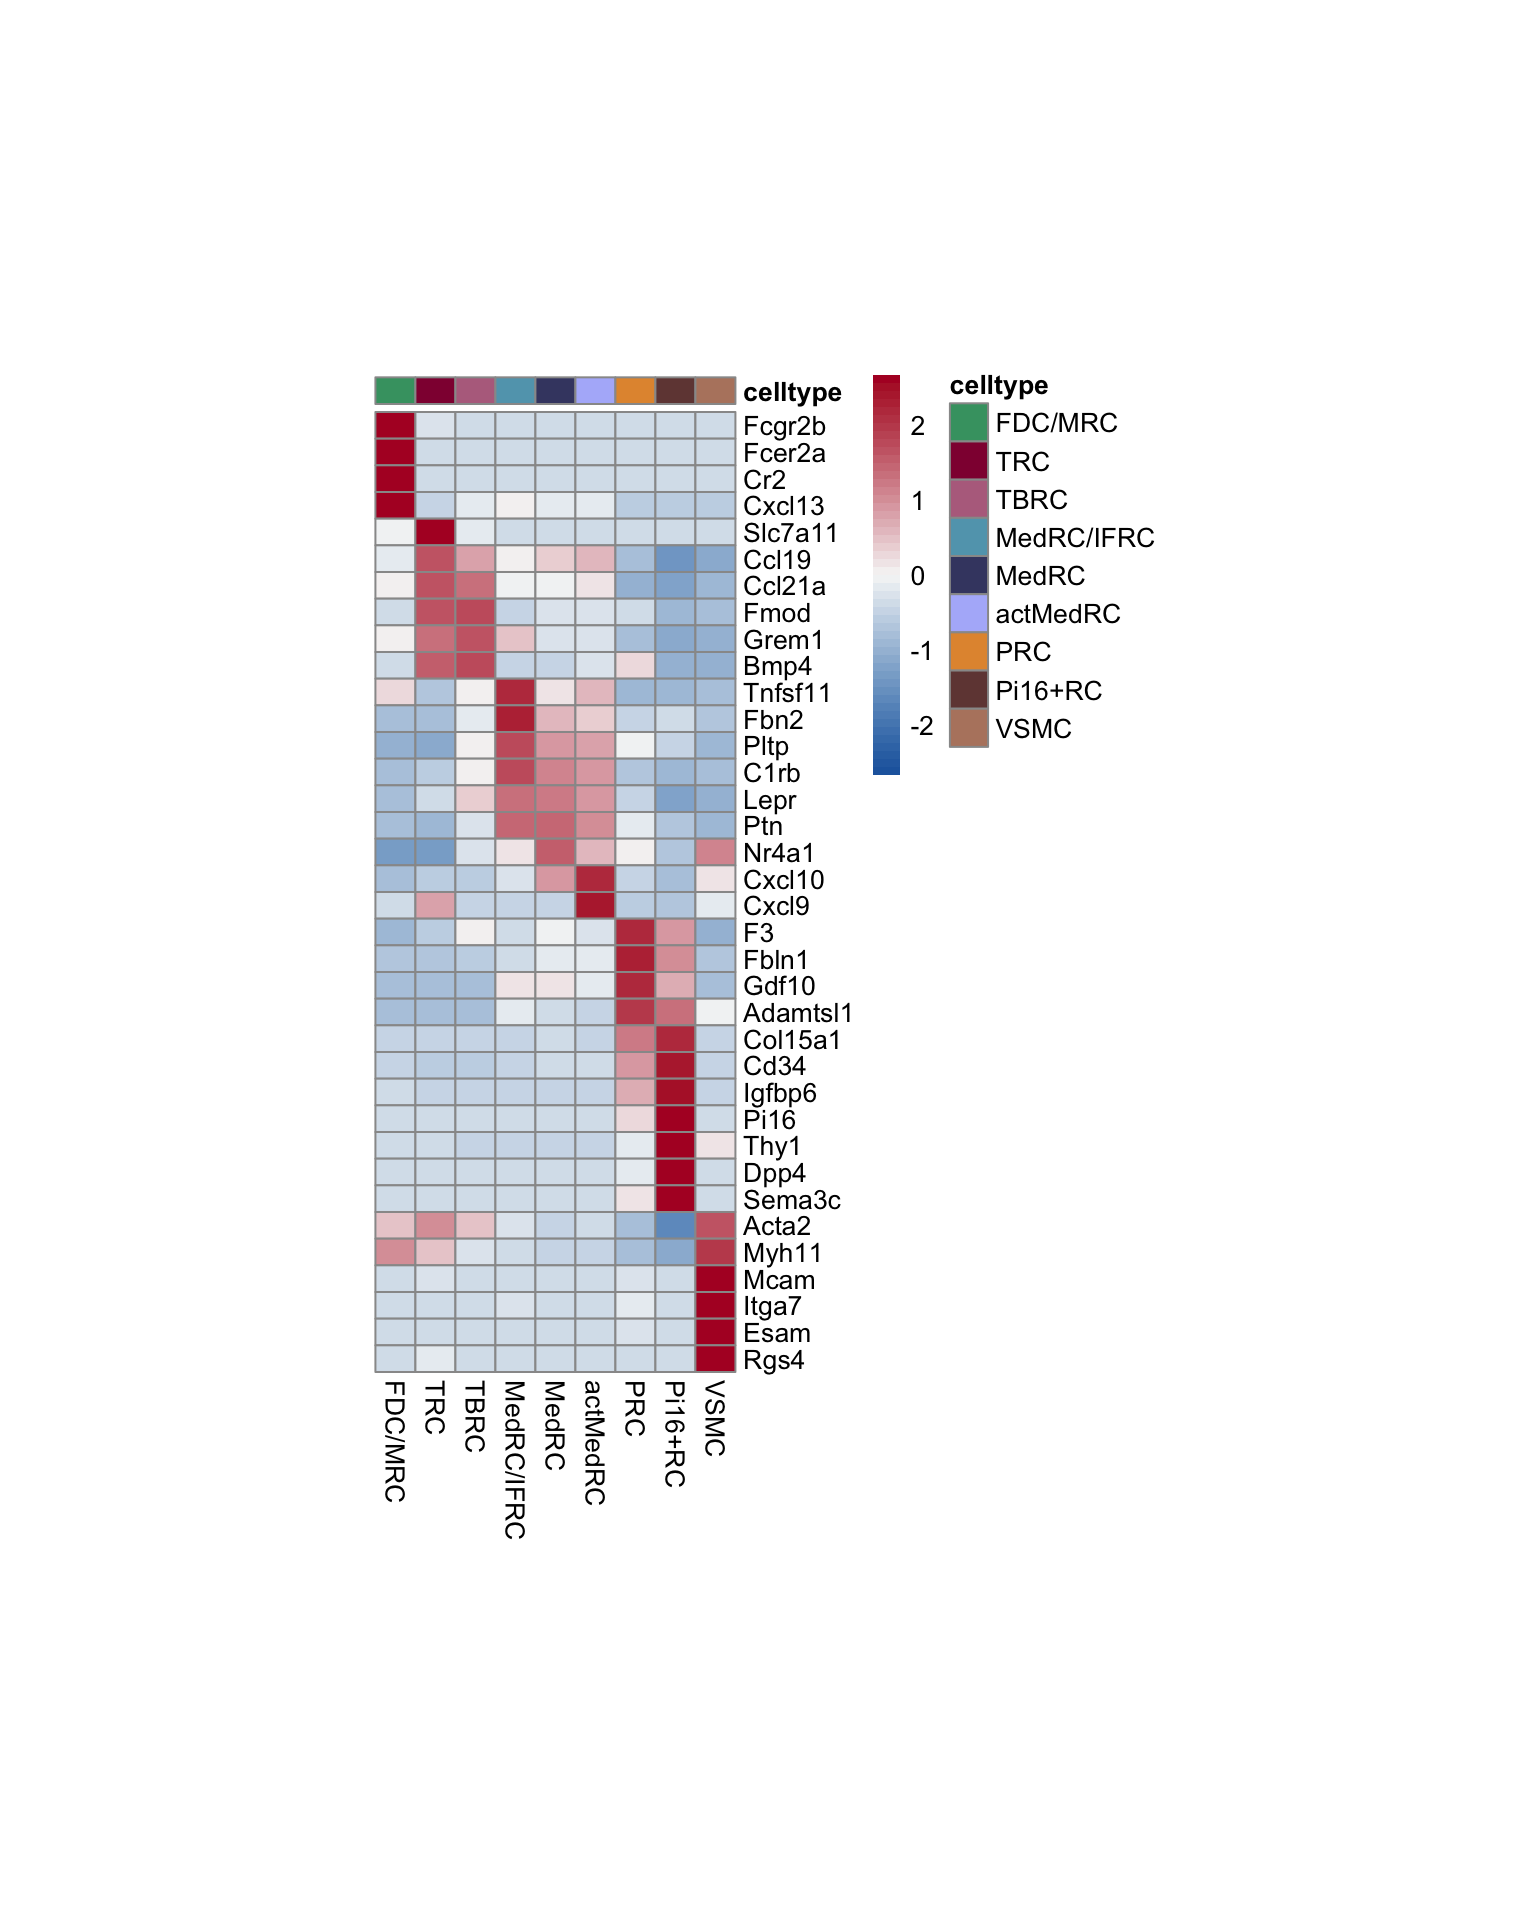
seurat$label_plus_loc <- paste0(seurat$label, "_", seurat$location)
Idents(seurat) <- seurat$label_plus_loc


ordVec <- as.vector(t(outer(names(colLab), names(colLoc), paste, sep="_")))
seurat$label_plus_loc <- factor(seurat$label_plus_loc, levels=ordVec)

pOut <- avgHeatmap(seurat = seurat, selGenes = markerAll,
                  colVecIdent = colLab,
                  ordVec=ordVec,
                  gapVecR=NULL, gapVecC=NULL,cc=F,
                  cr=F, condCol=T, colVecCond = colLoc)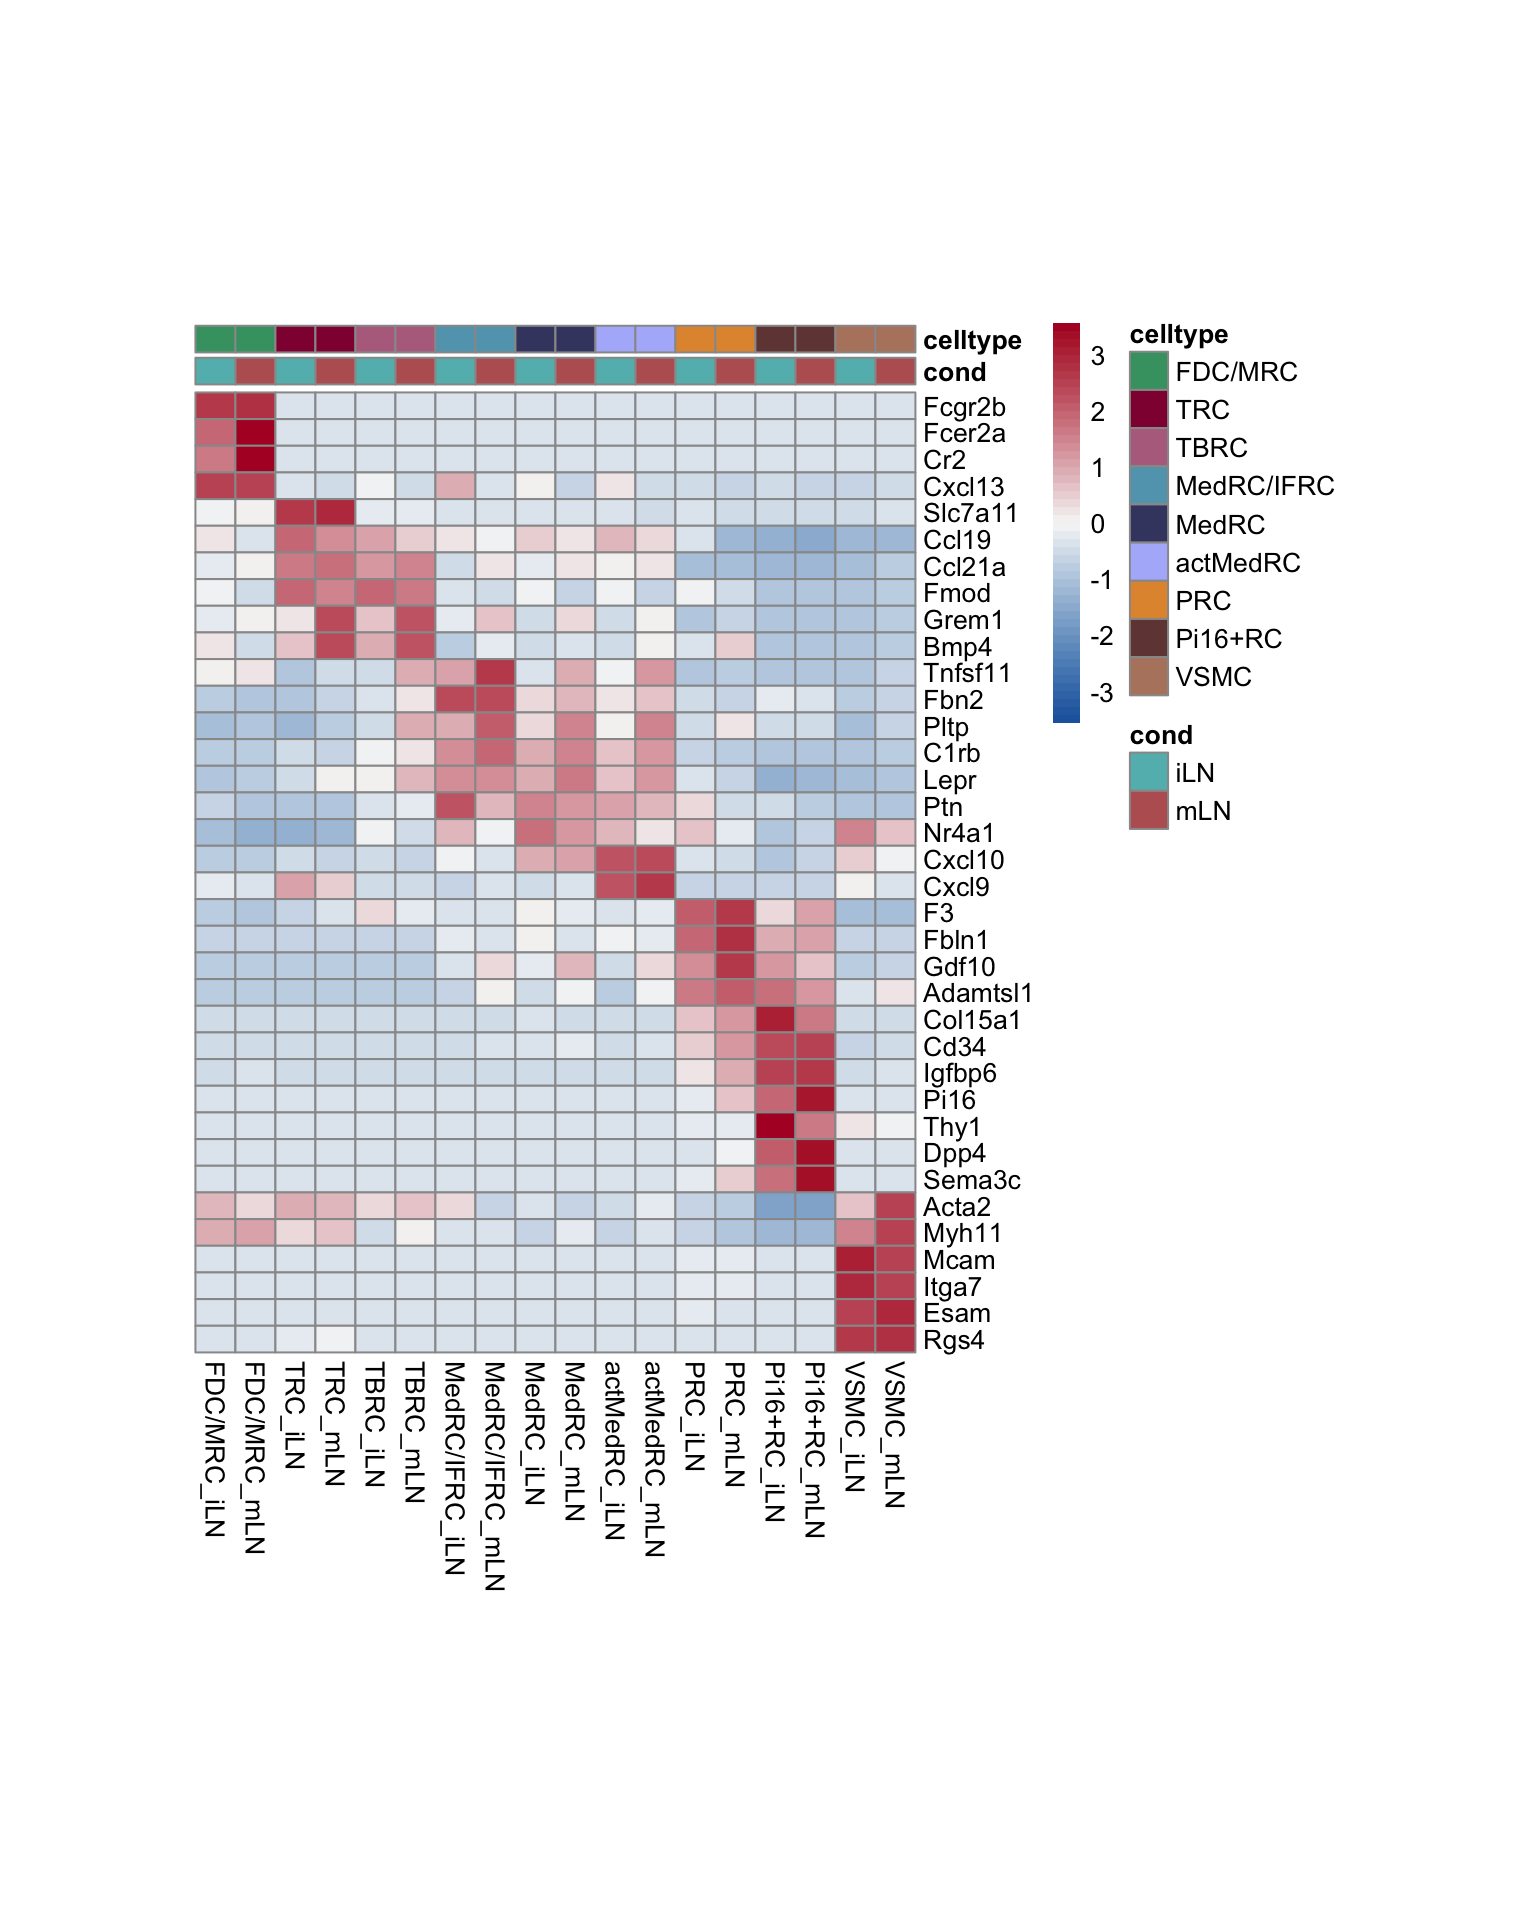
Dotplot all
seurat$label <- factor(seurat$label, levels = names(colLab))
Idents(seurat) <- seurat$label

DotPlot(seurat, assay="RNA", features = rev(markerAll$geneID), scale =T,
        cluster.idents = F) +
  scale_color_viridis_c() +
  coord_flip() +
  theme(axis.text.x = element_text(angle = 90, hjust = 1)) +
  scale_x_discrete(breaks=rev(markerAll$geneID), labels=rev(markerAll$gene)) +
  xlab("") + ylab("")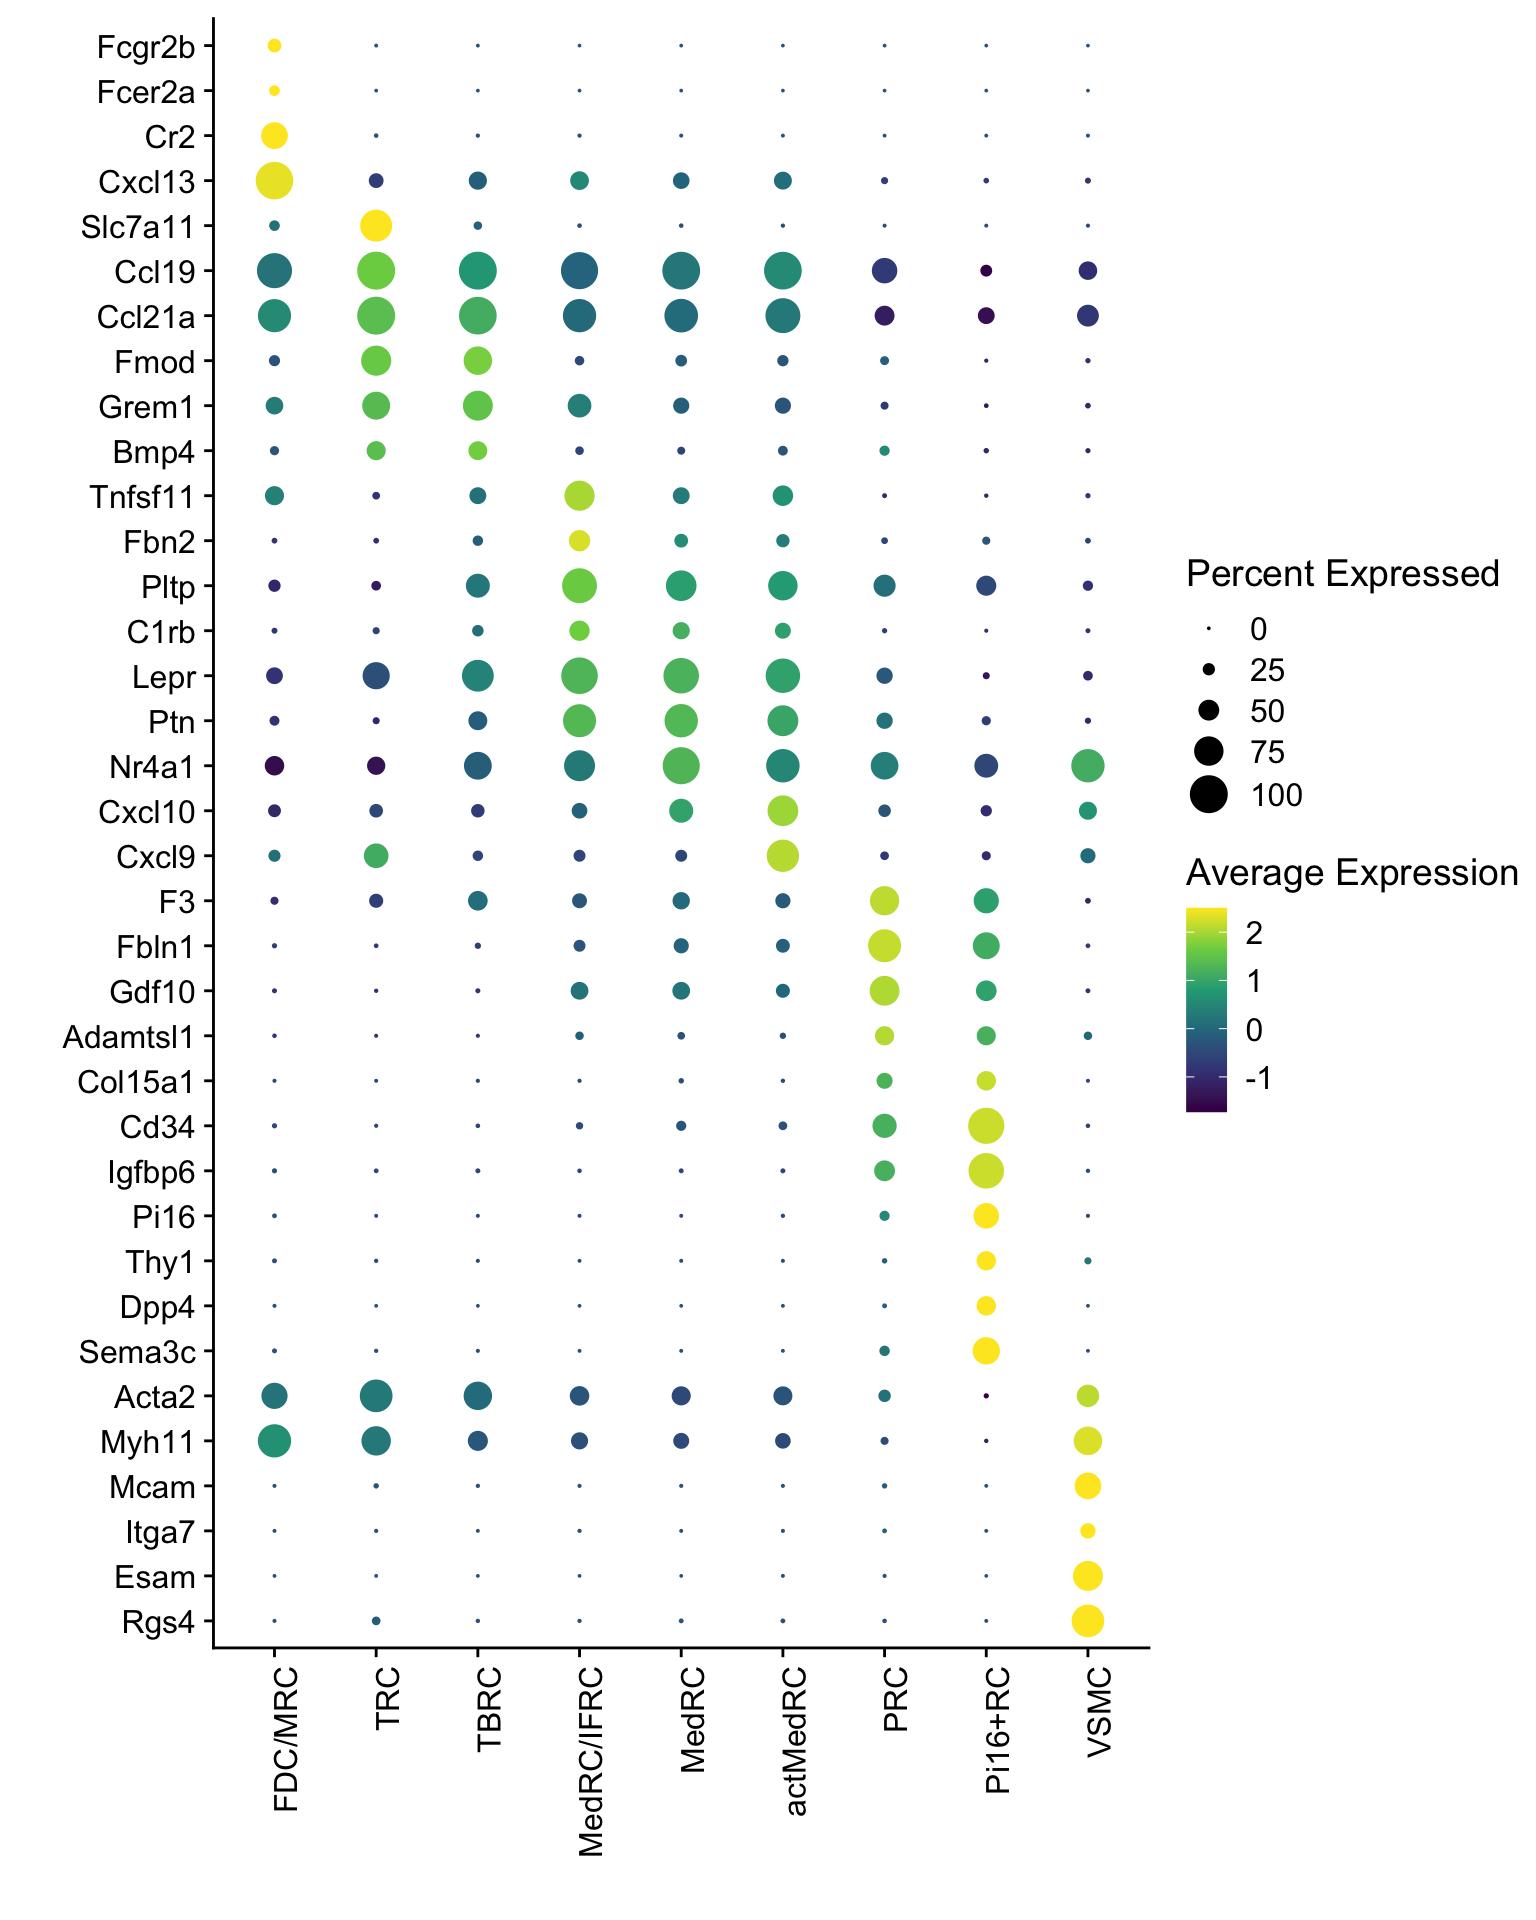
DotPlot(seurat, assay="RNA", features = rev(markerAll$geneID), scale =T,
        cluster.idents = F, dot.min = 0, dot.scale = 5, scale.by = "radius") +
  scale_color_viridis_c() +
  coord_flip() +
  theme(axis.text.x = element_text(angle = 90, hjust = 1)) +
  scale_x_discrete(breaks=rev(markerAll$geneID), labels=rev(markerAll$gene)) +
  xlab("") + ylab("")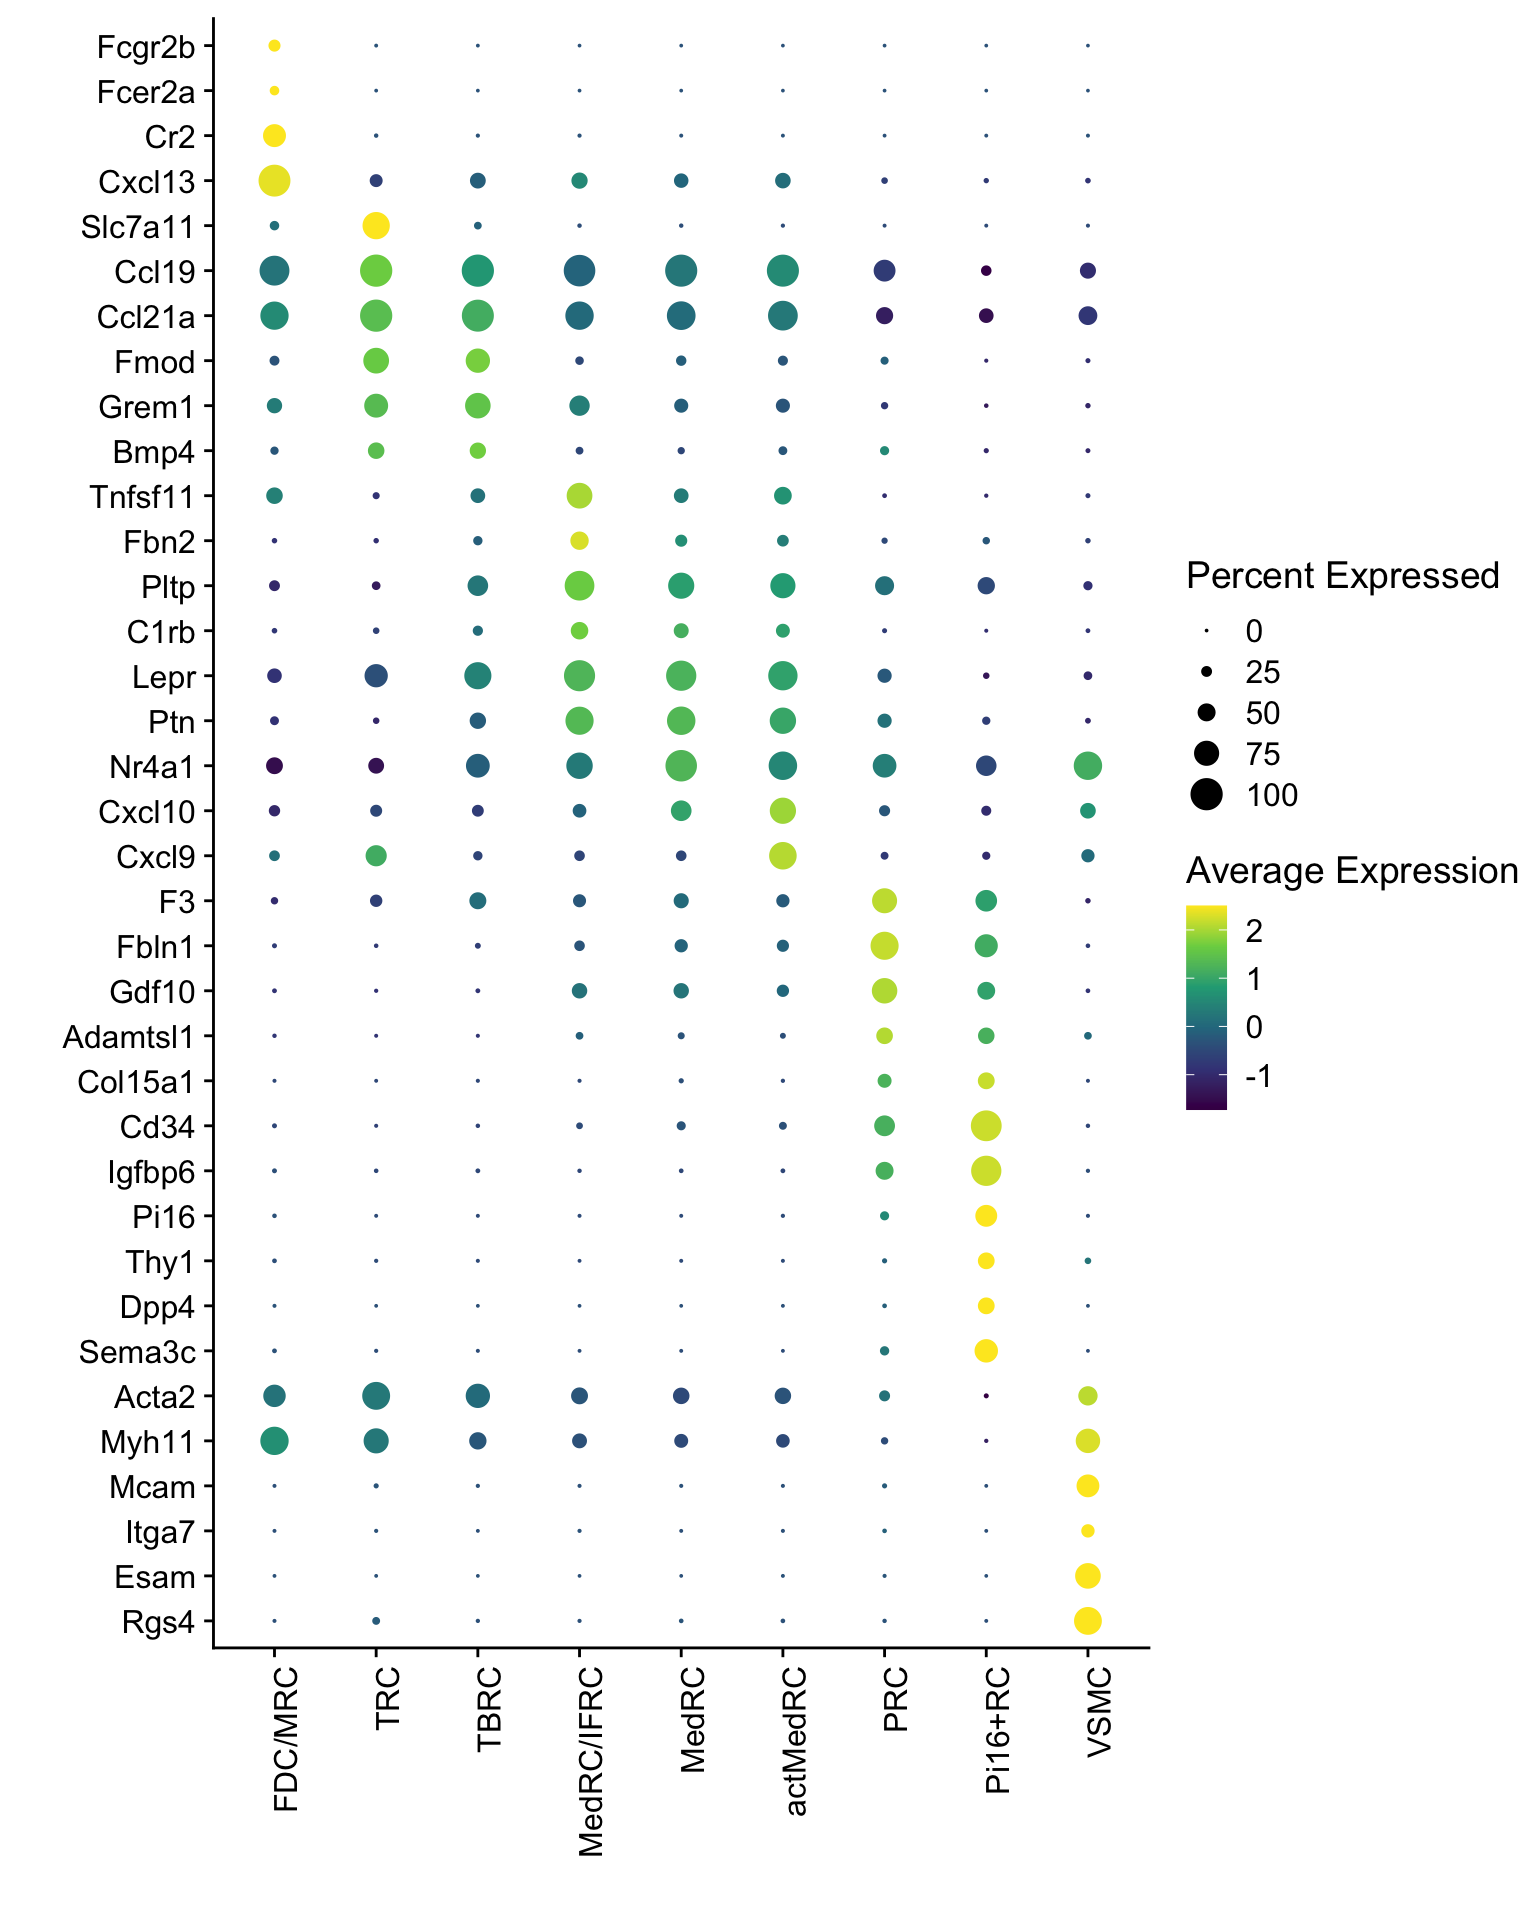
DotPlot(seurat, assay="RNA", features = rev(markerAll$geneID), scale =F,
        cluster.idents = F) +
  scale_color_viridis_c() +
  coord_flip() +
  theme(axis.text.x = element_text(angle = 90, hjust = 1)) +
  scale_x_discrete(breaks=rev(markerAll$geneID), labels=rev(markerAll$gene)) +
  xlab("") + ylab("")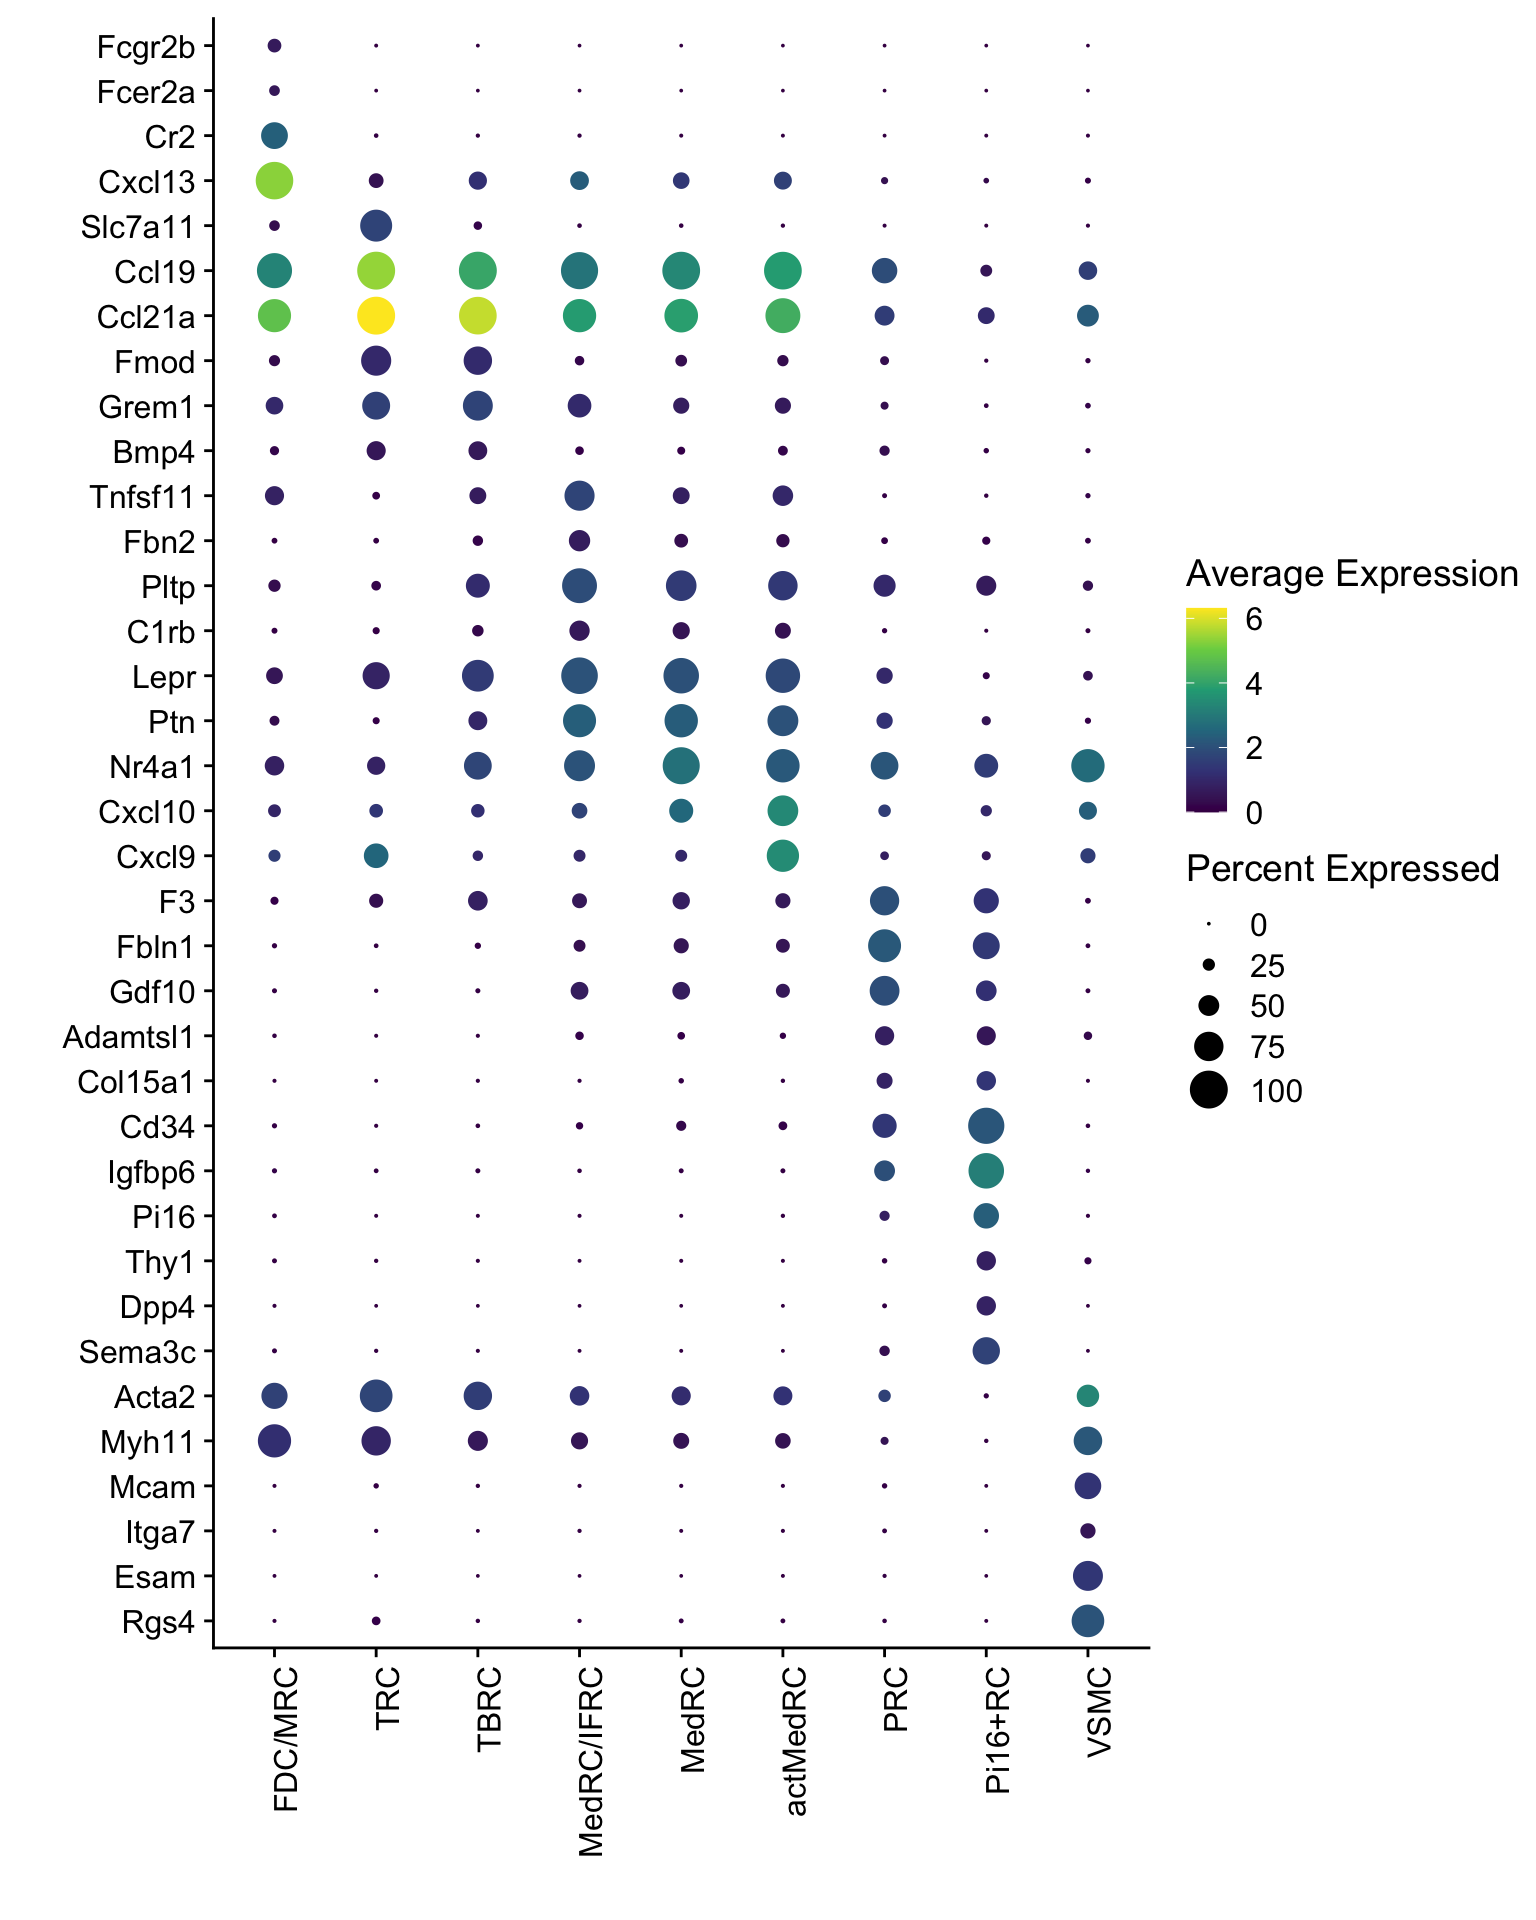
Dotplot individual LN
Idents(seurat) <- seurat$label_plus_loc

DotPlot(seurat, assay="RNA", features = rev(markerAll$geneID), scale =T,
        cluster.idents = F) +
  scale_color_viridis_c() +
  coord_flip() +
  theme(axis.text.x = element_text(angle = 90, hjust = 1)) +
  scale_x_discrete(breaks=rev(markerAll$geneID), labels=rev(markerAll$gene)) +
  xlab("") + ylab("")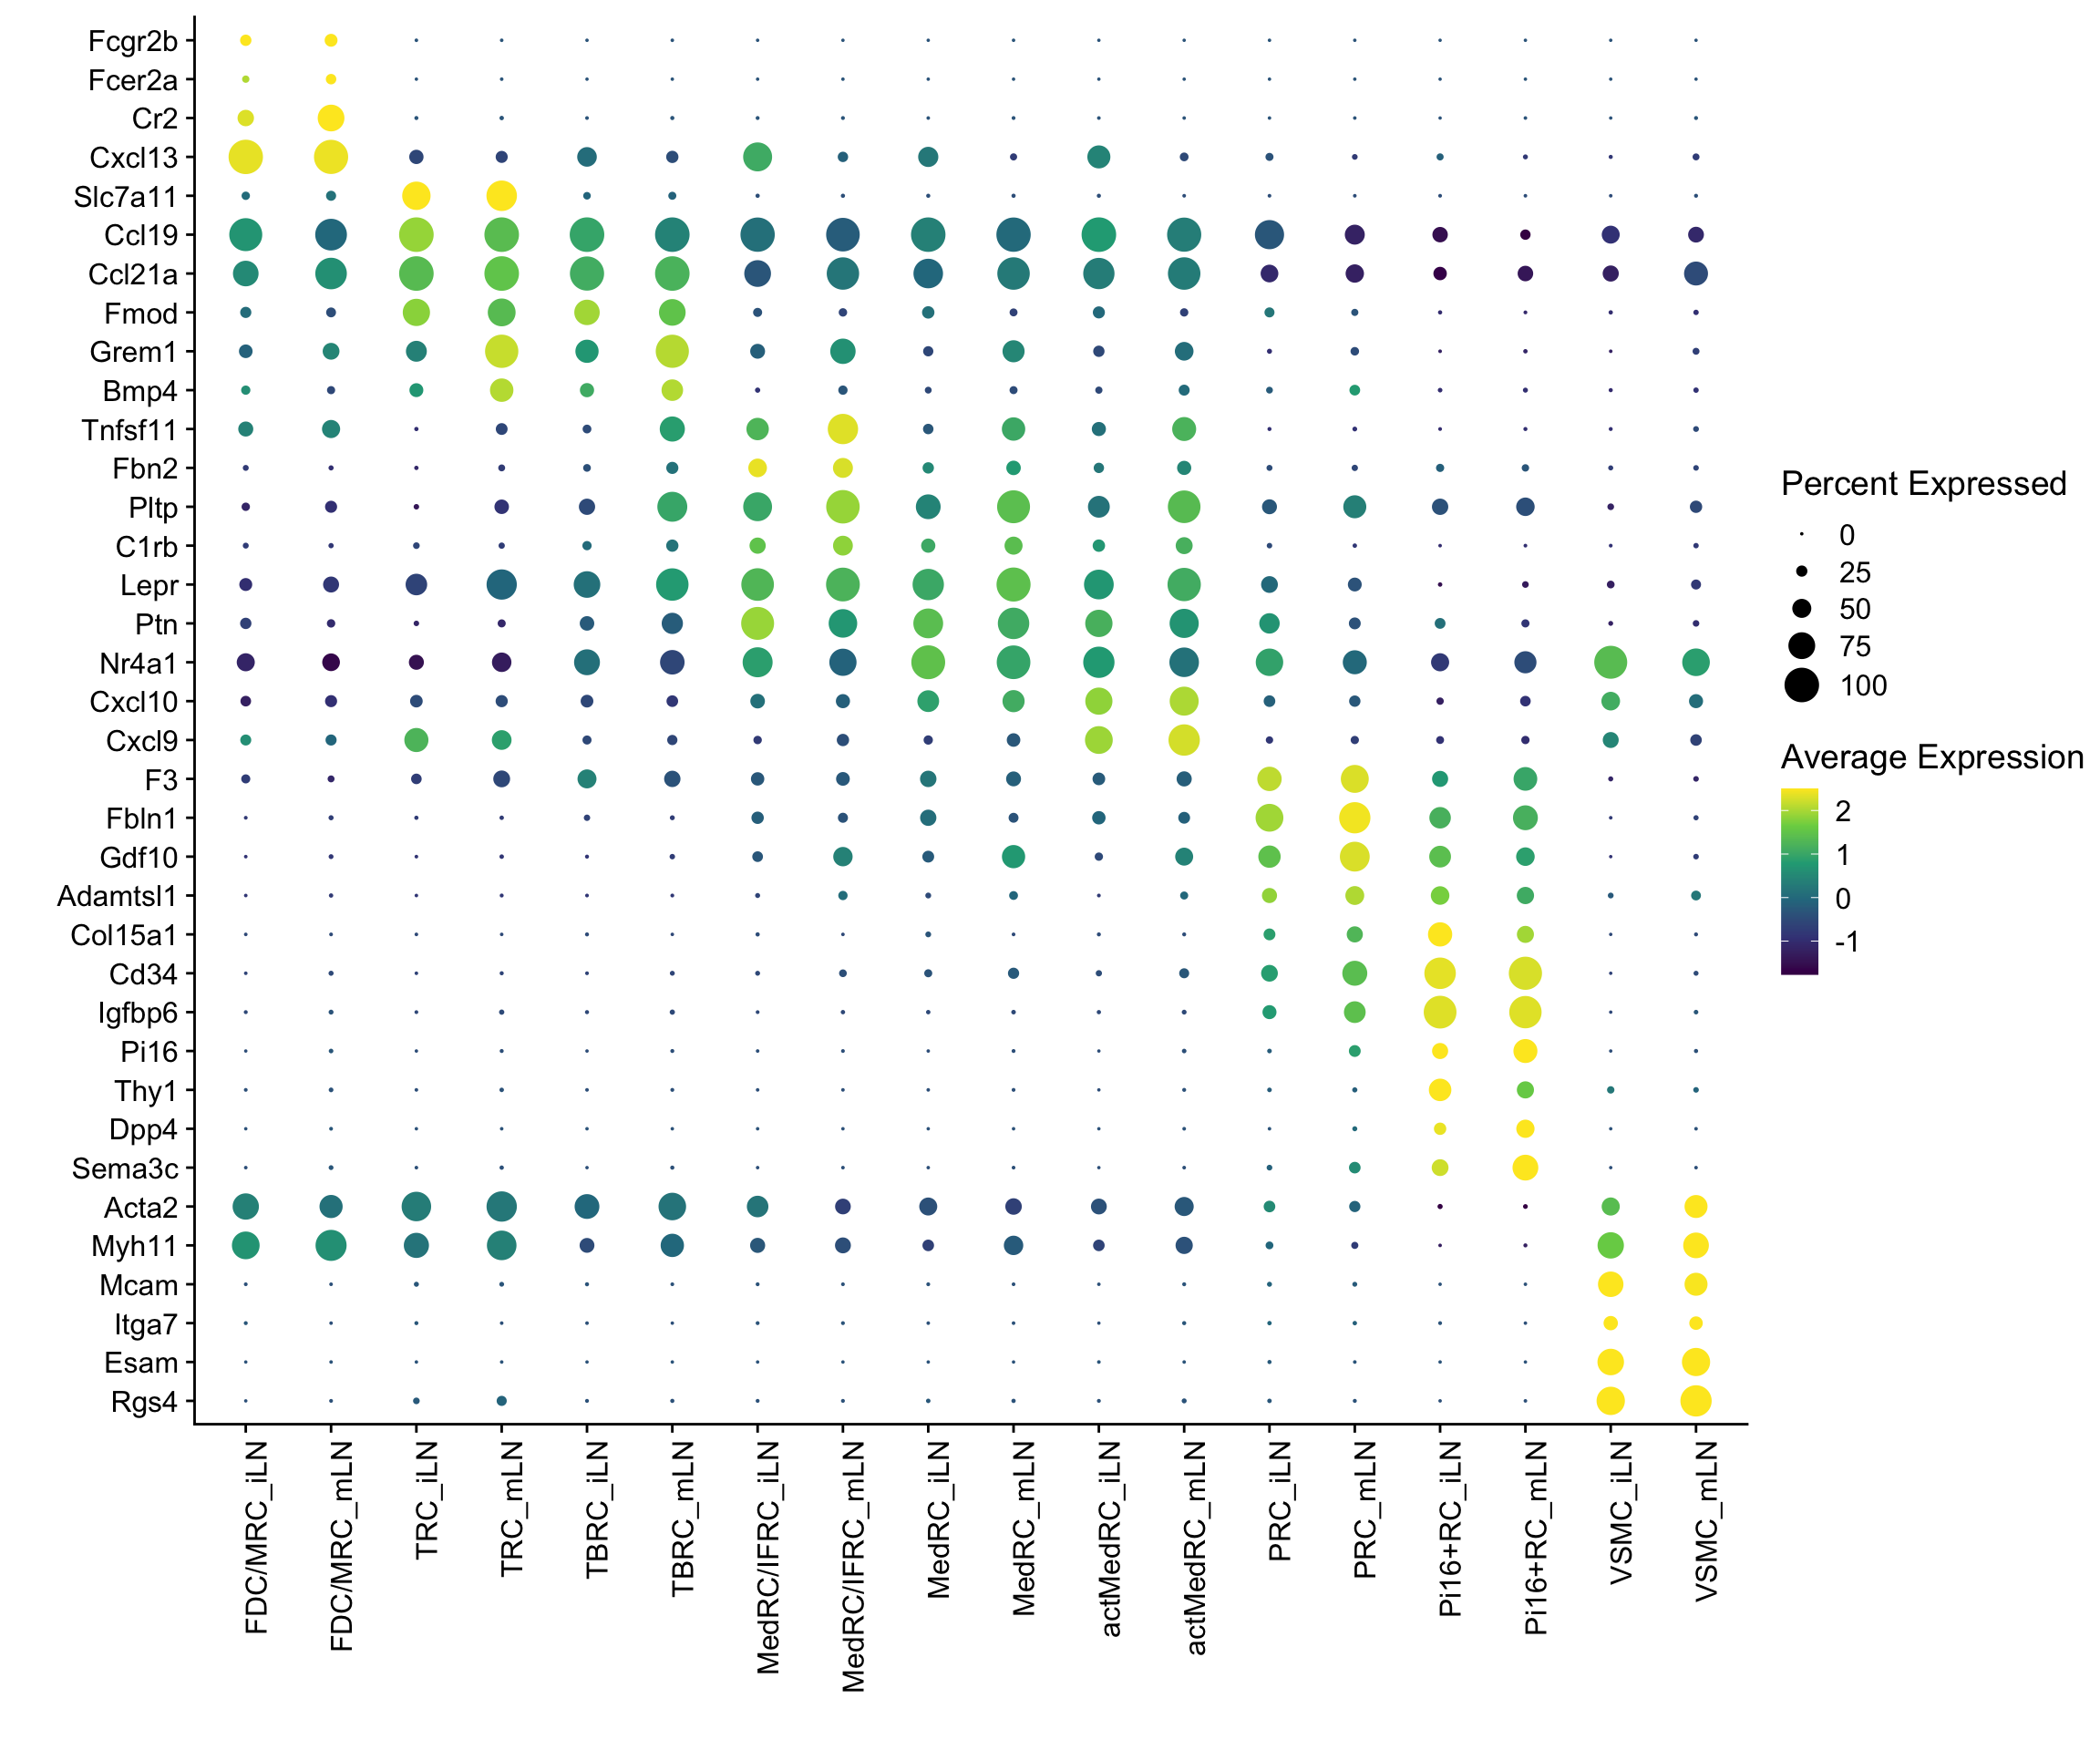
DotPlot(seurat, assay="RNA", features = rev(markerAll$geneID), scale =T,
        cluster.idents = F, dot.min = 0, dot.scale = 5, scale.by = "radius") +
  scale_color_viridis_c() +
  coord_flip() +
  theme(axis.text.x = element_text(angle = 90, hjust = 1)) +
  scale_x_discrete(breaks=rev(markerAll$geneID), labels=rev(markerAll$gene)) +
  xlab("") + ylab("")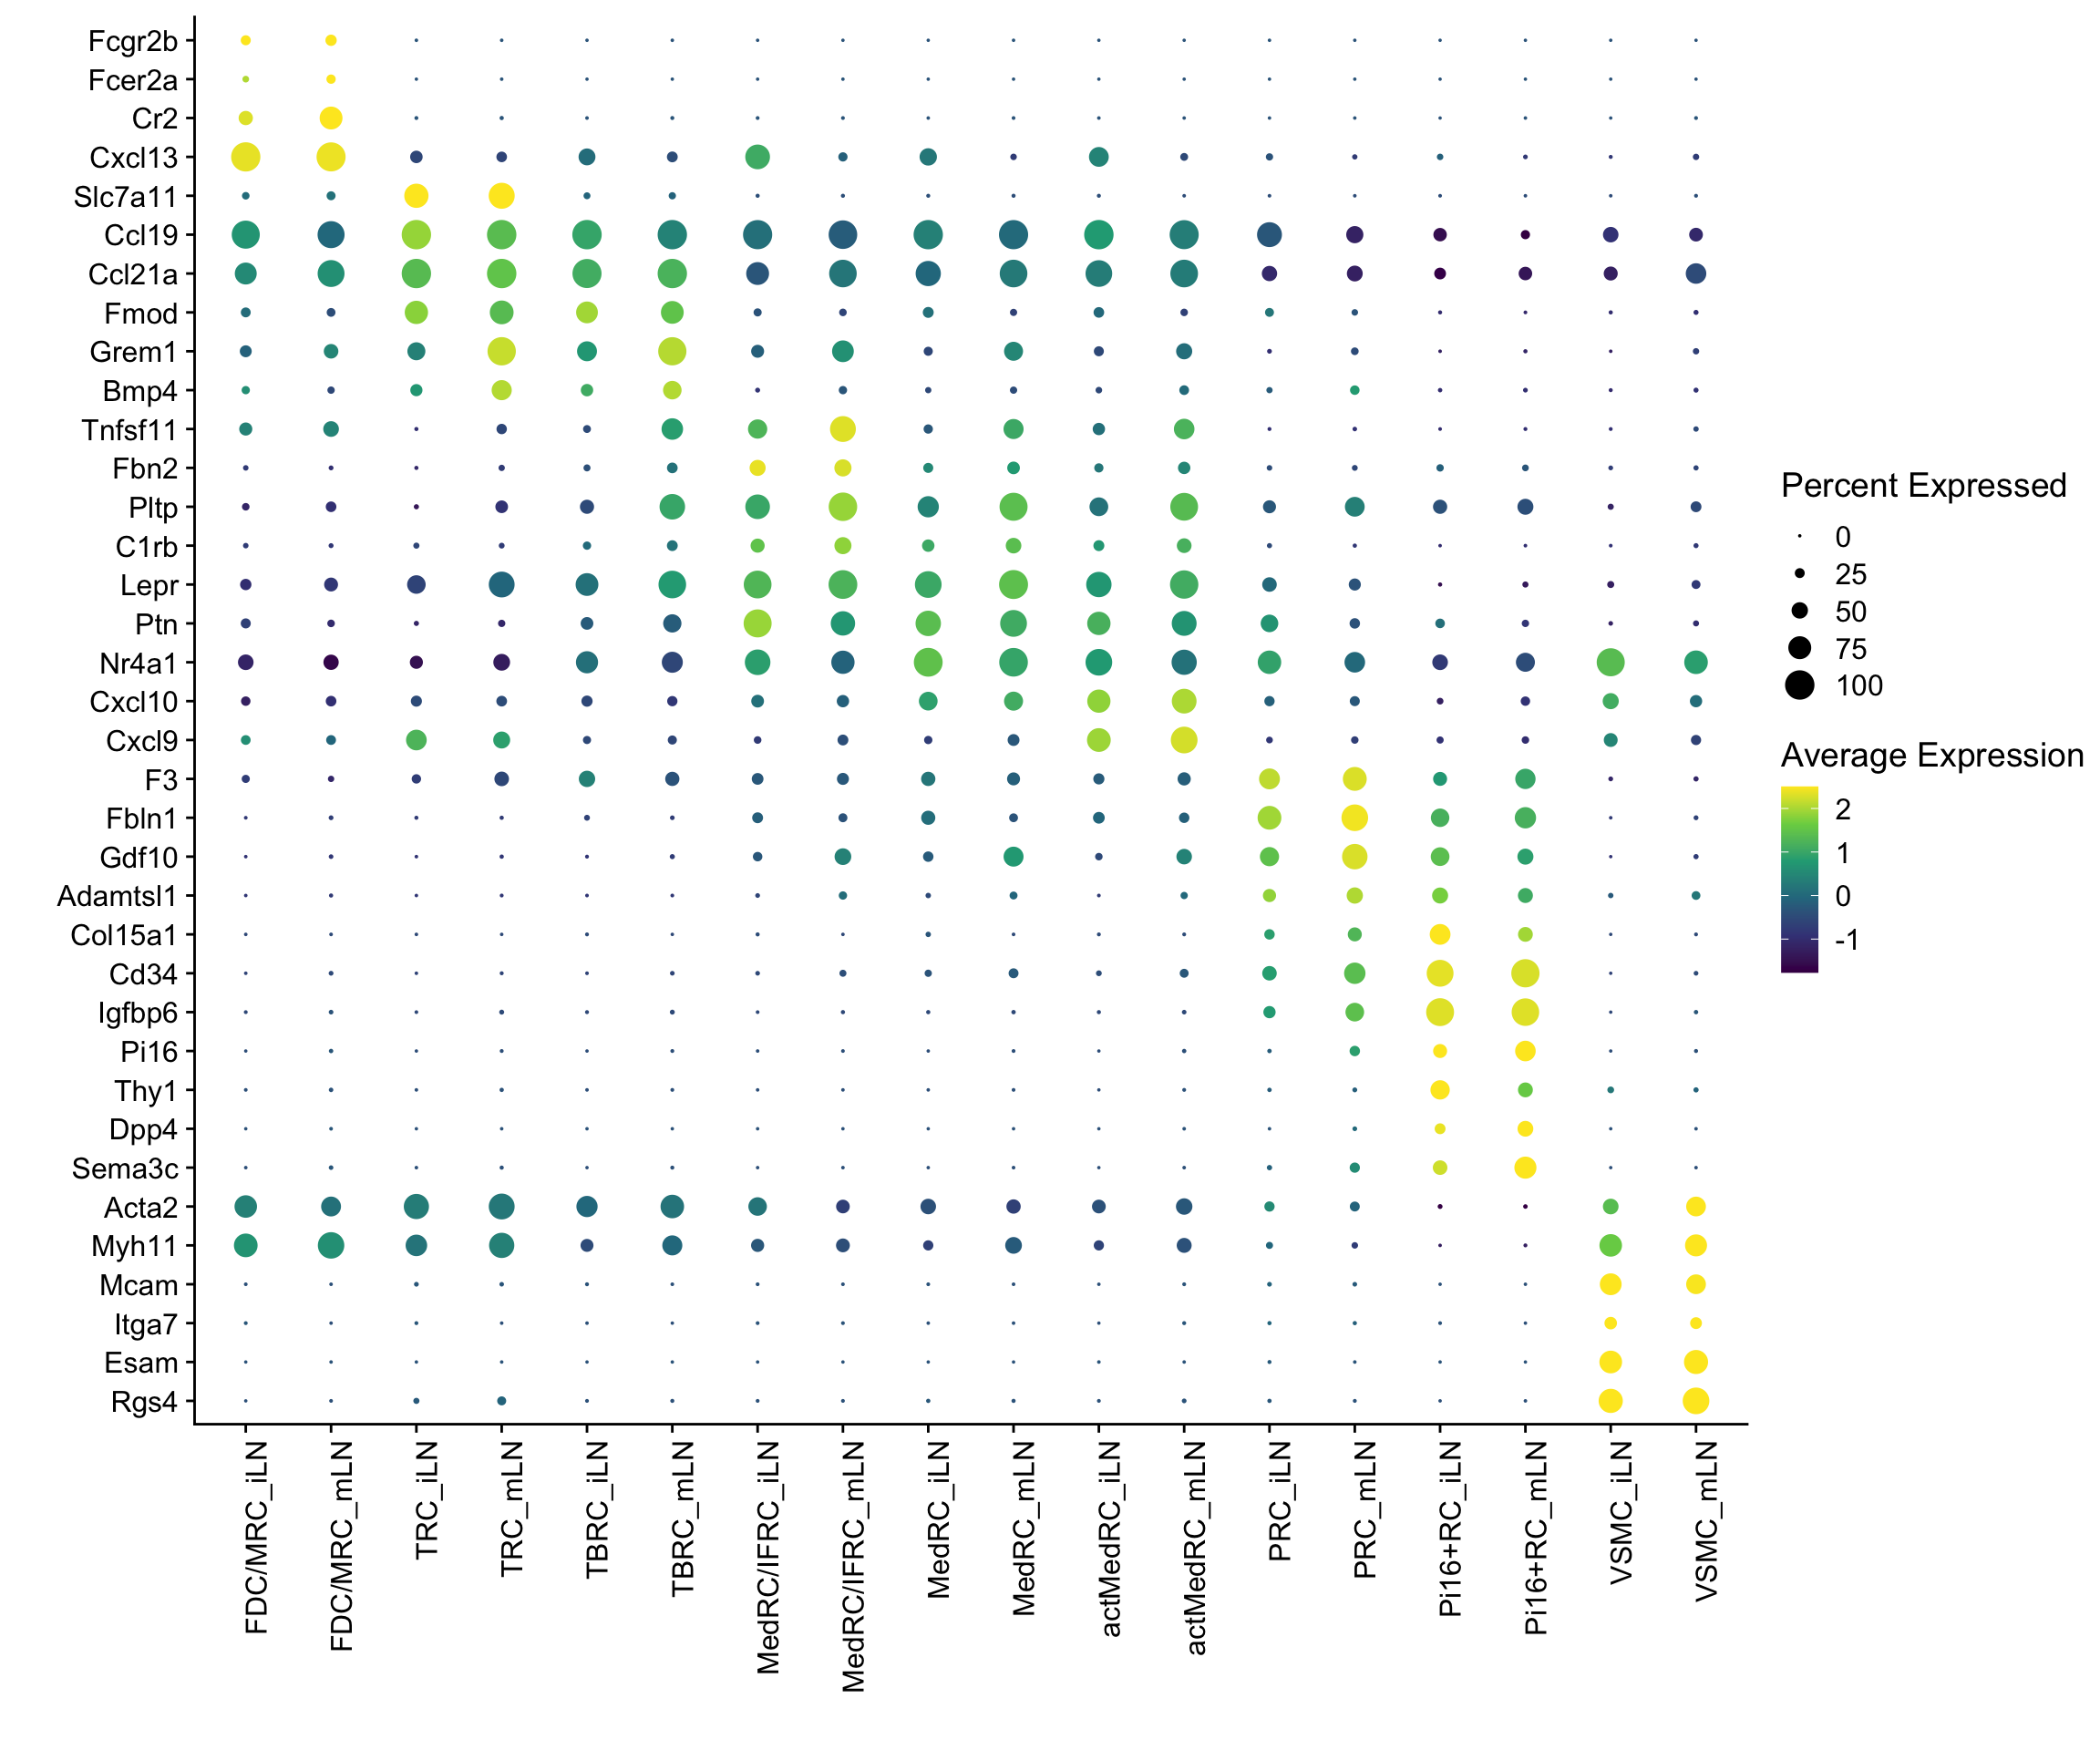
DotPlot(seurat, assay="RNA", features = rev(markerAll$geneID), scale =F,
        cluster.idents = F) +
  scale_color_viridis_c() +
  coord_flip() +
  theme(axis.text.x = element_text(angle = 90, hjust = 1)) +
  scale_x_discrete(breaks=rev(markerAll$geneID), labels=rev(markerAll$gene)) +
  xlab("") + ylab("")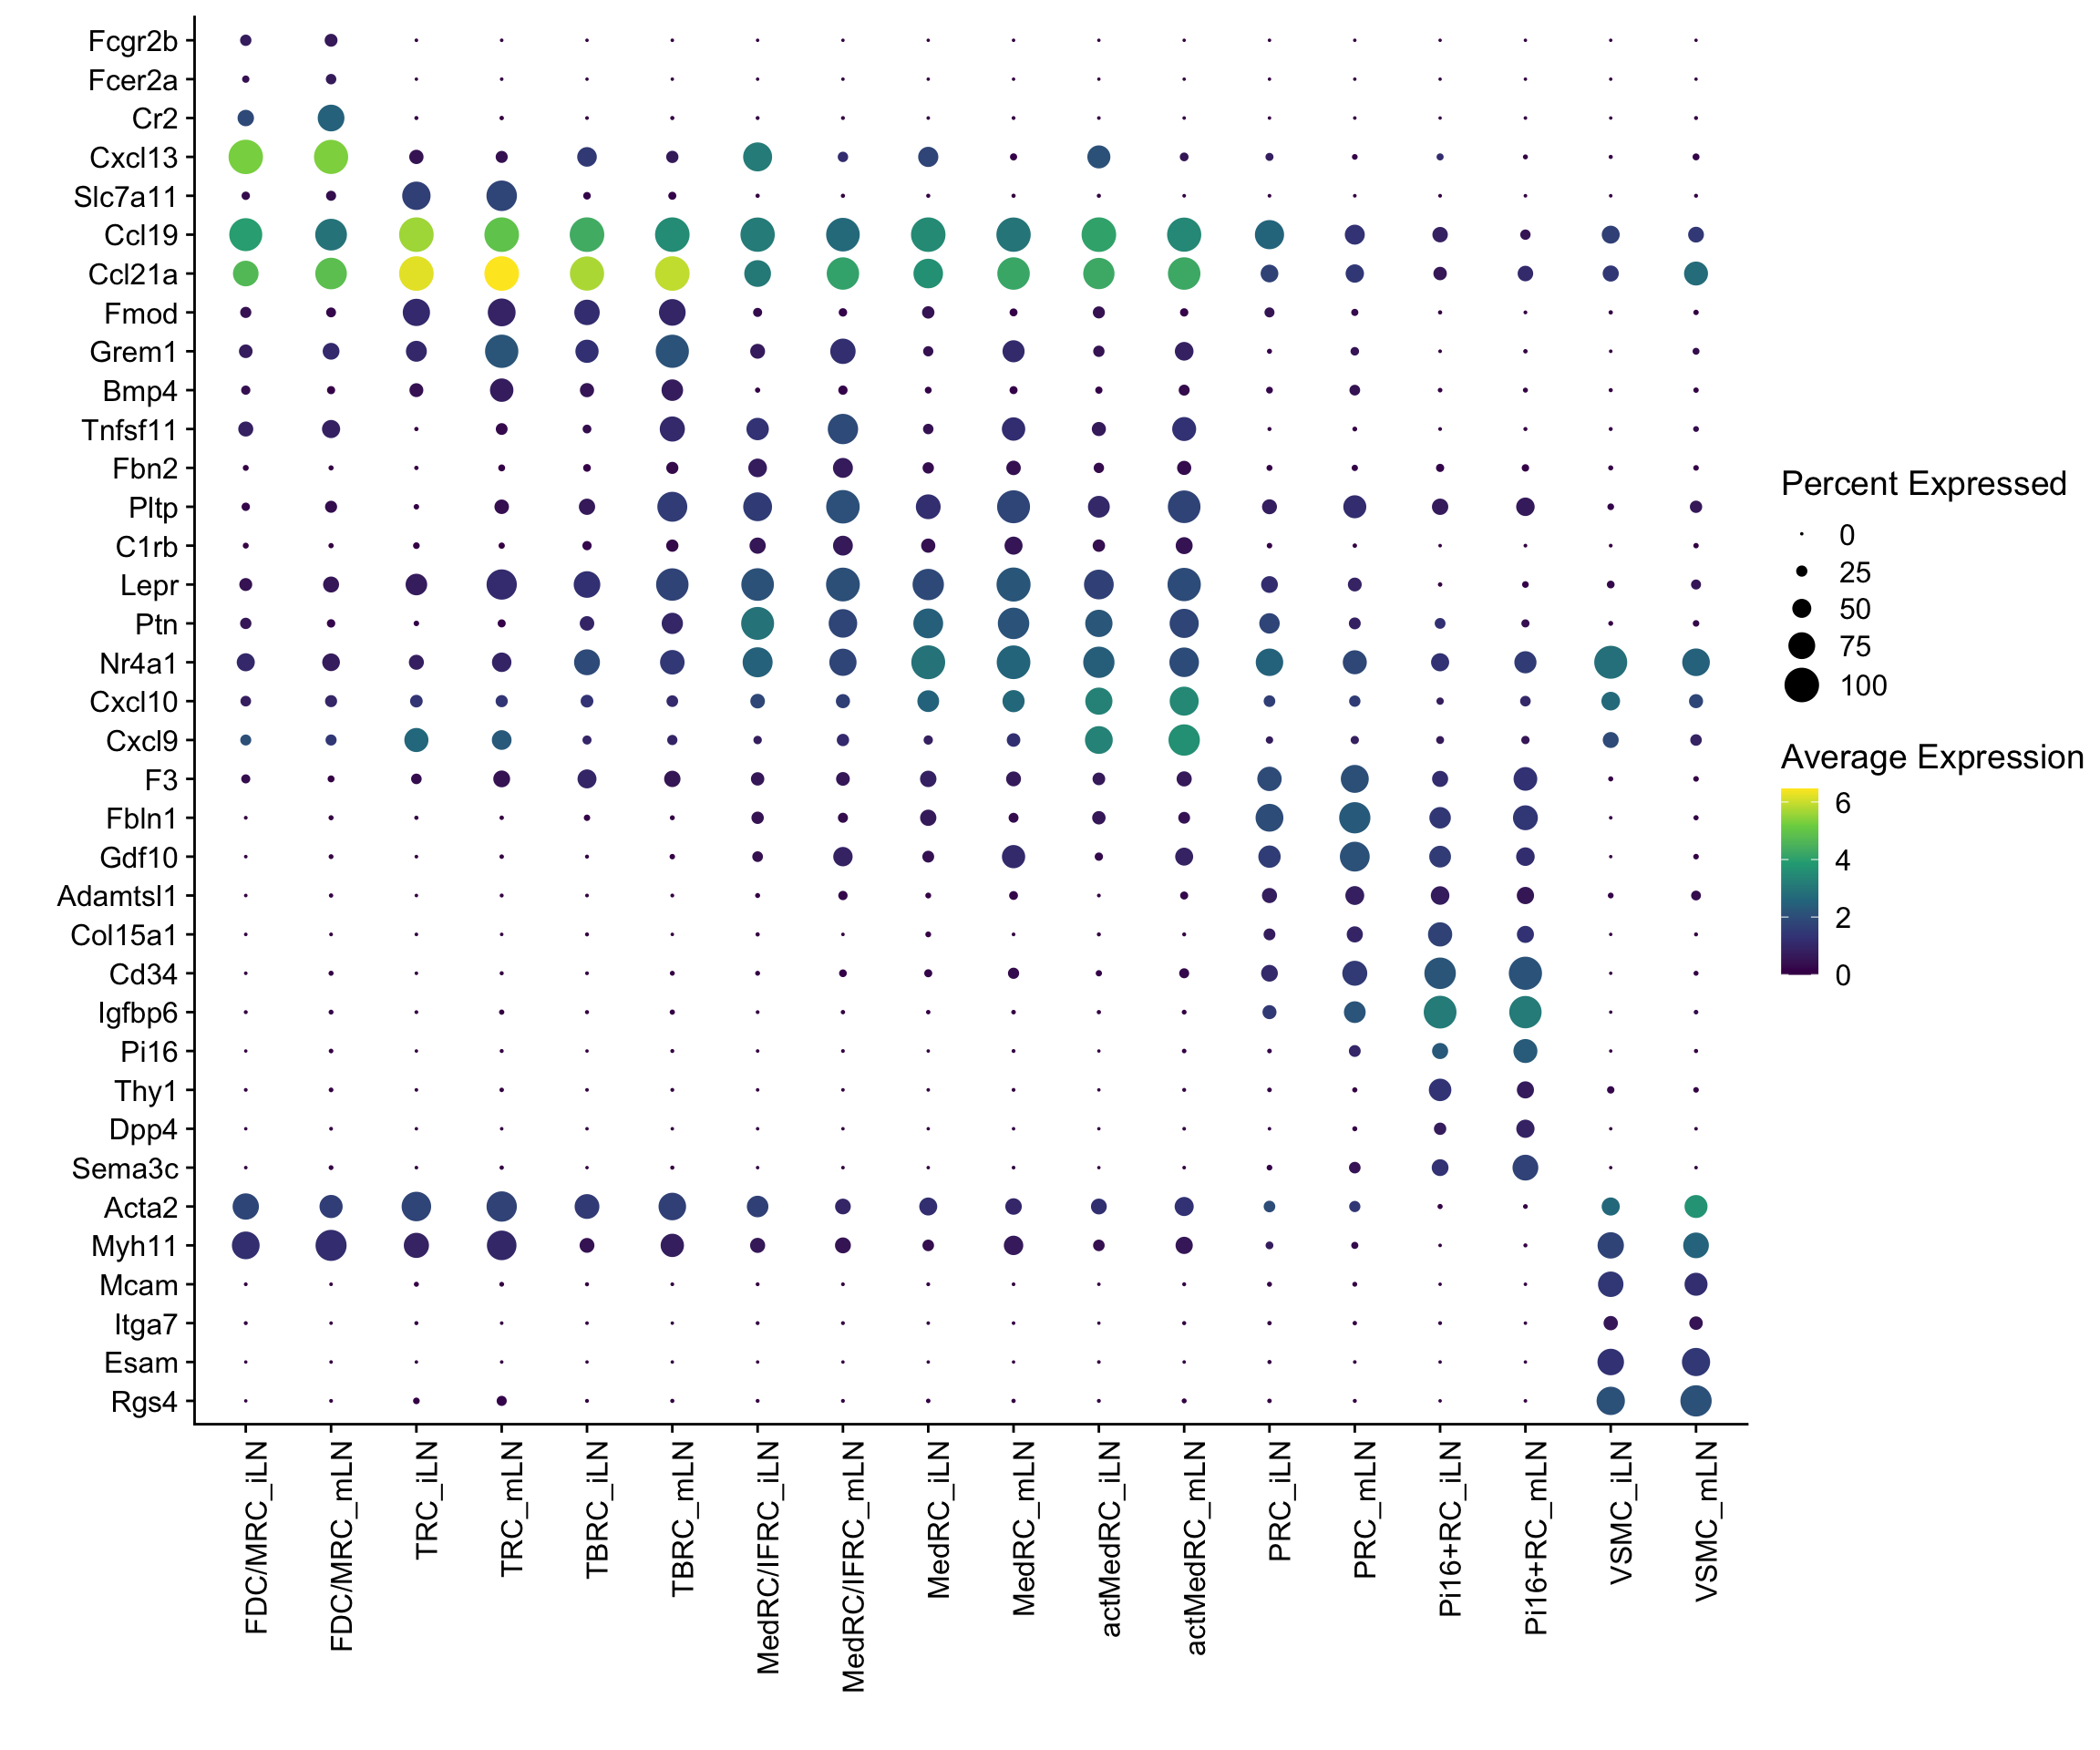
PRC/VSMC signature
Idents(seurat) <- seurat$label
seurat_markers_all <- FindAllMarkers(seurat, only.pos = T,
                                     logfc.threshold = 0.25)
session info
sessionInfo()R version 4.3.0 (2023-04-21)
Platform: x86_64-apple-darwin20 (64-bit)
Running under: macOS Ventura 13.4.1
Matrix products: default
BLAS: /Library/Frameworks/R.framework/Versions/4.3-x86_64/Resources/lib/libRblas.0.dylib
LAPACK: /Library/Frameworks/R.framework/Versions/4.3-x86_64/Resources/lib/libRlapack.dylib; LAPACK version 3.11.0
locale:
[1] en_US.UTF-8/en_US.UTF-8/en_US.UTF-8/C/en_US.UTF-8/en_US.UTF-8
time zone: Europe/Berlin
tzcode source: internal
attached base packages:
[1] stats4 stats graphics grDevices utils datasets methods
[8] base
other attached packages:
[1] ggsci_3.0.1 scran_1.28.2
[3] scater_1.28.0 scuttle_1.10.3
[5] pheatmap_1.0.12 RColorBrewer_1.1-3
[7] SingleCellExperiment_1.22.0 SummarizedExperiment_1.30.2
[9] Biobase_2.60.0 GenomicRanges_1.52.1
[11] GenomeInfoDb_1.36.4 IRanges_2.36.0
[13] S4Vectors_0.40.1 BiocGenerics_0.48.0
[15] MatrixGenerics_1.12.3 matrixStats_1.2.0
[17] runSeurat3_0.1.0 here_1.0.1
[19] magrittr_2.0.3 Seurat_5.0.2
[21] SeuratObject_5.0.1 sp_2.1-3
[23] lubridate_1.9.3 forcats_1.0.0
[25] stringr_1.5.1 dplyr_1.1.4
[27] purrr_1.0.2 readr_2.1.5
[29] tidyr_1.3.1 tibble_3.2.1
[31] ggplot2_3.5.0 tidyverse_2.0.0
loaded via a namespace (and not attached):
[1] RcppAnnoy_0.0.22 splines_4.3.0
[3] later_1.3.2 bitops_1.0-7
[5] polyclip_1.10-6 fastDummies_1.7.3
[7] lifecycle_1.0.4 rstatix_0.7.2
[9] edgeR_3.42.4 rprojroot_2.0.4
[11] globals_0.16.2 lattice_0.22-5
[13] MASS_7.3-60.0.1 backports_1.4.1
[15] limma_3.56.2 plotly_4.10.4
[17] rmarkdown_2.26 yaml_2.3.8
[19] metapod_1.8.0 httpuv_1.6.14
[21] sctransform_0.4.1 spam_2.10-0
[23] spatstat.sparse_3.0-3 reticulate_1.35.0
[25] cowplot_1.1.3 pbapply_1.7-2
[27] abind_1.4-5 zlibbioc_1.46.0
[29] Rtsne_0.17 presto_1.0.0
[31] RCurl_1.98-1.14 GenomeInfoDbData_1.2.10
[33] ggrepel_0.9.5 irlba_2.3.5.1
[35] listenv_0.9.1 spatstat.utils_3.0-4
[37] goftest_1.2-3 RSpectra_0.16-1
[39] dqrng_0.3.2 spatstat.random_3.2-3
[41] fitdistrplus_1.1-11 parallelly_1.37.1
[43] DelayedMatrixStats_1.22.6 leiden_0.4.3.1
[45] codetools_0.2-19 DelayedArray_0.26.7
[47] tidyselect_1.2.0 farver_2.1.1
[49] viridis_0.6.5 ScaledMatrix_1.8.1
[51] spatstat.explore_3.2-6 jsonlite_1.8.8
[53] BiocNeighbors_1.18.0 ellipsis_0.3.2
[55] progressr_0.14.0 ggridges_0.5.6
[57] survival_3.5-8 tools_4.3.0
[59] ica_1.0-3 Rcpp_1.0.12
[61] glue_1.7.0 gridExtra_2.3
[63] xfun_0.42 withr_3.0.0
[65] fastmap_1.1.1 bluster_1.10.0
[67] fansi_1.0.6 digest_0.6.34
[69] rsvd_1.0.5 timechange_0.3.0
[71] R6_2.5.1 mime_0.12
[73] colorspace_2.1-0 scattermore_1.2
[75] tensor_1.5 spatstat.data_3.0-4
[77] utf8_1.2.4 generics_0.1.3
[79] data.table_1.15.2 httr_1.4.7
[81] htmlwidgets_1.6.4 S4Arrays_1.0.6
[83] uwot_0.1.16 pkgconfig_2.0.3
[85] gtable_0.3.4 lmtest_0.9-40
[87] XVector_0.40.0 htmltools_0.5.7
[89] carData_3.0-5 dotCall64_1.1-1
[91] scales_1.3.0 png_0.1-8
[93] knitr_1.45 rstudioapi_0.15.0
[95] tzdb_0.4.0 reshape2_1.4.4
[97] nlme_3.1-164 zoo_1.8-12
[99] KernSmooth_2.23-22 vipor_0.4.7
[101] parallel_4.3.0 miniUI_0.1.1.1
[103] pillar_1.9.0 grid_4.3.0
[105] vctrs_0.6.5 RANN_2.6.1
[107] ggpubr_0.6.0 promises_1.2.1
[109] car_3.1-2 BiocSingular_1.16.0
[111] beachmat_2.16.0 xtable_1.8-4
[113] cluster_2.1.6 beeswarm_0.4.0
[115] evaluate_0.23 locfit_1.5-9.9
[117] cli_3.6.2 compiler_4.3.0
[119] rlang_1.1.3 crayon_1.5.2
[121] ggsignif_0.6.4 future.apply_1.11.1
[123] labeling_0.4.3 plyr_1.8.9
[125] ggbeeswarm_0.7.2 stringi_1.8.3
[127] viridisLite_0.4.2 deldir_2.0-4
[129] BiocParallel_1.34.2 munsell_0.5.0
[131] lazyeval_0.2.2 spatstat.geom_3.2-9
[133] Matrix_1.6-5 RcppHNSW_0.6.0
[135] hms_1.1.3 patchwork_1.2.0
[137] sparseMatrixStats_1.12.2 future_1.33.1
[139] statmod_1.5.0 shiny_1.8.0
[141] ROCR_1.0-11 broom_1.0.5
[143] igraph_2.0.2 date()[1] "Wed Apr 3 15:24:44 2024"