suppressPackageStartupMessages({
  library(tidyverse)
  library(Seurat)
  library(magrittr)
  library(dplyr)
  library(purrr)
  library(ggplot2)
  library(here)
  library(ggpubr)
  library(runSeurat3)
  library(SingleCellExperiment)
  library(RColorBrewer)
  library(pheatmap)
  library(scater)
  library(scran)
  library(ggsci)
  library(clusterProfiler)
  library(org.Mm.eg.db)
  library(DOSE)
  library(enrichplot)
})DE genes adult mLN vs iLN
load packages
heatmap function
avgHeatmap <- function(seurat, selGenes, colVecIdent, colVecCond=NULL,
                       ordVec=NULL, gapVecR=NULL, gapVecC=NULL,cc=FALSE,
                       cr=FALSE, condCol=FALSE){

  selGenes <- selGenes$gene

  ## assay data
  clusterAssigned <- as.data.frame(Idents(seurat)) %>%
  dplyr::mutate(cell=rownames(.))
  colnames(clusterAssigned)[1] <- "ident"
  seuratDat <- GetAssayData(seurat)

  ## genes of interest
  genes <- data.frame(gene=rownames(seurat)) %>%
    mutate(geneID=gsub("^.*\\.", "", gene)) %>% filter(geneID %in% selGenes)

  ## matrix with averaged cnts per ident
  logNormExpres <- as.data.frame(t(as.matrix(
    seuratDat[which(rownames(seuratDat) %in% genes$gene),])))
  logNormExpres <- logNormExpres %>% dplyr::mutate(cell=rownames(.)) %>%
    dplyr::left_join(.,clusterAssigned, by=c("cell")) %>%
    dplyr::select(-cell) %>% dplyr::group_by(ident) %>%
    dplyr::summarise_all(mean)
  logNormExpresMa <- logNormExpres %>% dplyr::select(-ident) %>% as.matrix()
  rownames(logNormExpresMa) <- logNormExpres$ident
  logNormExpresMa <- t(logNormExpresMa)
  rownames(logNormExpresMa) <- gsub("^.*?\\.","",rownames(logNormExpresMa))

  ## remove genes if they are all the same in all groups
  ind <- apply(logNormExpresMa, 1, sd) == 0
  logNormExpresMa <- logNormExpresMa[!ind,]
  genes <- genes[!ind,]

  ## color columns according to cluster
  annotation_col <- as.data.frame(gsub("(^.*?_)","",
                                       colnames(logNormExpresMa)))%>%
    dplyr::mutate(celltype=gsub("(_.*$)","",colnames(logNormExpresMa)))
  colnames(annotation_col)[1] <- "col1"
  annotation_col <- annotation_col %>%
    dplyr::mutate(cond = gsub(".*_","",col1)) %>%
    dplyr::select(cond, celltype)
  rownames(annotation_col) <- colnames(logNormExpresMa)

  ann_colors = list(
      cond = colVecCond,
      celltype=colVecIdent)
  if(is.null(ann_colors$cond)){
    annotation_col$cond <- NULL
  }

  ## adjust order
  logNormExpresMa <- logNormExpresMa[selGenes,]
  if(is.null(ordVec)){
    ordVec <- levels(seurat)
  }
  logNormExpresMa <- logNormExpresMa[,ordVec]

  ## scaled row-wise
  pheatmap(logNormExpresMa, scale="row" ,treeheight_row = 0, cluster_rows = cr,
         cluster_cols = cc,
         color = colorRampPalette(rev(c("#D73027", "#FC8D59","#FEE090", "#E0F3F8", "#91BFDB", "#4575B4")))(50),
         annotation_col = annotation_col, cellwidth=15, cellheight=10,
         annotation_colors = ann_colors, gaps_row = gapVecR, gaps_col = gapVecC)
}

#"#424671", "#F7F7F7", "#900C3F"
#c("#440154FF", "#3B528BFF", "#21908CFF", "#5DC863FF", "#FDE725FF")
set dir and load sample
basedir <- here()
seurat <- readRDS(paste0(basedir,
                              "/data/WT_adultOnly_bothLabeled_integrated_",
                              "_seurat.rds"))

colLoc <- c("#8882da", "#e3a232")
names(colLoc) <- c("iLN", "mLN")

colAge <- c("#440154FF", "#3B528BFF", "#21908CFF", "#5DC863FF", "#FDE725FF")
names(colAge) <- c("E18" , "P7", "3w", "8w","E17to7wk")

colPal <- c("#DAF7A6", "#FFC300", "#FF5733", "#C70039", "#900C3F", "#b66e8d",
            "#61a4ba", "#6178ba", "#54a87f", "#25328a",
            "#b6856e", "#0073C2FF", "#EFC000FF", "#868686FF", "#CD534CFF",
            "#7AA6DCFF", "#003C67FF", "#8F7700FF", "#3B3B3BFF", "#A73030FF",
            "#4A6990FF")[1:length(unique(seurat$intCluster))]
names(colPal) <- unique(seurat$intCluster)

colLab <- c("#42a071", "#900C3F","#b66e8d", "#61a4ba", "#424671", "#b1b8fa",
            "#e3953d", "#714542", "#b6856e")

names(colLab) <- c("FDC/MRC", "TRC", "TBRC", "MedRC/IFRC", "MedRC" , "actMedRC",
                   "PRC", "Pi16+RC", "VSMC")

colCond <- c("#446a7f", "#cb7457")
names(colCond) <- c("LTbR", "WT")

colDat <- colDat <- c(pal_npg()(10),pal_futurama()(12), pal_aaas()(10),
                      pal_jama()(8))[1:length(unique(seurat$dataset))]
names(colDat) <- unique(seurat$dataset)
DimPlot all
clustering
DimPlot(seurat, reduction = "umap", group.by = "intCluster",
        cols = colPal, raster = F, shuffle = T)+
  theme_bw() +
  theme(axis.text = element_blank(), axis.ticks = element_blank(),
        panel.grid.minor = element_blank()) +
  xlab("UMAP1") +
  ylab("UMAP2")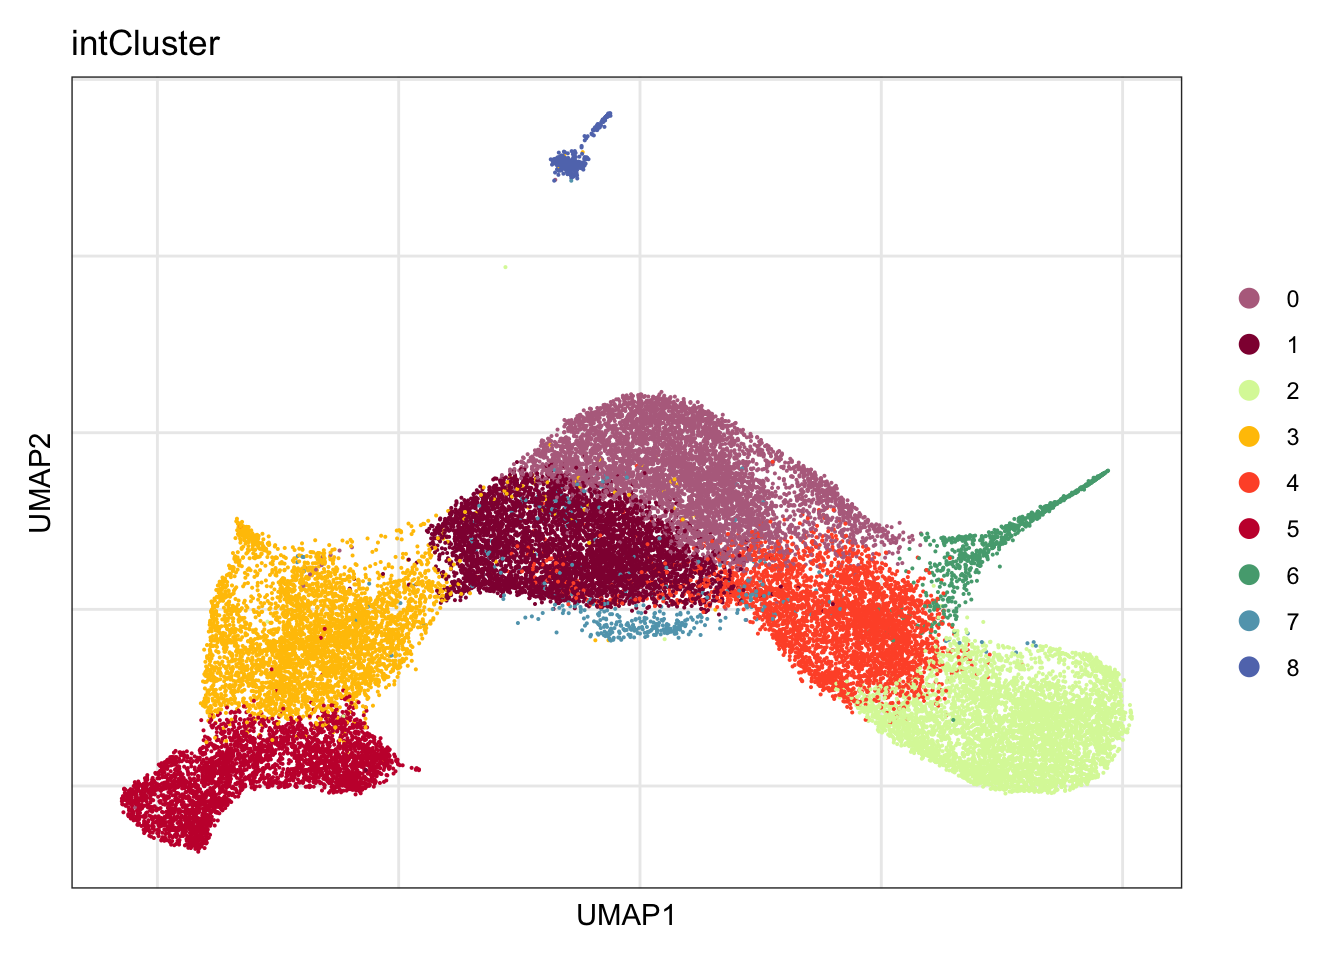
label
DimPlot(seurat, reduction = "umap", group.by = "label",
        cols = colLab, raster = F, shuffle = T)+
  theme_bw() +
  theme(axis.text = element_blank(), axis.ticks = element_blank(),
        panel.grid.minor = element_blank()) +
  xlab("UMAP1") +
  ylab("UMAP2")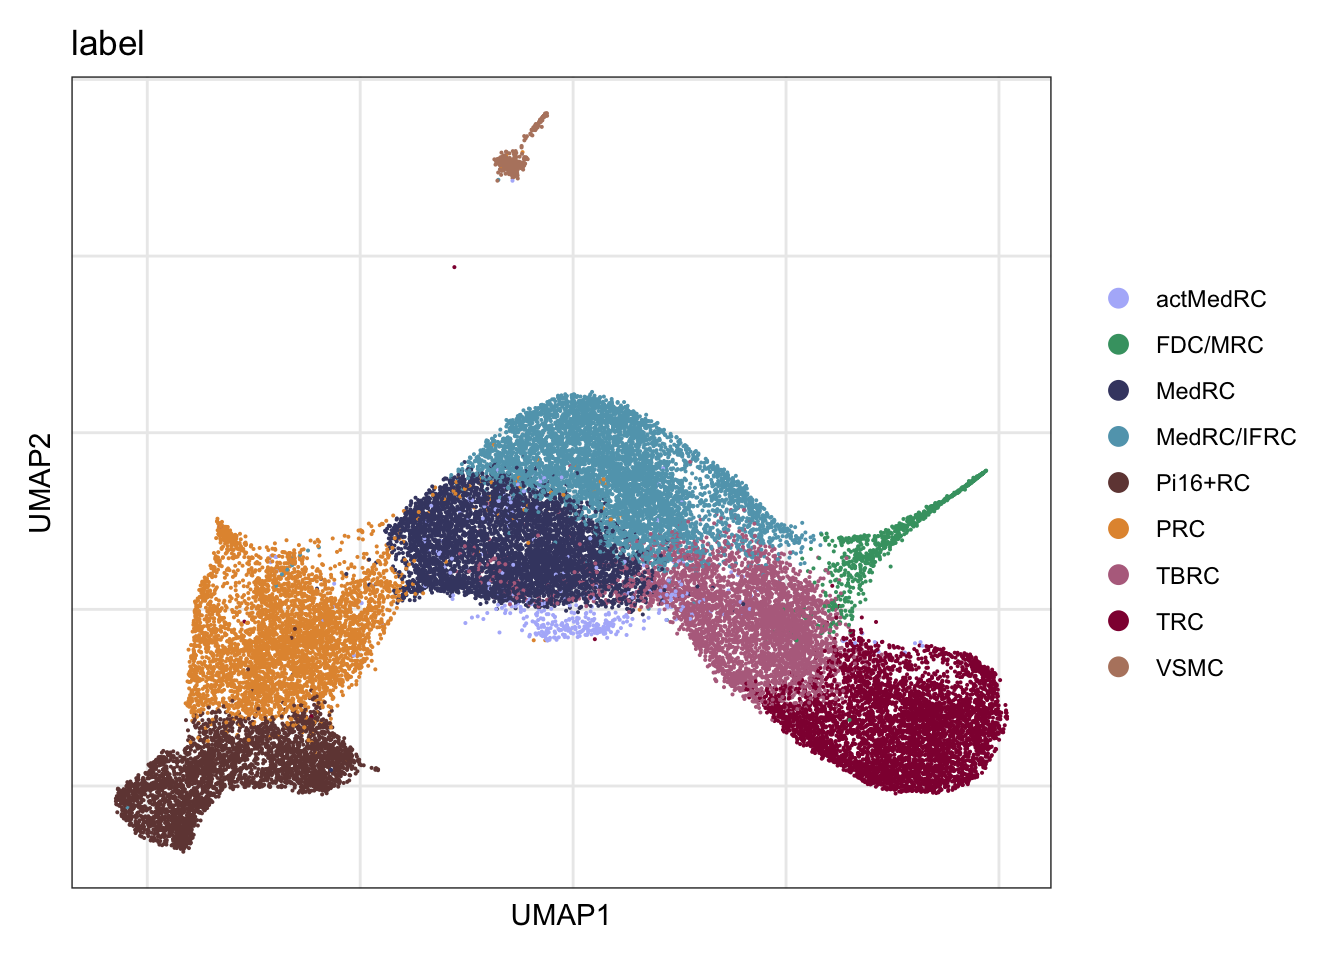
DimPlot(seurat, reduction = "umap", group.by = "label", pt.size=1,
        cols = colLab, shuffle = T)+
  theme_void()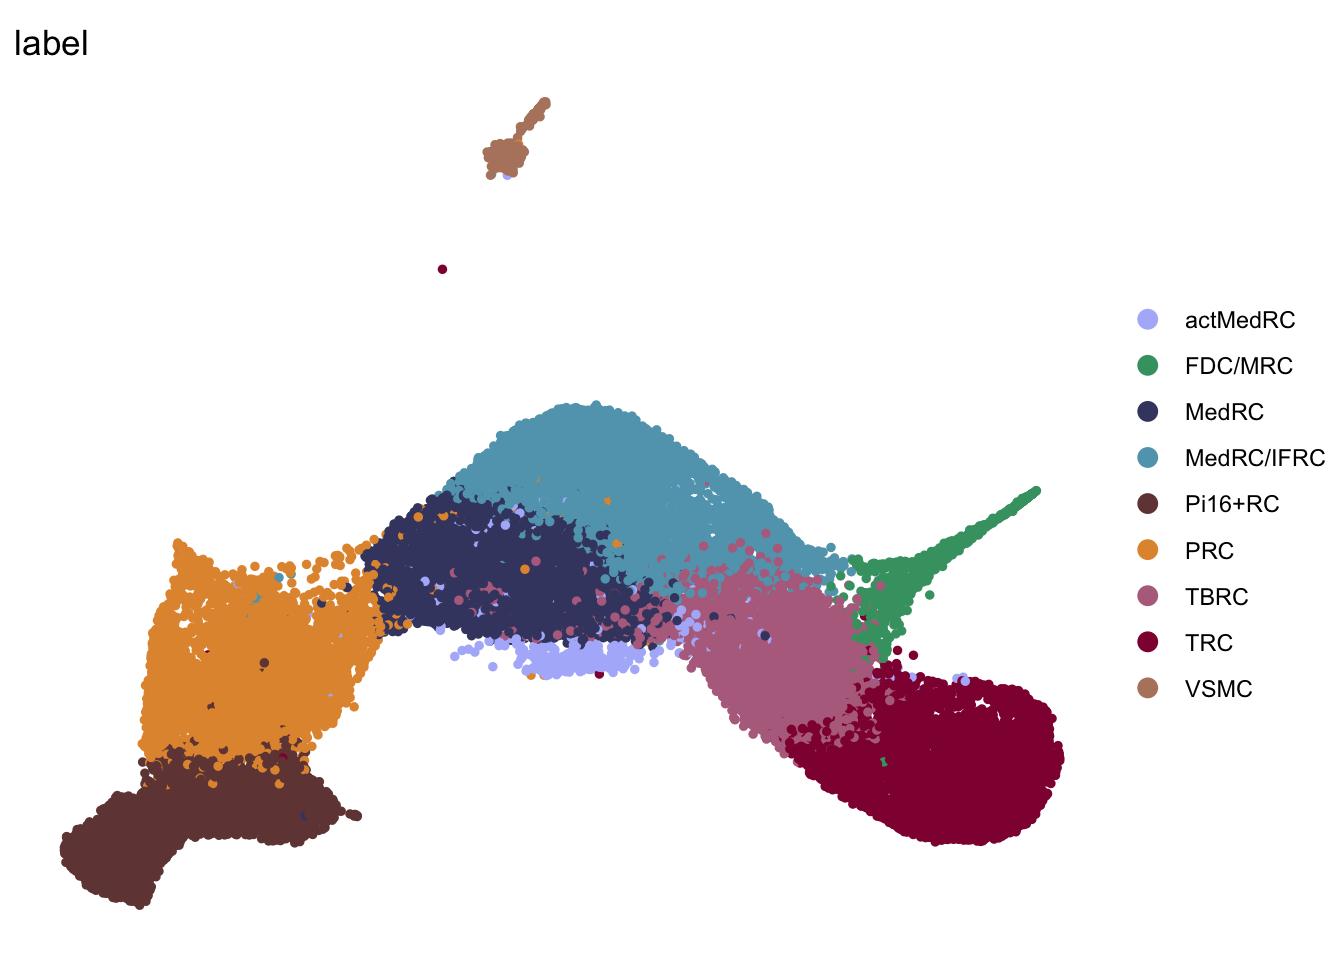
label split by location
DimPlot(seurat, reduction = "umap", group.by = "label", cols = colLab,
        split.by = "location")+
  theme_bw() +
  theme(axis.text = element_blank(), axis.ticks = element_blank(),
        panel.grid.minor = element_blank()) +
  xlab("UMAP1") +
  ylab("UMAP2")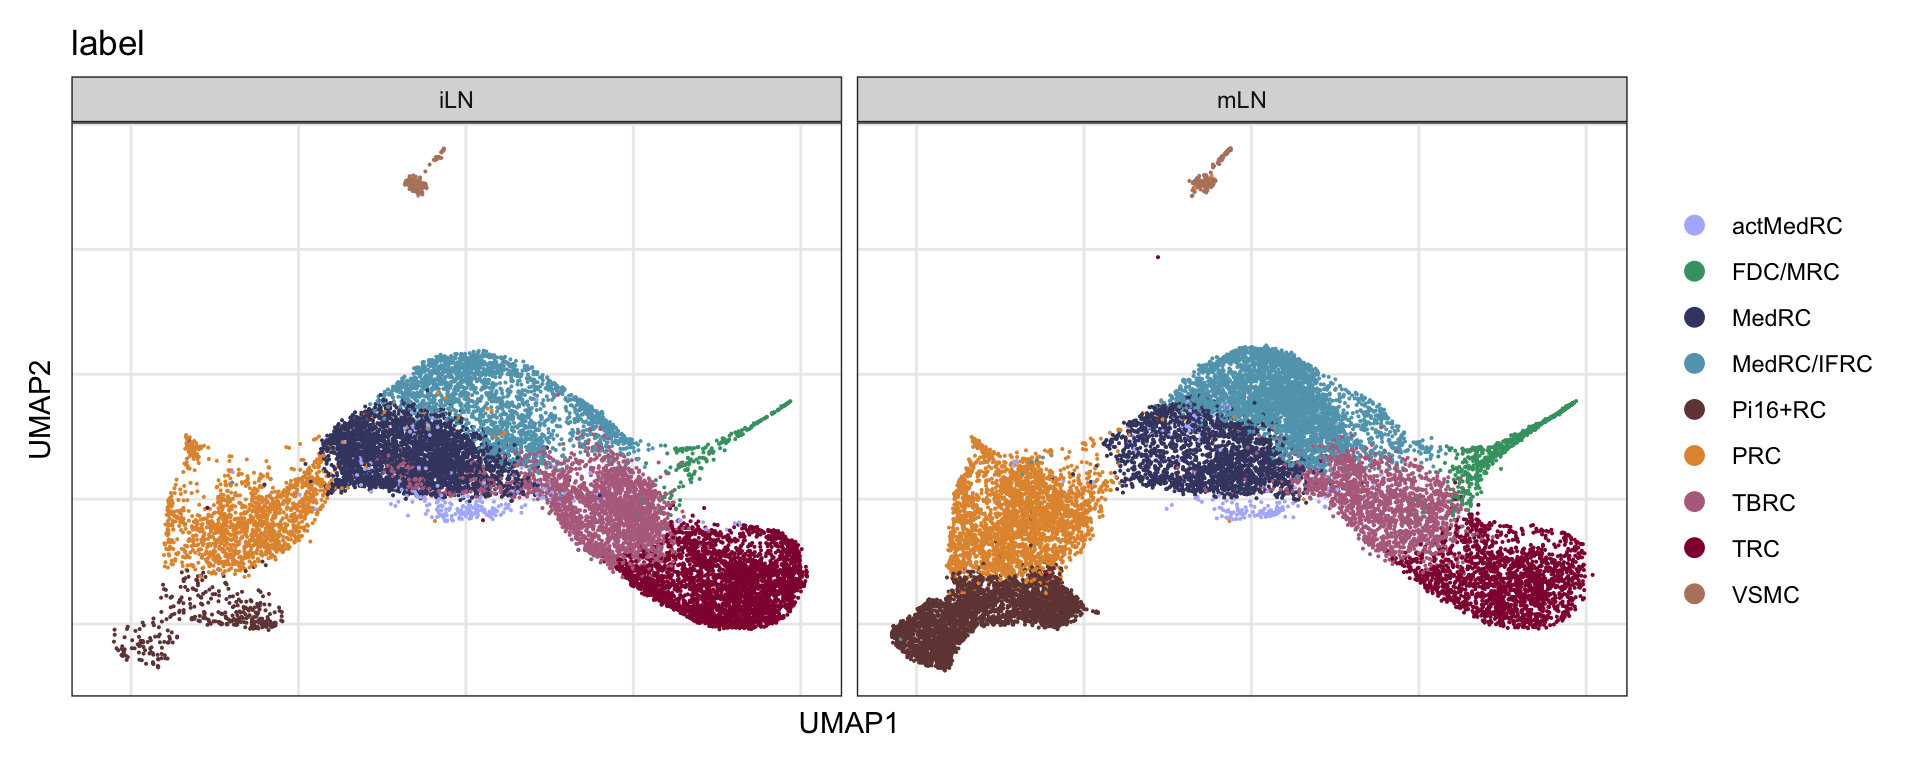
DimPlot(seurat, reduction = "umap", group.by = "label", pt.size=1,
        cols = colLab, split.by = "location", shuffle = T)+
  theme_void()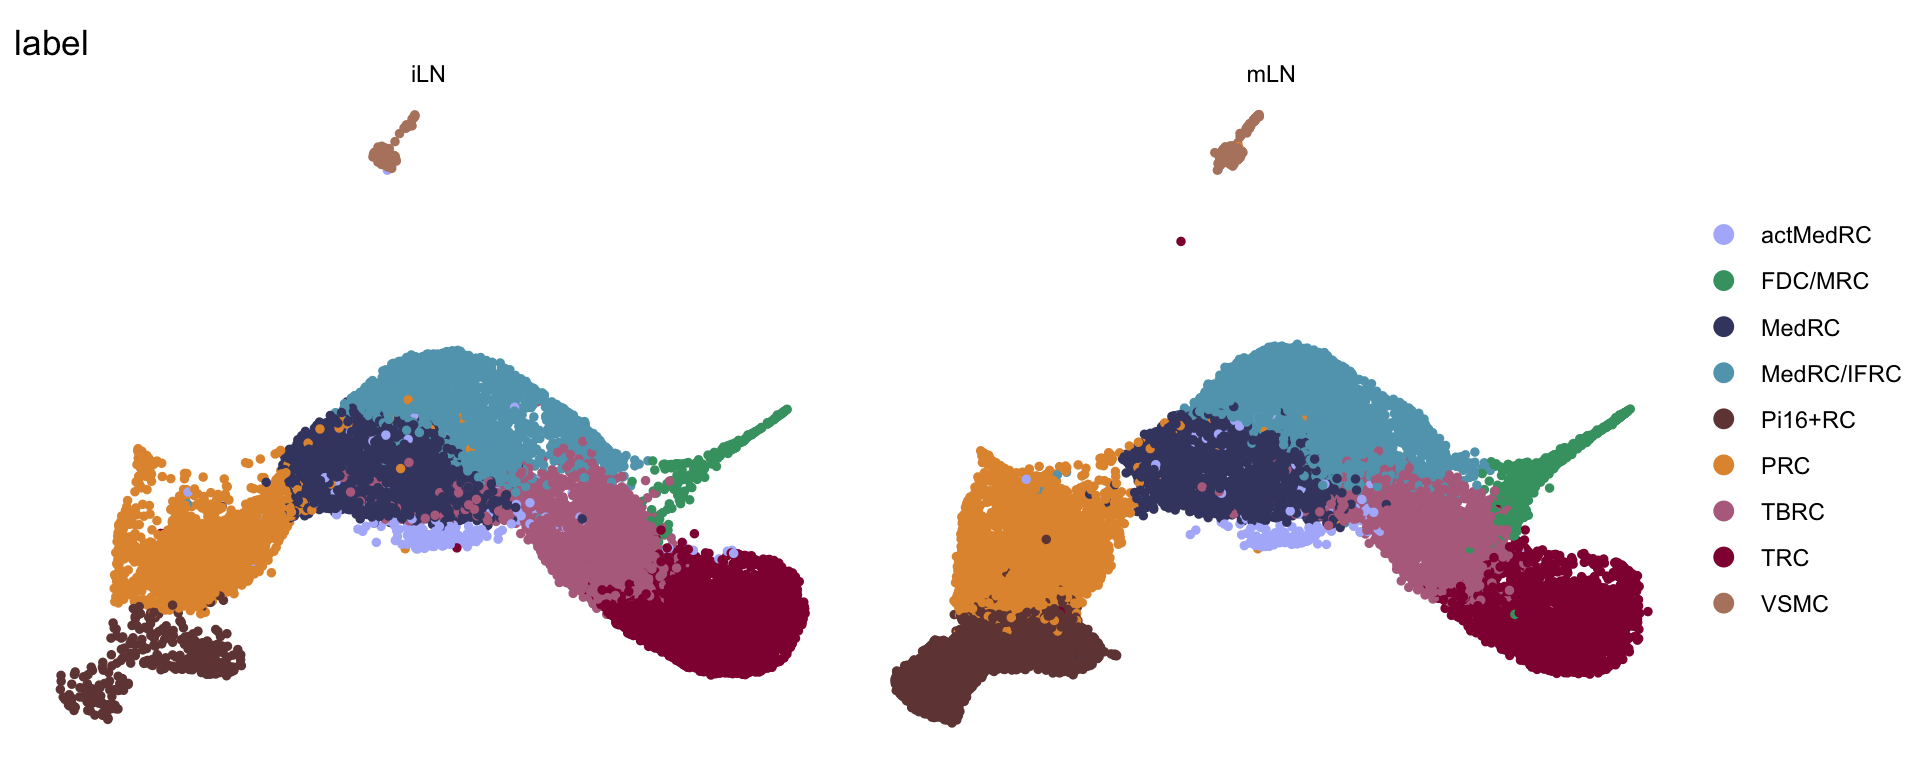
timepoint
DimPlot(seurat, reduction = "umap", group.by = "age", cols = colAge,
        raster = F, shuffle = T)+
  theme_bw() +
  theme(axis.text = element_blank(), axis.ticks = element_blank(),
        panel.grid.minor = element_blank()) +
  xlab("UMAP1") +
  ylab("UMAP2")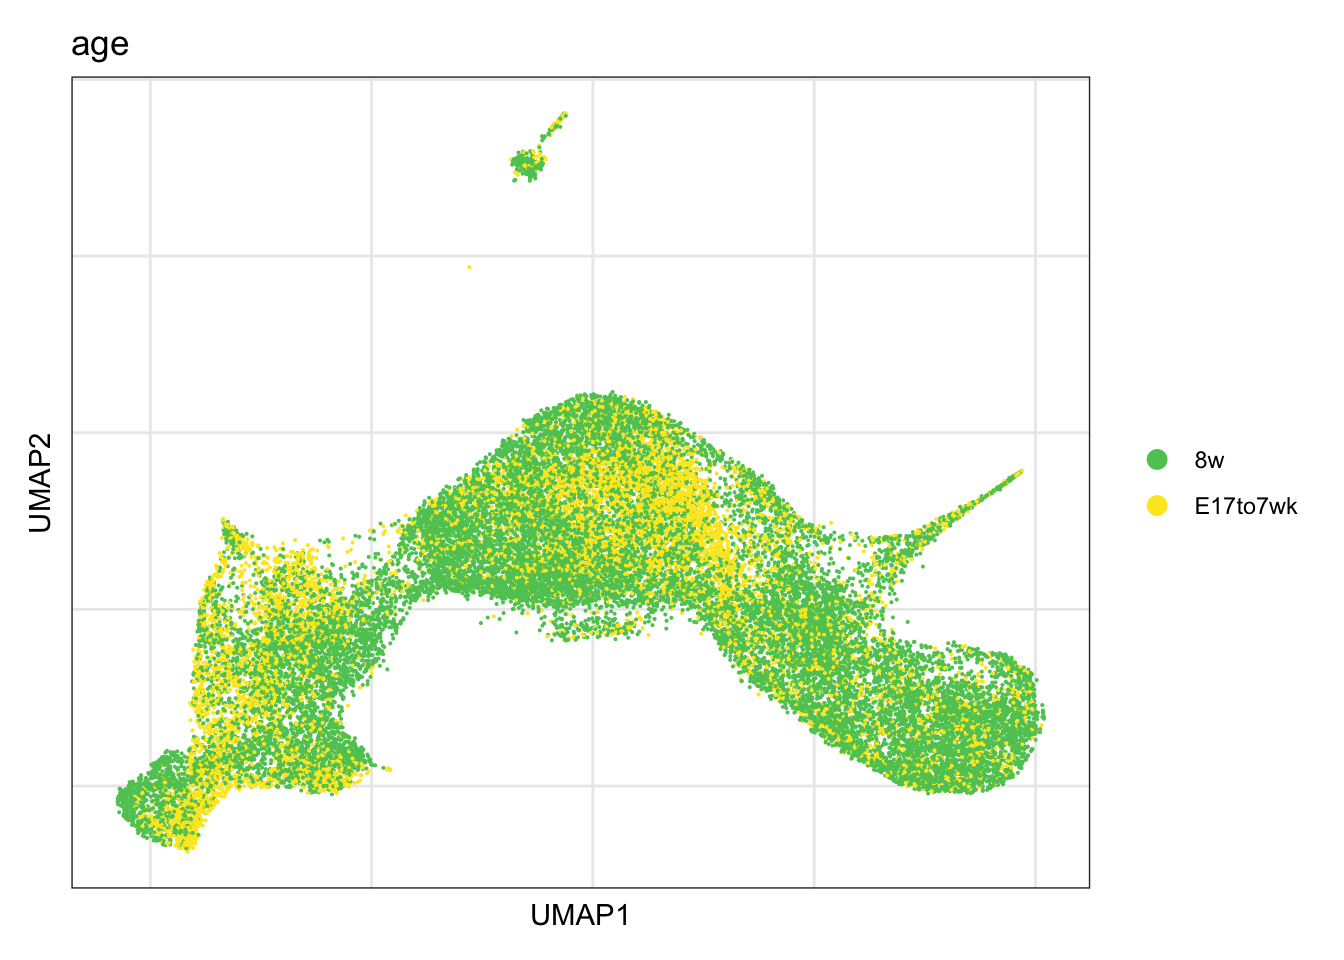
location
DimPlot(seurat, reduction = "umap", group.by = "location", cols = colLoc,
        raster = F, shuffle = T)+
  theme_bw() +
  theme(axis.text = element_blank(), axis.ticks = element_blank(),
        panel.grid.minor = element_blank()) +
  xlab("UMAP1") +
  ylab("UMAP2")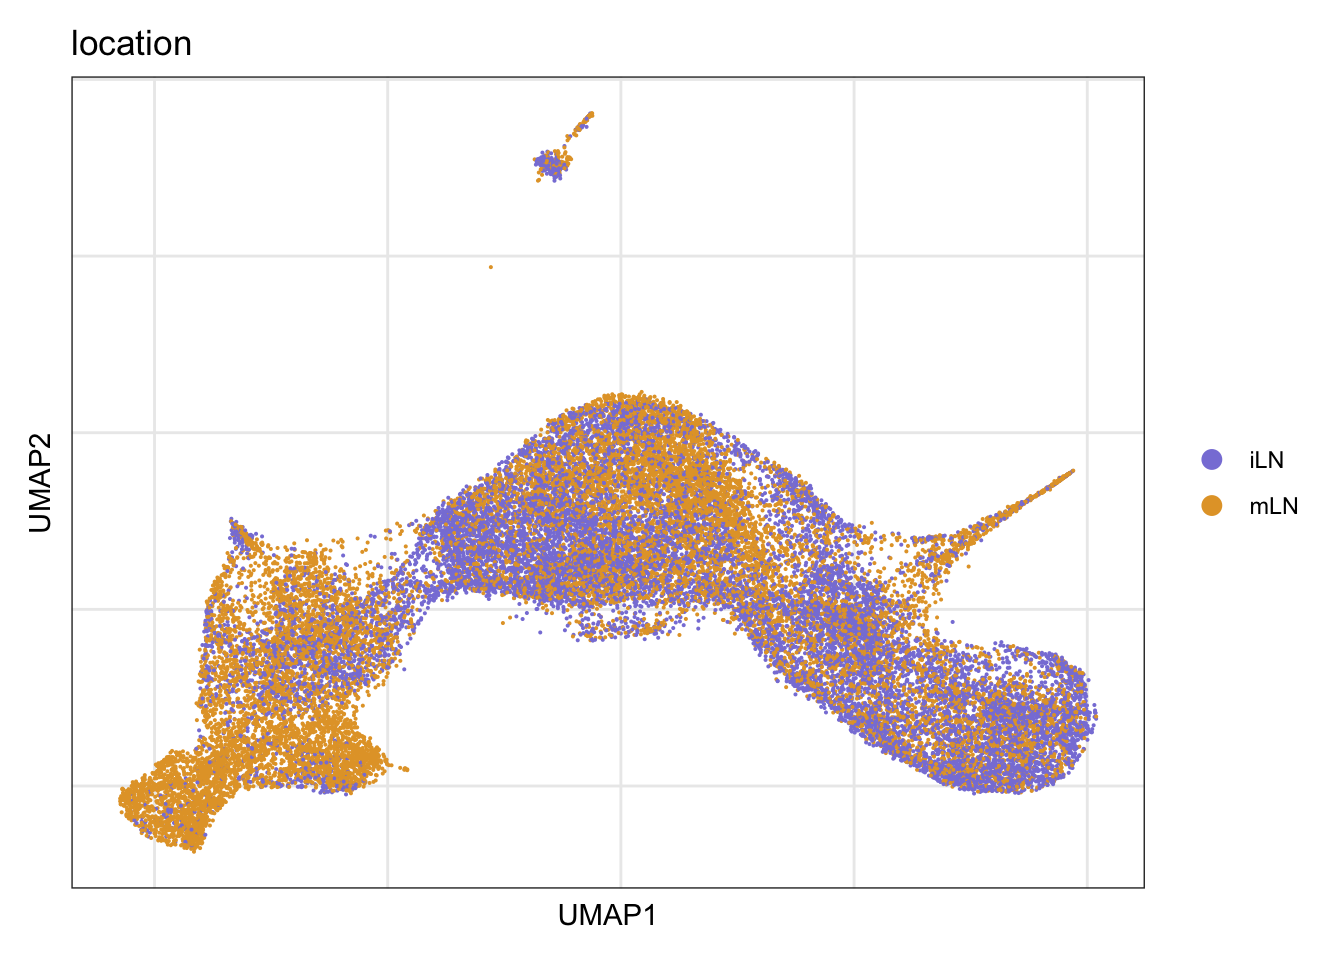
cond
DimPlot(seurat, reduction = "umap", group.by = "cond", cols = colCond,
        raster = F, shuffle = T)+
  theme_bw() +
  theme(axis.text = element_blank(), axis.ticks = element_blank(),
        panel.grid.minor = element_blank()) +
  xlab("UMAP1") +
  ylab("UMAP2")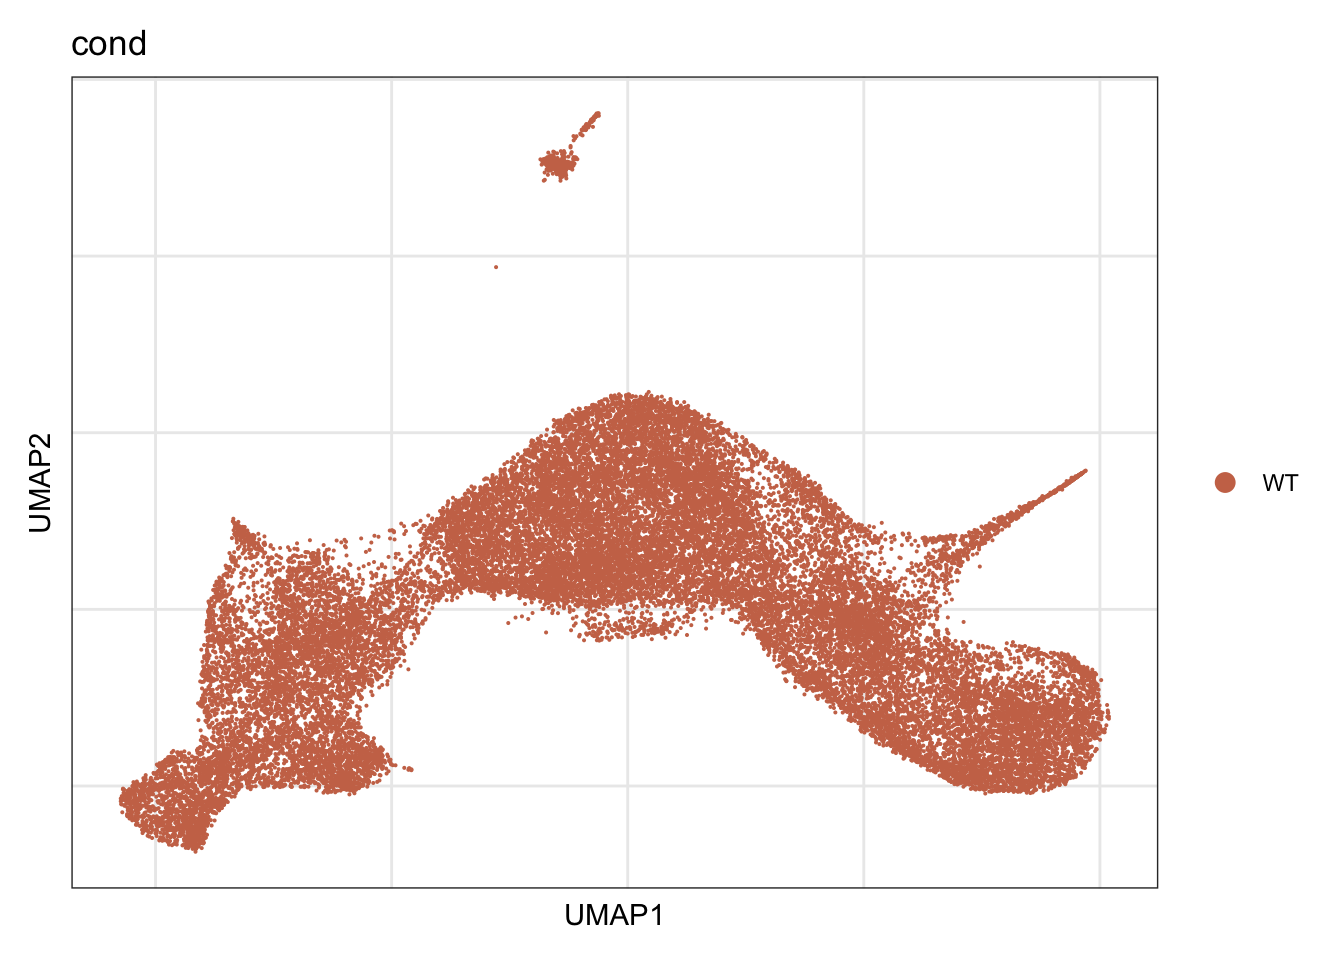
conserved Marker iLN vs mLN
Idents(seurat) <- seurat$location
consMarkerILN <- FindConservedMarkers(seurat,
                                   ident.1 = "iLN", ident.2 = "mLN",
                                   grouping.var = "label", only.pos=T)
consMarkerMLN <- FindConservedMarkers(seurat,
                                   ident.1 = "mLN", ident.2 = "iLN",
                                   grouping.var = "label", only.pos=T)

consMarkerILNDat <- consMarkerILN %>% rownames_to_column(., var="gene") %>%
  mutate(geneID=gsub("\\..*", "", gene))
consMarkerMLNDat <- consMarkerMLN %>% rownames_to_column(., var="gene") %>%
  mutate(geneID=gsub("\\..*", "", gene))


egoILN <- enrichGO(gene      = unique(consMarkerILNDat$geneID),
                OrgDb         = org.Mm.eg.db,
                keyType       = 'ENSEMBL',
                ont           = "BP",
                pAdjustMethod = "BH",
                pvalueCutoff  = 0.05,
                qvalueCutoff  = 0.05)
egoILN <- setReadable(egoILN, OrgDb = org.Mm.eg.db)
egoILN <- egoILN@result %>% filter(p.adjust < 0.1) %>%
    mutate(location="iLN")

egoMLN <- enrichGO(gene      = unique(consMarkerMLNDat$geneID),
                OrgDb         = org.Mm.eg.db,
                keyType       = 'ENSEMBL',
                ont           = "BP",
                pAdjustMethod = "BH",
                pvalueCutoff  = 0.05,
                qvalueCutoff  = 0.05)
egoMLN <- setReadable(egoMLN, OrgDb = org.Mm.eg.db)
egoMLN <- egoMLN@result %>% filter(p.adjust < 0.1) %>%
    mutate(location="mLN")


selGO <- c("GO:0048706", "GO:0007389", "GO:0003002")
selGODat <- egoILN %>% filter(ID %in% selGO) %>% add_row(., egoMLN) %>%
  mutate(qscore=-log(p.adjust, base=10))

p <- ggbarplot(selGODat, x = "Description", y = "qscore",
          fill = "location",
          color = "location",
          palette = colLoc,
          sort.val = "asc",
          sort.by.groups = TRUE
          #x.text.angle = 90
          ) +
  rotate()
p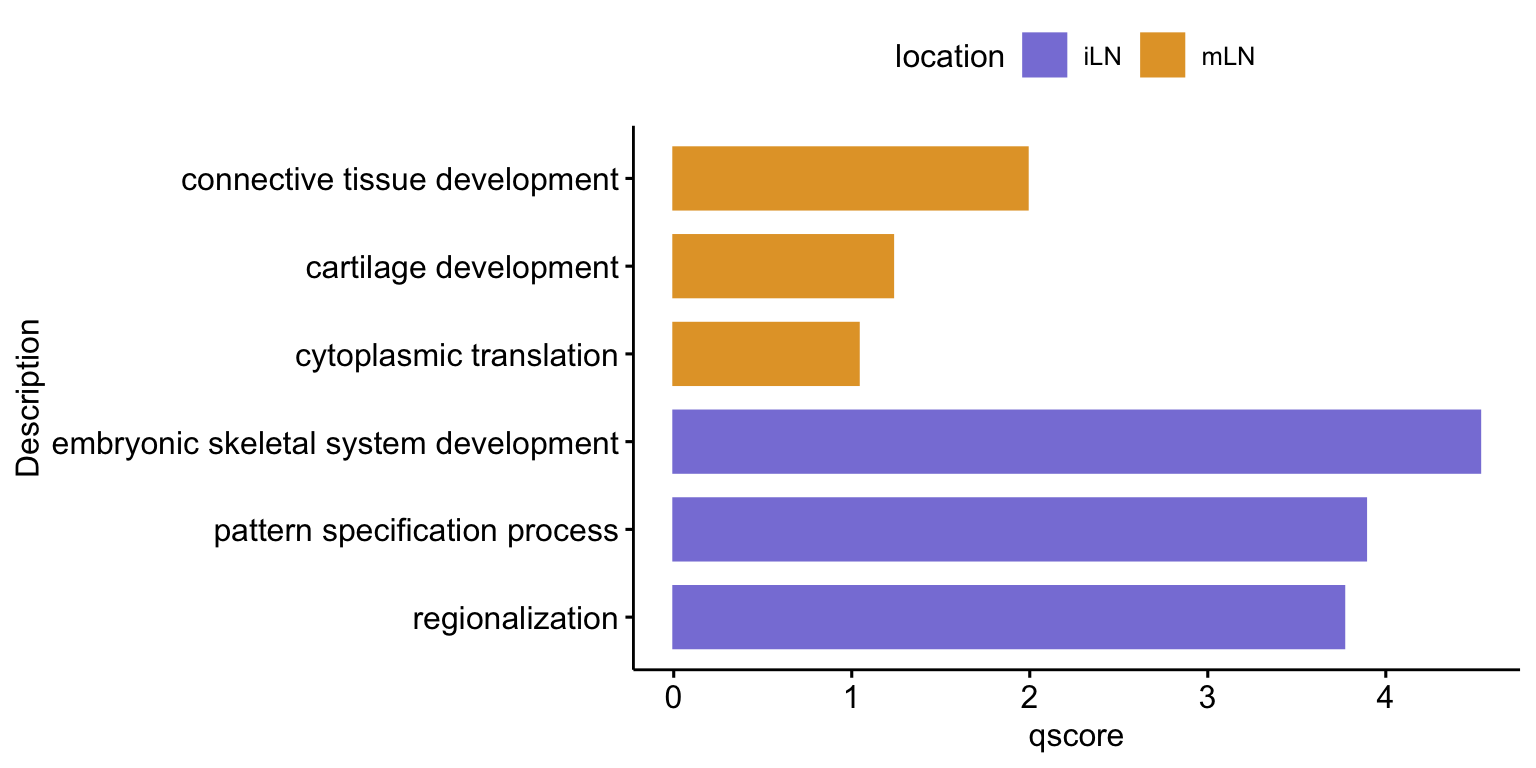
vis top DE genes
avg Heatmap
consMarkerILNDat <- consMarkerILN %>% rownames_to_column(., var="geneID") %>%
  mutate(gene=gsub(".*\\.", "", geneID)) %>% slice_min(., max_pval, n=30) %>%
  slice_min(., minimump_p_val, n=15)
consMarkerMLNDat <- consMarkerMLN %>% rownames_to_column(., var="geneID") %>%
  mutate(gene=gsub(".*\\.", "", geneID)) %>% slice_min(., max_pval, n=30) %>%
  slice_min(., minimump_p_val, n=15)

seurat$label_plus_loc <- paste0(seurat$label, "_", seurat$location)
Idents(seurat) <- seurat$label_plus_loc
ordVec <- as.vector(t(outer(names(colLab), names(colLoc), paste, sep="_")))
seurat$label_plus_loc <- factor(seurat$label_plus_loc, levels=ordVec)

pOut <- avgHeatmap(seurat = seurat, selGenes = consMarkerILNDat,
                  colVecIdent = colLab,
                  ordVec=ordVec,
                  gapVecR=NULL, gapVecC=NULL,cc=F,
                  cr=T, condCol=T, colVecCond = colLoc)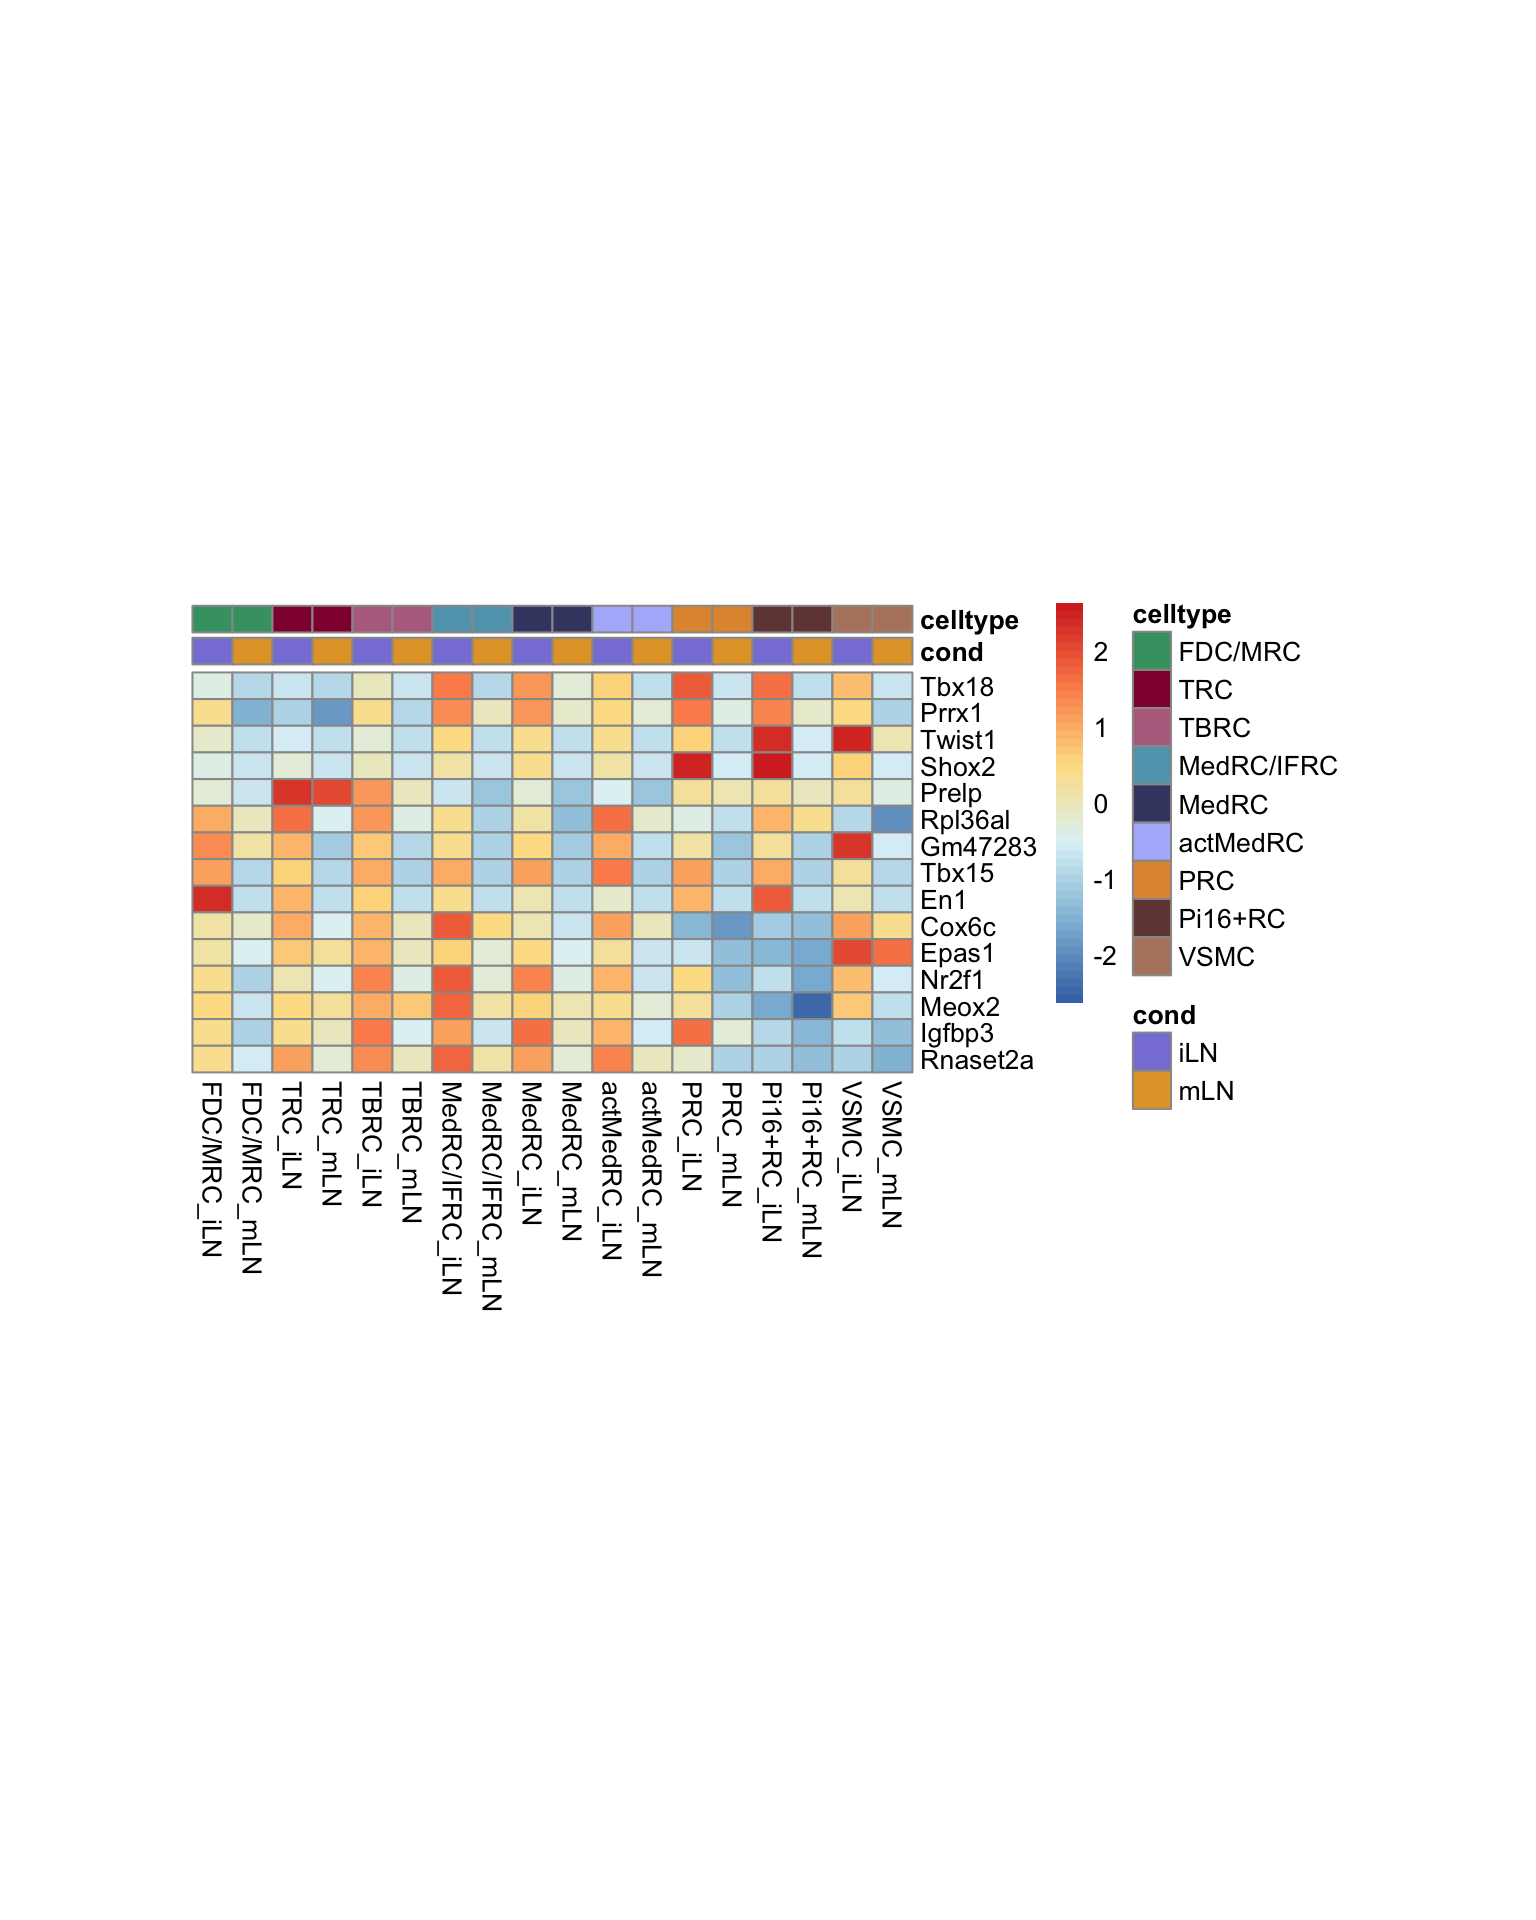
pOut <- avgHeatmap(seurat = seurat, selGenes = consMarkerMLNDat,
                  colVecIdent = colLab,
                  ordVec=ordVec,
                  gapVecR=NULL, gapVecC=NULL,cc=F,
                  cr=T, condCol=T, colVecCond = colLoc)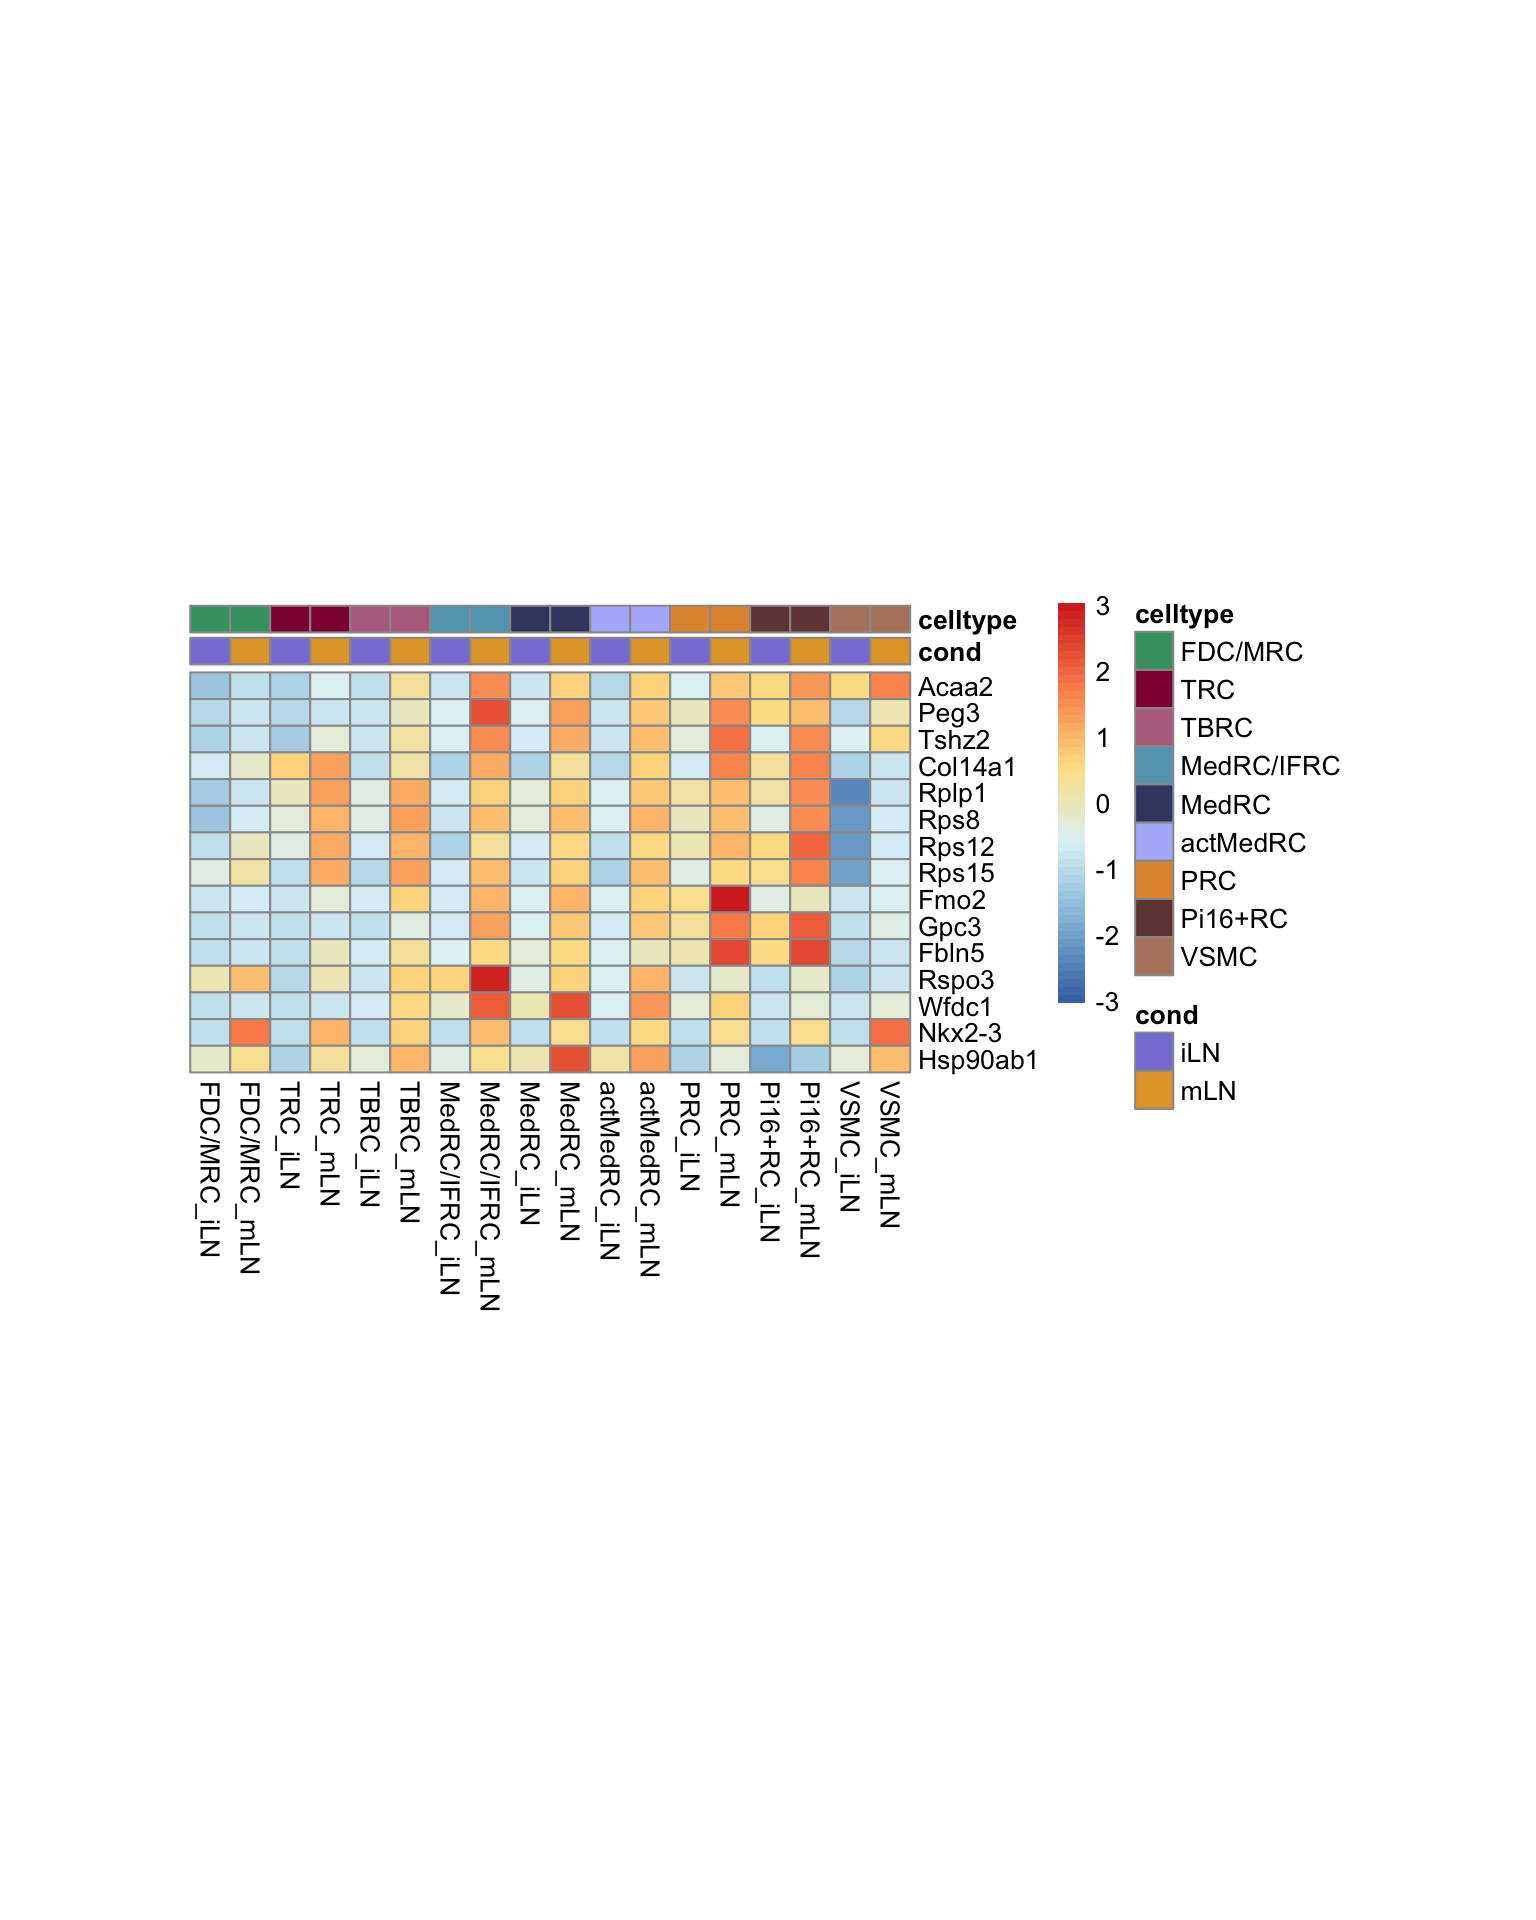
Dotplot individual LN
Idents(seurat) <- seurat$label_plus_loc

DotPlot(seurat, assay="RNA", features = rev(consMarkerILNDat$geneID), scale =T,
        cluster.idents = F) +
  scale_color_viridis_c() +
  coord_flip() +
  theme(axis.text.x = element_text(angle = 90, hjust = 1)) +
  scale_x_discrete(breaks=rev(consMarkerILNDat$geneID), labels=rev(consMarkerILNDat$gene)) +
  xlab("") + ylab("")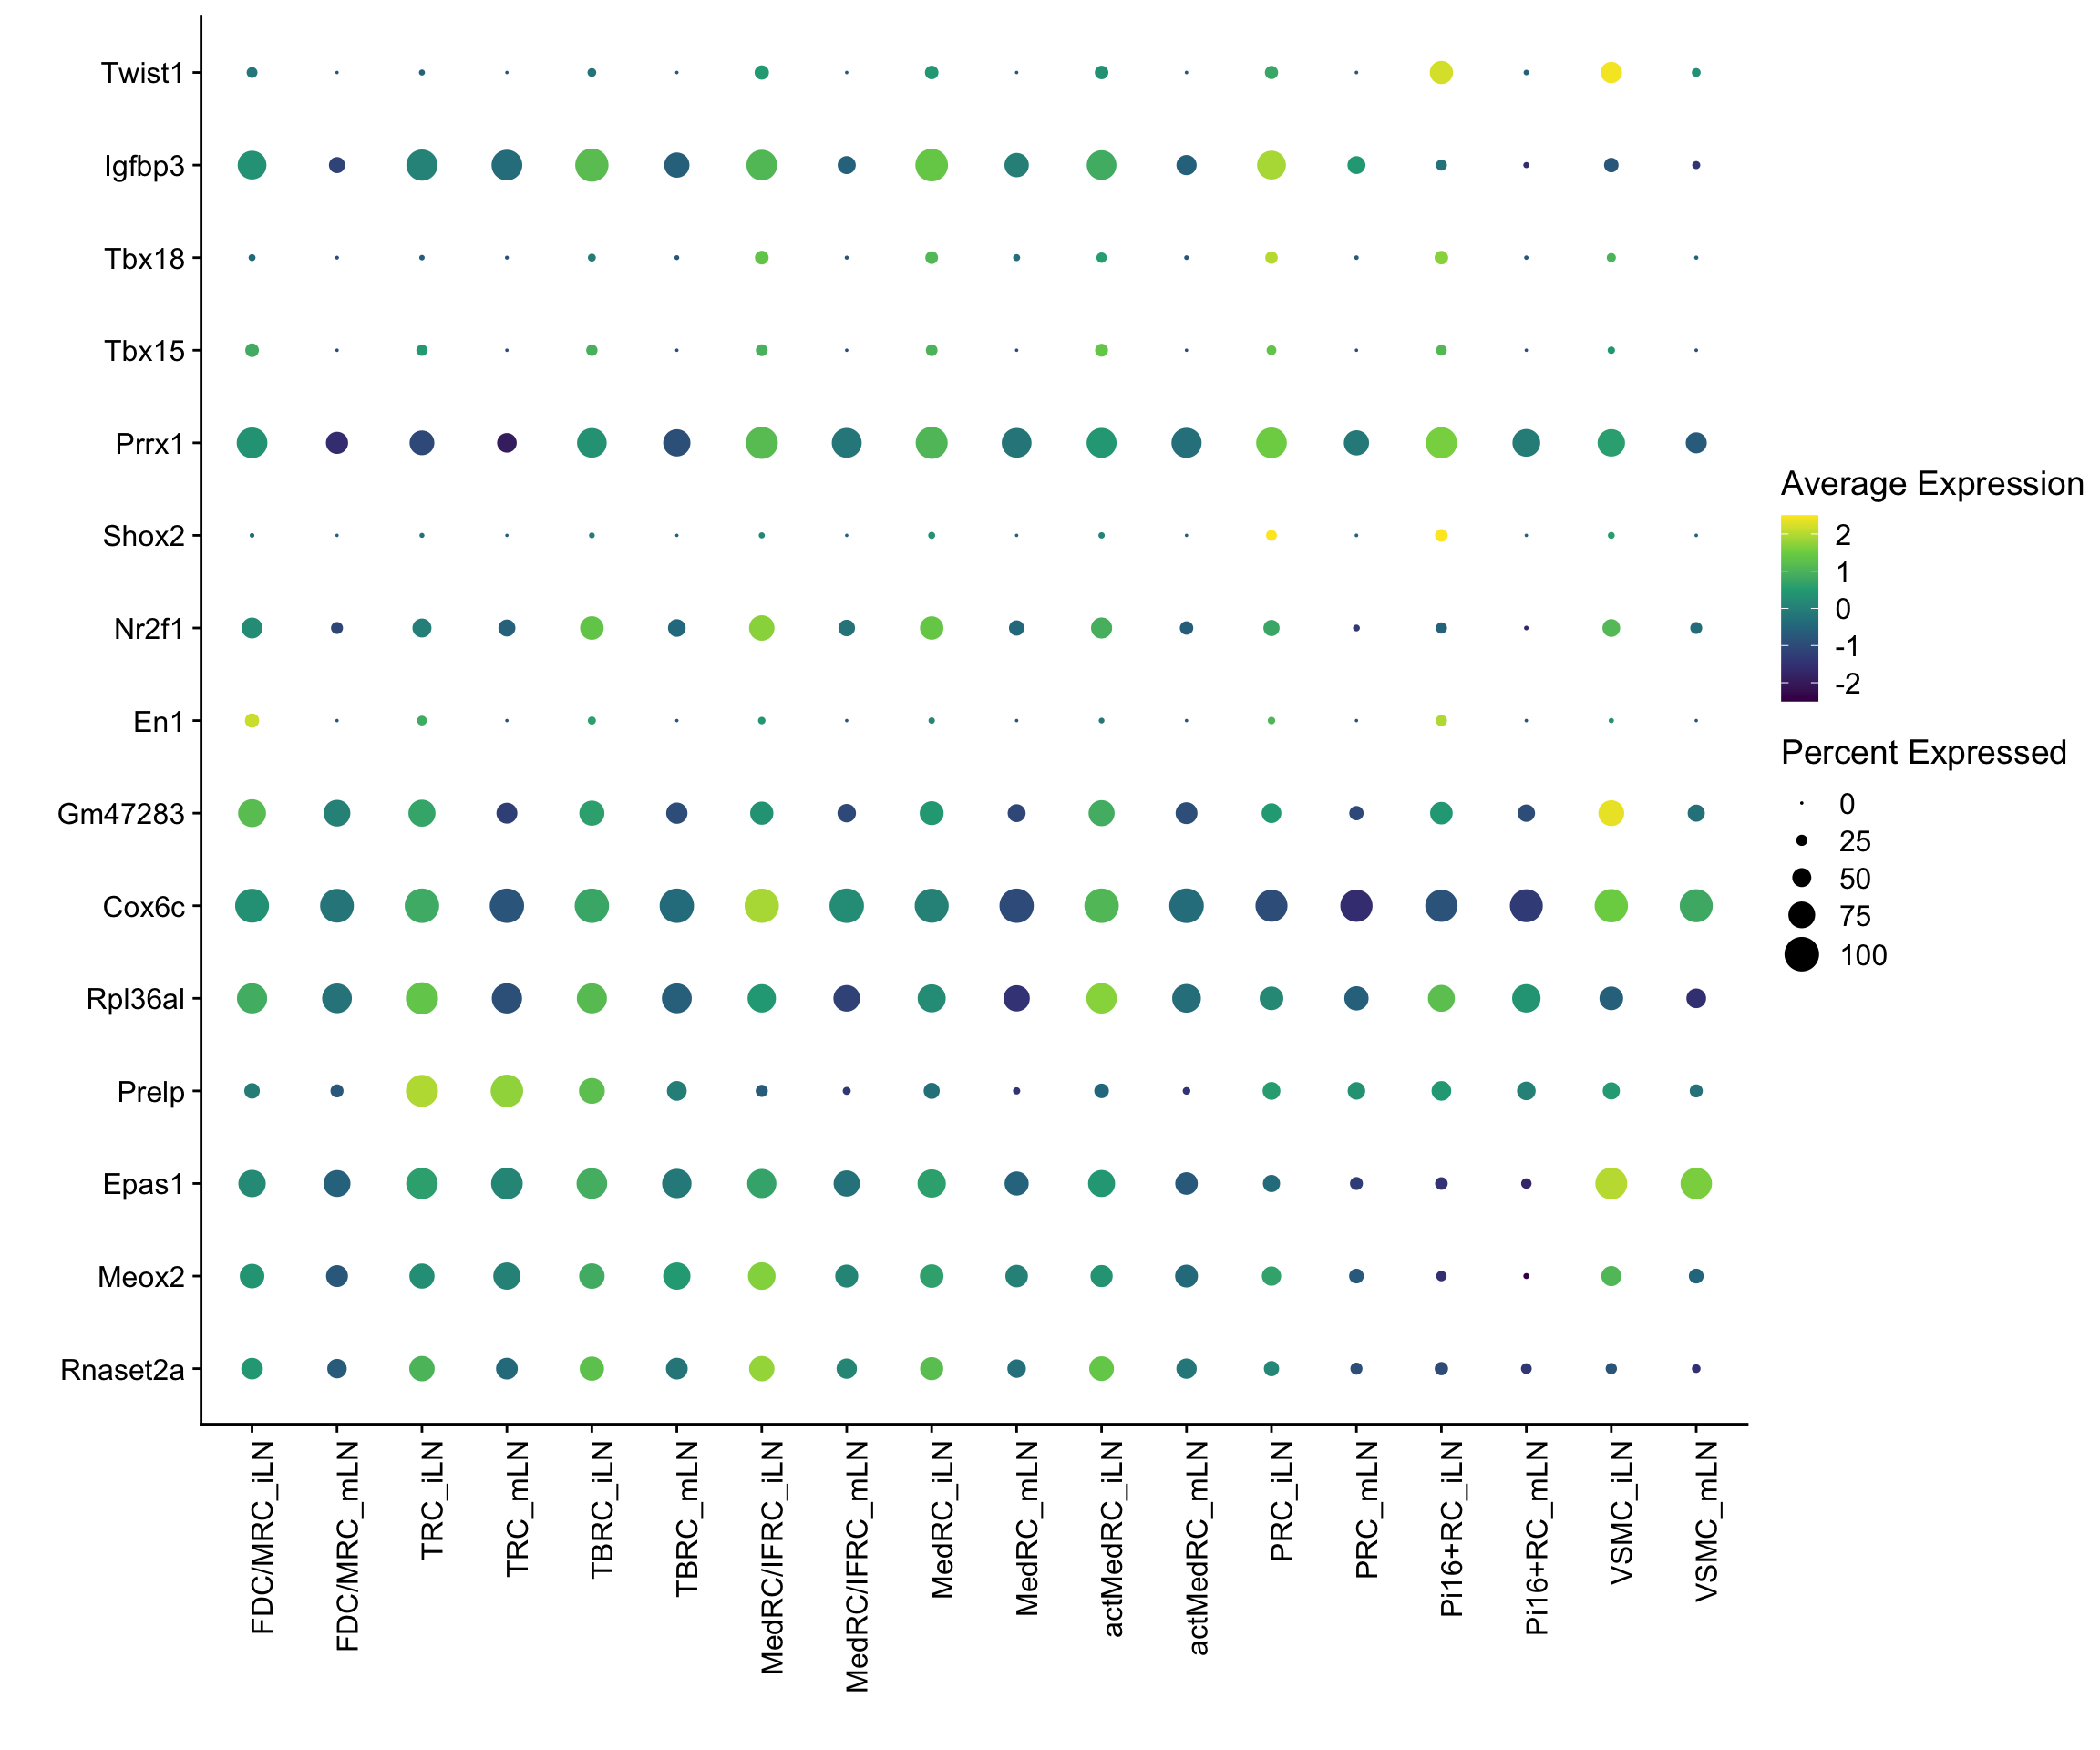
DotPlot(seurat, assay="RNA", features = rev(consMarkerMLNDat$geneID), scale =T,
        cluster.idents = F) +
  scale_color_viridis_c() +
  coord_flip() +
  theme(axis.text.x = element_text(angle = 90, hjust = 1)) +
  scale_x_discrete(breaks=rev(consMarkerMLNDat$geneID), labels=rev(consMarkerMLNDat$gene)) +
  xlab("") + ylab("")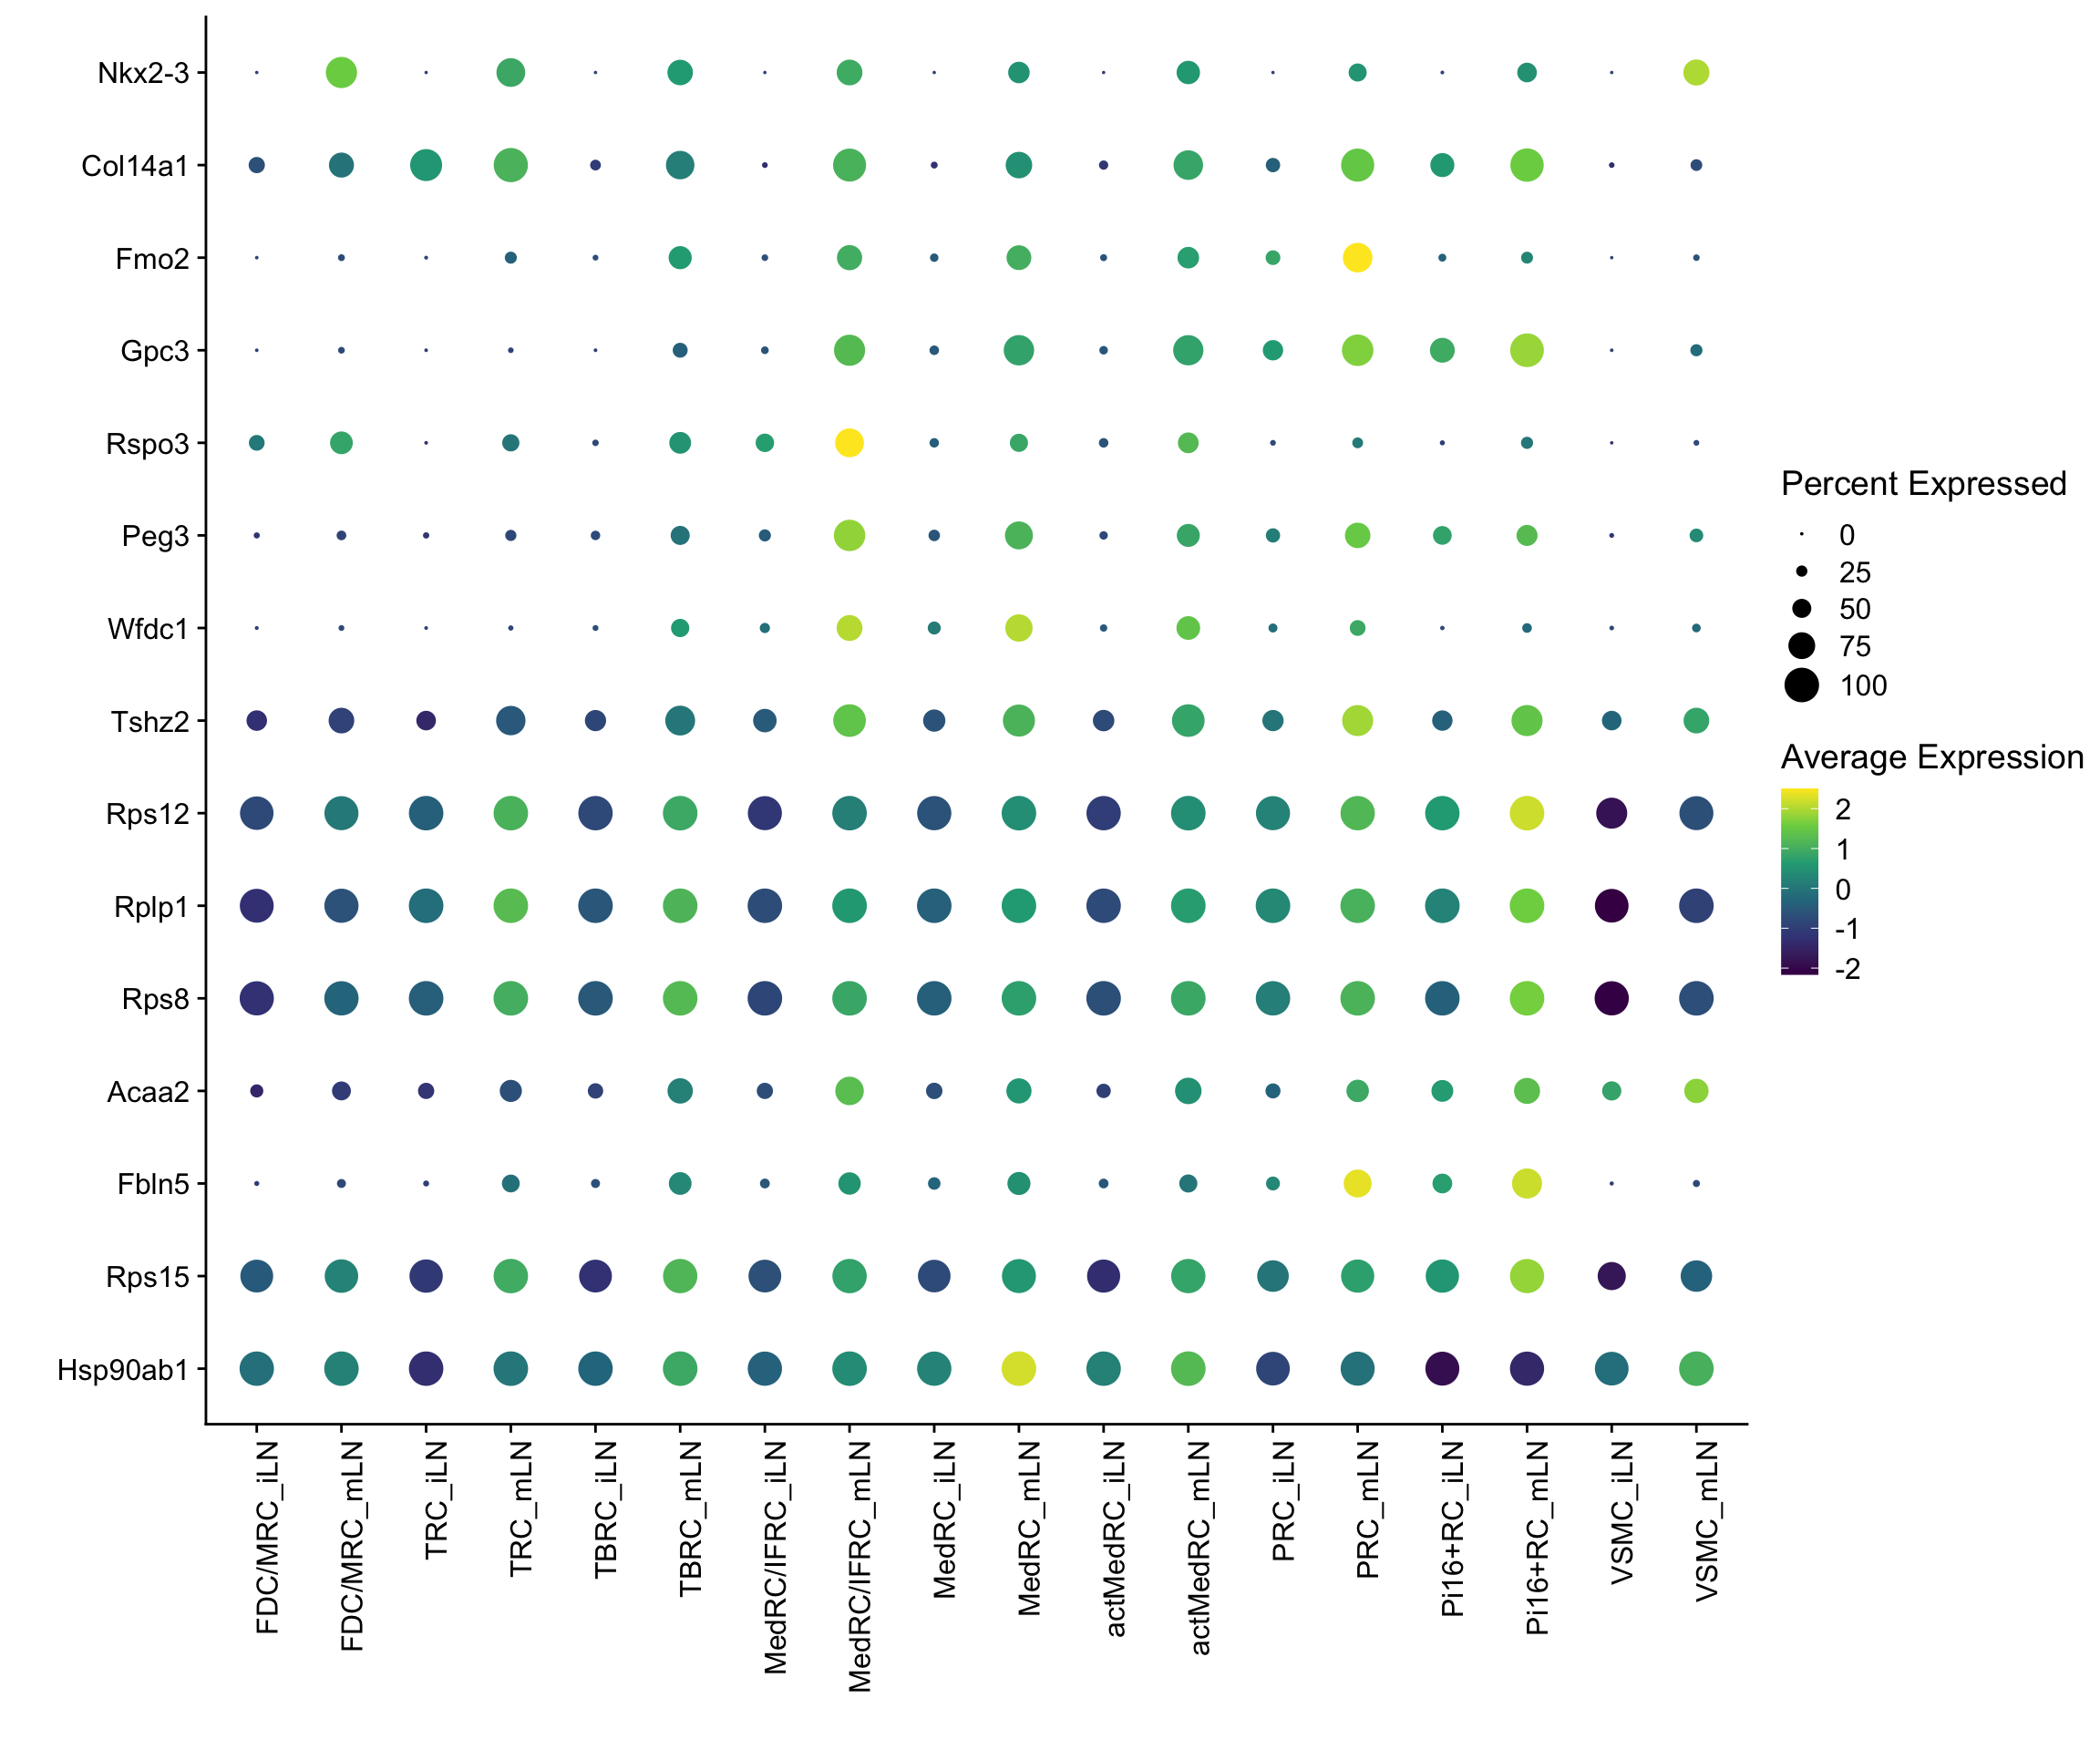
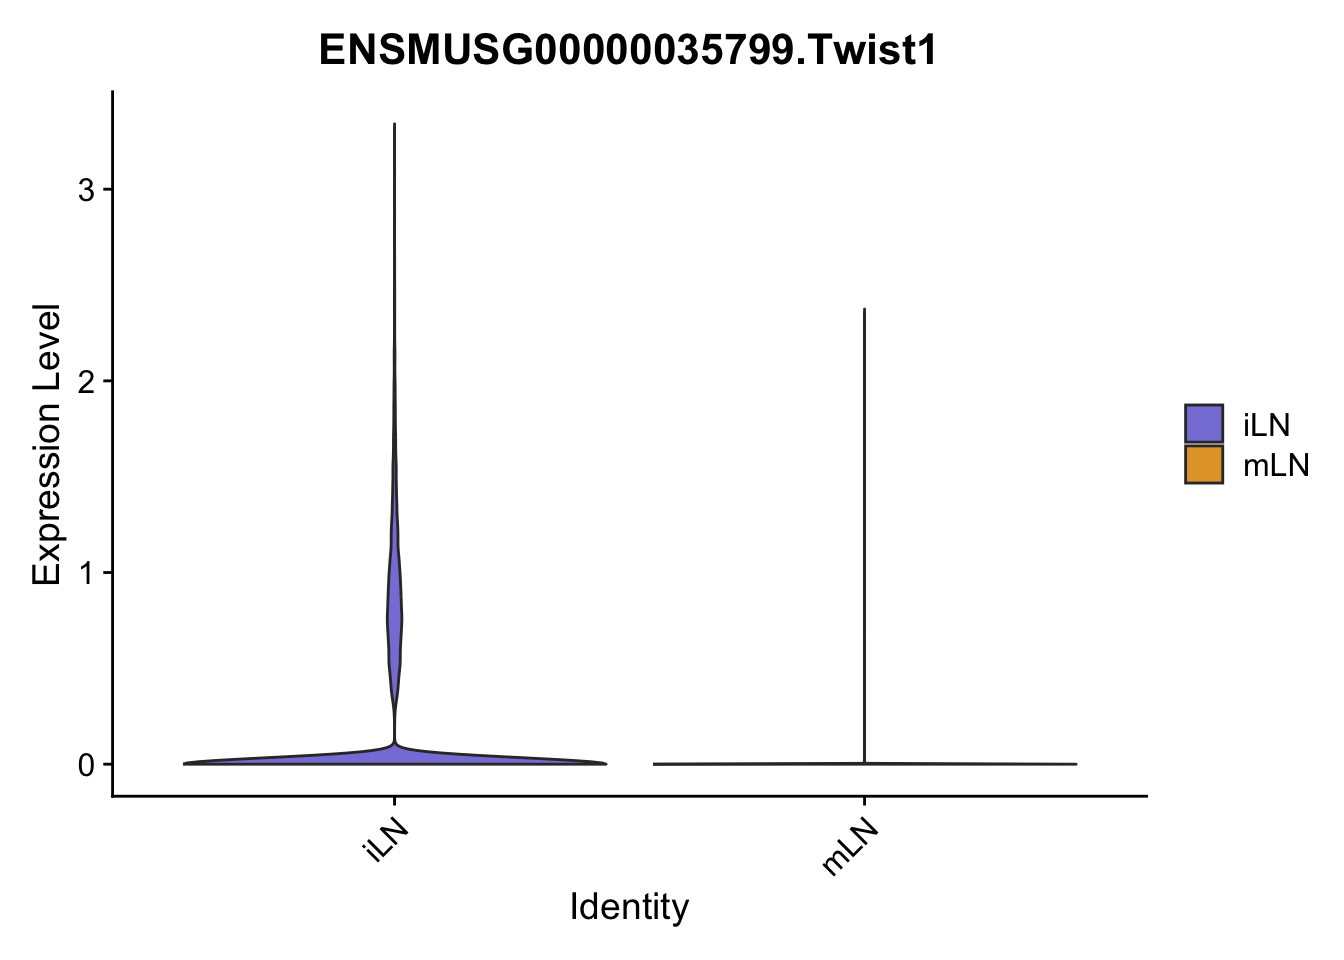
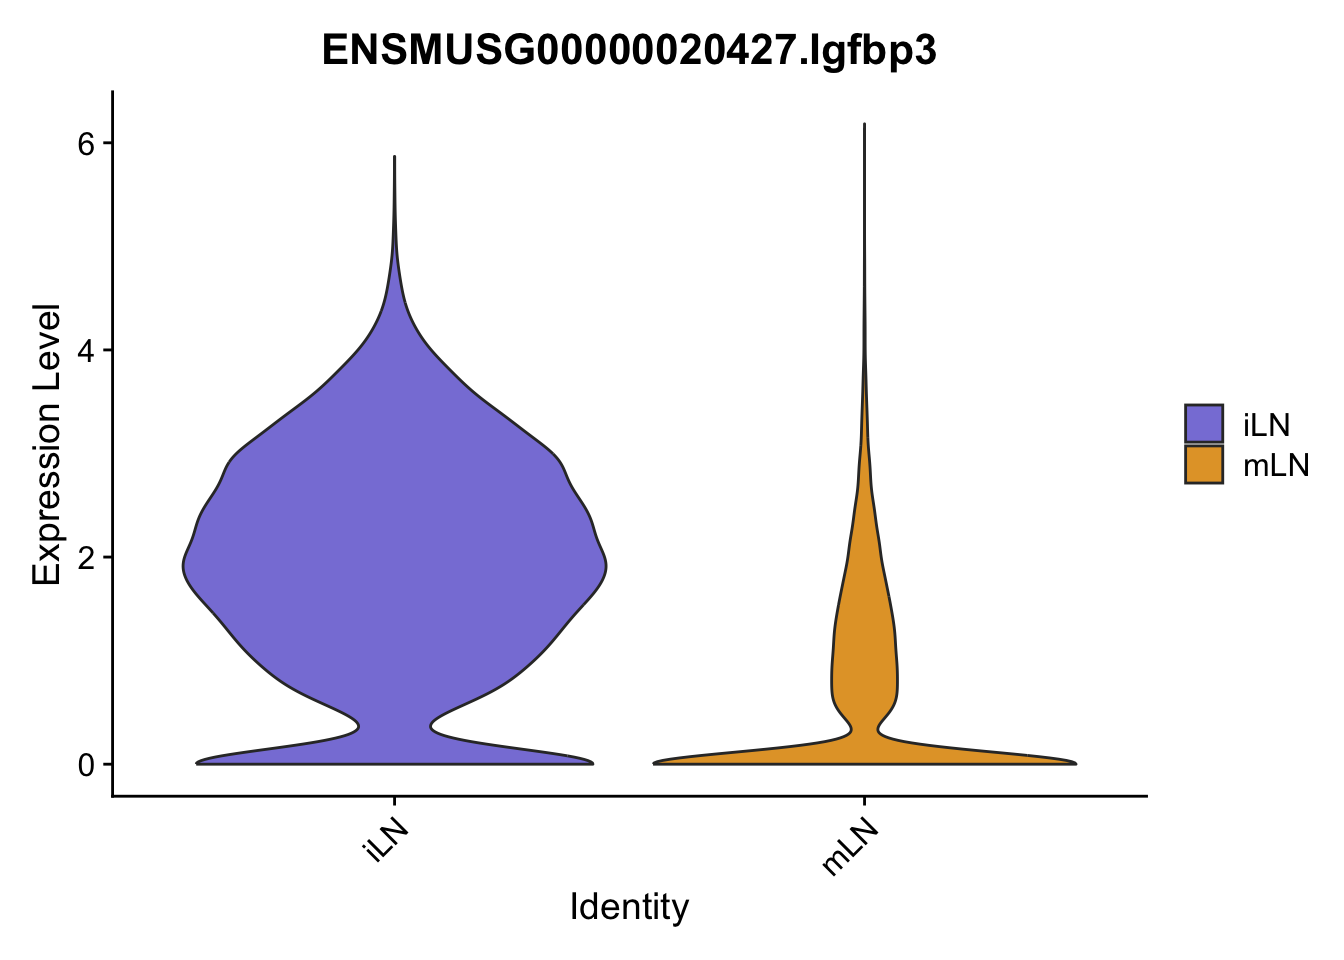
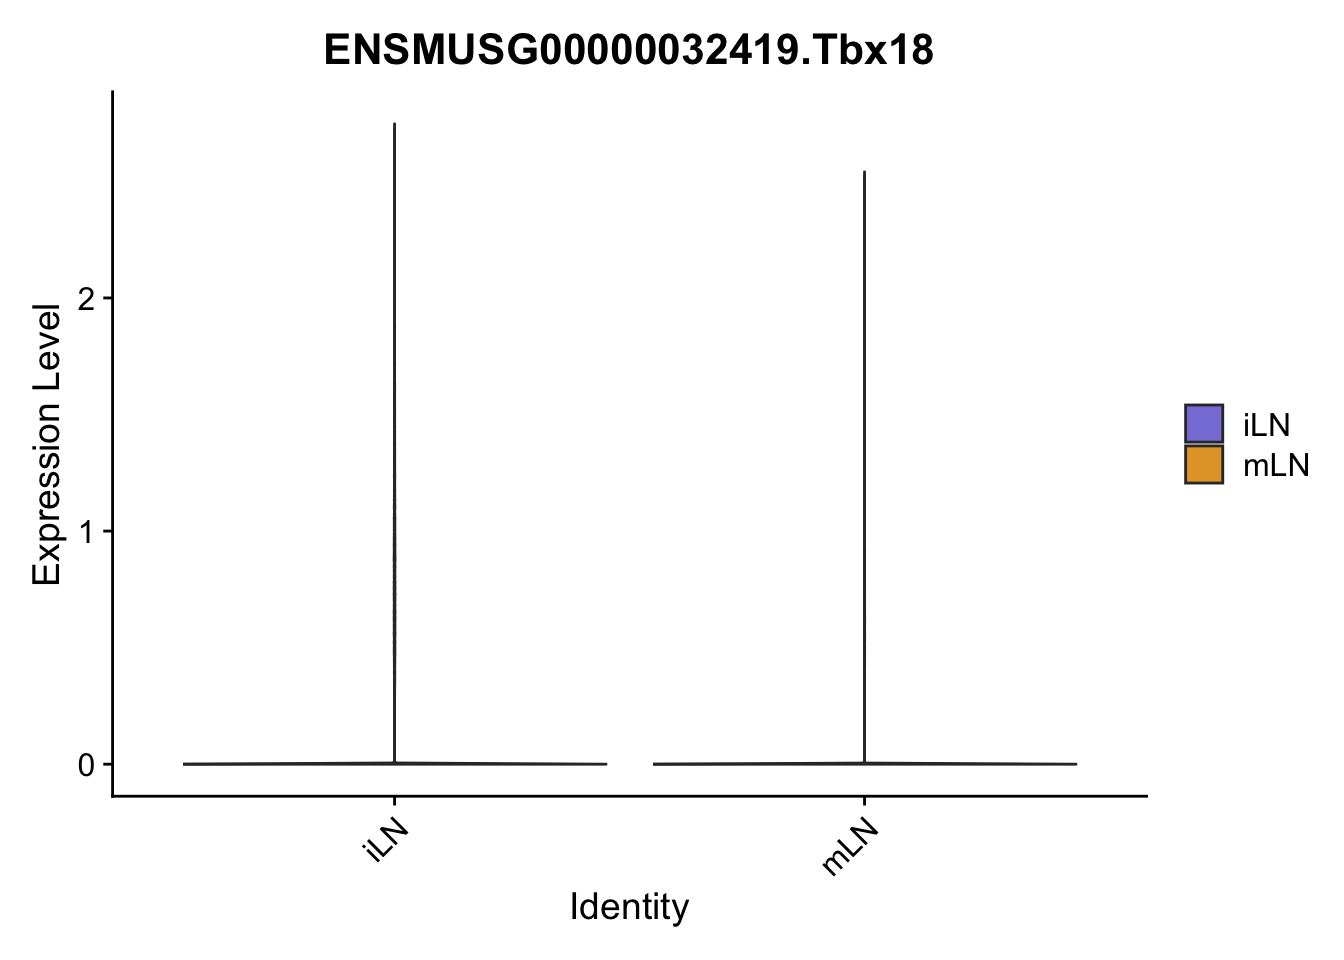
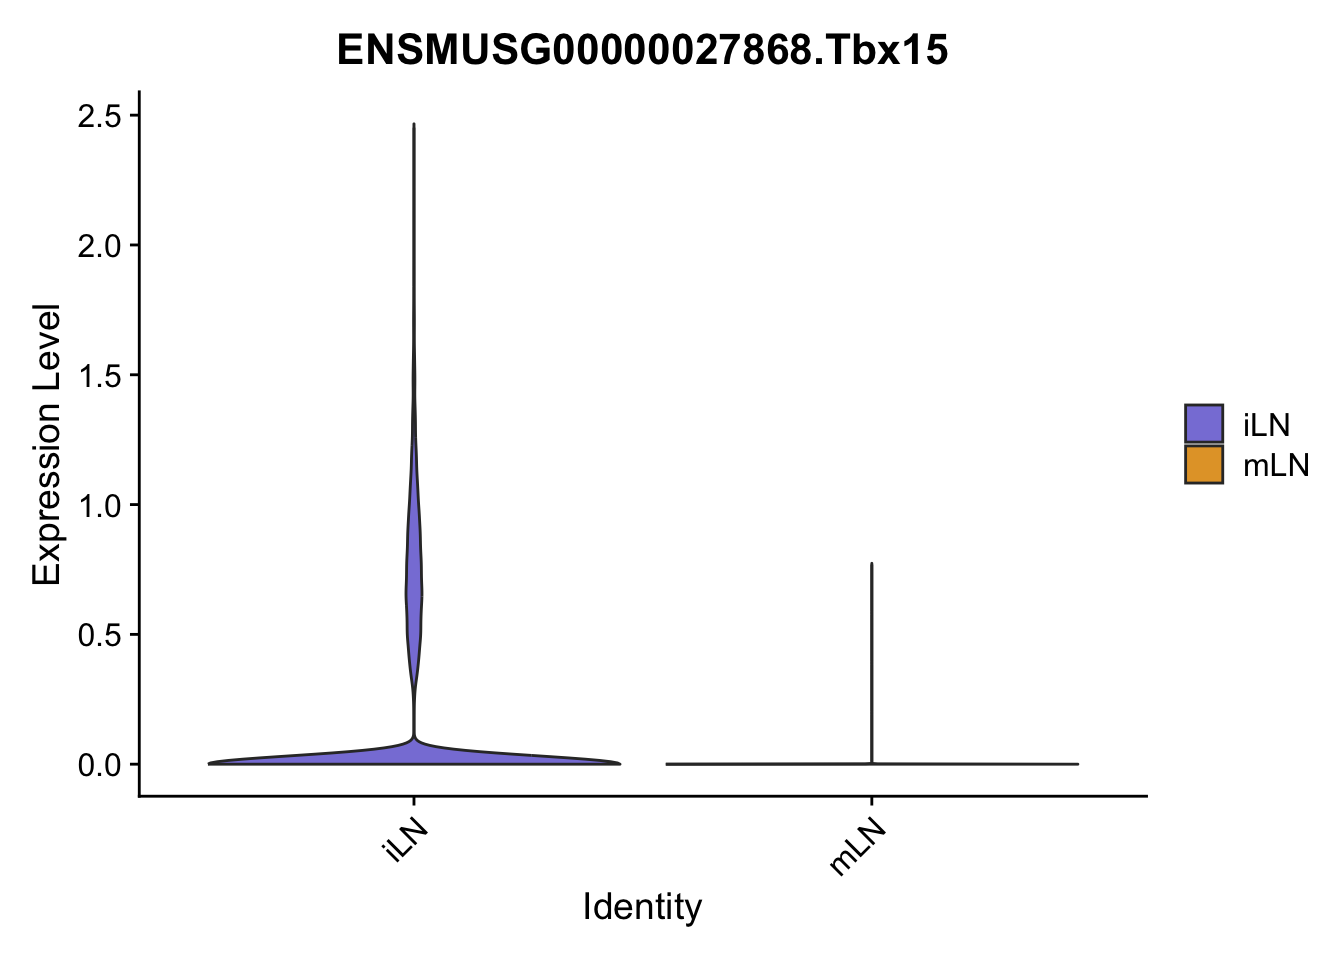
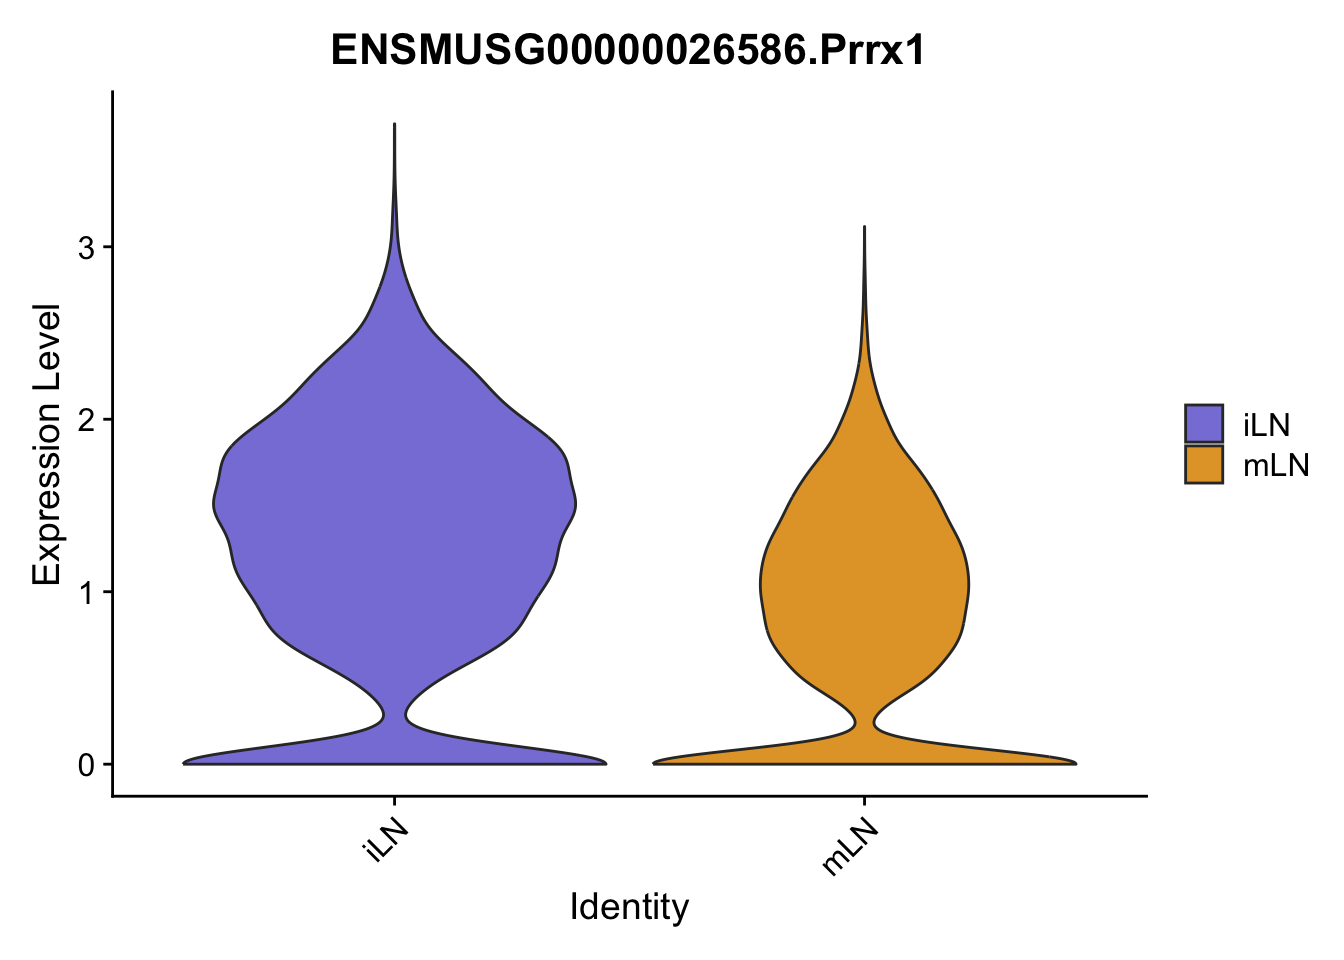
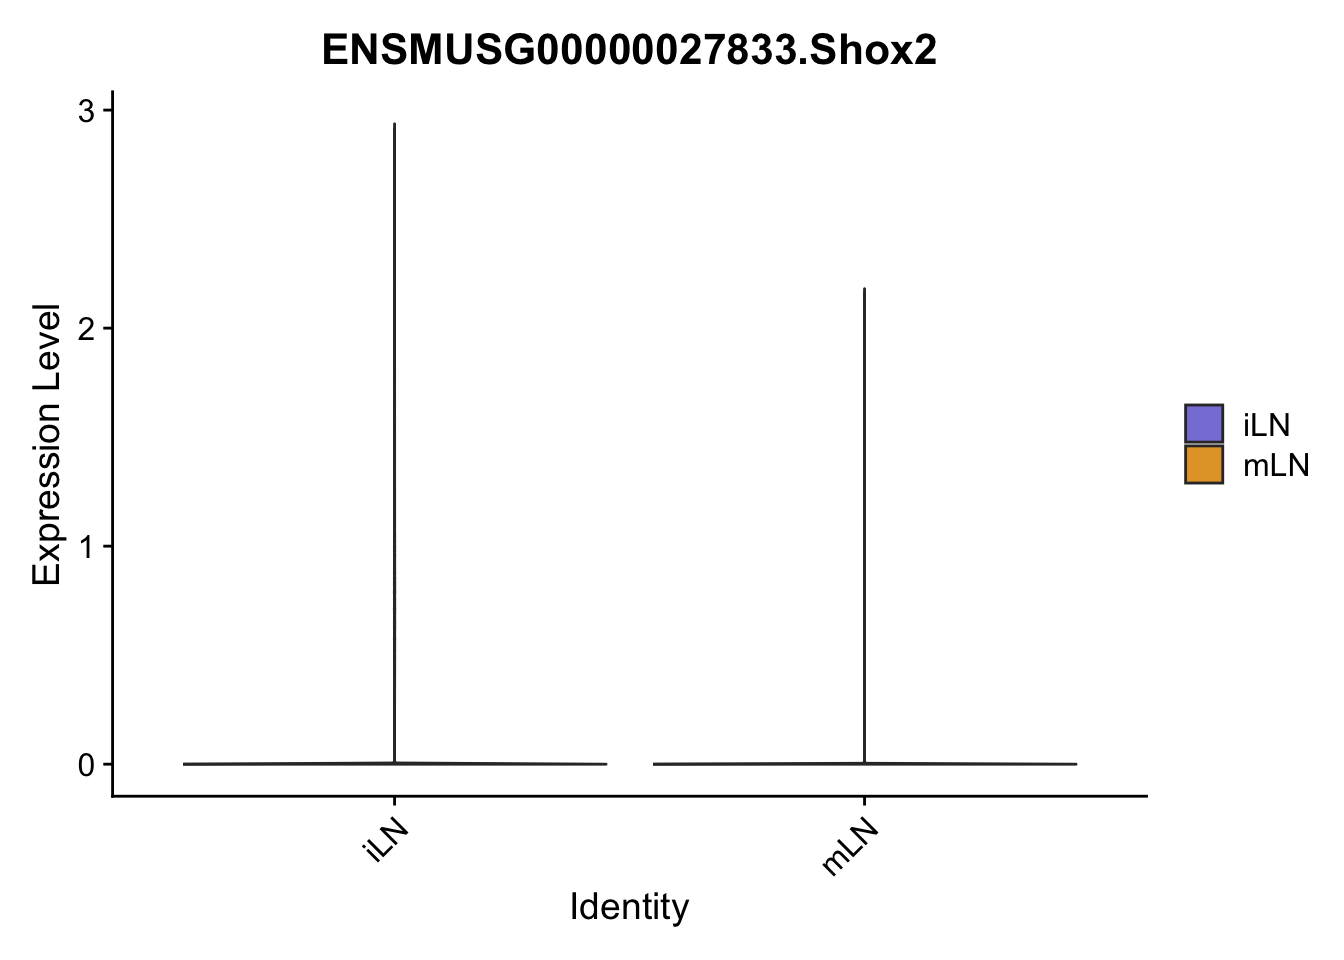
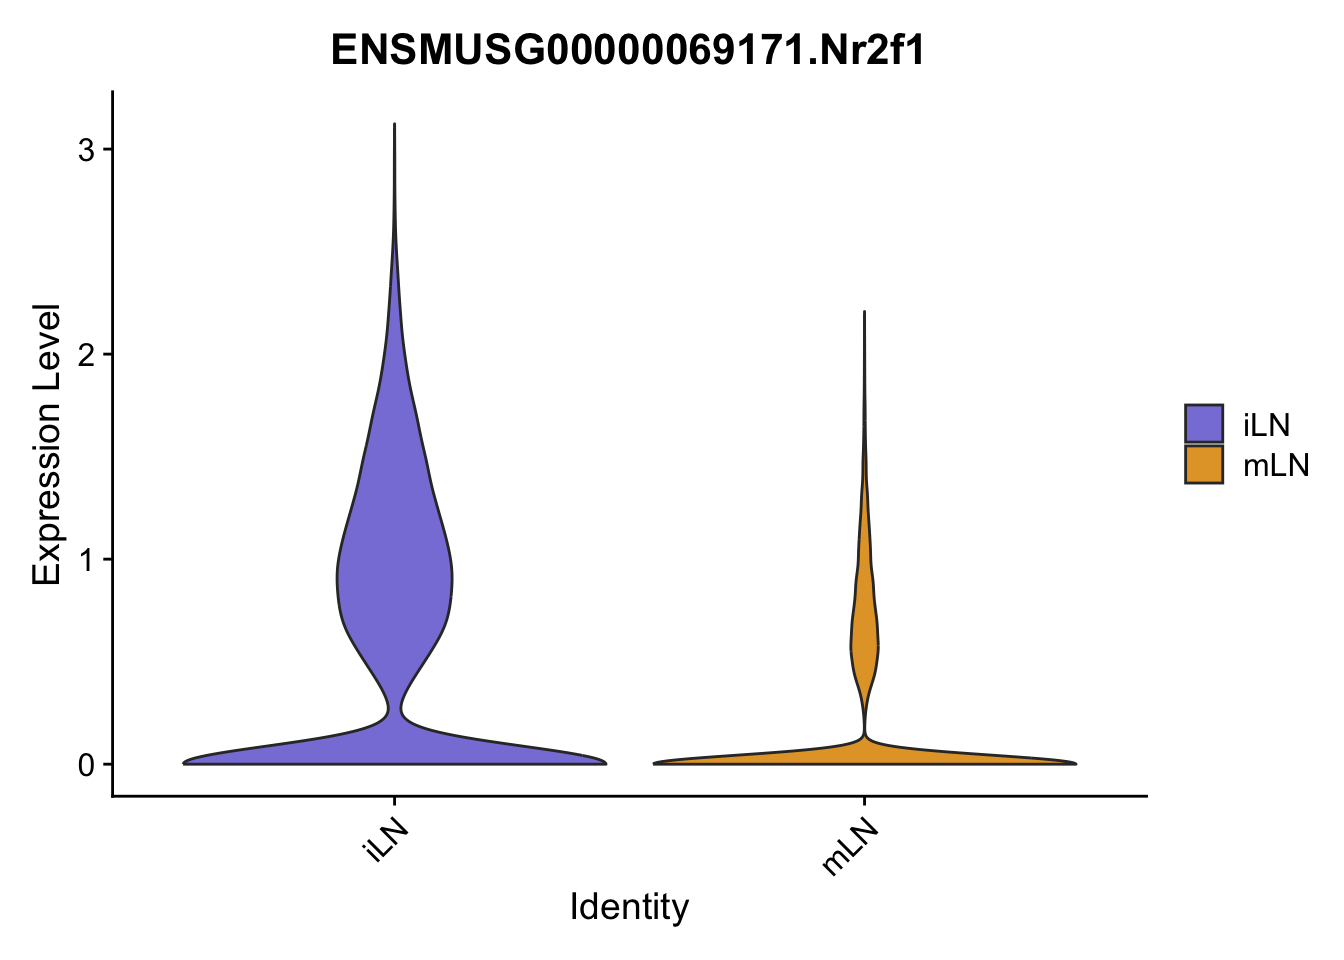
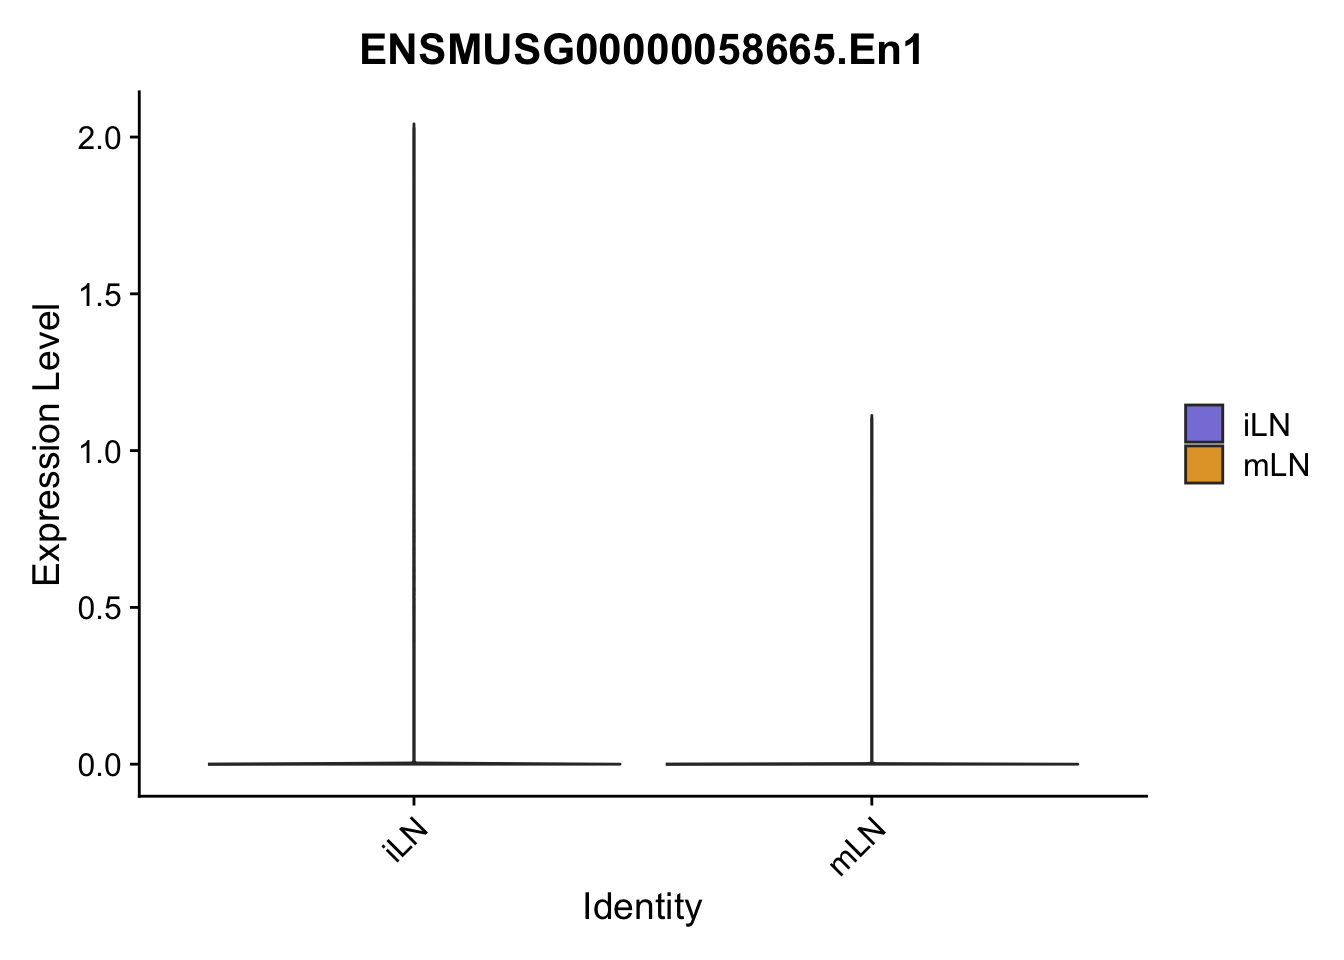
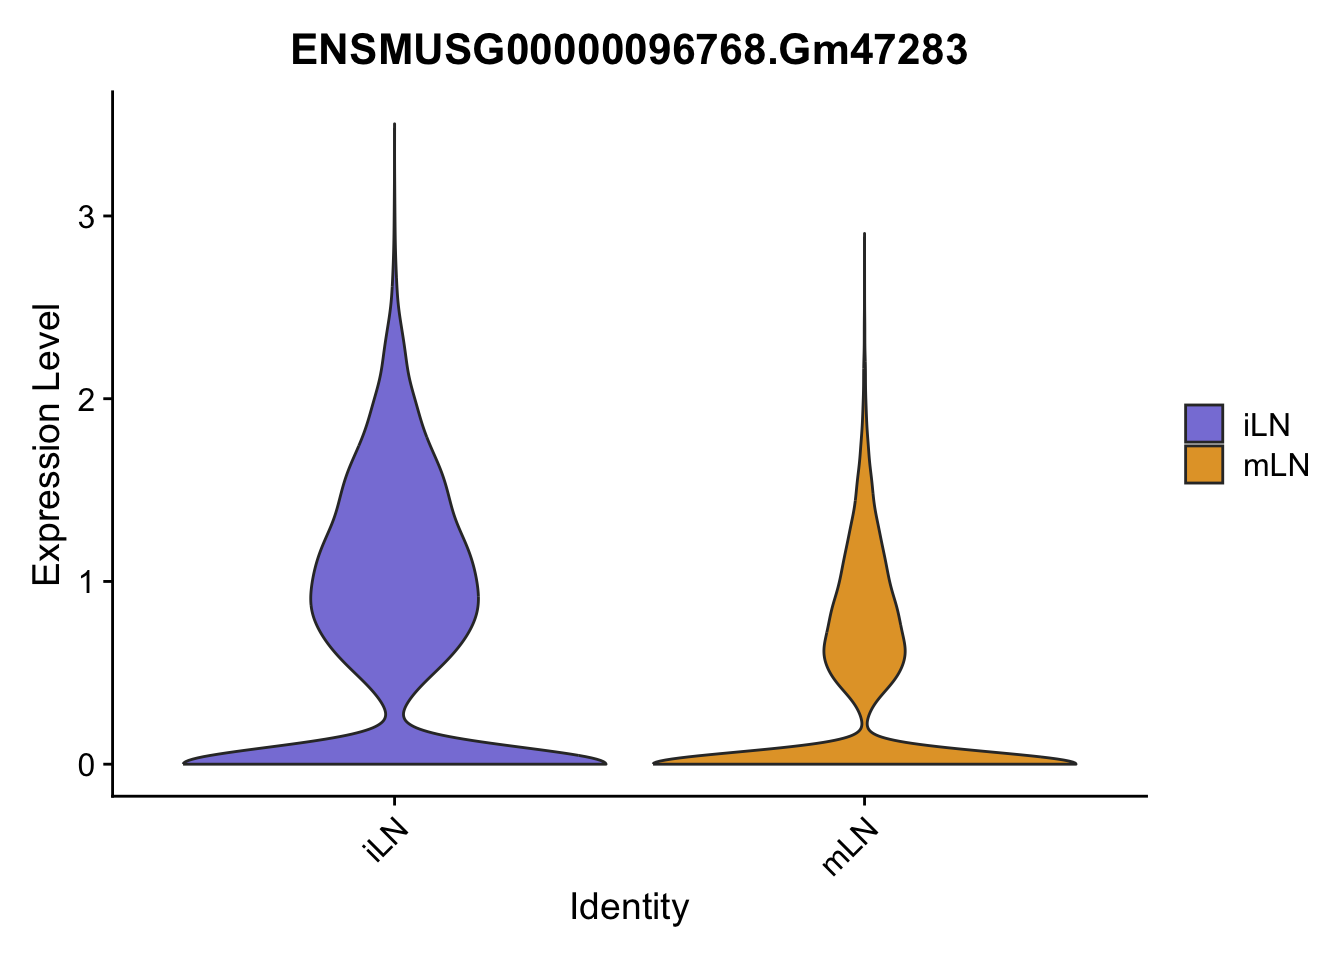
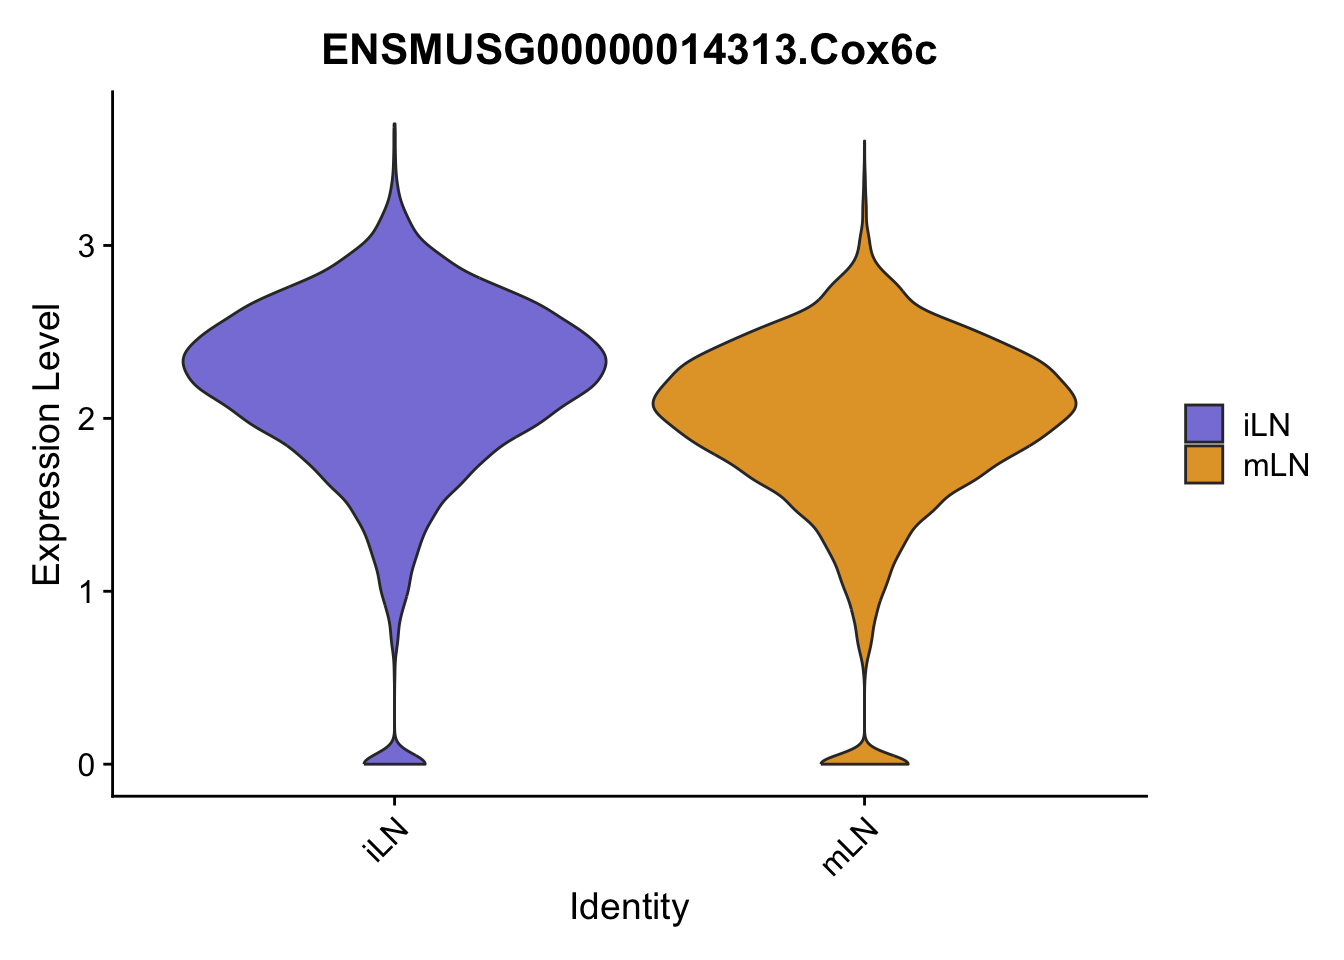
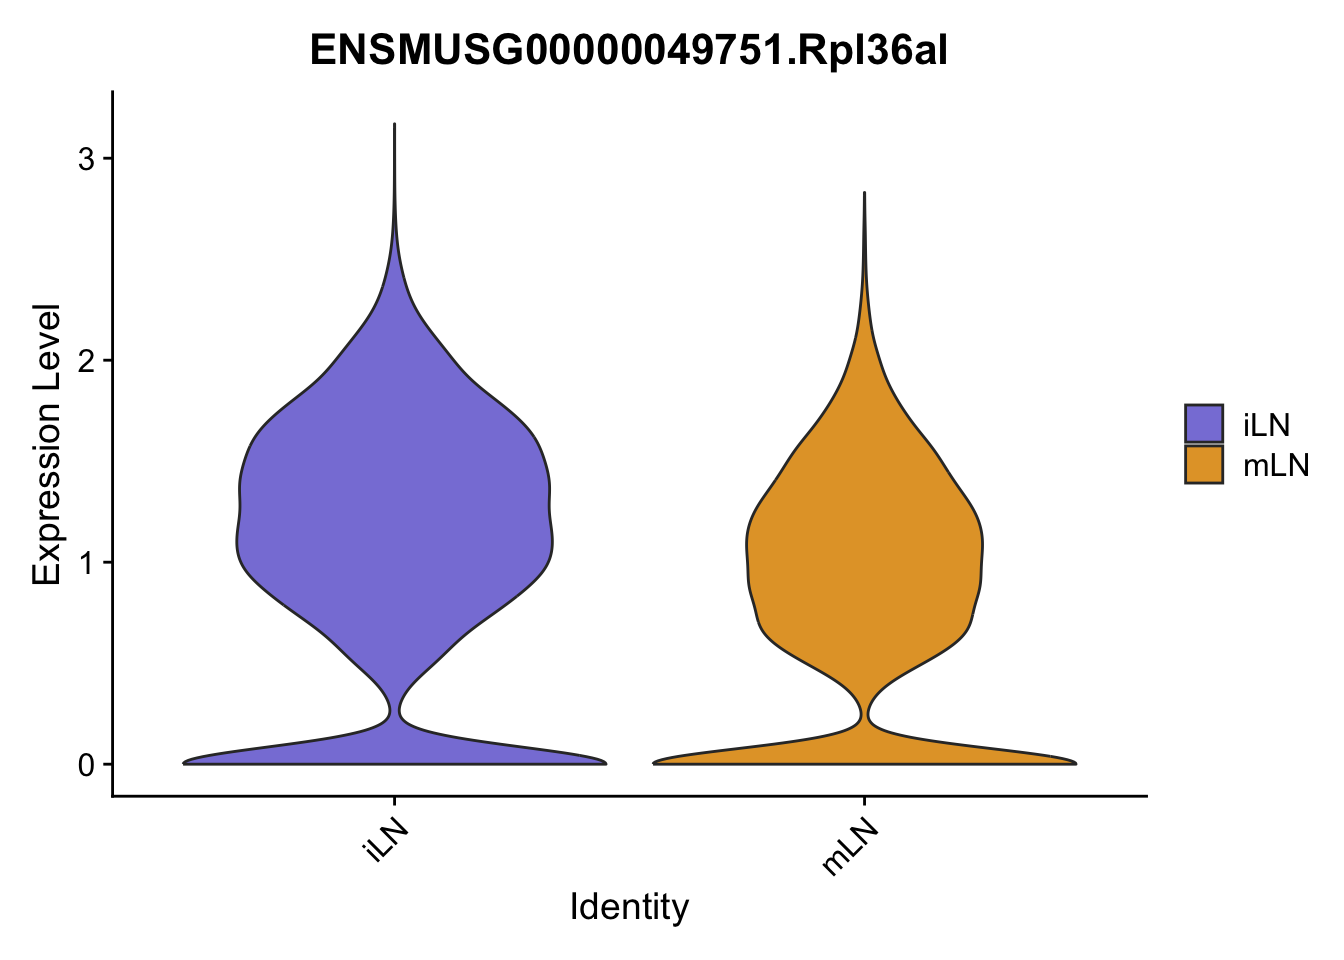
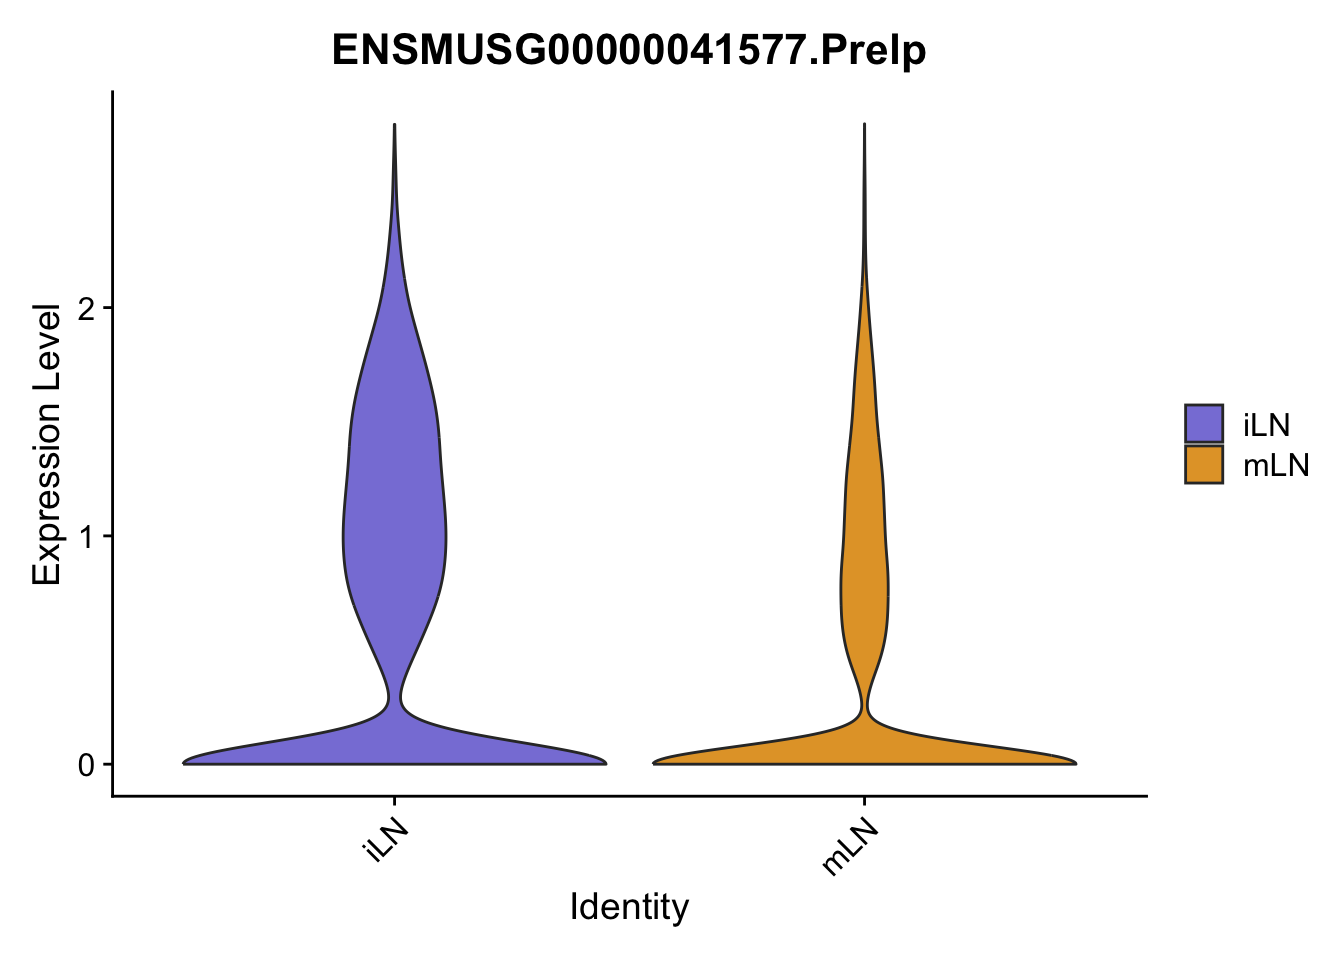
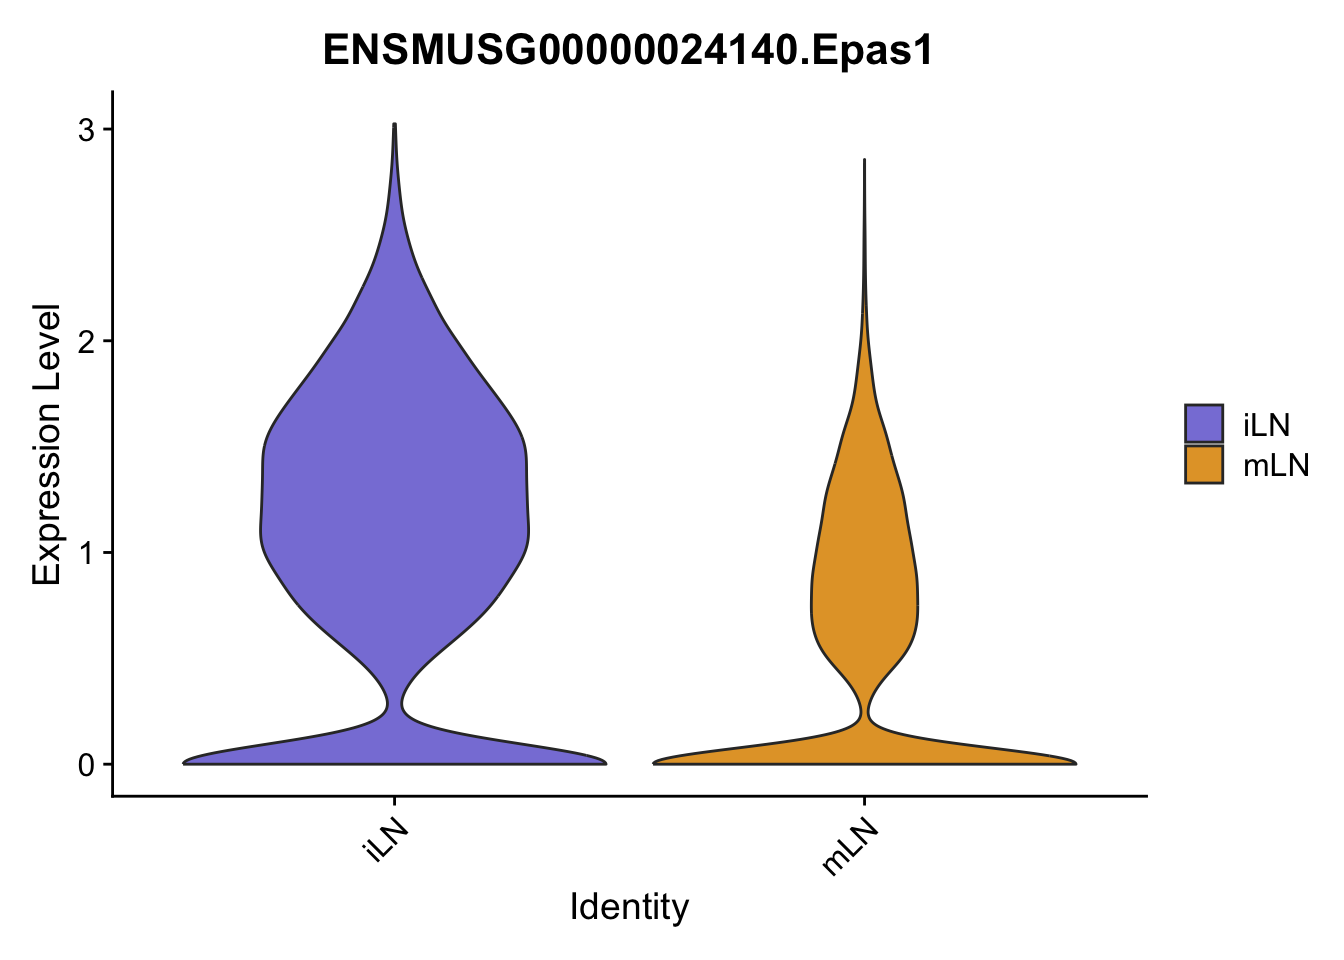
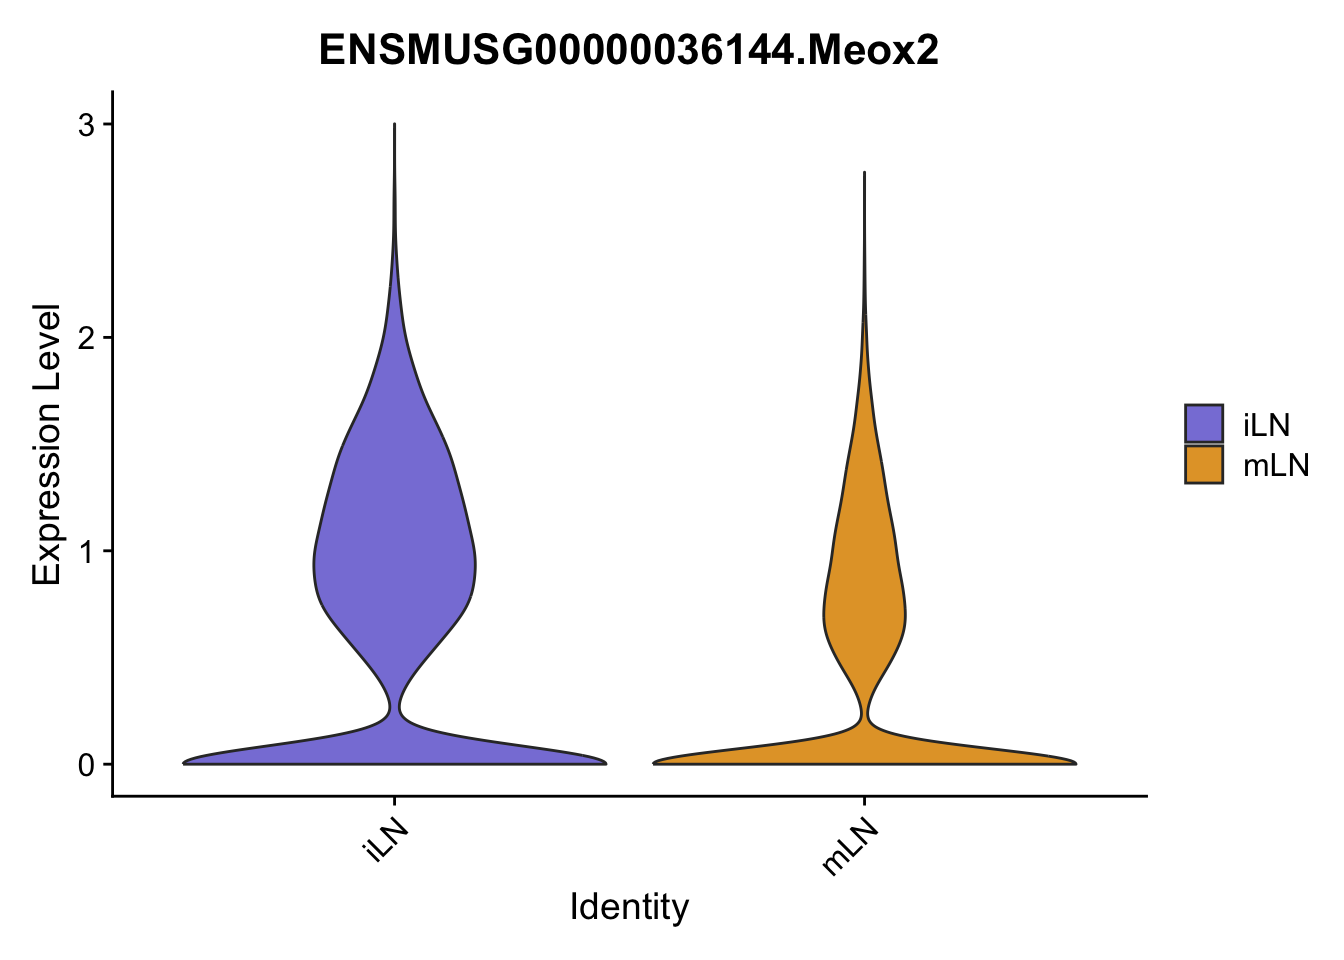
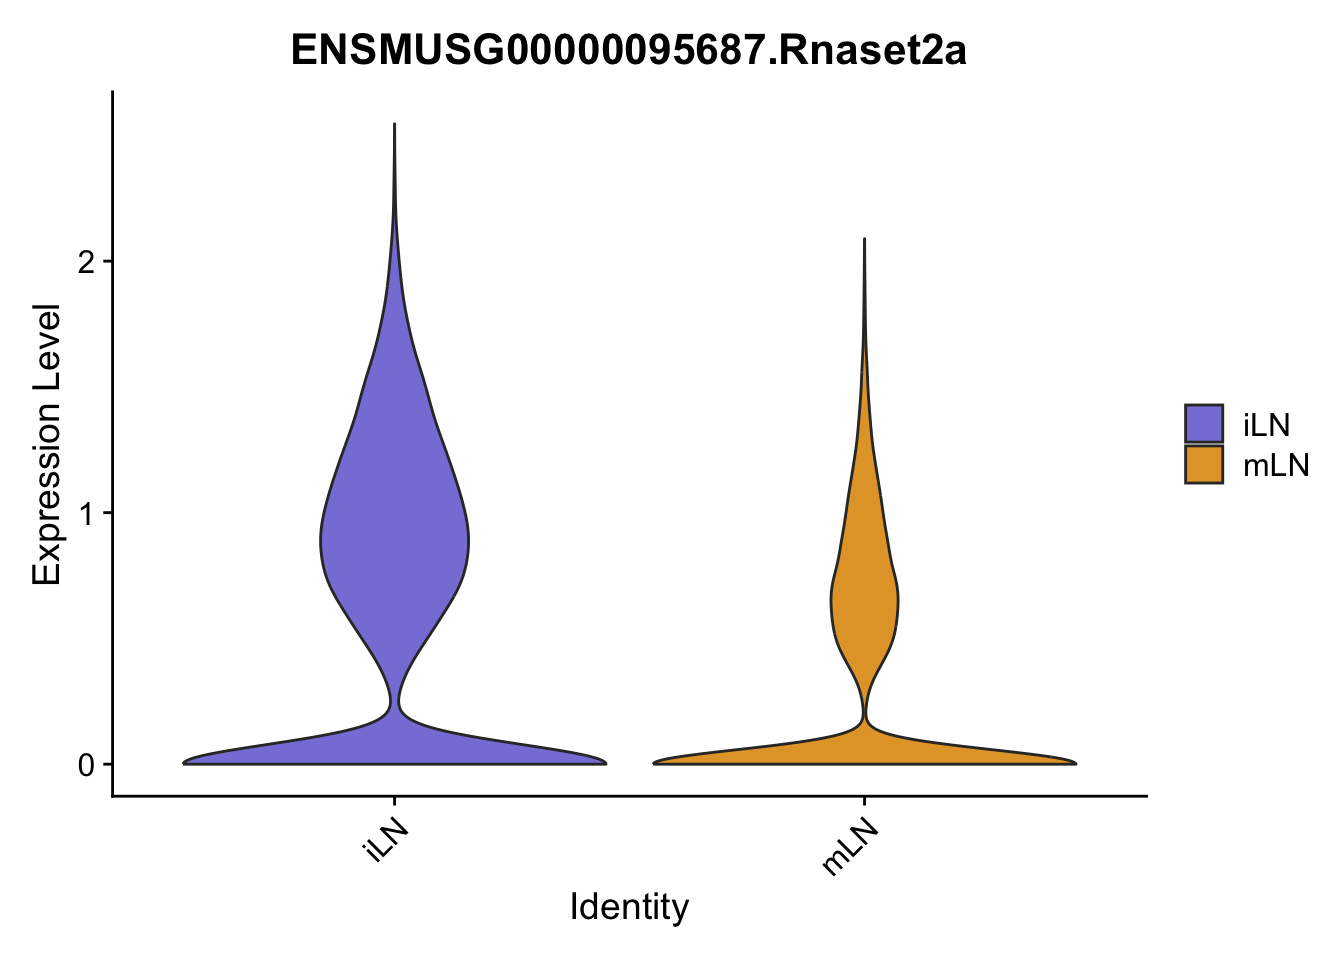
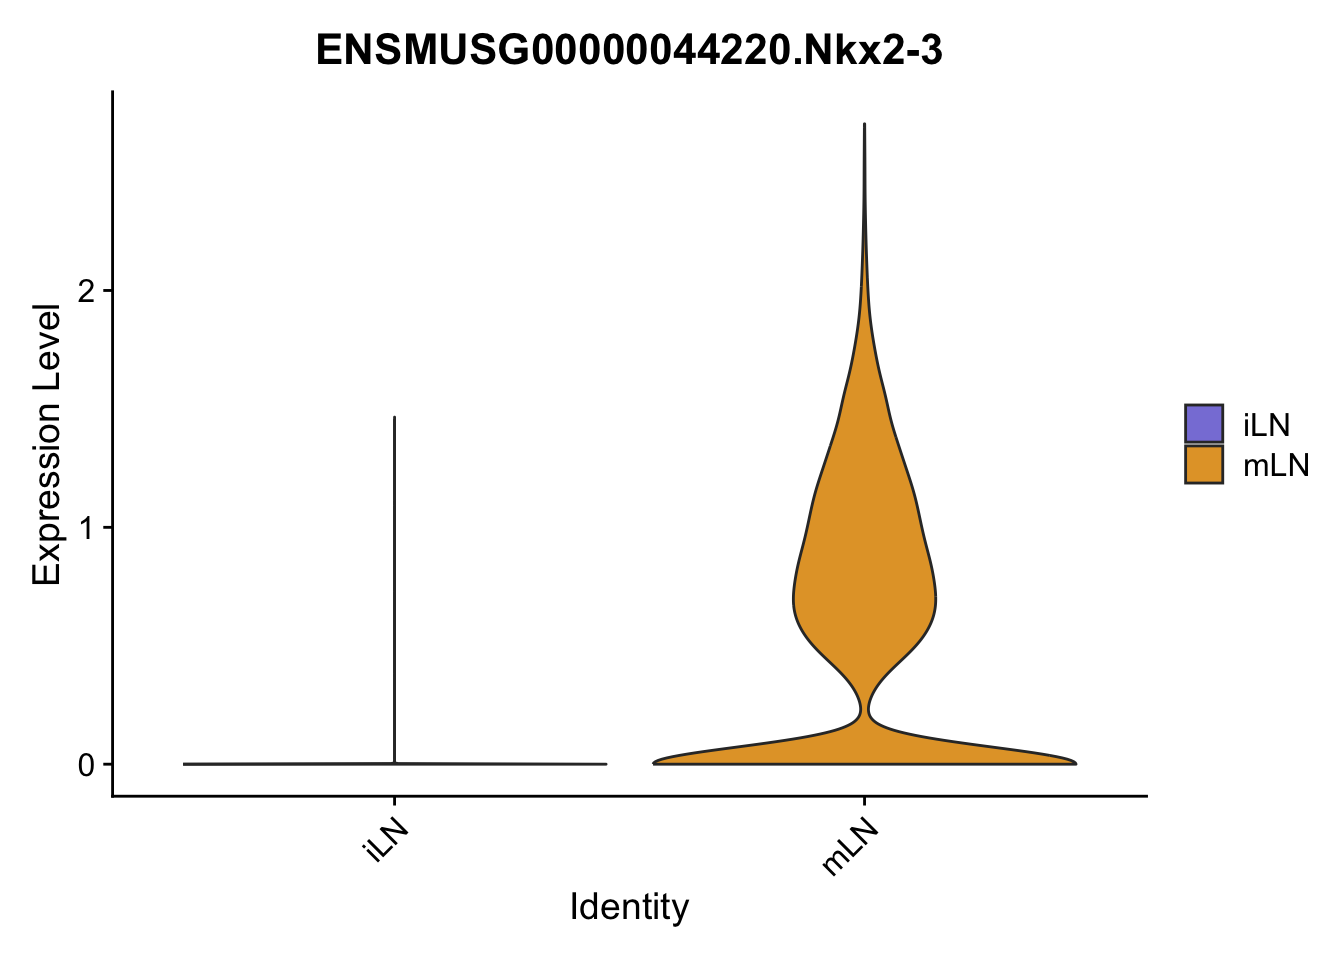
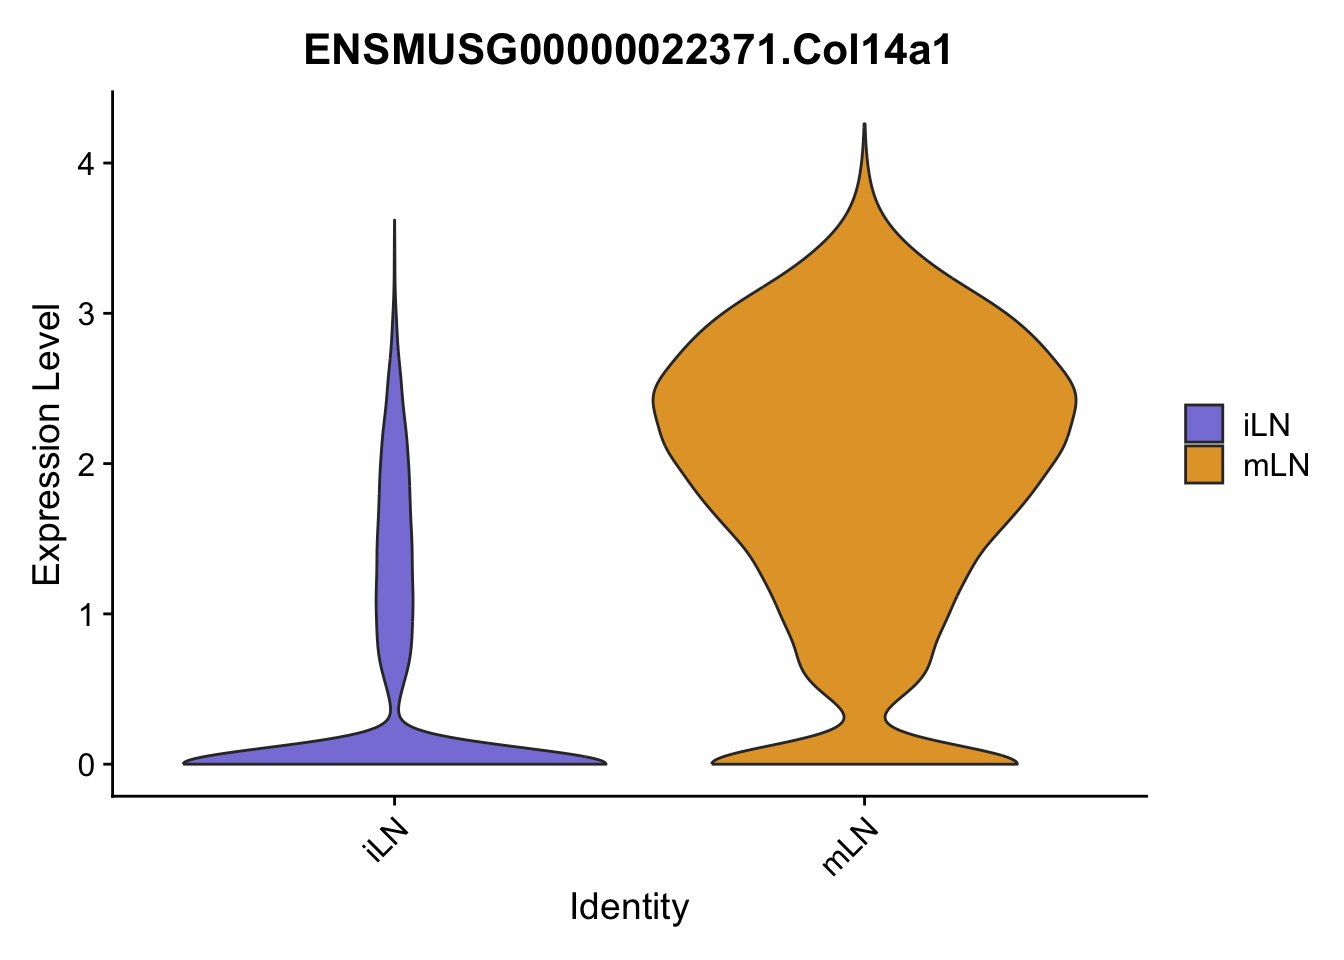
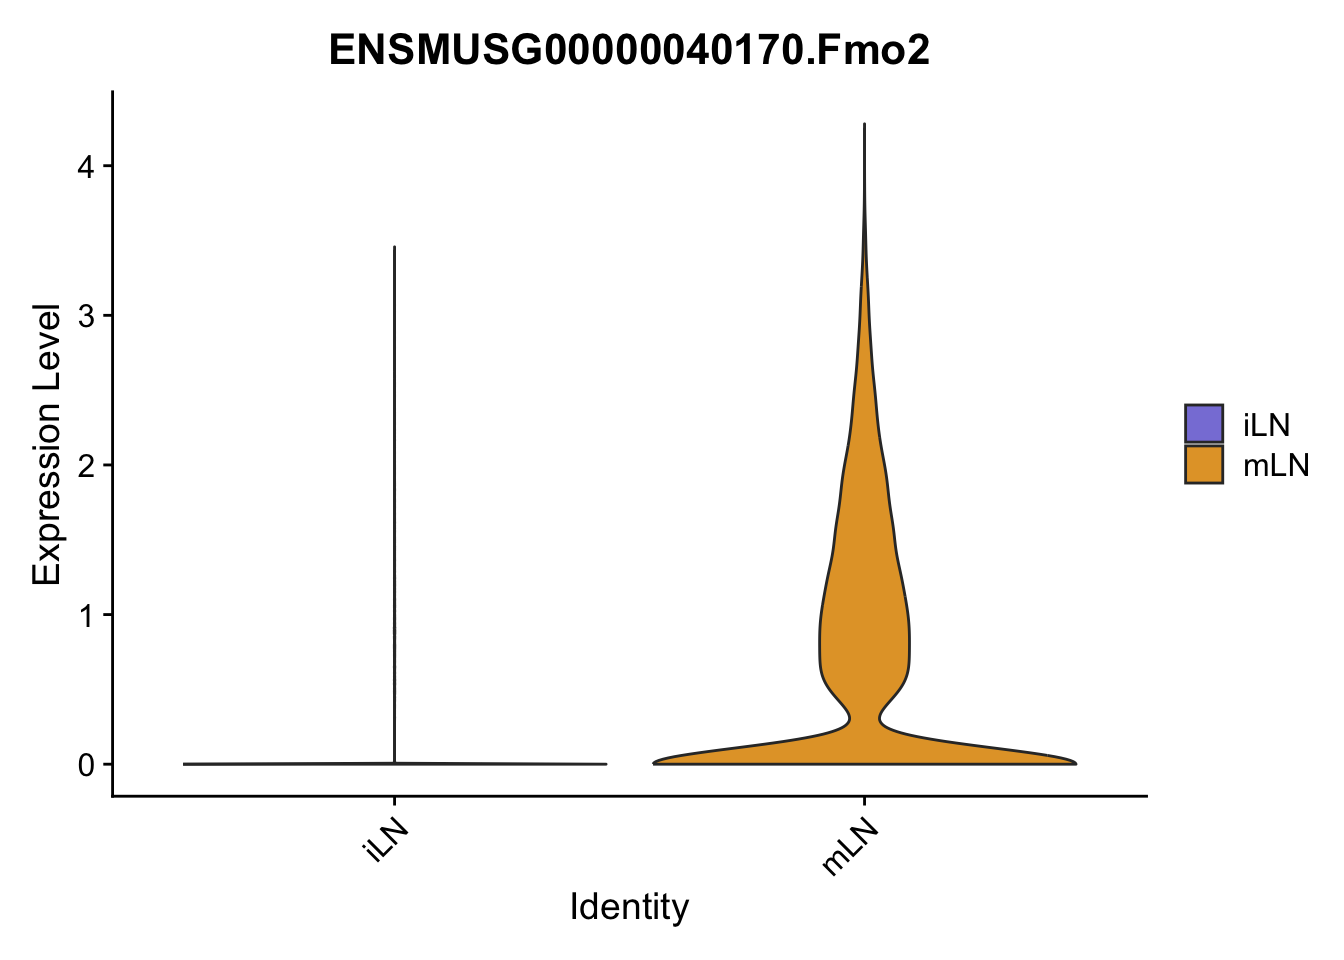
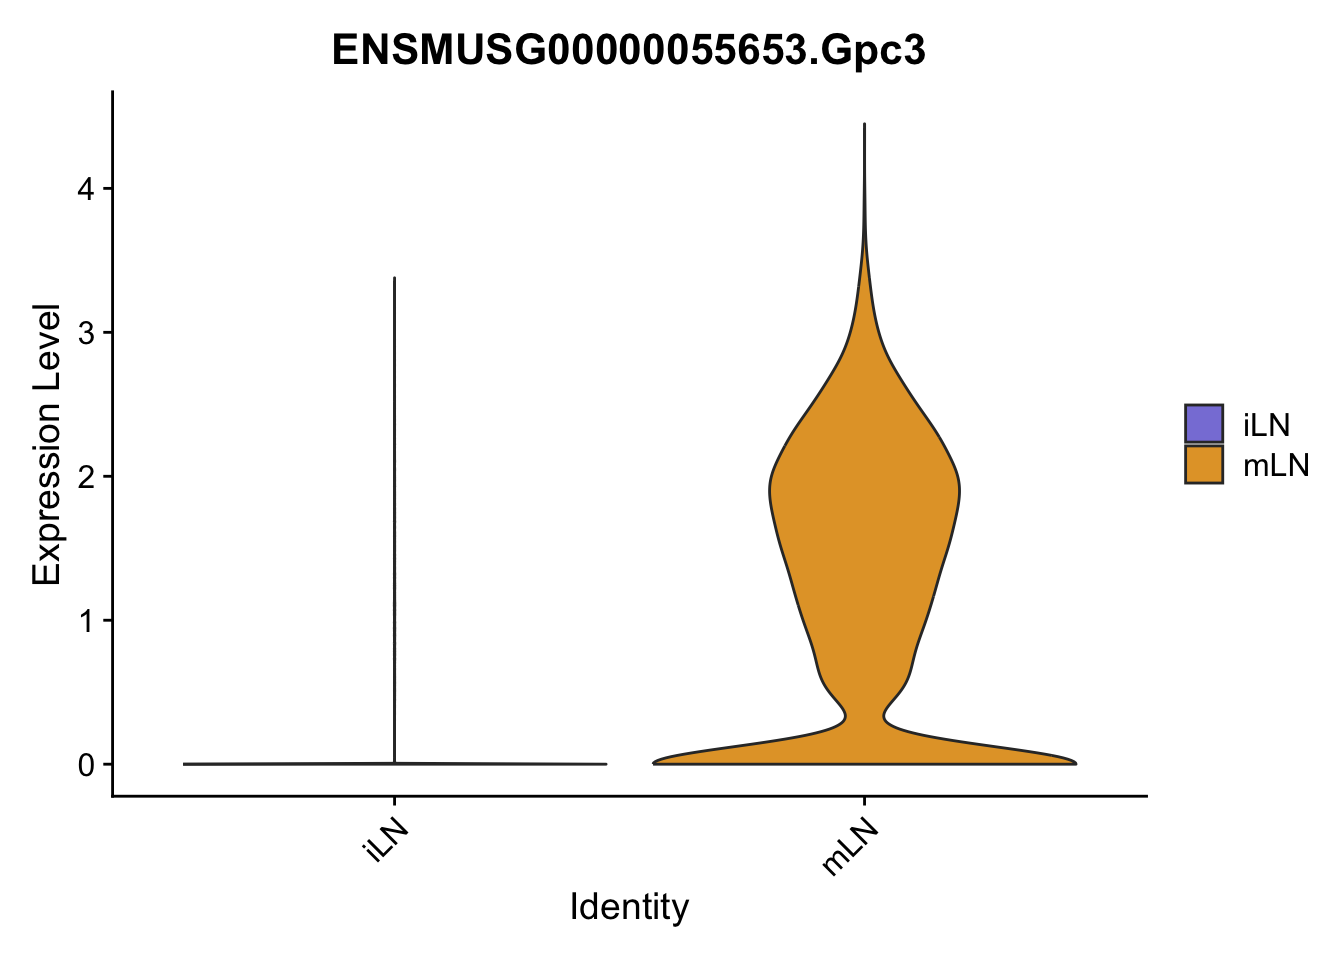
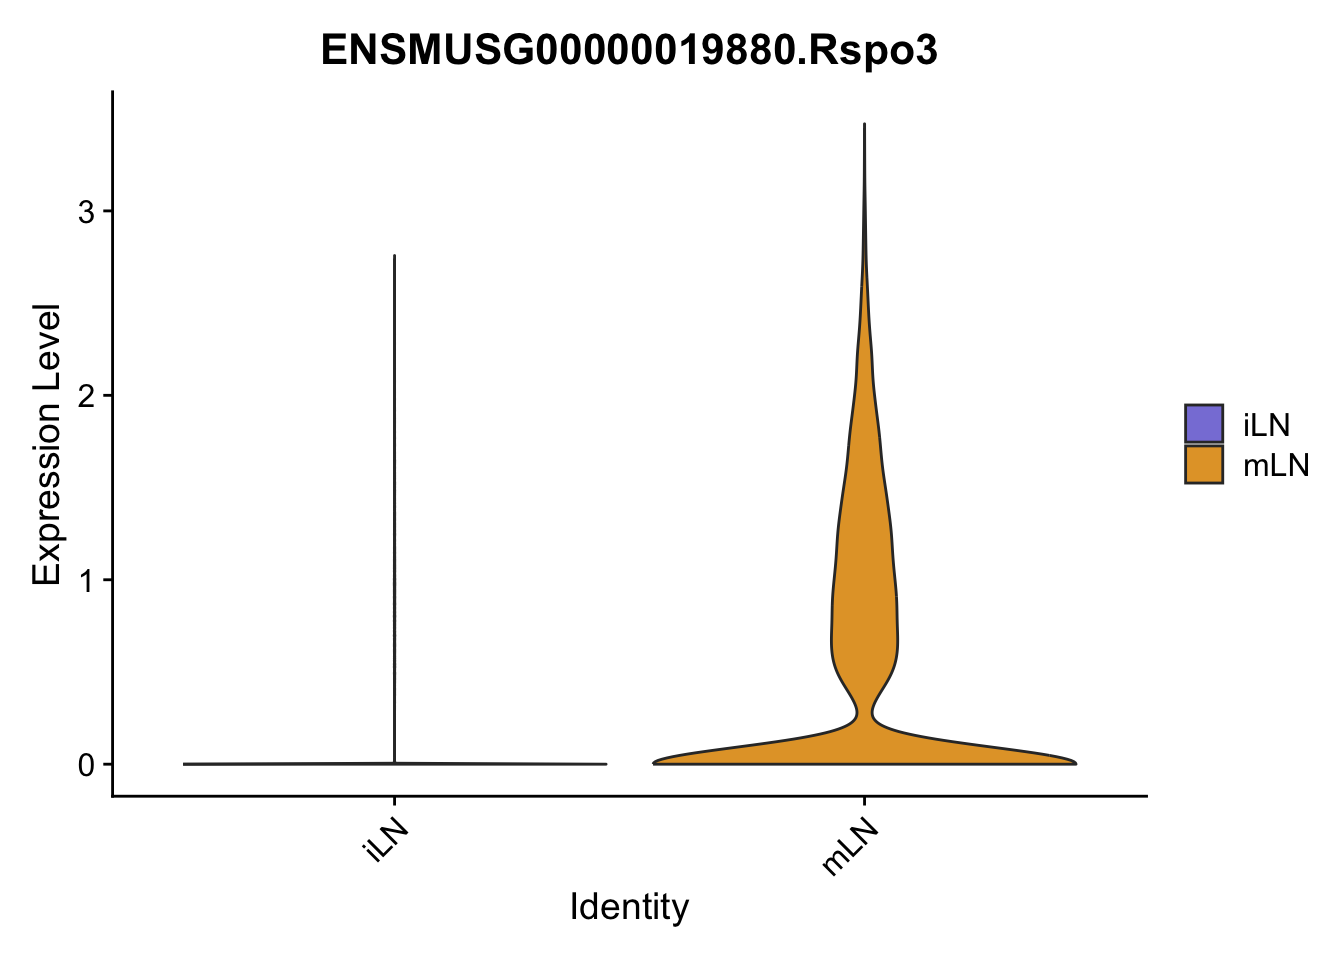
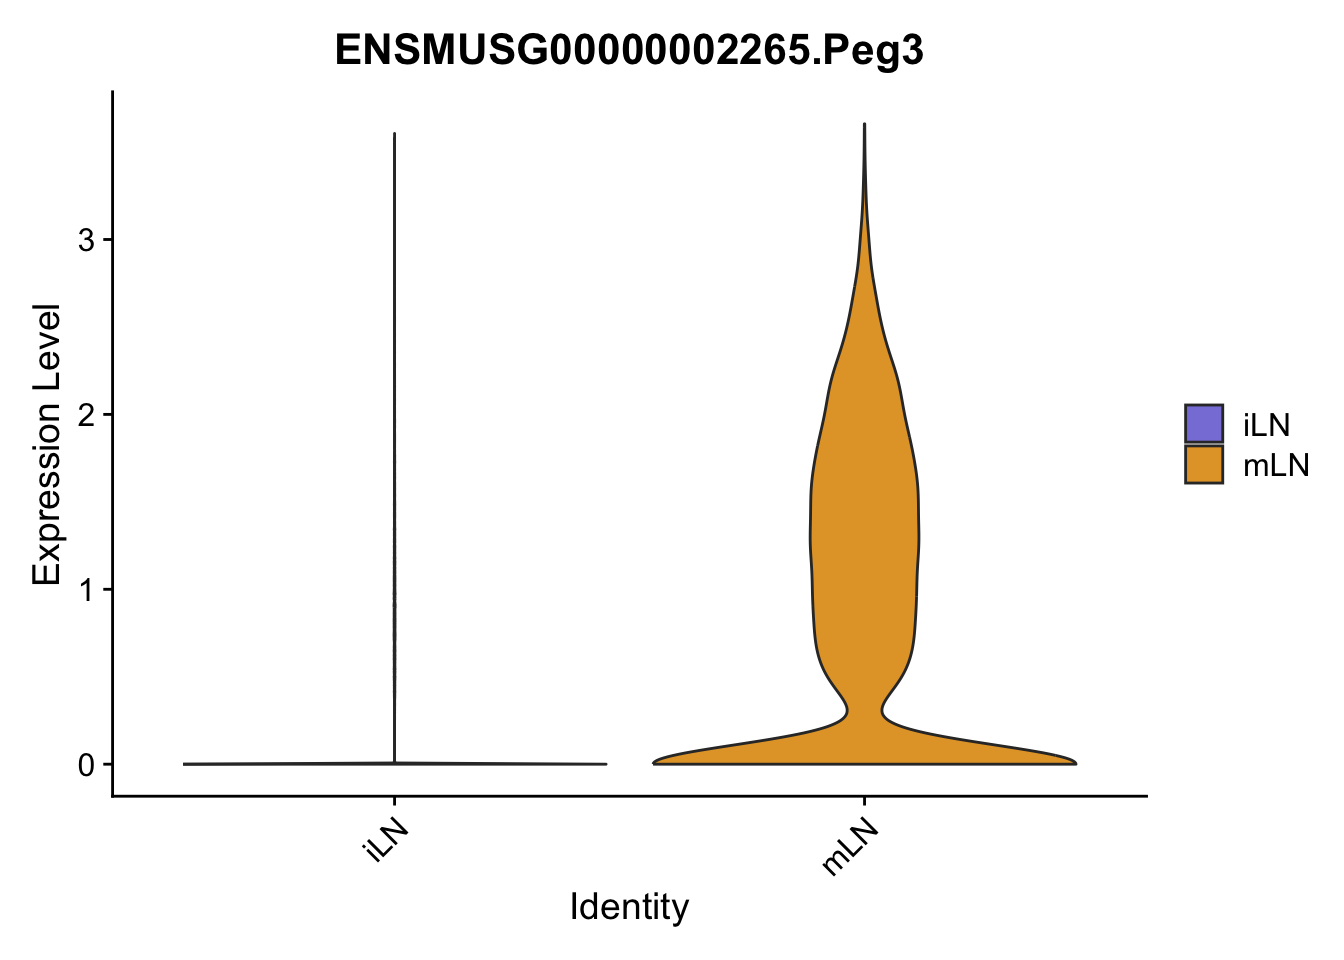
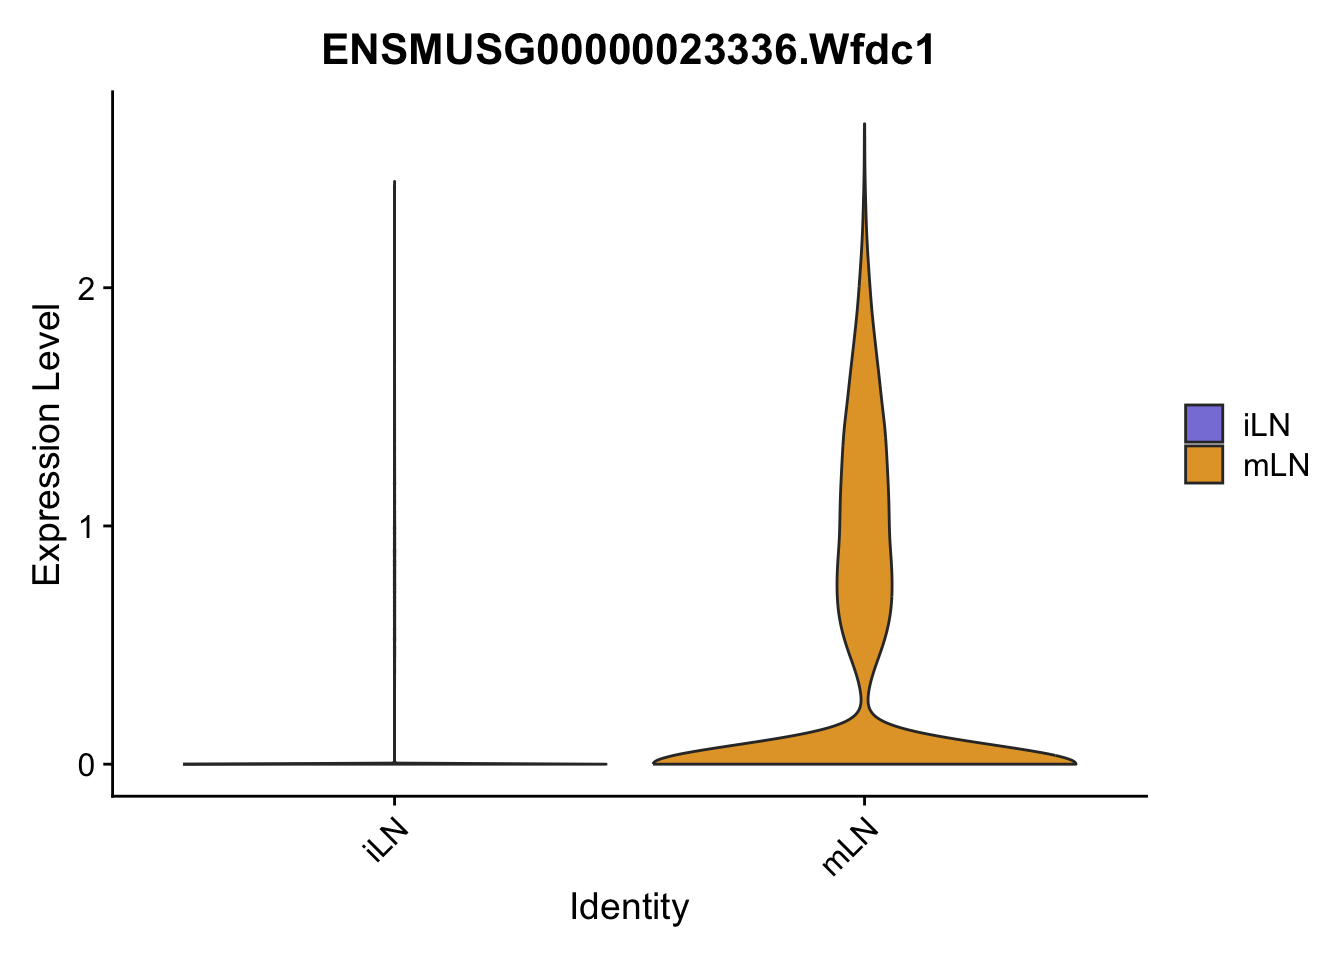
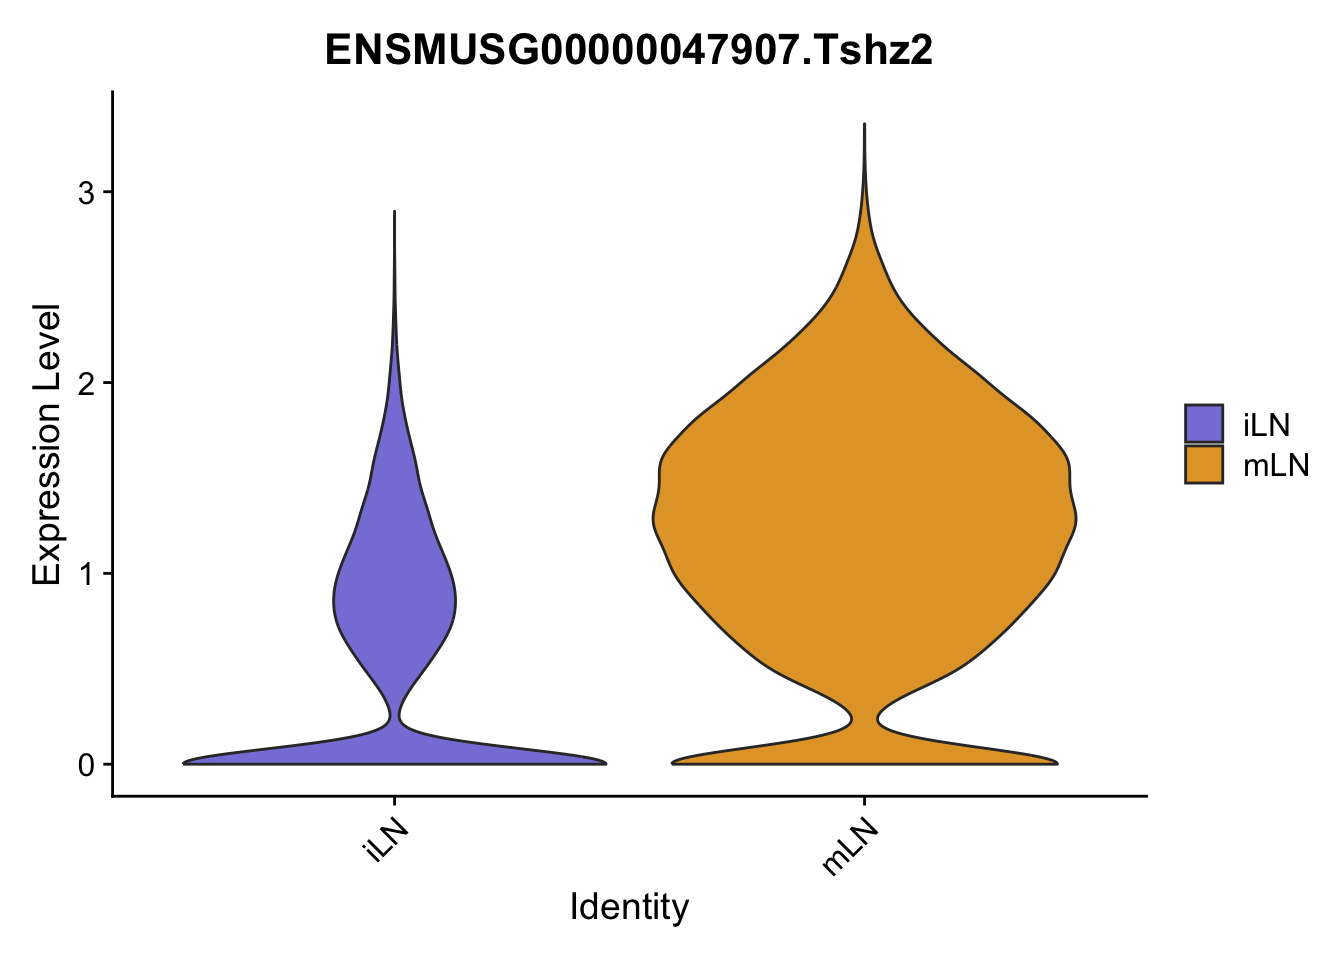
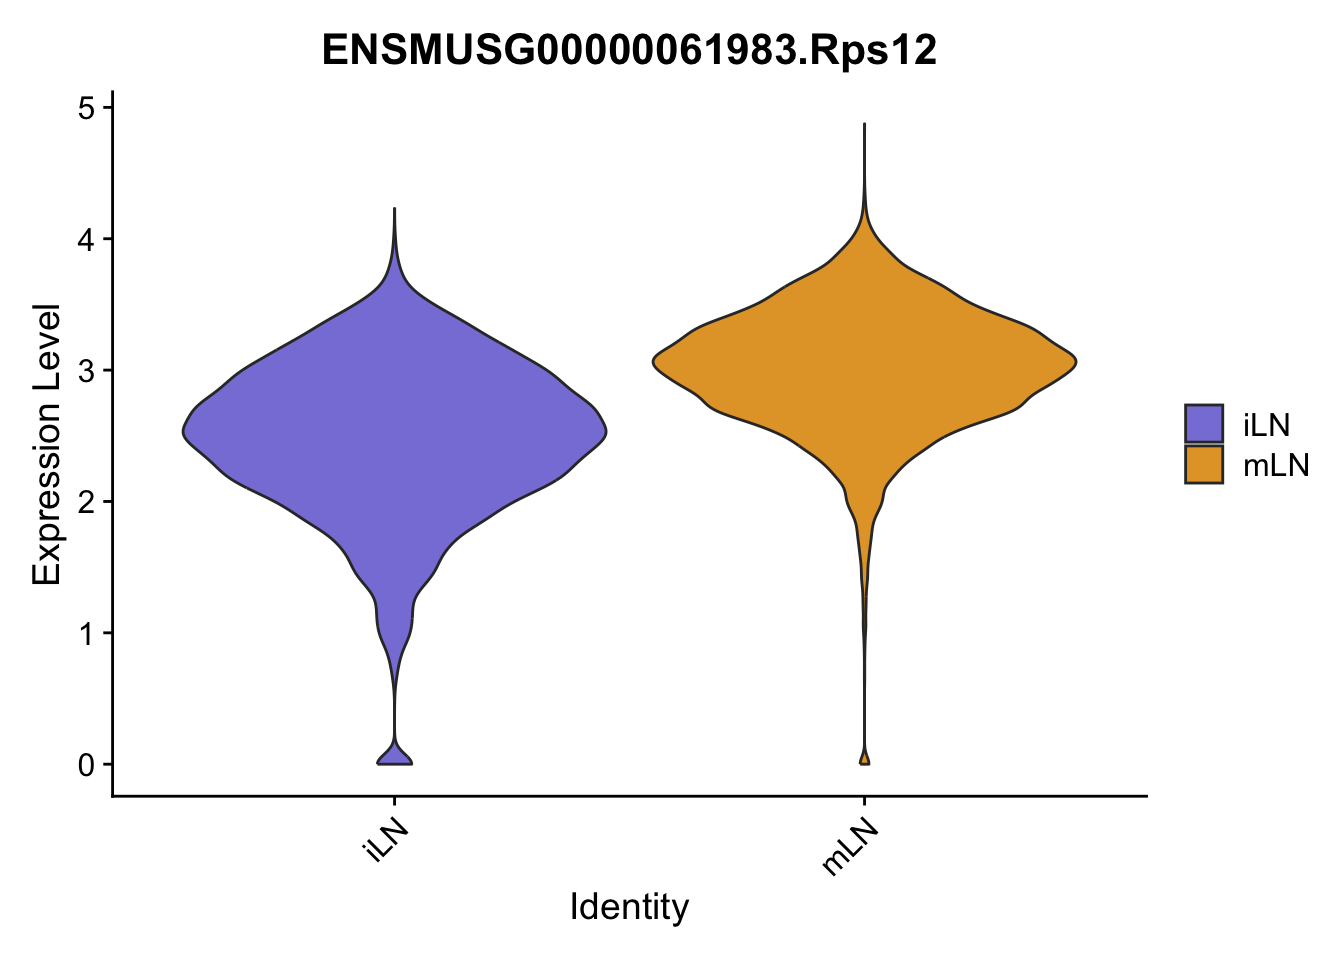
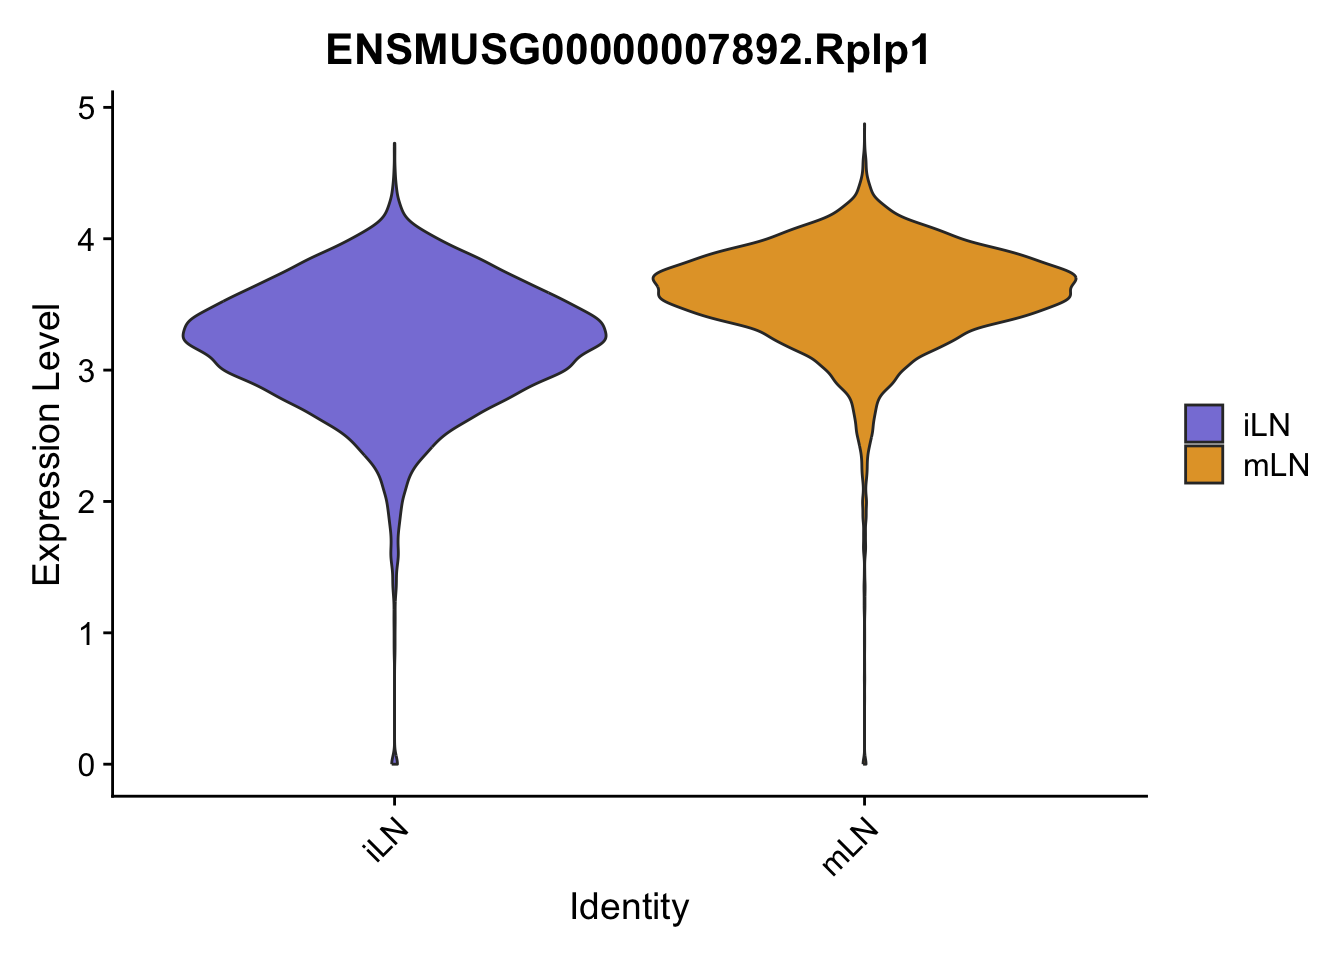
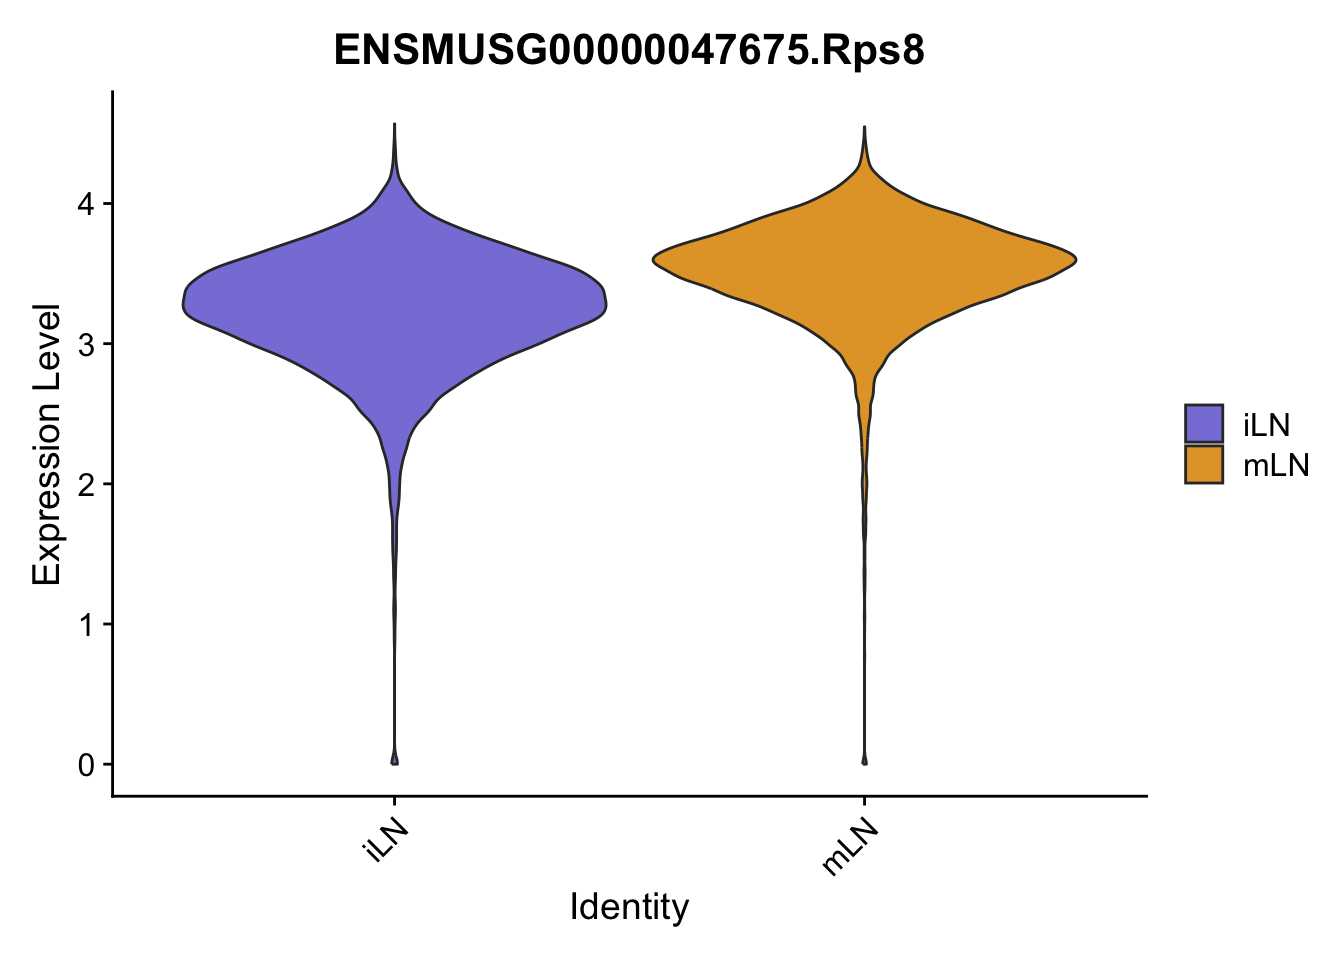
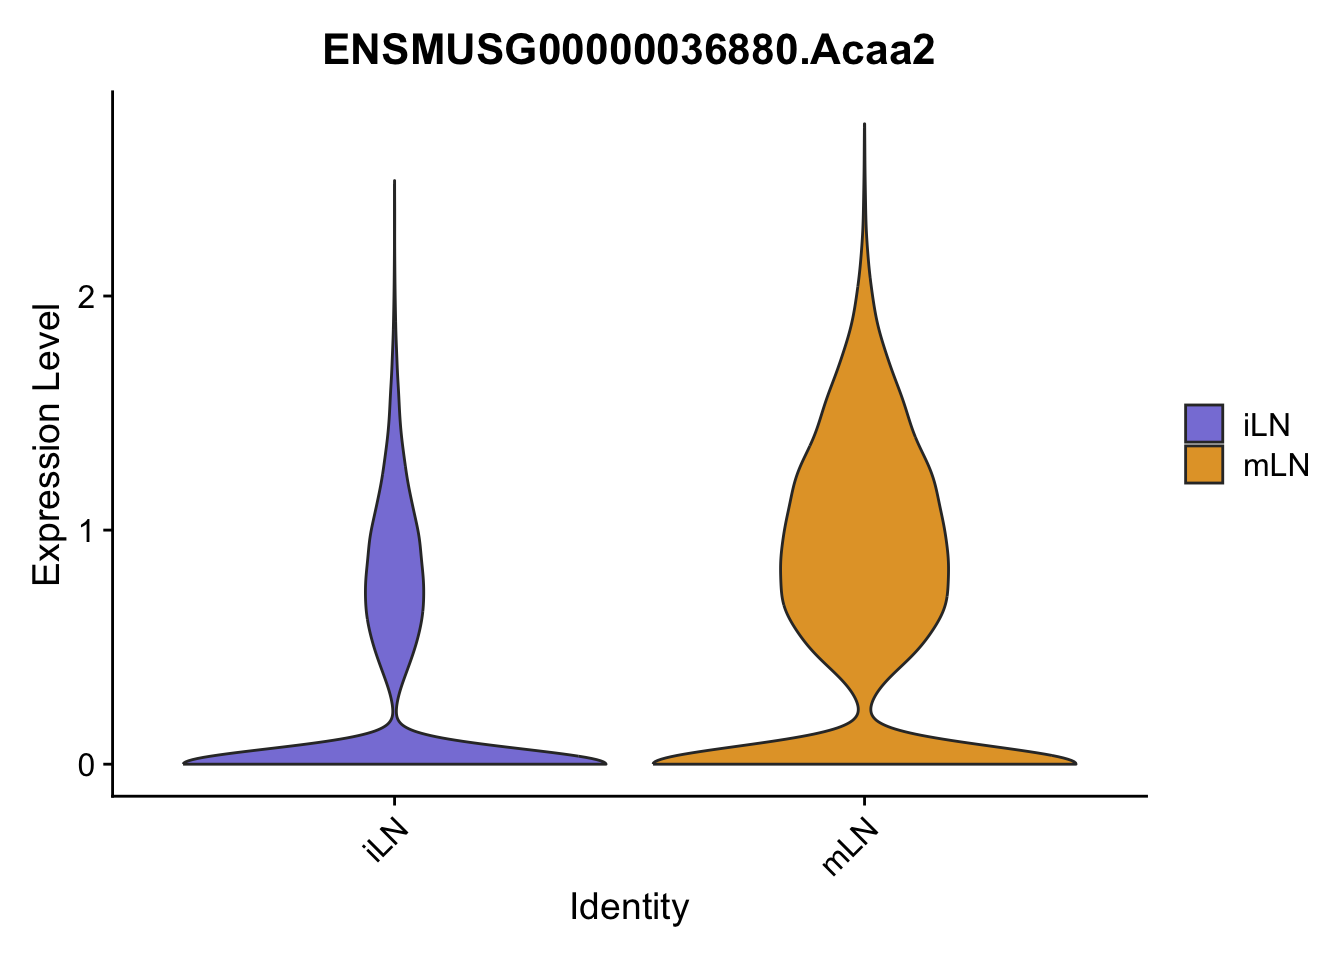
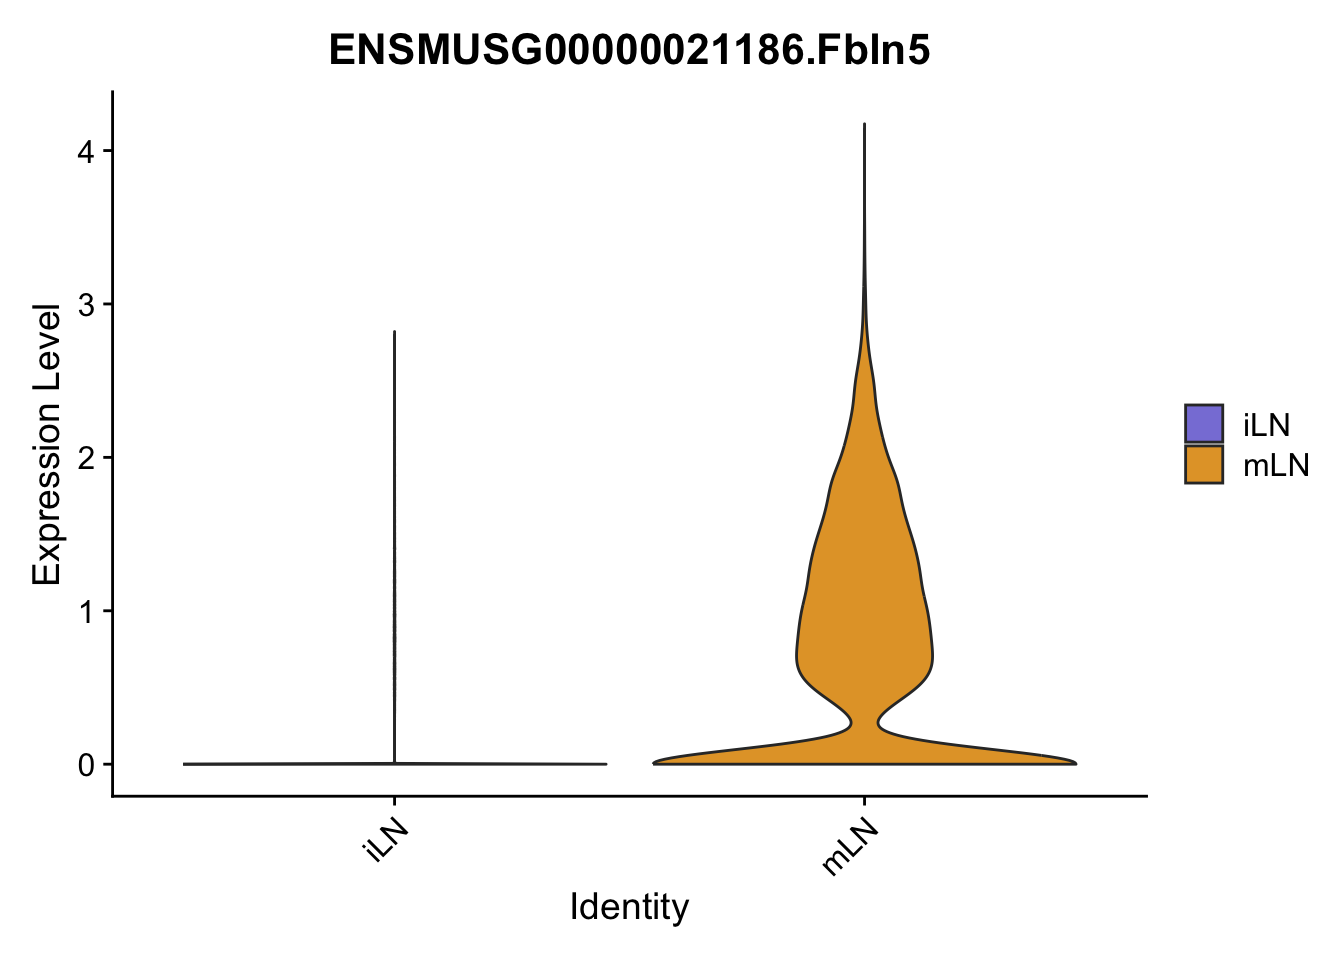
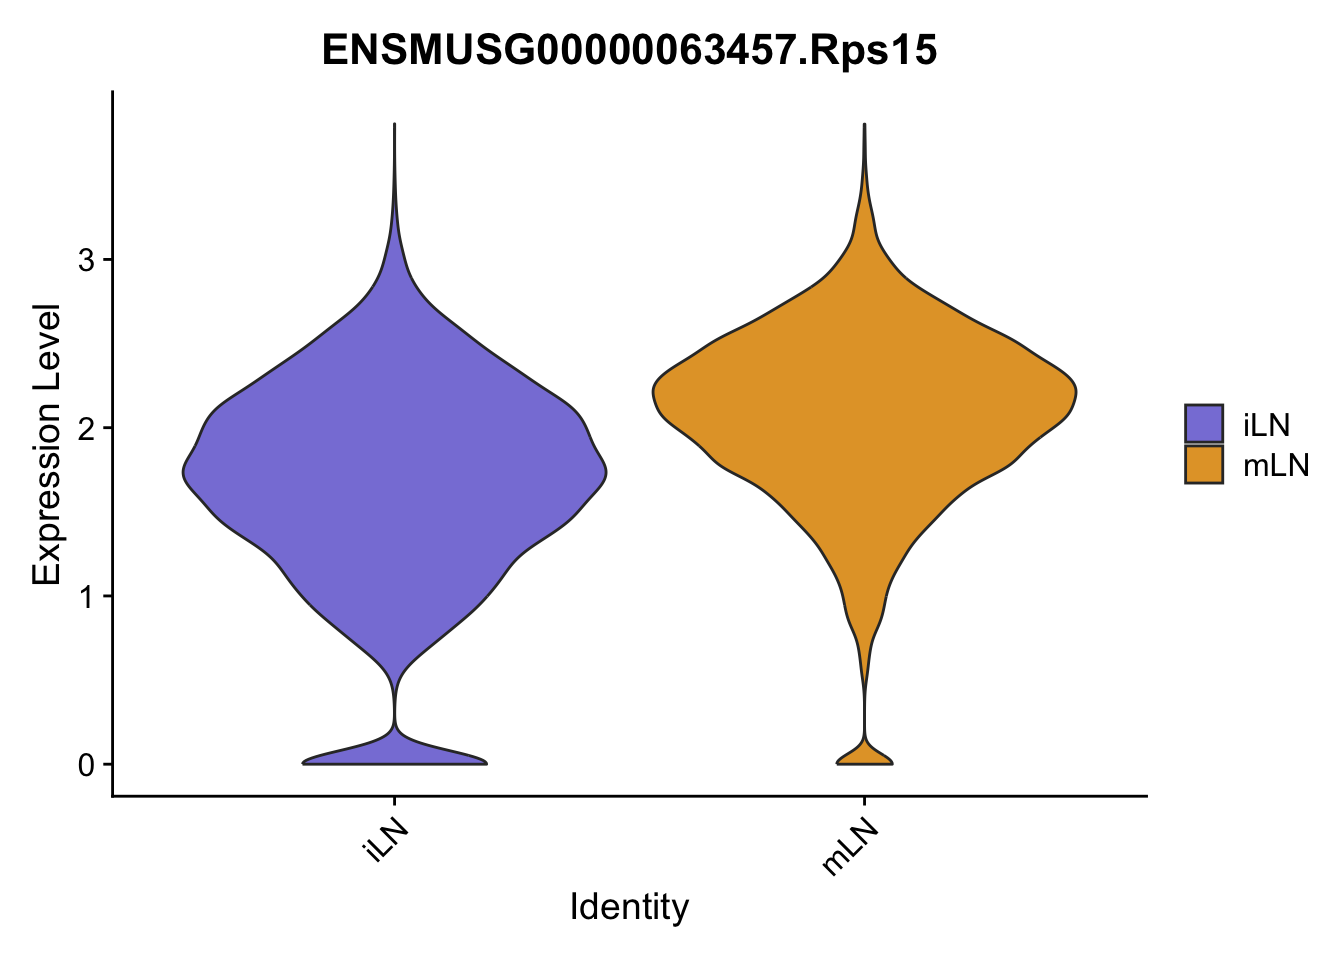
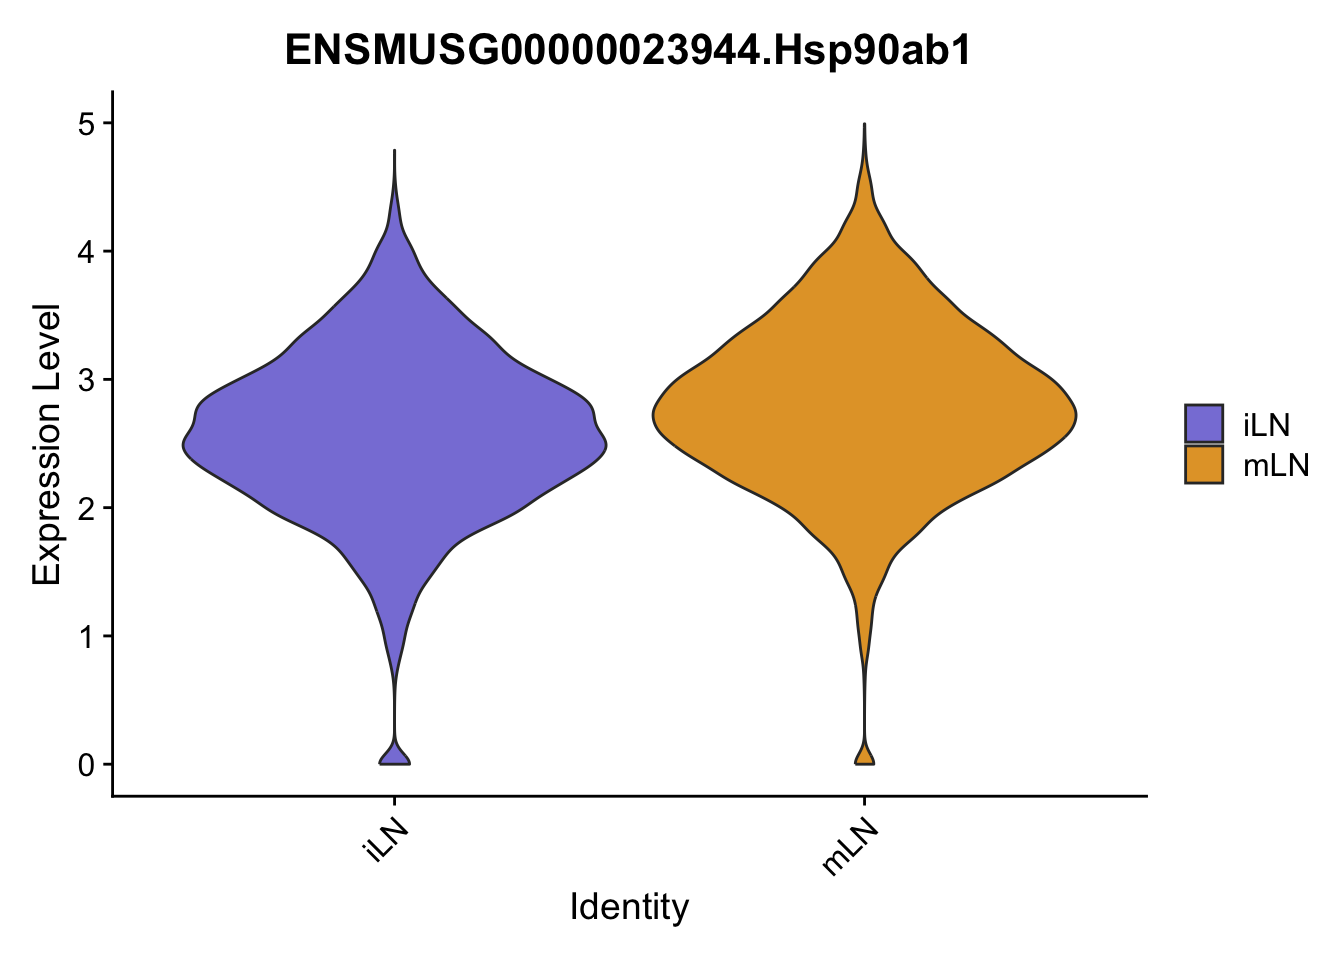
vlnplot
Idents(seurat) <- seurat$location

pList <- sapply(consMarkerILNDat$geneID, function(x){
  p <- VlnPlot(object = seurat, features = x,
               group.by = "location",
               cols = colLoc, pt.size = 0
               )
  plot(p)
})
pList <- sapply(consMarkerMLNDat$geneID, function(x){
  p <- VlnPlot(object = seurat, features = x,
               group.by = "location",
               cols = colLoc, pt.size = 0
               )
  plot(p)
})
session info
sessionInfo()R version 4.3.0 (2023-04-21)
Platform: x86_64-apple-darwin20 (64-bit)
Running under: macOS Ventura 13.4.1
Matrix products: default
BLAS: /Library/Frameworks/R.framework/Versions/4.3-x86_64/Resources/lib/libRblas.0.dylib
LAPACK: /Library/Frameworks/R.framework/Versions/4.3-x86_64/Resources/lib/libRlapack.dylib; LAPACK version 3.11.0
locale:
[1] en_US.UTF-8/en_US.UTF-8/en_US.UTF-8/C/en_US.UTF-8/en_US.UTF-8
time zone: Europe/Berlin
tzcode source: internal
attached base packages:
[1] stats4 stats graphics grDevices utils datasets methods
[8] base
other attached packages:
[1] enrichplot_1.20.3 DOSE_3.26.2
[3] org.Mm.eg.db_3.17.0 AnnotationDbi_1.62.2
[5] clusterProfiler_4.8.3 ggsci_3.0.1
[7] scran_1.28.2 scater_1.28.0
[9] scuttle_1.10.3 pheatmap_1.0.12
[11] RColorBrewer_1.1-3 SingleCellExperiment_1.22.0
[13] SummarizedExperiment_1.30.2 Biobase_2.60.0
[15] GenomicRanges_1.52.1 GenomeInfoDb_1.36.4
[17] IRanges_2.36.0 S4Vectors_0.40.1
[19] BiocGenerics_0.48.0 MatrixGenerics_1.12.3
[21] matrixStats_1.2.0 runSeurat3_0.1.0
[23] ggpubr_0.6.0 here_1.0.1
[25] magrittr_2.0.3 Seurat_5.0.2
[27] SeuratObject_5.0.1 sp_2.1-3
[29] lubridate_1.9.3 forcats_1.0.0
[31] stringr_1.5.1 dplyr_1.1.4
[33] purrr_1.0.2 readr_2.1.5
[35] tidyr_1.3.1 tibble_3.2.1
[37] ggplot2_3.5.0 tidyverse_2.0.0
loaded via a namespace (and not attached):
[1] goftest_1.2-3 Biostrings_2.68.1
[3] TH.data_1.1-2 vctrs_0.6.5
[5] spatstat.random_3.2-3 digest_0.6.34
[7] png_0.1-8 ggrepel_0.9.5
[9] deldir_2.0-4 parallelly_1.37.1
[11] MASS_7.3-60.0.1 reshape2_1.4.4
[13] httpuv_1.6.14 qvalue_2.32.0
[15] withr_3.0.0 ggrastr_1.0.2
[17] xfun_0.42 ggfun_0.1.4
[19] ellipsis_0.3.2 survival_3.5-8
[21] memoise_2.0.1 ggbeeswarm_0.7.2
[23] gson_0.1.0 tidytree_0.4.6
[25] zoo_1.8-12 pbapply_1.7-2
[27] KEGGREST_1.40.1 promises_1.2.1
[29] httr_1.4.7 downloader_0.4
[31] rstatix_0.7.2 globals_0.16.2
[33] fitdistrplus_1.1-11 rstudioapi_0.15.0
[35] miniUI_0.1.1.1 generics_0.1.3
[37] zlibbioc_1.46.0 ScaledMatrix_1.8.1
[39] ggraph_2.2.0 polyclip_1.10-6
[41] TFisher_0.2.0 GenomeInfoDbData_1.2.10
[43] xtable_1.8-4 evaluate_0.23
[45] S4Arrays_1.0.6 hms_1.1.3
[47] irlba_2.3.5.1 colorspace_2.1-0
[49] ROCR_1.0-11 reticulate_1.35.0
[51] spatstat.data_3.0-4 lmtest_0.9-40
[53] later_1.3.2 viridis_0.6.5
[55] ggtree_3.8.2 lattice_0.22-5
[57] spatstat.geom_3.2-9 future.apply_1.11.1
[59] scattermore_1.2 shadowtext_0.1.3
[61] cowplot_1.1.3 RcppAnnoy_0.0.22
[63] pillar_1.9.0 nlme_3.1-164
[65] compiler_4.3.0 beachmat_2.16.0
[67] RSpectra_0.16-1 stringi_1.8.3
[69] tensor_1.5 plyr_1.8.9
[71] crayon_1.5.2 abind_1.4-5
[73] gridGraphics_0.5-1 sn_2.1.1
[75] locfit_1.5-9.9 graphlayouts_1.1.0
[77] bit_4.0.5 mathjaxr_1.6-0
[79] sandwich_3.1-0 fastmatch_1.1-4
[81] codetools_0.2-19 multcomp_1.4-25
[83] BiocSingular_1.16.0 plotly_4.10.4
[85] multtest_2.56.0 mime_0.12
[87] splines_4.3.0 Rcpp_1.0.12
[89] fastDummies_1.7.3 sparseMatrixStats_1.12.2
[91] HDO.db_0.99.1 knitr_1.45
[93] blob_1.2.4 utf8_1.2.4
[95] fs_1.6.3 listenv_0.9.1
[97] DelayedMatrixStats_1.22.6 Rdpack_2.6
[99] ggsignif_0.6.4 ggplotify_0.1.2
[101] Matrix_1.6-5 statmod_1.5.0
[103] tzdb_0.4.0 tweenr_2.0.3
[105] pkgconfig_2.0.3 tools_4.3.0
[107] cachem_1.0.8 rbibutils_2.2.16
[109] RSQLite_2.3.5 viridisLite_0.4.2
[111] DBI_1.2.2 numDeriv_2016.8-1.1
[113] fastmap_1.1.1 rmarkdown_2.26
[115] scales_1.3.0 grid_4.3.0
[117] ica_1.0-3 metap_1.9
[119] broom_1.0.5 patchwork_1.2.0
[121] dotCall64_1.1-1 carData_3.0-5
[123] RANN_2.6.1 farver_2.1.1
[125] tidygraph_1.3.1 scatterpie_0.2.1
[127] yaml_2.3.8 cli_3.6.2
[129] leiden_0.4.3.1 lifecycle_1.0.4
[131] uwot_0.1.16 mvtnorm_1.2-4
[133] presto_1.0.0 bluster_1.10.0
[135] backports_1.4.1 BiocParallel_1.34.2
[137] timechange_0.3.0 gtable_0.3.4
[139] ggridges_0.5.6 progressr_0.14.0
[141] parallel_4.3.0 ape_5.7-1
[143] limma_3.56.2 jsonlite_1.8.8
[145] edgeR_3.42.4 RcppHNSW_0.6.0
[147] bitops_1.0-7 bit64_4.0.5
[149] qqconf_1.3.2 Rtsne_0.17
[151] yulab.utils_0.1.4 spatstat.utils_3.0-4
[153] BiocNeighbors_1.18.0 mutoss_0.1-13
[155] metapod_1.8.0 GOSemSim_2.26.1
[157] dqrng_0.3.2 lazyeval_0.2.2
[159] shiny_1.8.0 htmltools_0.5.7
[161] GO.db_3.17.0 sctransform_0.4.1
[163] glue_1.7.0 spam_2.10-0
[165] XVector_0.40.0 RCurl_1.98-1.14
[167] rprojroot_2.0.4 treeio_1.24.3
[169] mnormt_2.1.1 gridExtra_2.3
[171] igraph_2.0.2 R6_2.5.1
[173] labeling_0.4.3 cluster_2.1.6
[175] aplot_0.2.2 DelayedArray_0.26.7
[177] tidyselect_1.2.0 vipor_0.4.7
[179] plotrix_3.8-4 ggforce_0.4.2
[181] car_3.1-2 future_1.33.1
[183] rsvd_1.0.5 munsell_0.5.0
[185] KernSmooth_2.23-22 data.table_1.15.2
[187] htmlwidgets_1.6.4 fgsea_1.26.0
[189] rlang_1.1.3 spatstat.sparse_3.0-3
[191] spatstat.explore_3.2-6 fansi_1.0.6
[193] beeswarm_0.4.0 date()[1] "Wed Apr 3 15:43:14 2024"