suppressPackageStartupMessages({
  library(tidyverse)
  library(Seurat)
  library(magrittr)
  library(dplyr)
  library(purrr)
  library(ggplot2)
  library(here)
  library(runSeurat3)
  library(SingleCellExperiment)
  library(RColorBrewer)
  library(pheatmap)
  library(scater)
  library(scran)
  library(ggsci)
  library(viridis)
  library(tradeSeq)
  library(slingshot)
  library(monocle3)
})run trajectory analysis mLN all timepoints
load packages
heatmap function
avgHeatmap <- function(seurat, selGenes, colVecIdent, colVecCond=NULL,
                       ordVec=NULL, gapVecR=NULL, gapVecC=NULL,cc=FALSE,
                       cr=FALSE, condCol=FALSE){

  selGenes <- selGenes$gene

  ## assay data
  clusterAssigned <- as.data.frame(Idents(seurat)) %>%
  dplyr::mutate(cell=rownames(.))
  colnames(clusterAssigned)[1] <- "ident"
  seuratDat <- GetAssayData(seurat)

  ## genes of interest
  genes <- data.frame(gene=rownames(seurat)) %>%
    mutate(geneID=gsub("^.*\\.", "", gene)) %>% filter(geneID %in% selGenes)

  ## matrix with averaged cnts per ident
  logNormExpres <- as.data.frame(t(as.matrix(
    seuratDat[which(rownames(seuratDat) %in% genes$gene),])))
  logNormExpres <- logNormExpres %>% dplyr::mutate(cell=rownames(.)) %>%
    dplyr::left_join(.,clusterAssigned, by=c("cell")) %>%
    dplyr::select(-cell) %>% dplyr::group_by(ident) %>%
    dplyr::summarise_all(mean)
  logNormExpresMa <- logNormExpres %>% dplyr::select(-ident) %>% as.matrix()
  rownames(logNormExpresMa) <- logNormExpres$ident
  logNormExpresMa <- t(logNormExpresMa)
  rownames(logNormExpresMa) <- gsub("^.*?\\.","",rownames(logNormExpresMa))

  ## remove genes if they are all the same in all groups
  ind <- apply(logNormExpresMa, 1, sd) == 0
  logNormExpresMa <- logNormExpresMa[!ind,]
  genes <- genes[!ind,]

  ## color columns according to cluster
  annotation_col <- as.data.frame(gsub("(^.*?_)","",
                                       colnames(logNormExpresMa)))%>%
    dplyr::mutate(celltype=gsub("(_.*$)","",colnames(logNormExpresMa)))
  colnames(annotation_col)[1] <- "col1"
  annotation_col <- annotation_col %>%
    dplyr::mutate(cond = gsub(".*_","",col1)) %>%
    dplyr::select(cond, celltype)
  rownames(annotation_col) <- colnames(logNormExpresMa)

  ann_colors = list(
      cond = colVecCond,
      celltype=colVecIdent)
  if(is.null(ann_colors$cond)){
    annotation_col$cond <- NULL
  }

  ## adjust order
  logNormExpresMa <- logNormExpresMa[selGenes,]
  if(is.null(ordVec)){
    ordVec <- levels(seurat)
  }
  logNormExpresMa <- logNormExpresMa[,ordVec]

  ## scaled row-wise
  pheatmap(logNormExpresMa, scale="row" ,treeheight_row = 0, cluster_rows = cr,
         cluster_cols = cc,
         color = colorRampPalette(c("#2166AC", "#F7F7F7", "#B2182B"))(50),
         annotation_col = annotation_col, cellwidth=15, cellheight=10,
         annotation_colors = ann_colors, gaps_row = gapVecR, gaps_col = gapVecC)
}
signature plot funct
## adapted from CellMixS
visGroup_adapt <- function (sce,group,dim_red = "TSNE",col_group=pal_nejm()(8))
{
    if (!is(sce, "SingleCellExperiment")) {
        stop("Error:'sce' must be a 'SingleCellExperiment' object.")
    }
    if (!group %in% names(colData(sce))) {
        stop("Error: 'group' variable must be in 'colData(sce)'")
    }
    cell_names <- colnames(sce)
    if (!dim_red %in% "TSNE") {
        if (!dim_red %in% reducedDimNames(sce)) {
            stop("Please provide a dim_red method listed in reducedDims of sce")
        }
        red_dim <- as.data.frame(reducedDim(sce, dim_red))
    }
    else {
        if (!"TSNE" %in% reducedDimNames(sce)) {
            if ("logcounts" %in% names(assays(sce))) {
                sce <- runTSNE(sce)
            }
            else {
                sce <- runTSNE(sce, exprs_values = "counts")
            }
        }
        red_dim <- as.data.frame(reducedDim(sce, "TSNE"))
    }
    colnames(red_dim) <- c("red_dim1", "red_dim2")
    df <- data.frame(sample_id = cell_names, group_var = colData(sce)[,
        group], red_Dim1 = red_dim$red_dim1, red_Dim2 = red_dim$red_dim2)
    t <- ggplot(df, aes_string(x = "red_Dim1", y = "red_Dim2")) +
        xlab(paste0(dim_red, "_1")) + ylab(paste0(dim_red, "_2")) +
        theme_void() + theme(aspect.ratio = 1,
                             panel.grid.minor = element_blank(),
        panel.grid.major = element_line(color = "grey", size = 0.3))
    t_group <- t + geom_point(size = 1.5, alpha = 0.8,
                              aes_string(color = "group_var")) +
        guides(color = guide_legend(override.aes = list(size = 1),
            title = group)) + ggtitle(group)
    if (is.numeric(df$group_var)) {
        t_group <- t_group + scale_color_viridis(option = "D")
    }
    else {
        t_group <- t_group + scale_color_manual(values = col_group)
    }
    t_group
}
set dir and load sample
basedir <- here()
seurat <- readRDS(paste0(basedir, "/data/WT_allTime_mLNonly_WtplusLtbr_EYFPonly_labelTrans",
                         "_seurat.rds"))

colCond <- c("#446a7f", "#cb7457")
names(colCond) <- c("LTbR", "WT")

colAge <- c("#440154FF", "#3B528BFF", "#21908CFF", "#5DC863FF", "#FDE725FF")
names(colAge) <- c("E18" , "P7", "3w", "8w","E17to7wk")

colPal <- c("#DAF7A6", "#FFC300", "#FF5733", "#C70039", "#900C3F", "#b66e8d",
            "#61a4ba", "#6178ba", "#54a87f",  "#25328a",
            "#b6856e", "#0073C2FF", "#EFC000FF", "#868686FF", "#CD534CFF",
            "#7AA6DCFF", "#003C67FF", "#8F7700FF", "#3B3B3BFF", "#A73030FF",
            "#4A6990FF")[1:length(unique(seurat$RNA_snn_res.0.8))]
names(colPal) <- unique(seurat$RNA_snn_res.0.8)

colDat <- colDat <- c(pal_npg()(10),pal_futurama()(12), pal_aaas()(10),
                      pal_jama()(8))[1:length(unique(seurat$dataset))]
names(colDat) <- unique(seurat$dataset)

colLab <- c("#42a071", "#900C3F","#b66e8d", "#61a4ba", "#424671", "#003C67FF",
            "#e3953d", "#714542", "#b6856e", "#a4a4a4")

names(colLab) <- c("FDC/MRC", "TRC", "TBRC", "MedRC/IFRC", "MedRC" , "actMedRC",
                   "PRC", "Pi16+RC", "VSMC", "unassigned")
DimPlot all
clustering
DimPlot(seurat, reduction = "umap", group.by = "RNA_snn_res.0.4",
        cols = colPal)+
  theme_bw() +
  theme(axis.text = element_blank(), axis.ticks = element_blank(),
        panel.grid.minor = element_blank()) +
  xlab("UMAP1") +
  ylab("UMAP2")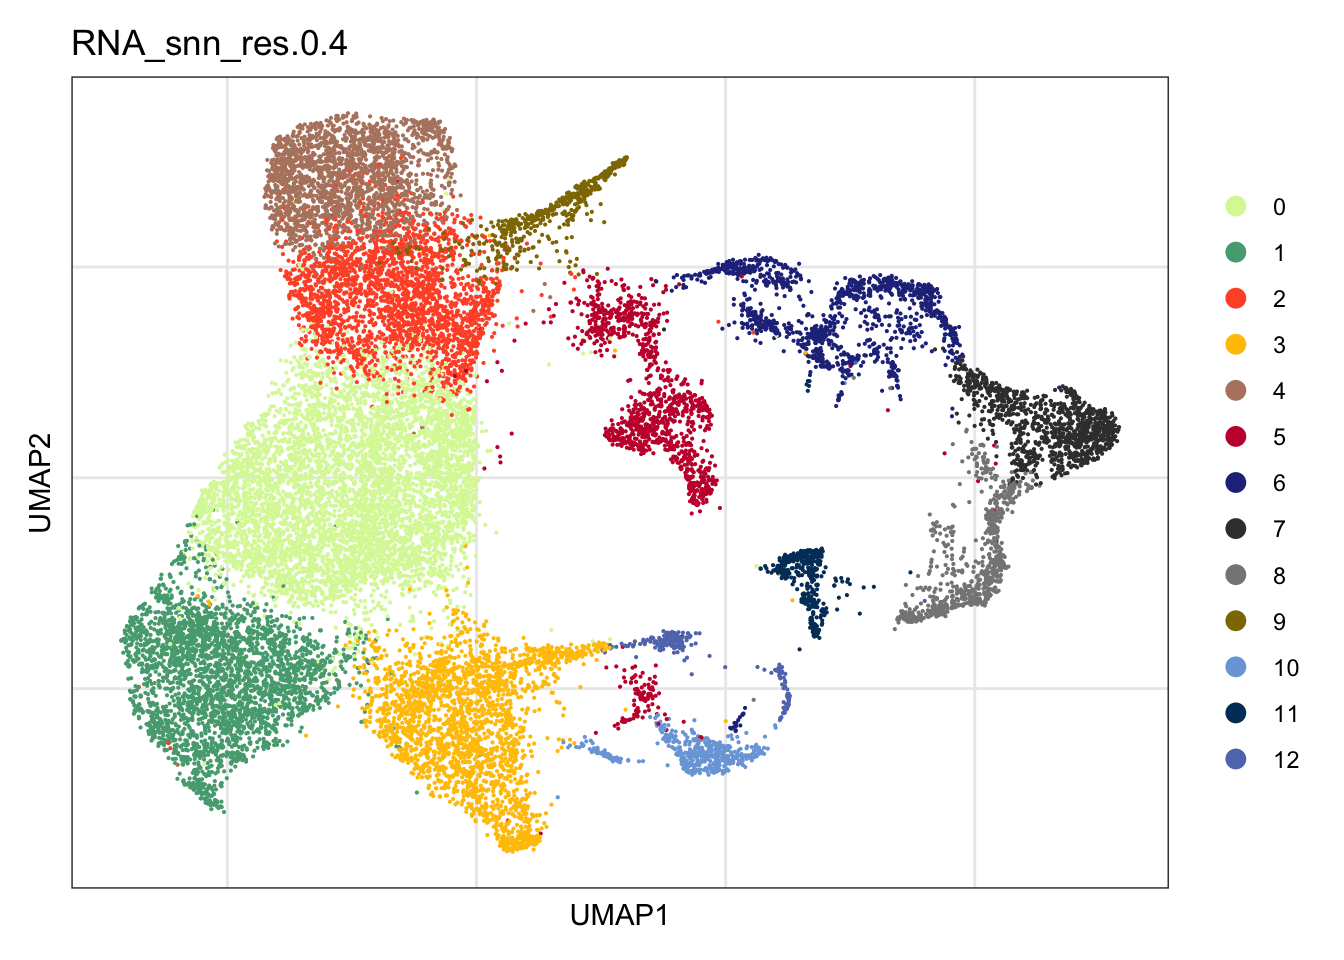
vis age
DimPlot(seurat, reduction = "umap", group.by = "age",
        cols = colAge)+
  theme_bw() +
  theme(axis.text = element_blank(), axis.ticks = element_blank(),
        panel.grid.minor = element_blank()) +
  xlab("UMAP1") +
  ylab("UMAP2")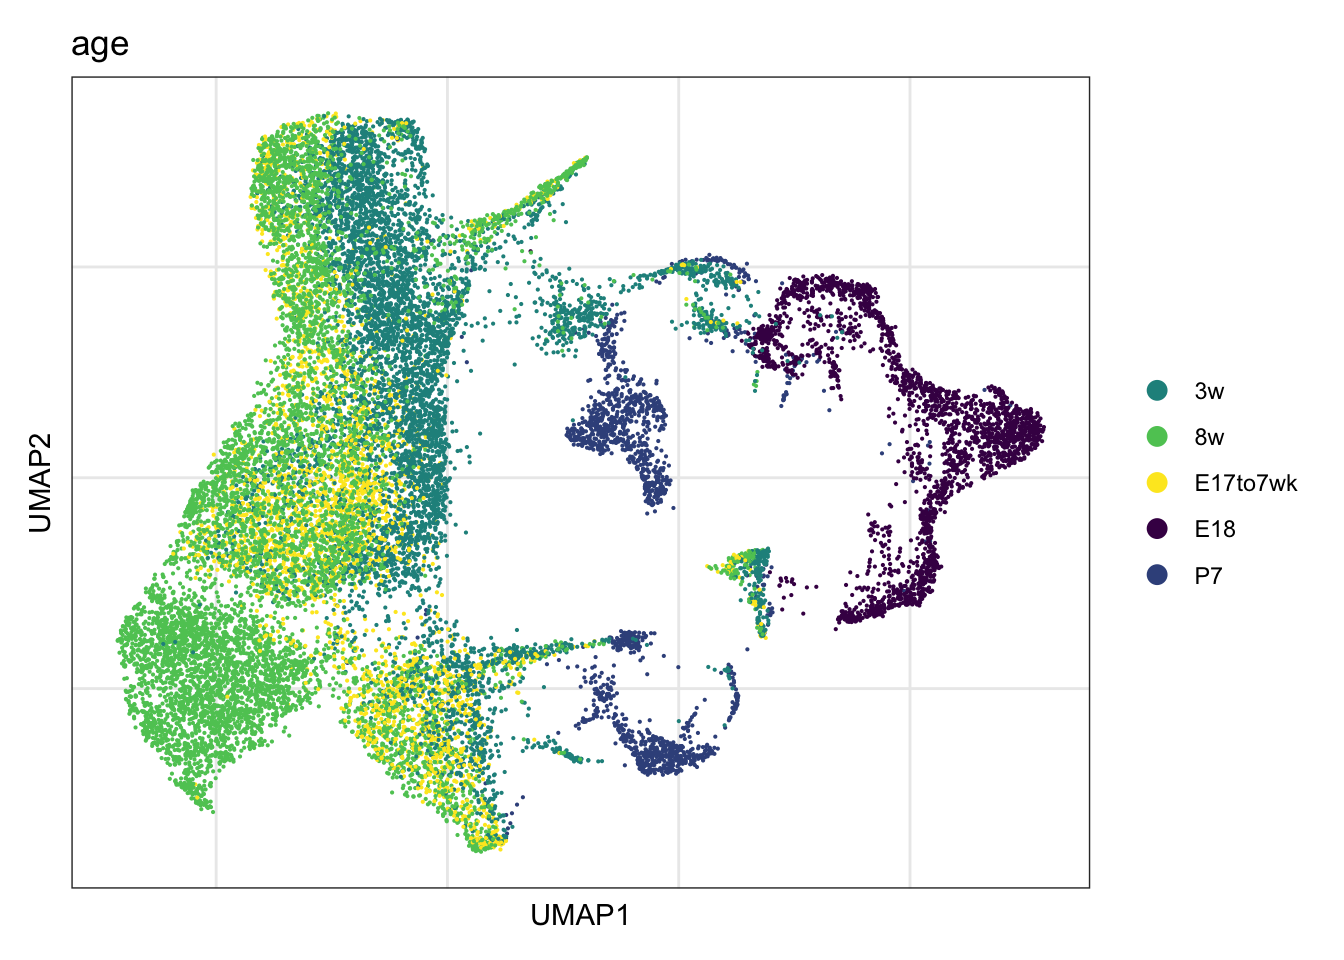
DimPlot(seurat, reduction = "umap", group.by = "age", pt.size=0.5,
        cols = colAge)+
  theme_void()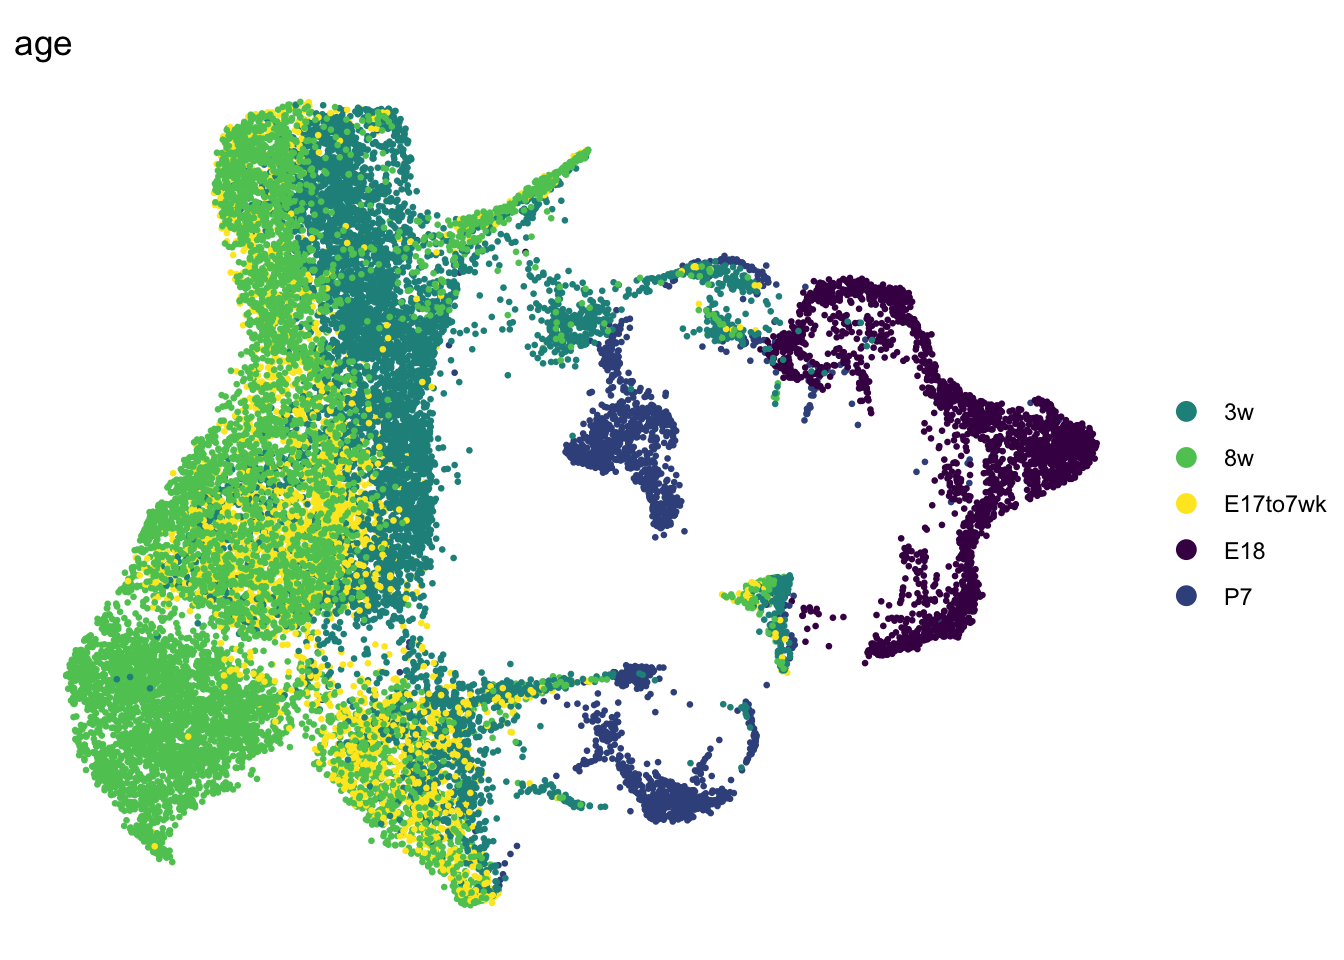
seuratSub <- subset(seurat, cond == "WT")
seuratSub$age2 <- seurat$age
seuratSub$age2[which(seuratSub$age %in% c("8w", "E17to7wk"))] <- "8w"

DimPlot(seuratSub, reduction = "umap", group.by = "age2", pt.size=1,
        cols = colAge)+
  theme_void()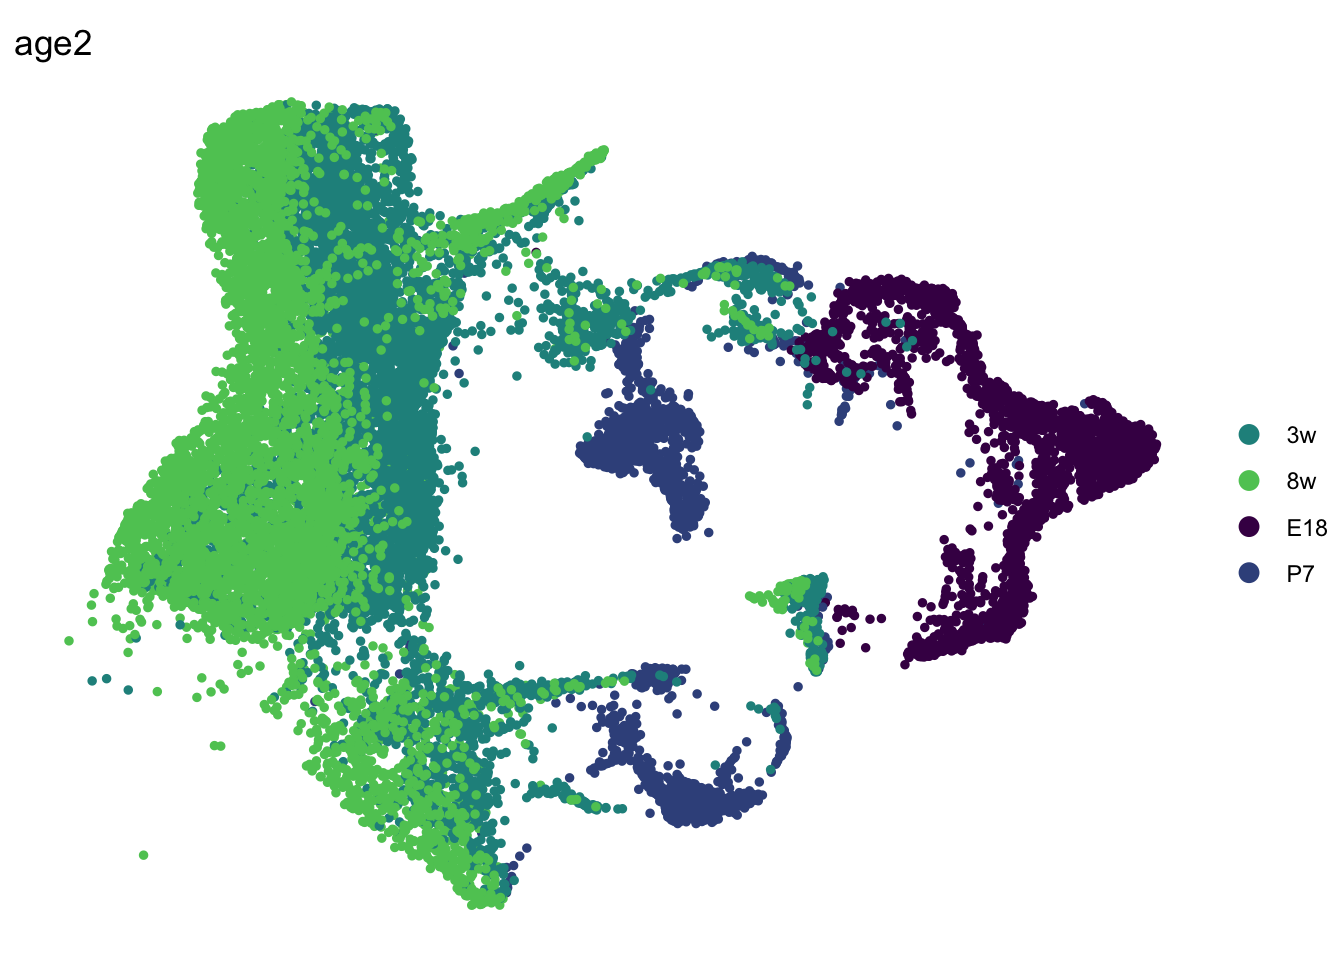
vis cond
DimPlot(seurat, reduction = "umap", group.by = "cond",
        cols = colCond, shuffle=T)+
  theme_bw() +
  theme(axis.text = element_blank(), axis.ticks = element_blank(),
        panel.grid.minor = element_blank()) +
  xlab("UMAP1") +
  ylab("UMAP2")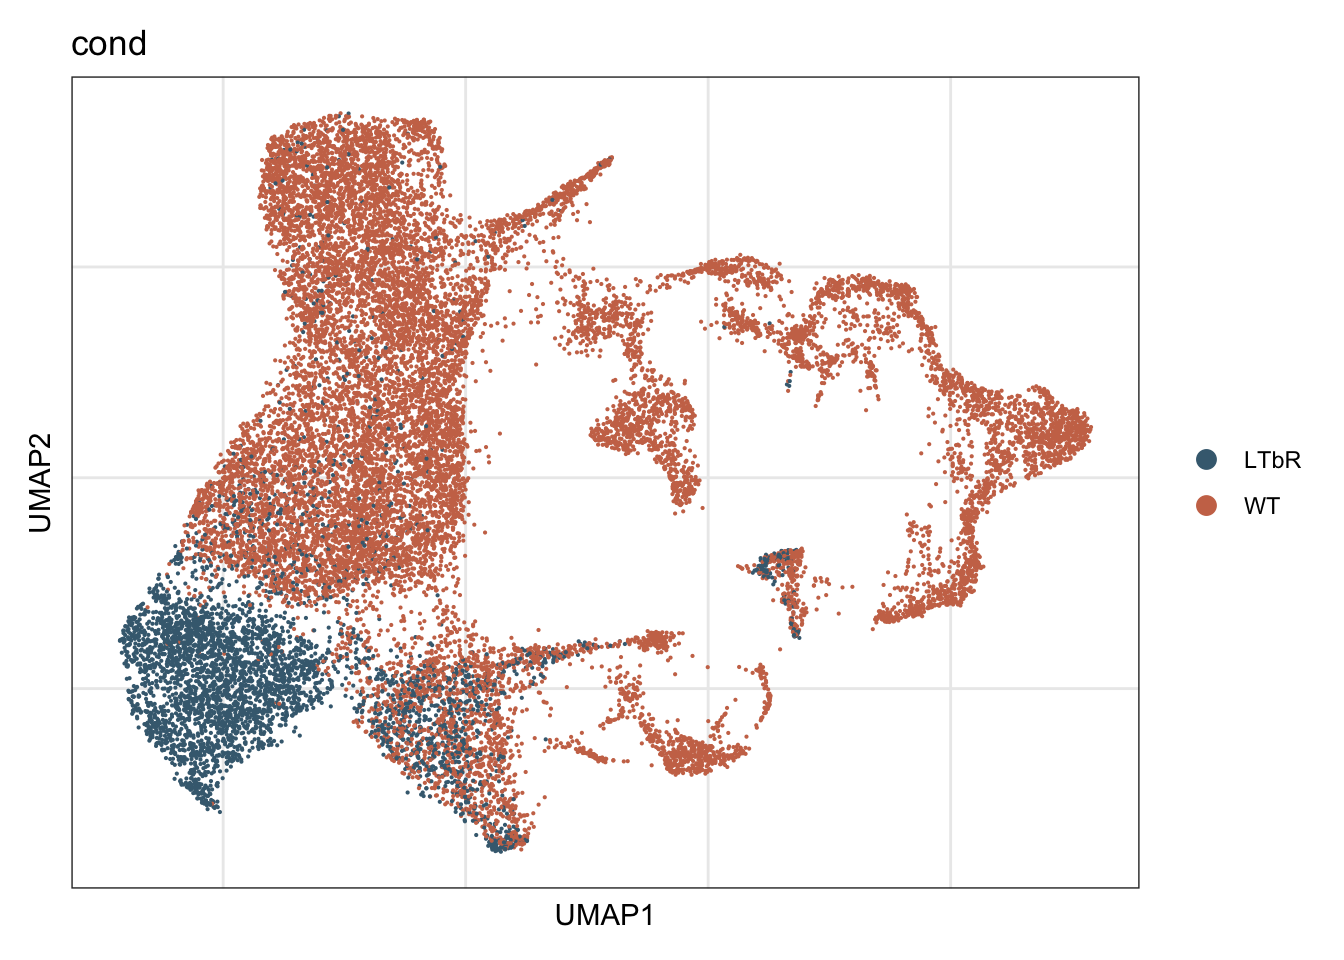
DimPlot(seurat, reduction = "umap", group.by = "cond", pt.size=0.5,
        cols = colCond, shuffle=T)+
  theme_void()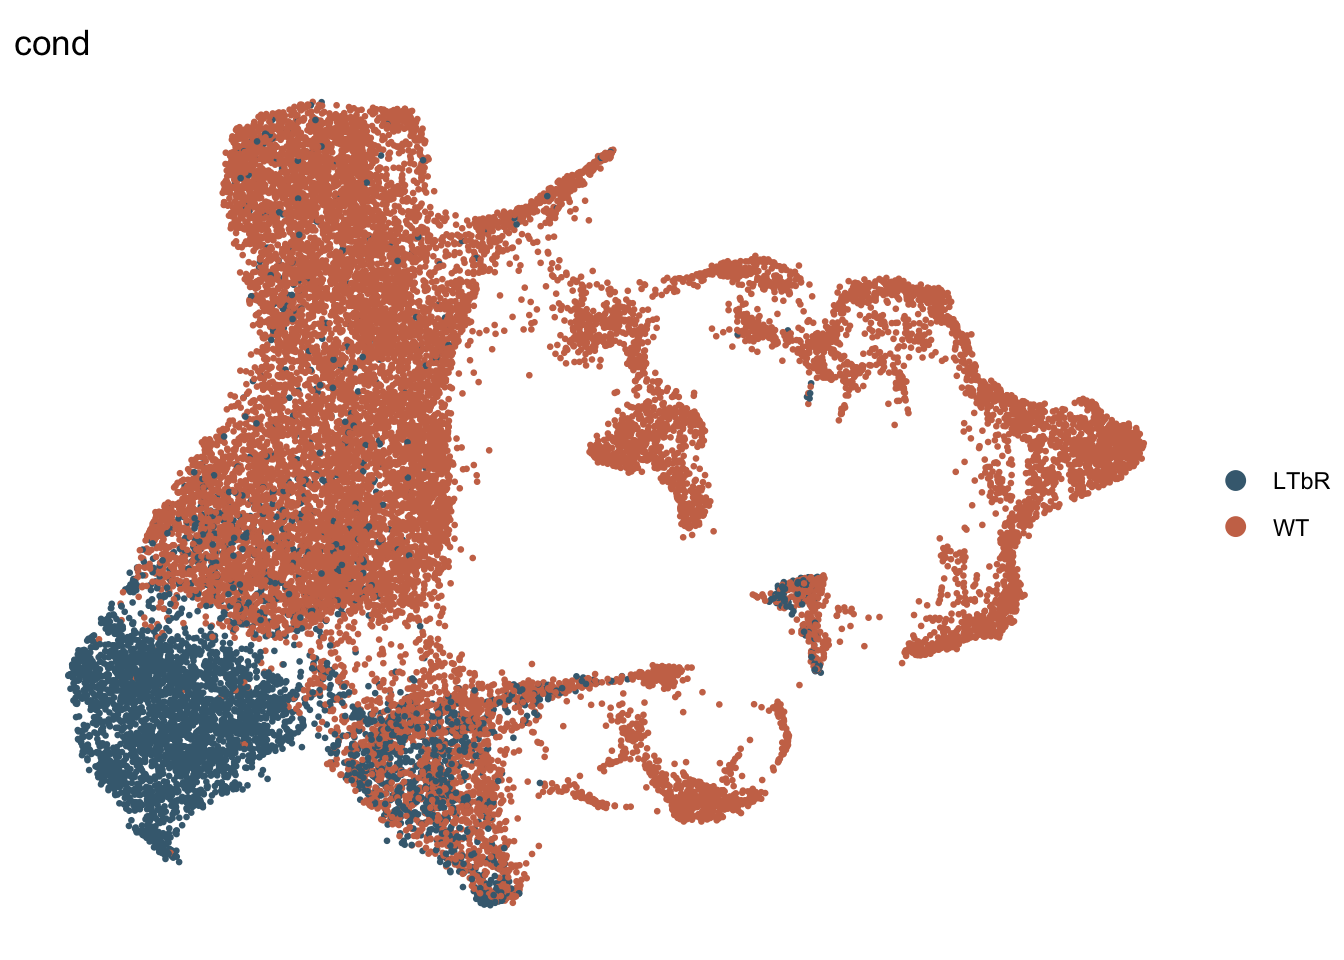
vis label
DimPlot(seurat, reduction = "umap", group.by = "label",
        cols = colLab, shuffle=T)+
  theme_bw() +
  theme(axis.text = element_blank(), axis.ticks = element_blank(),
        panel.grid.minor = element_blank()) +
  xlab("UMAP1") +
  ylab("UMAP2")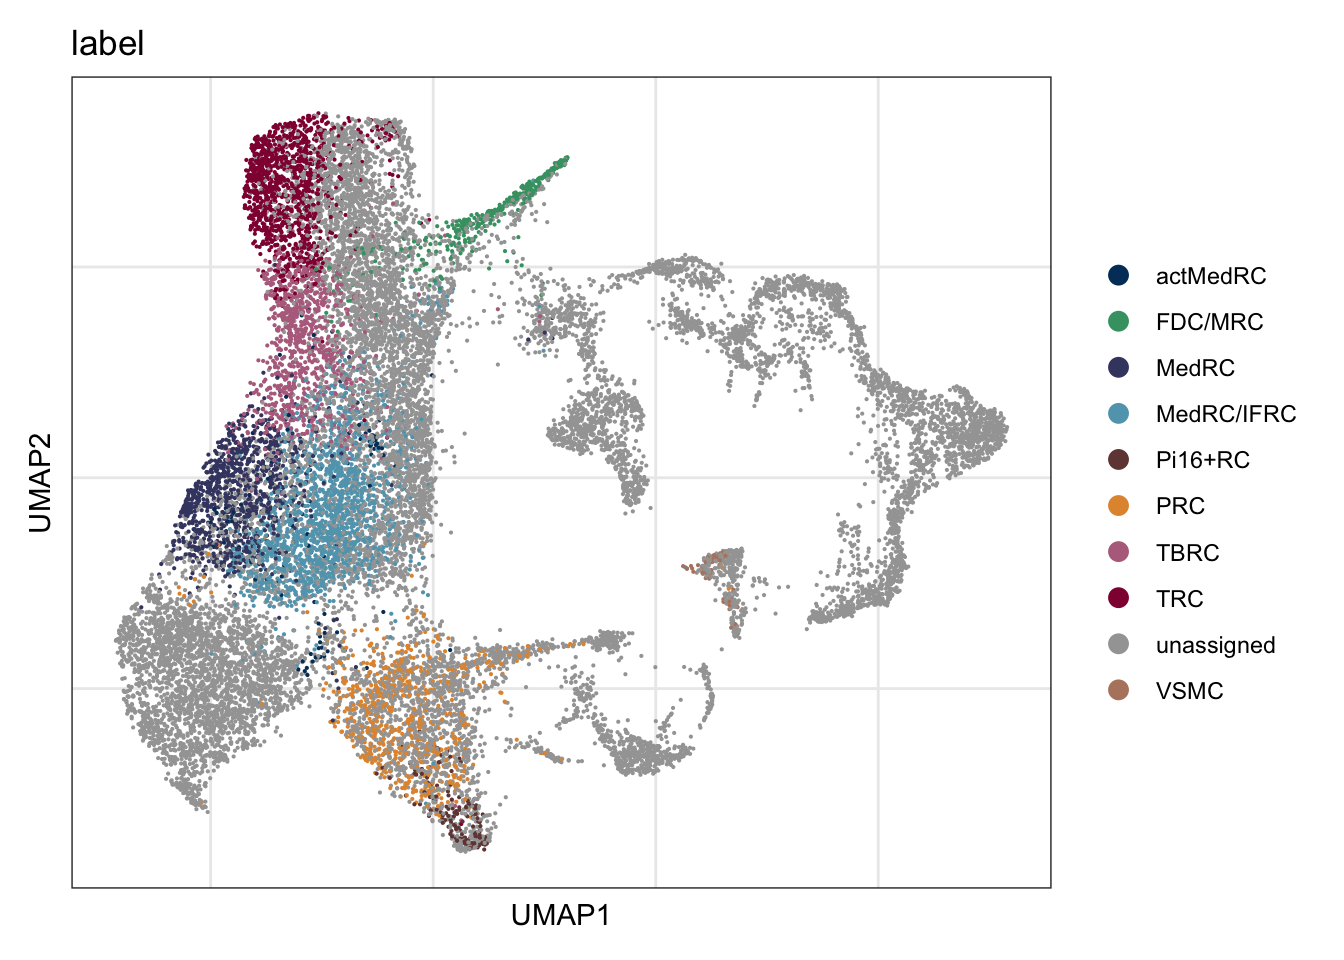
DimPlot(seurat, reduction = "umap", group.by = "label", pt.size=0.5,
        cols = colLab, shuffle=F)+
  theme_void()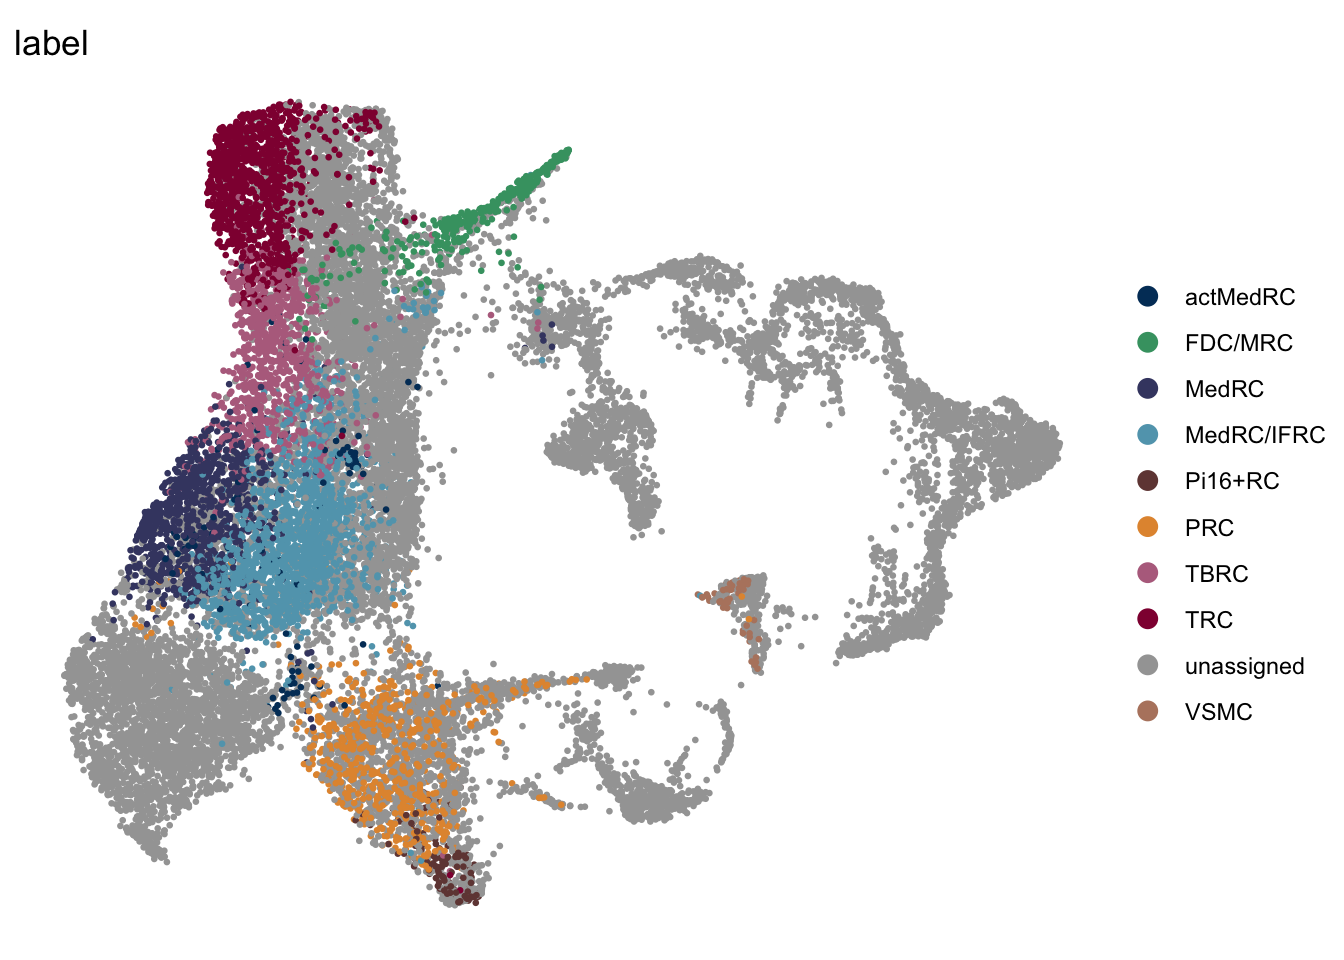
DimPlot(seuratSub, reduction = "umap", group.by = "label", pt.size=1,
        cols = colLab, shuffle=F)+
  theme_void()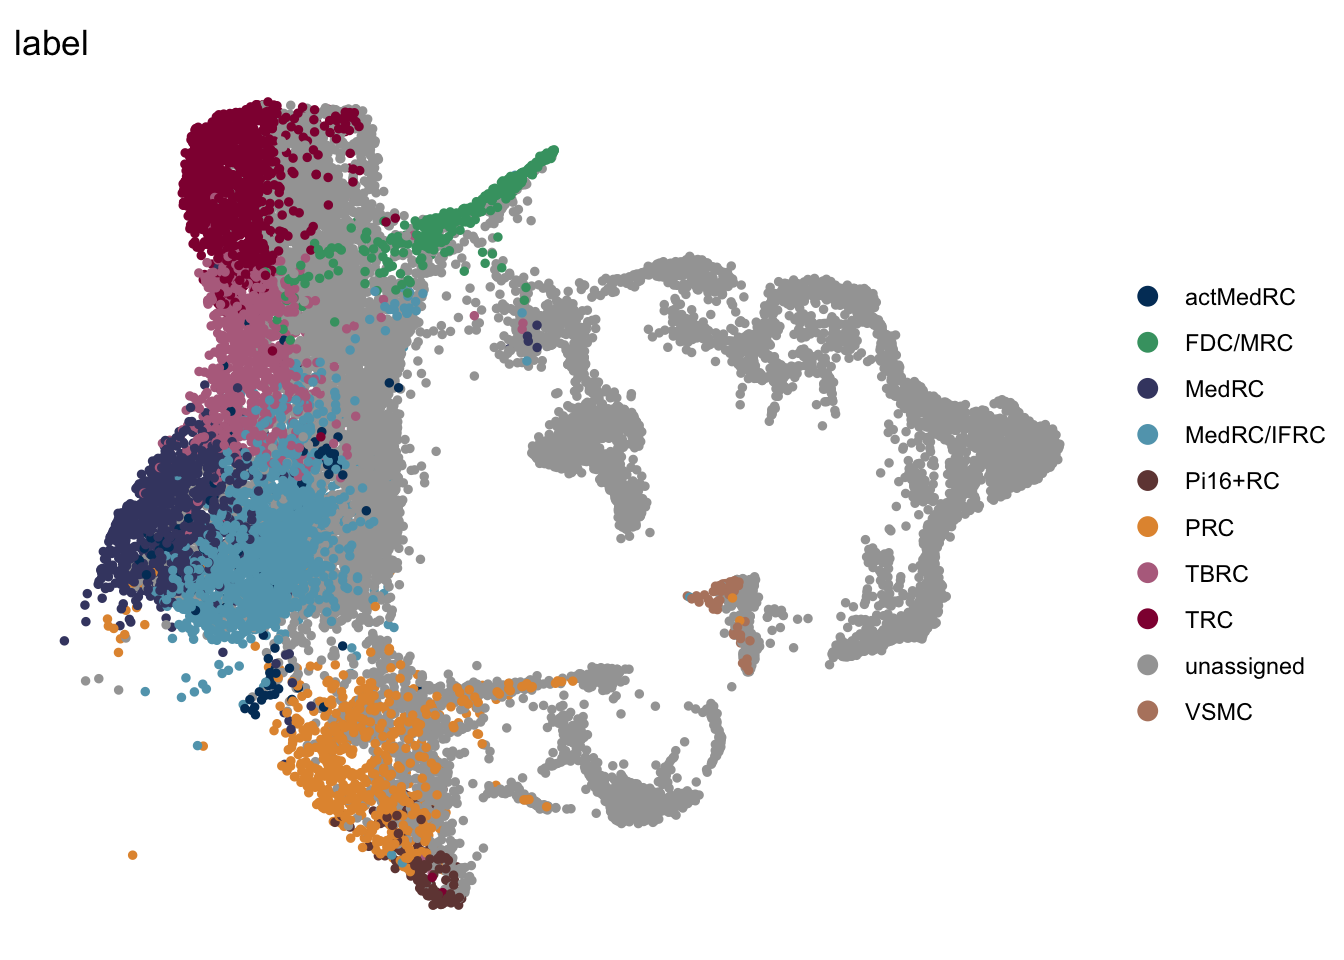
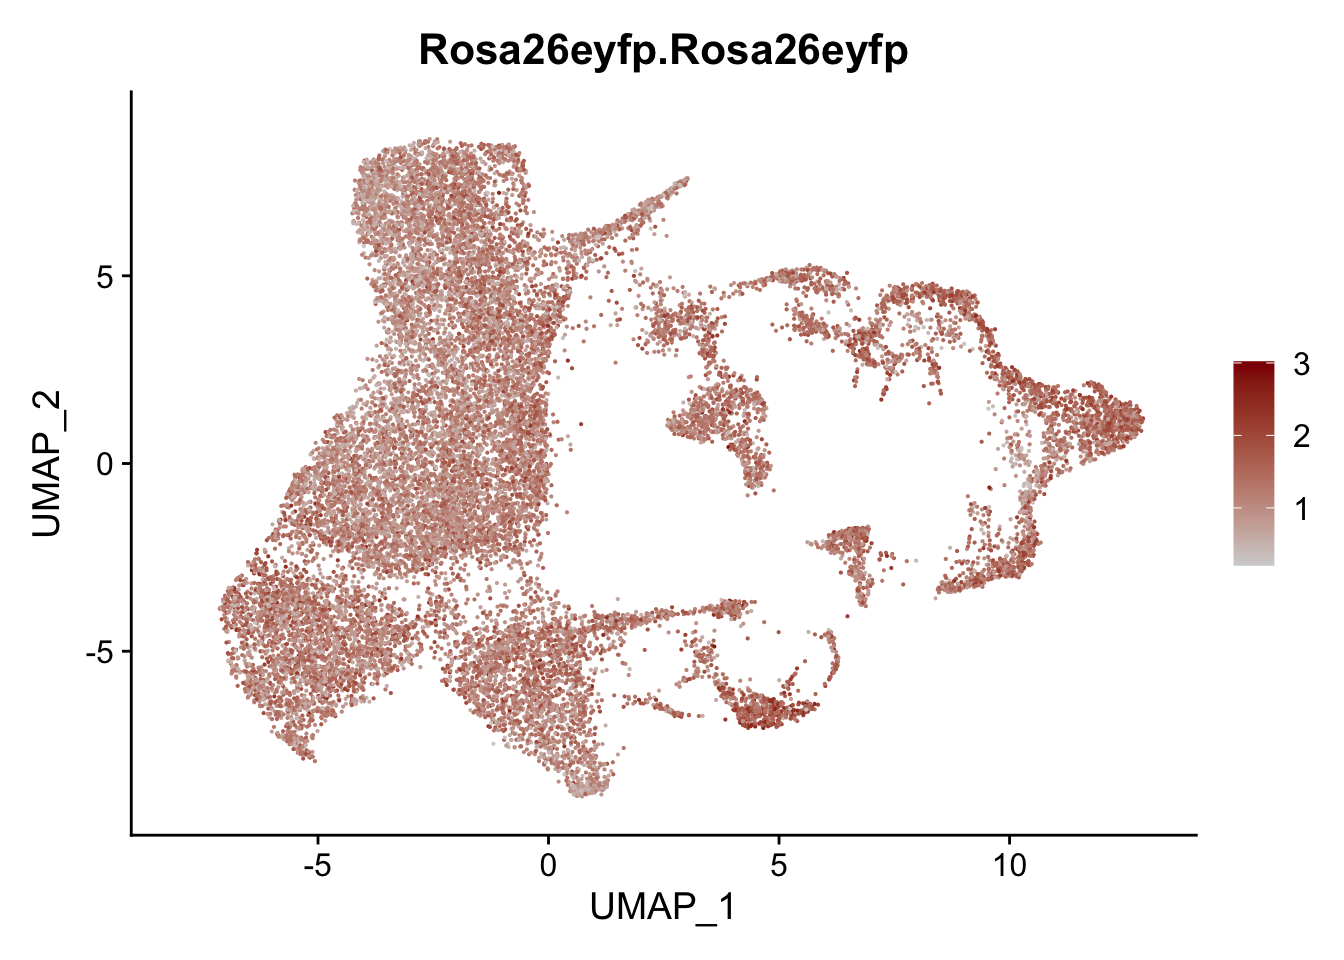
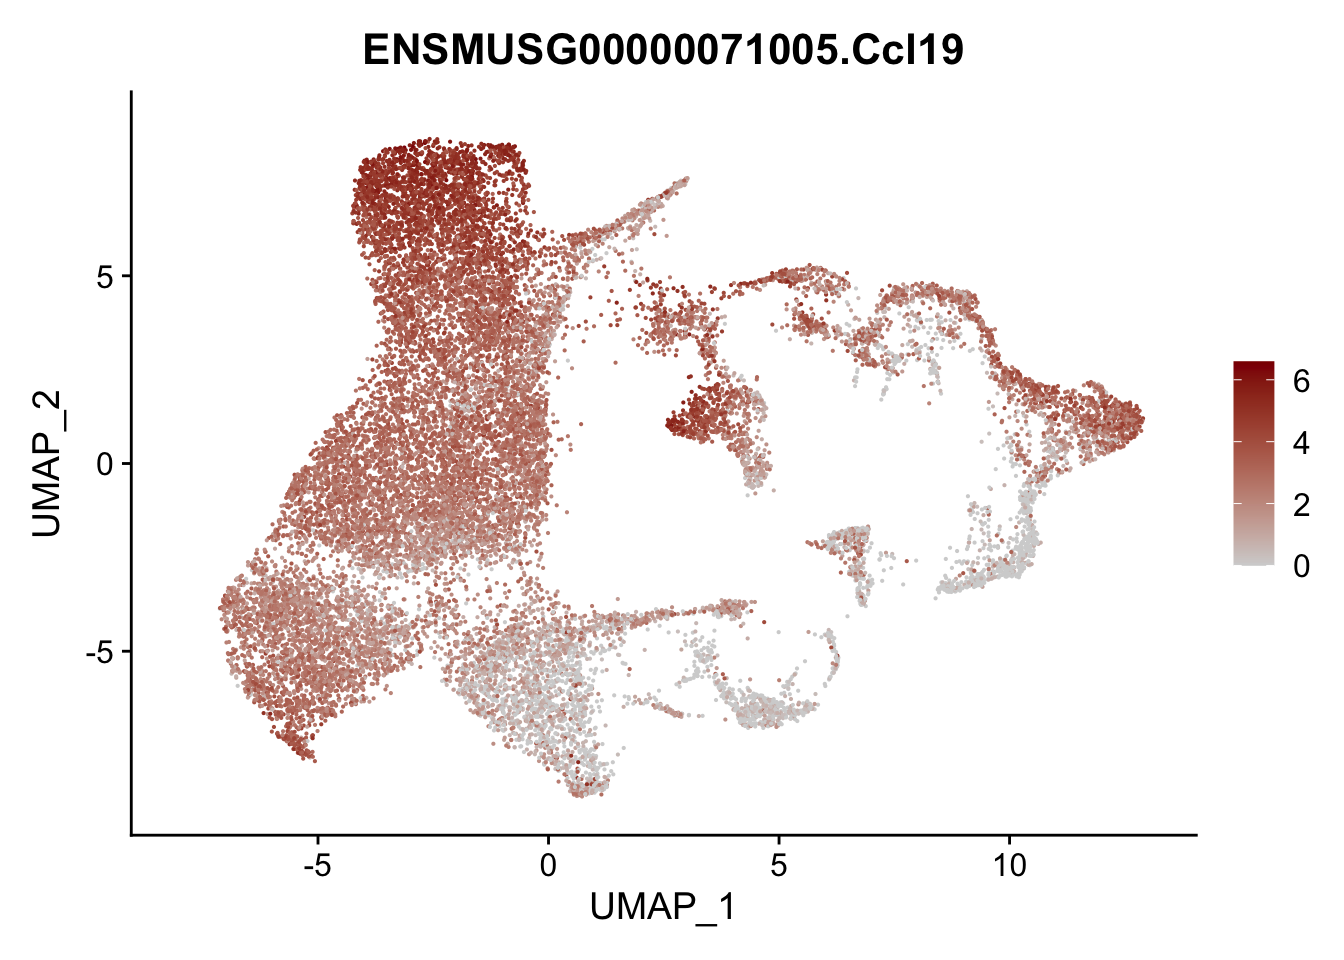
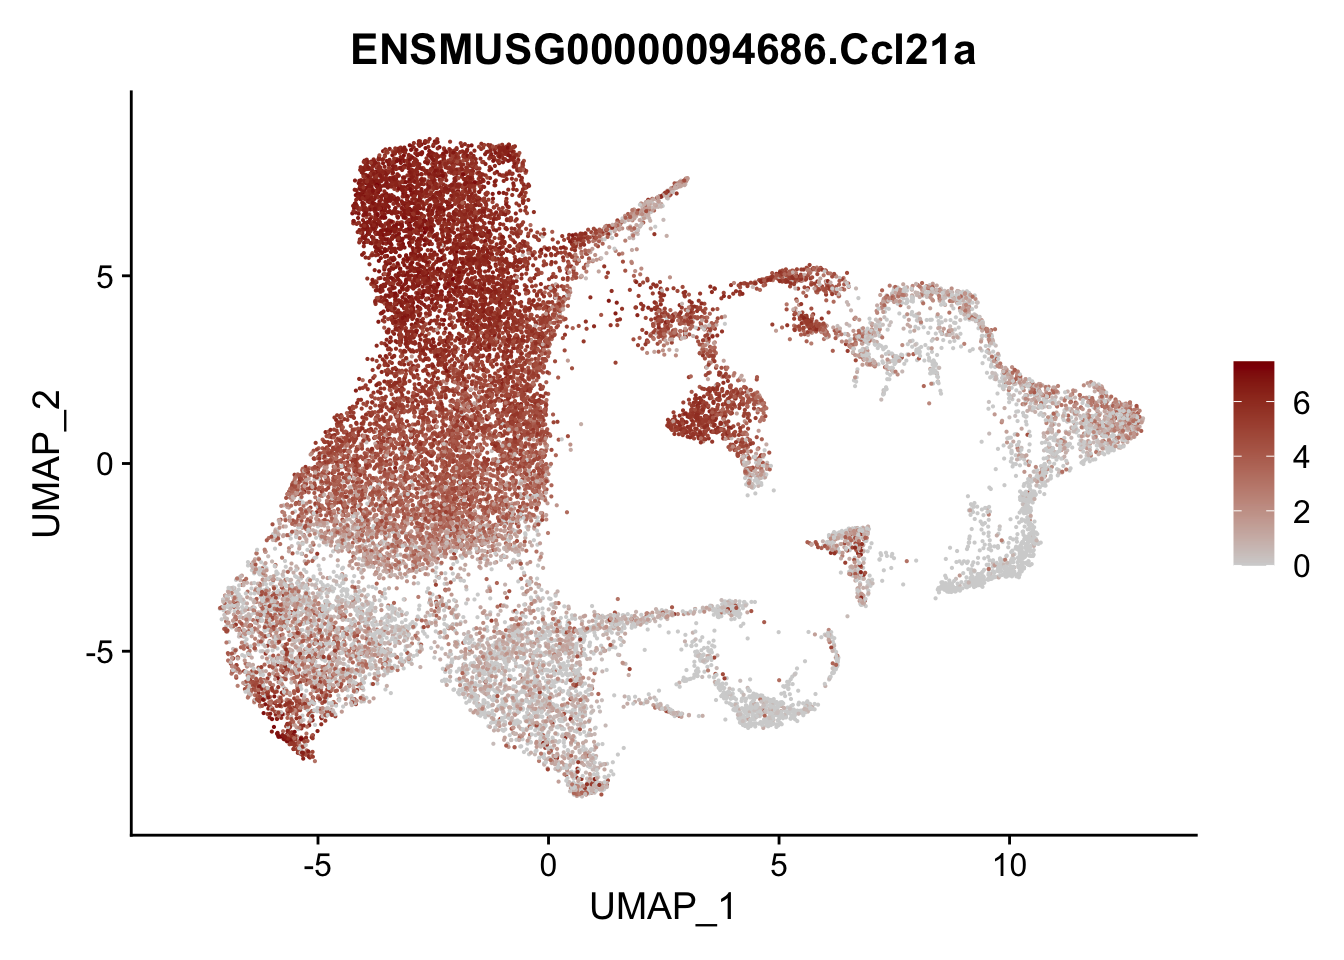
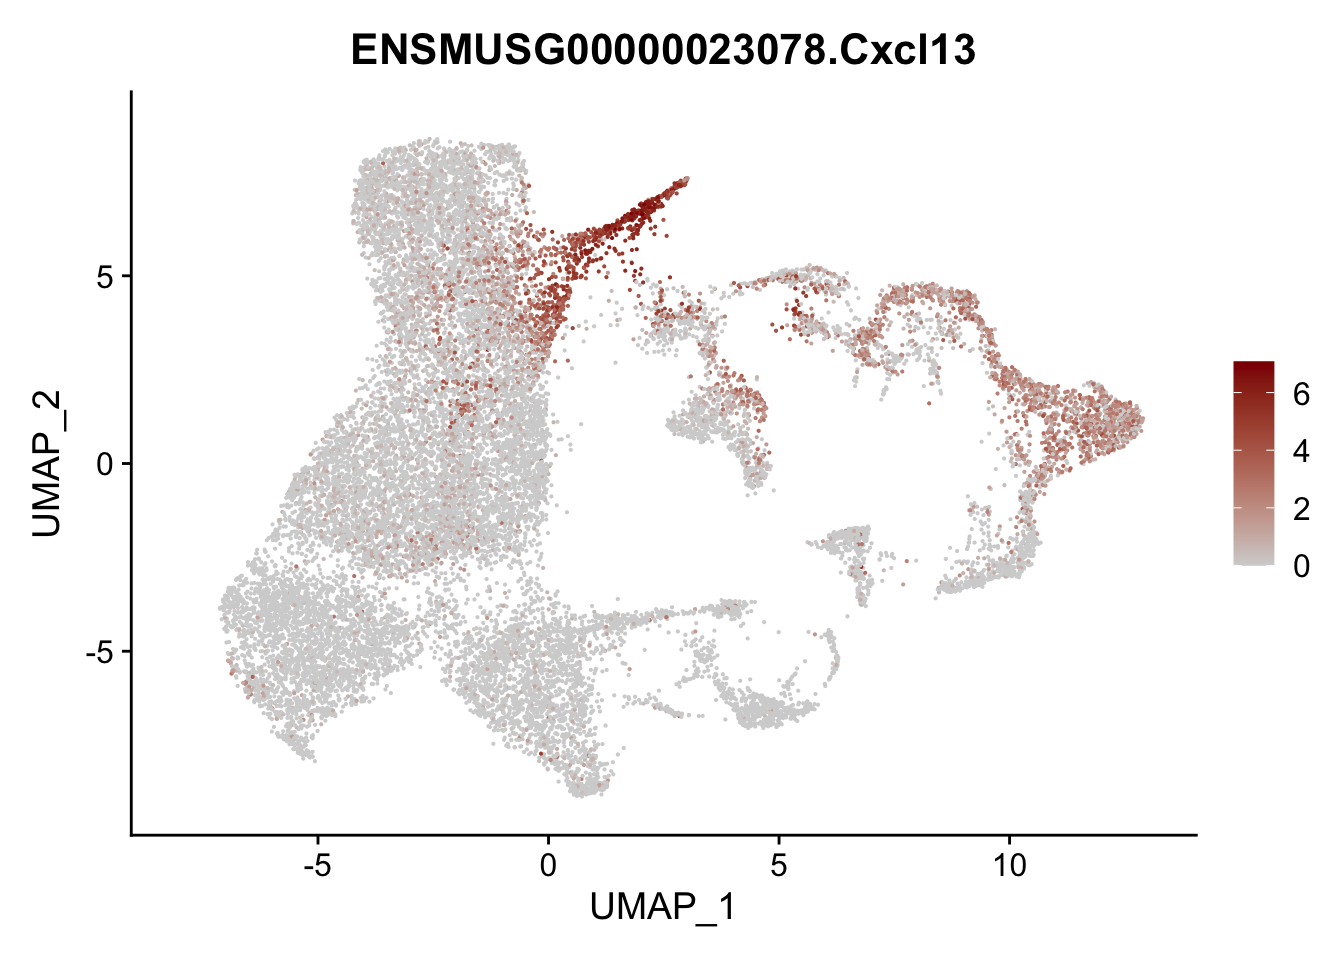
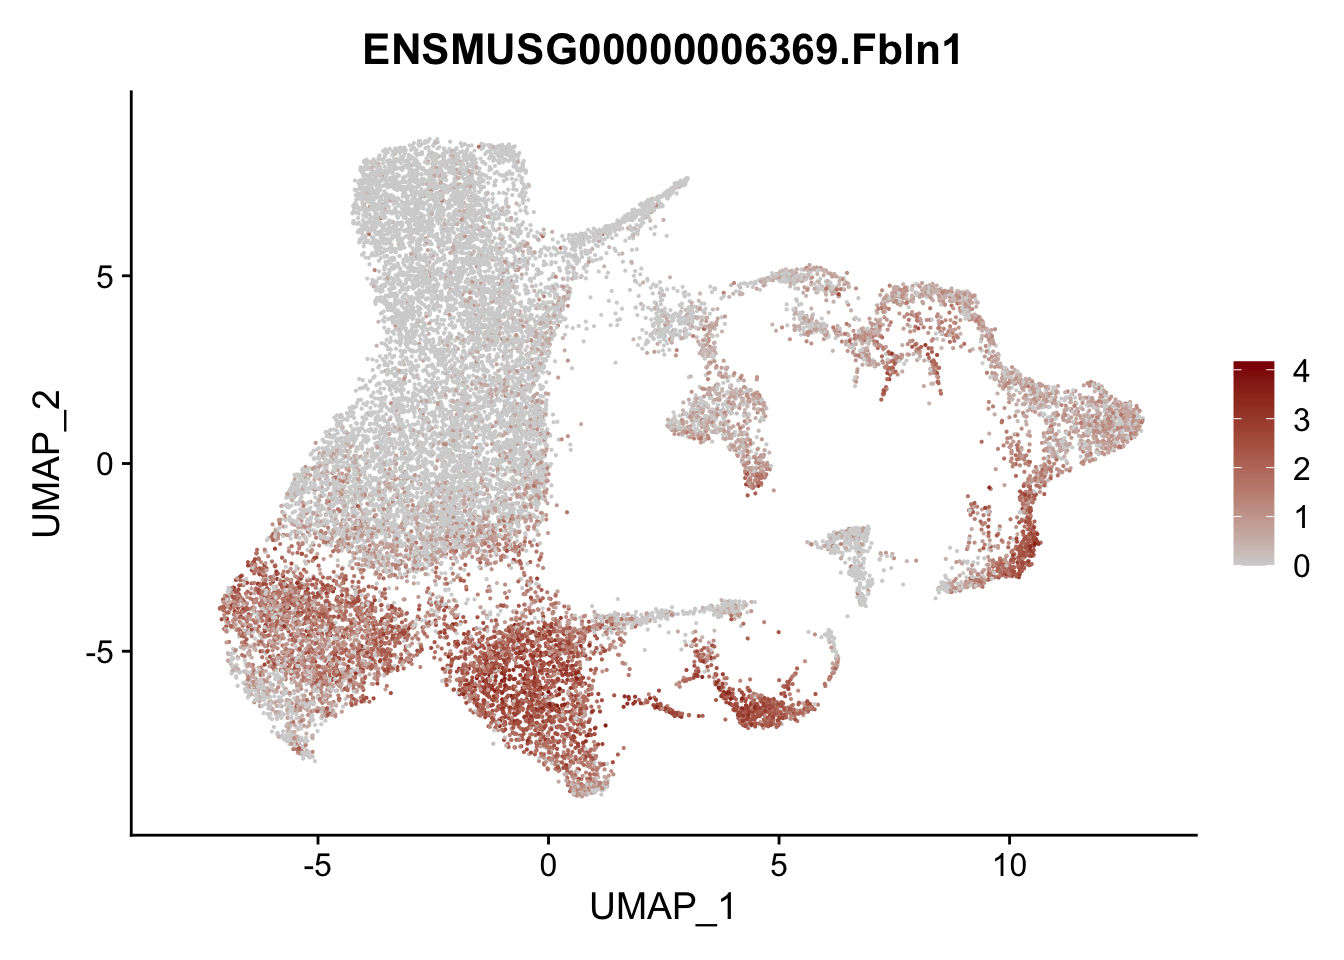
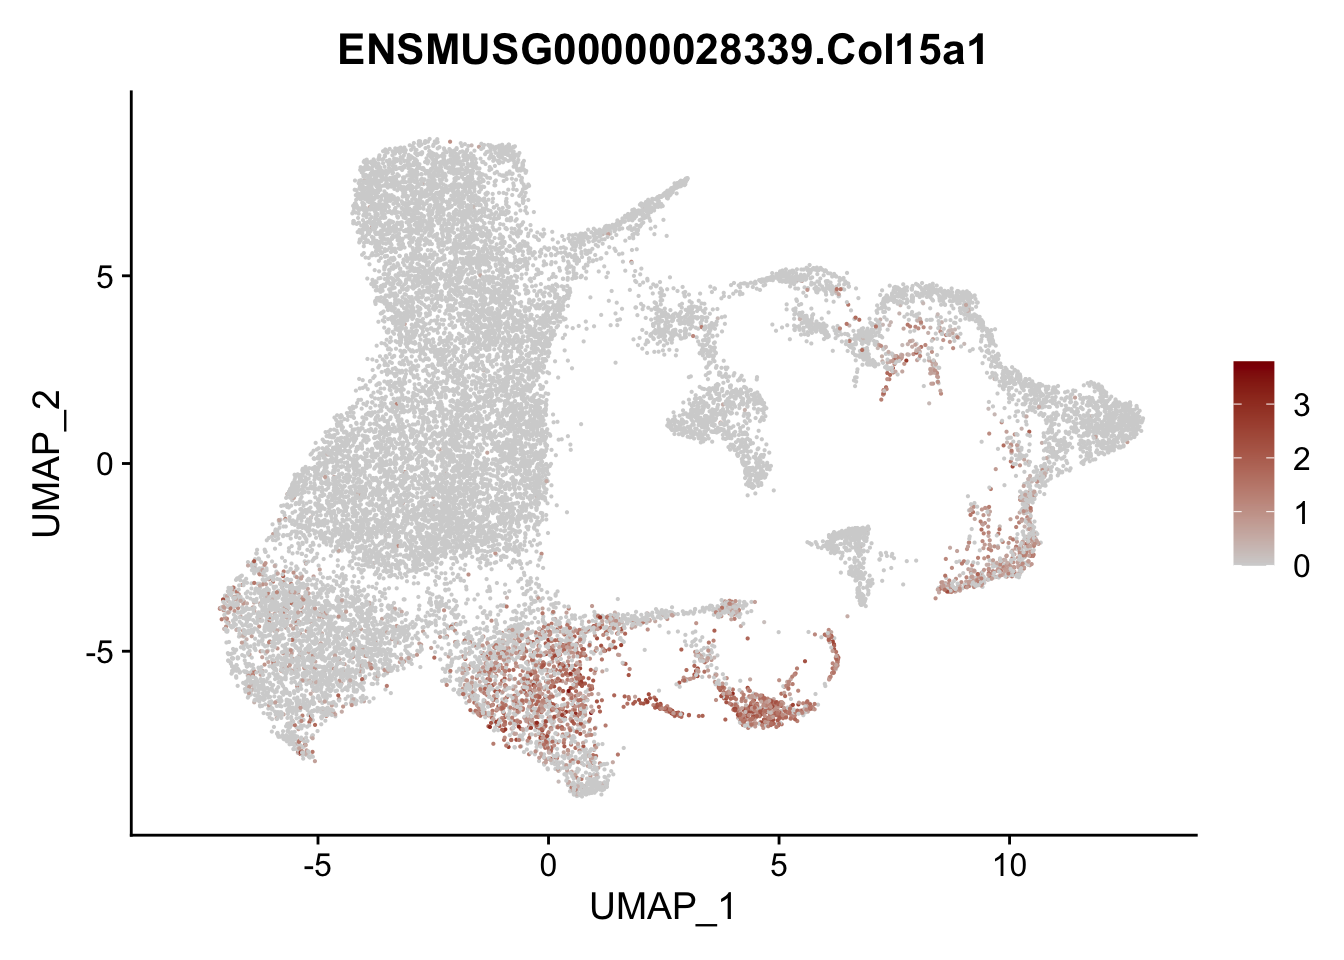
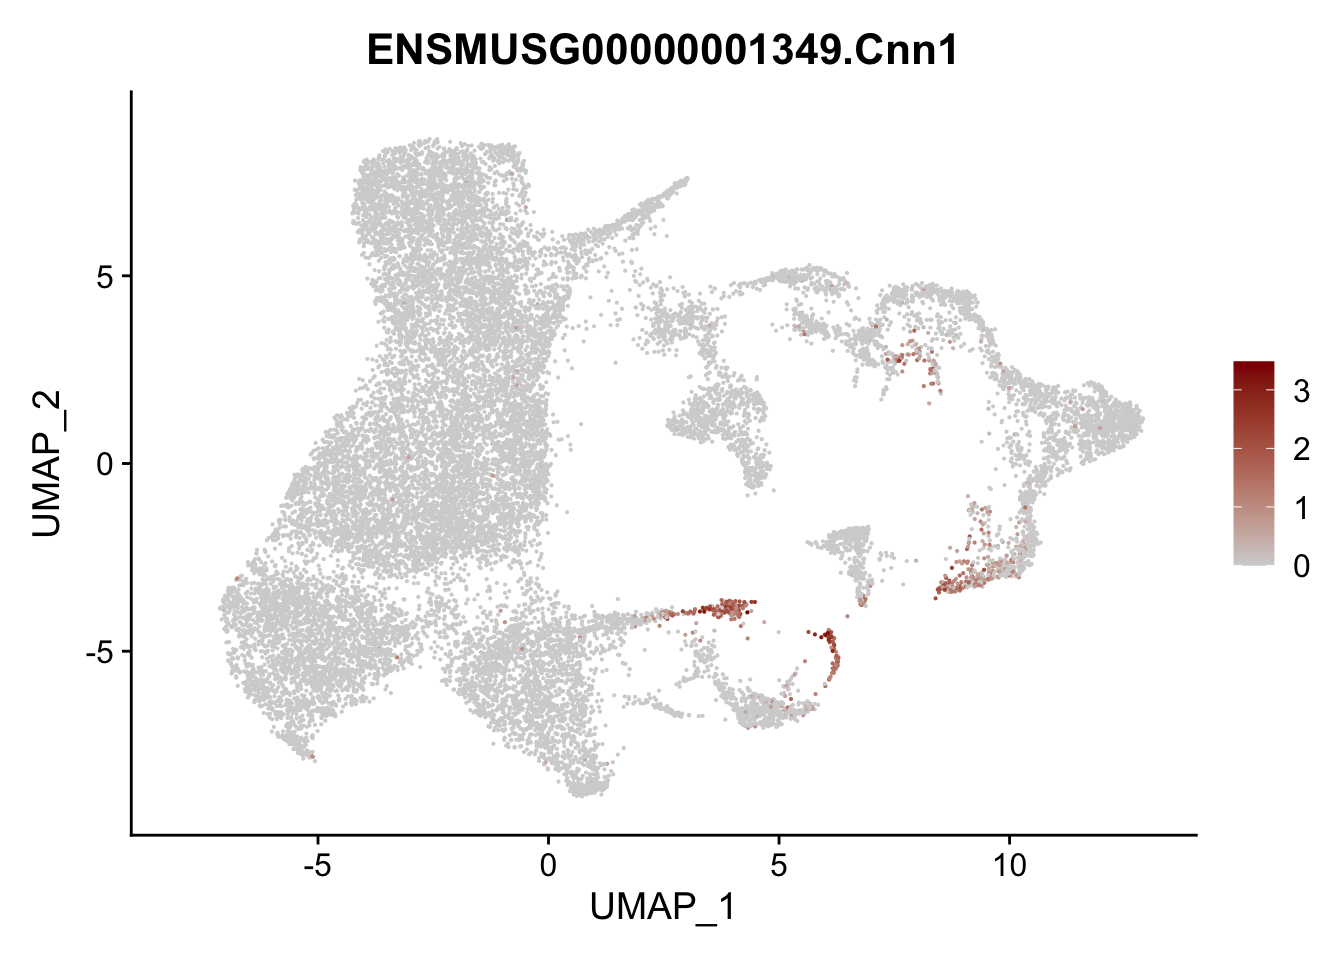
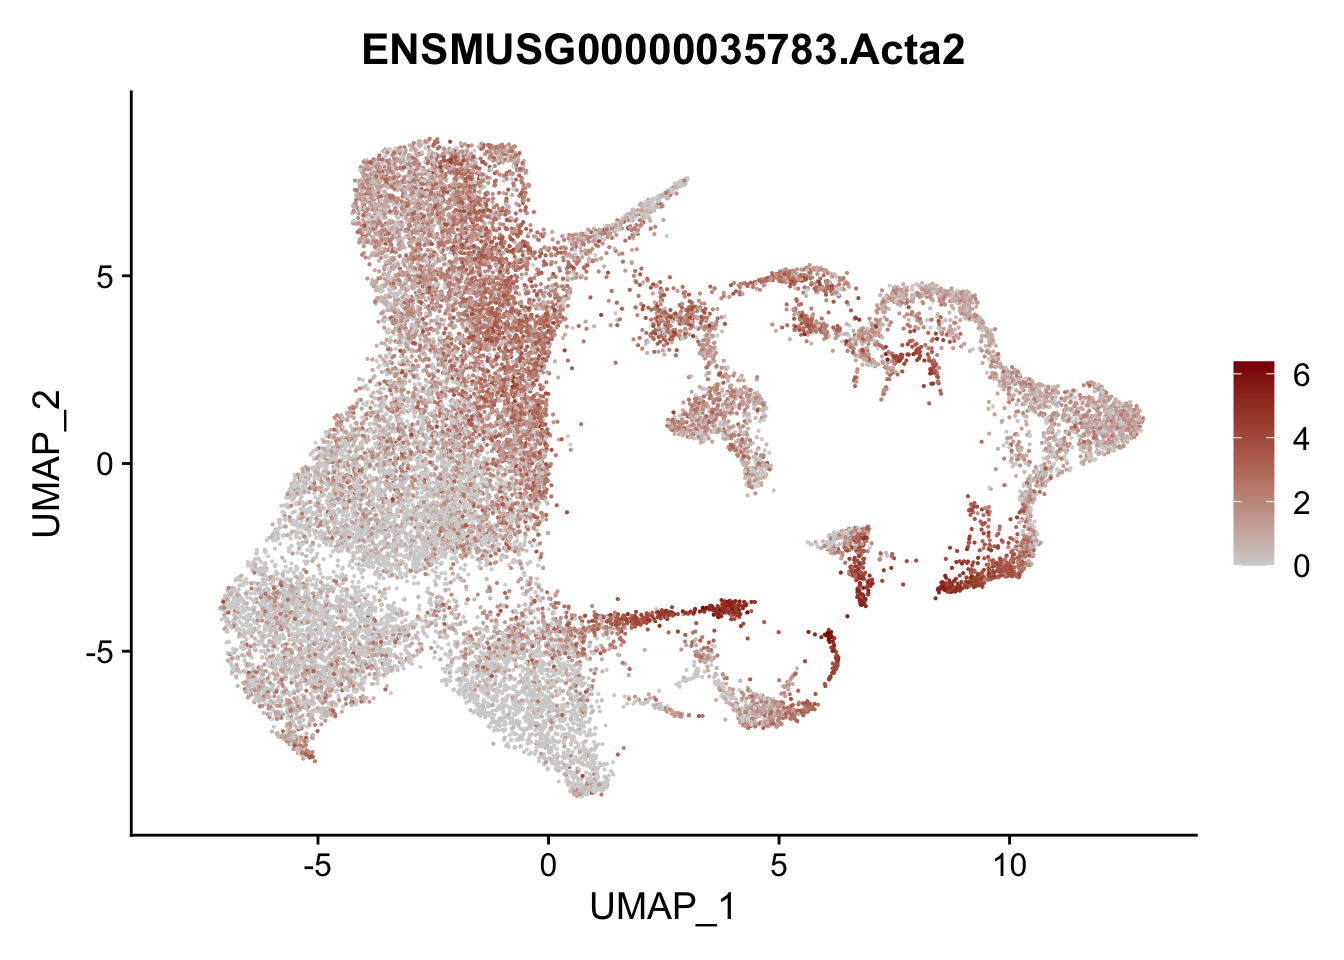
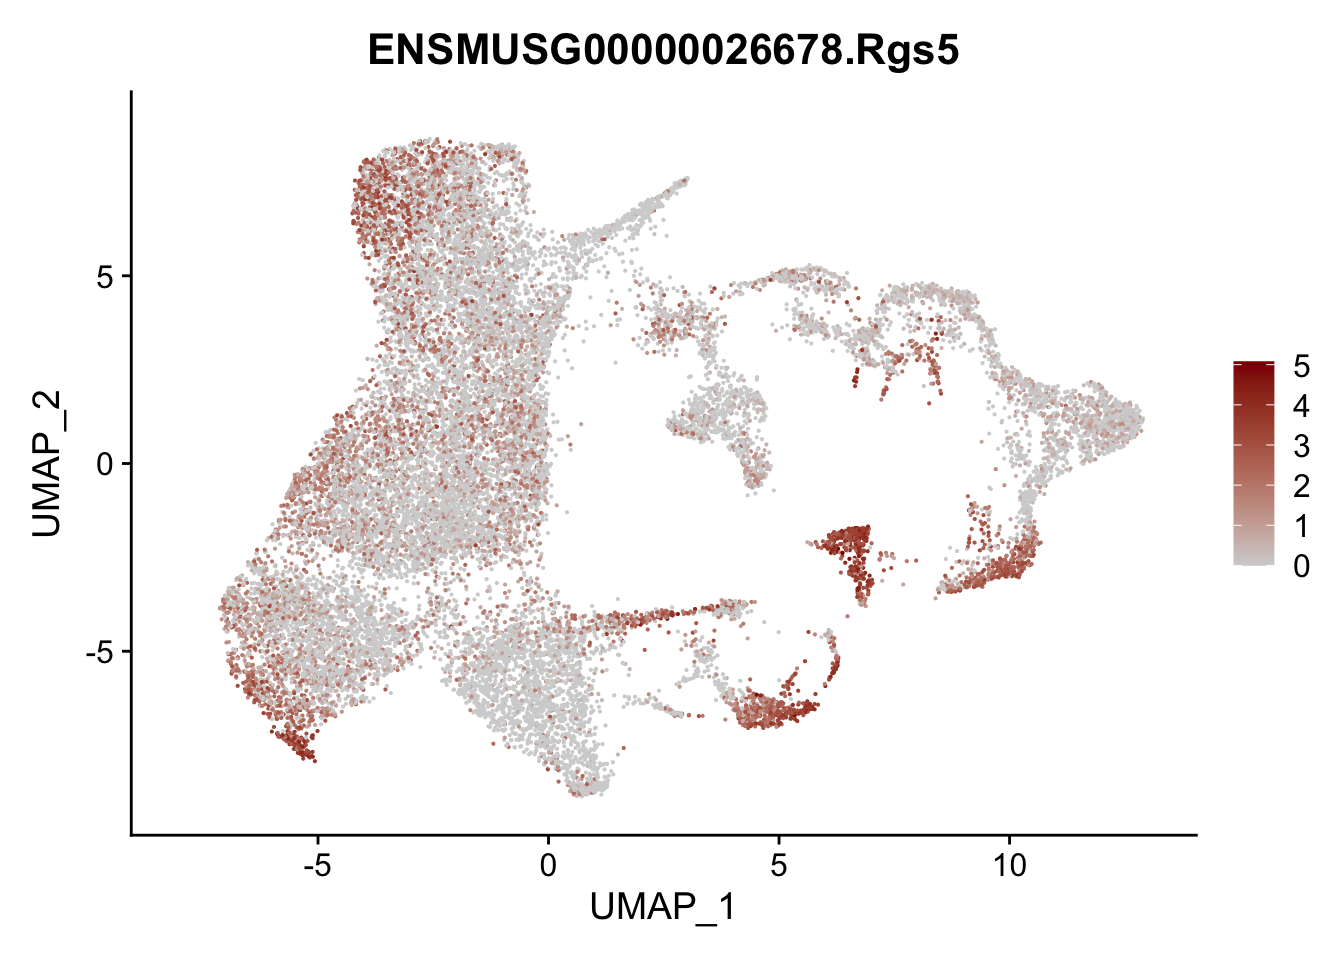
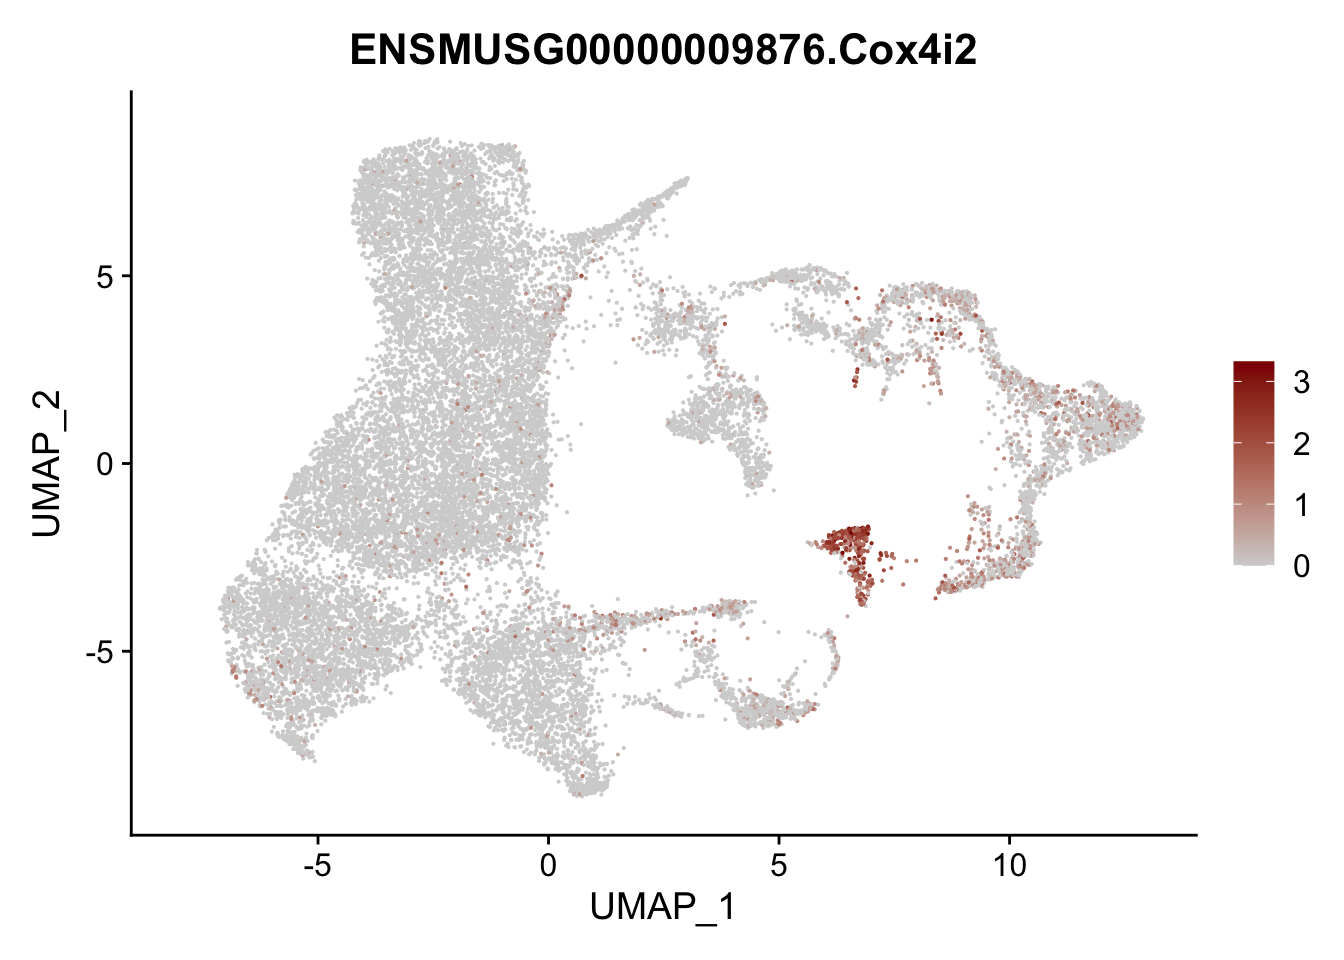
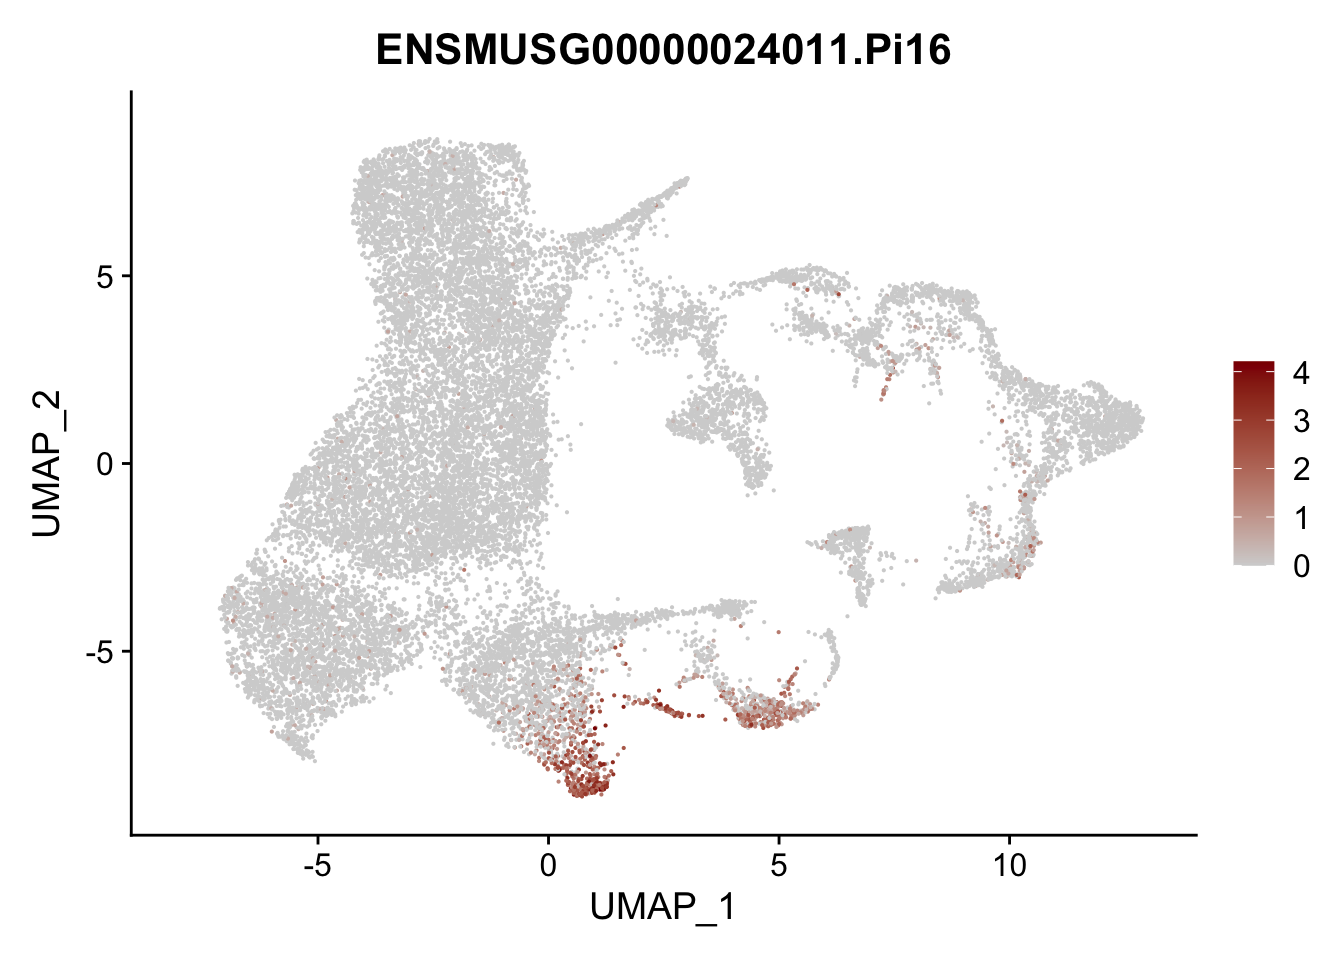
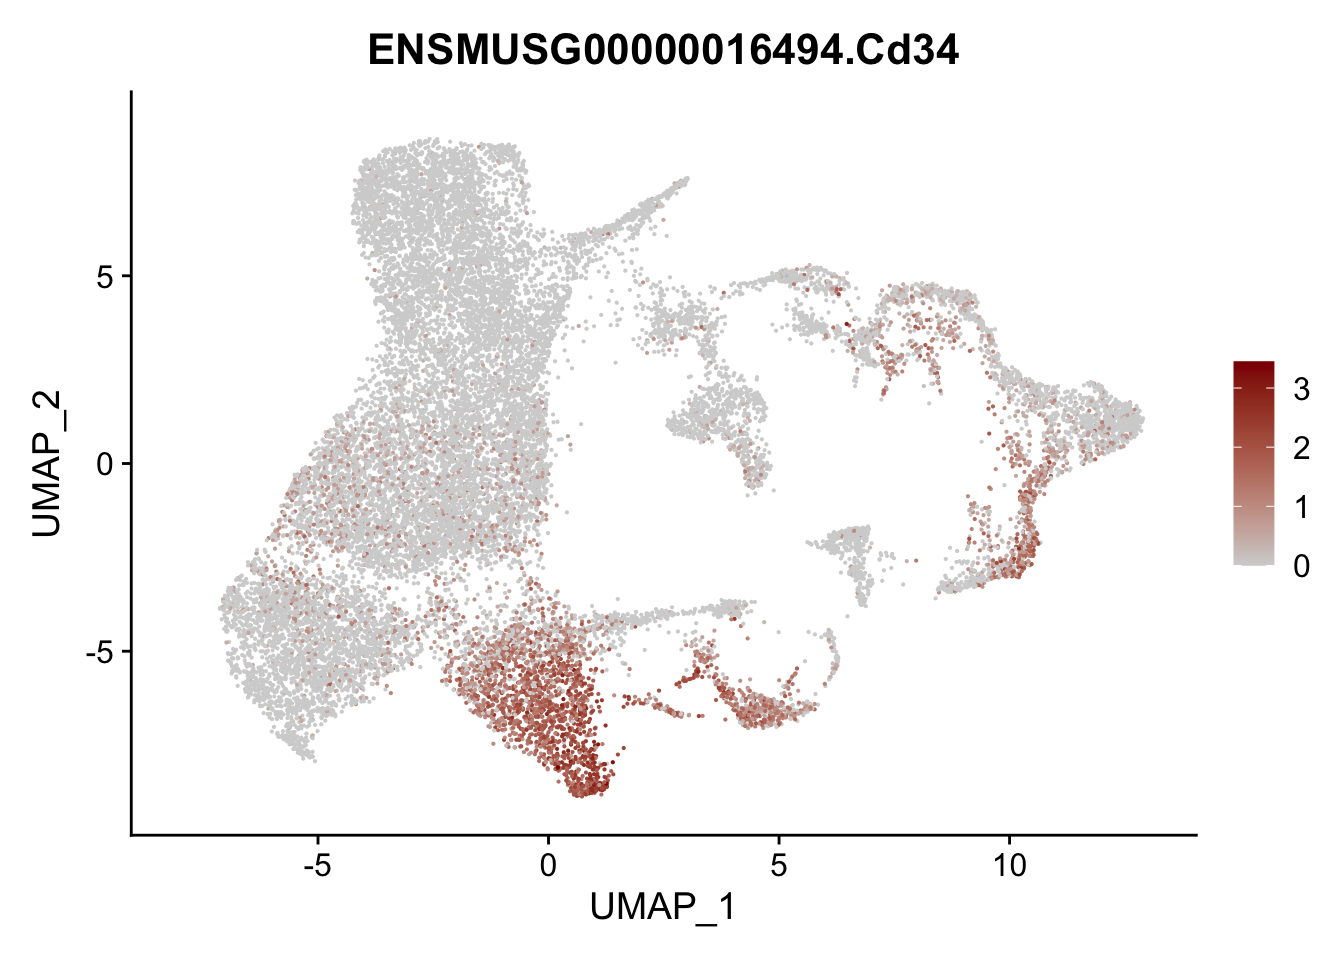
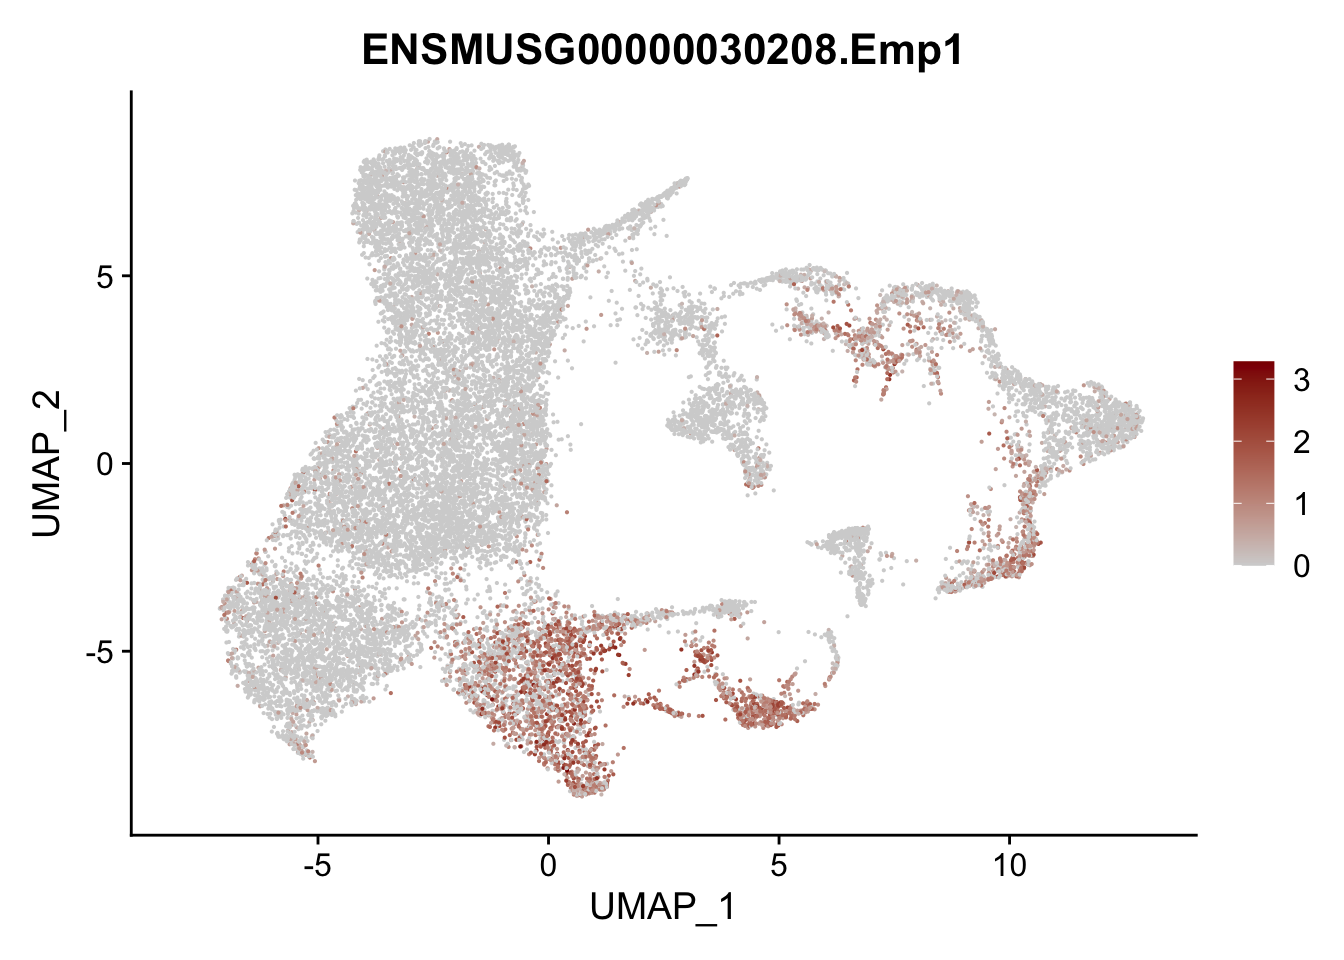
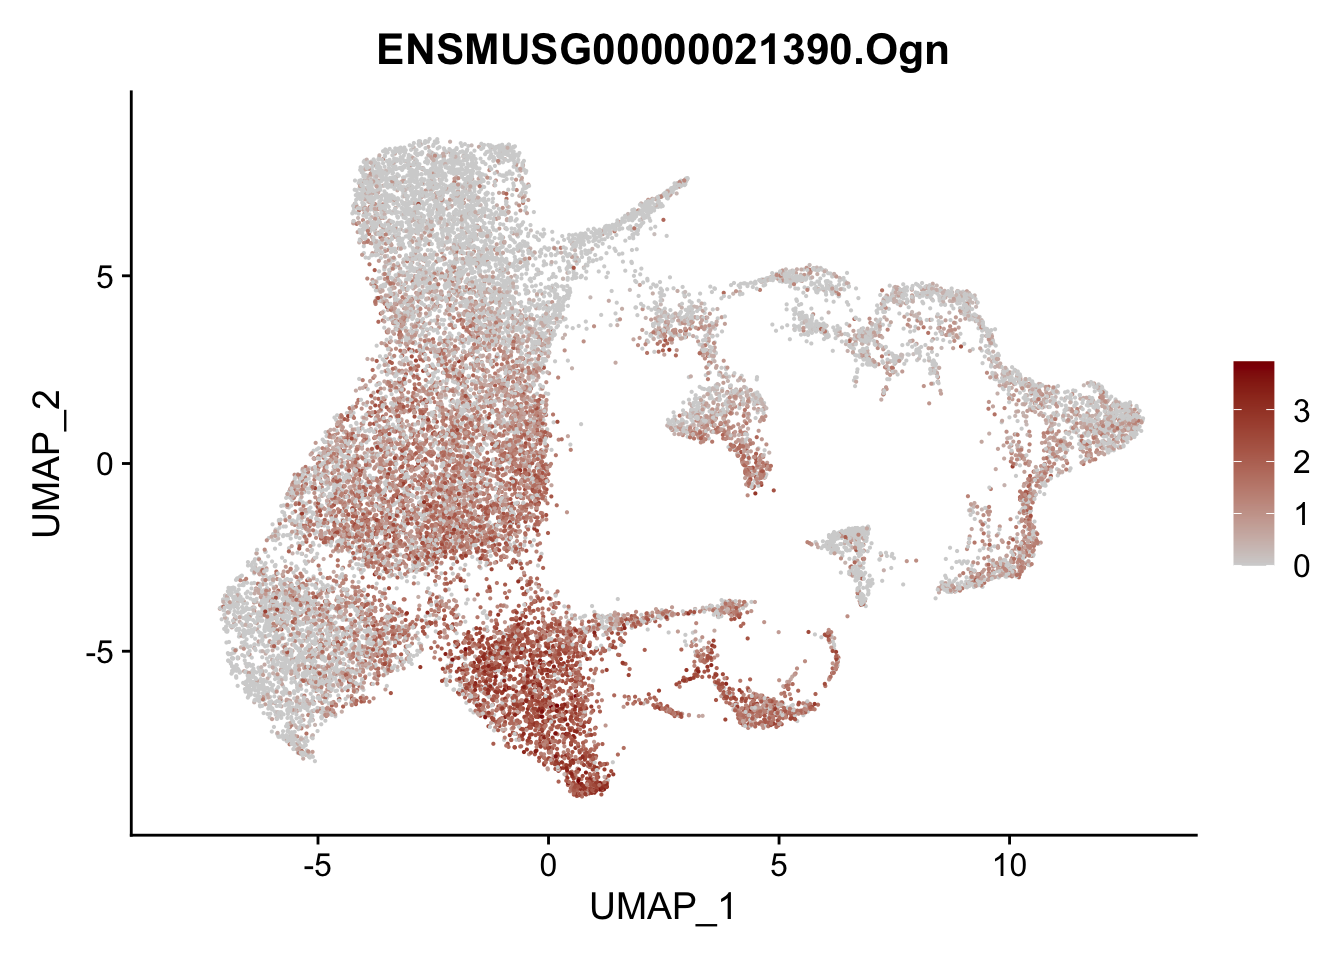
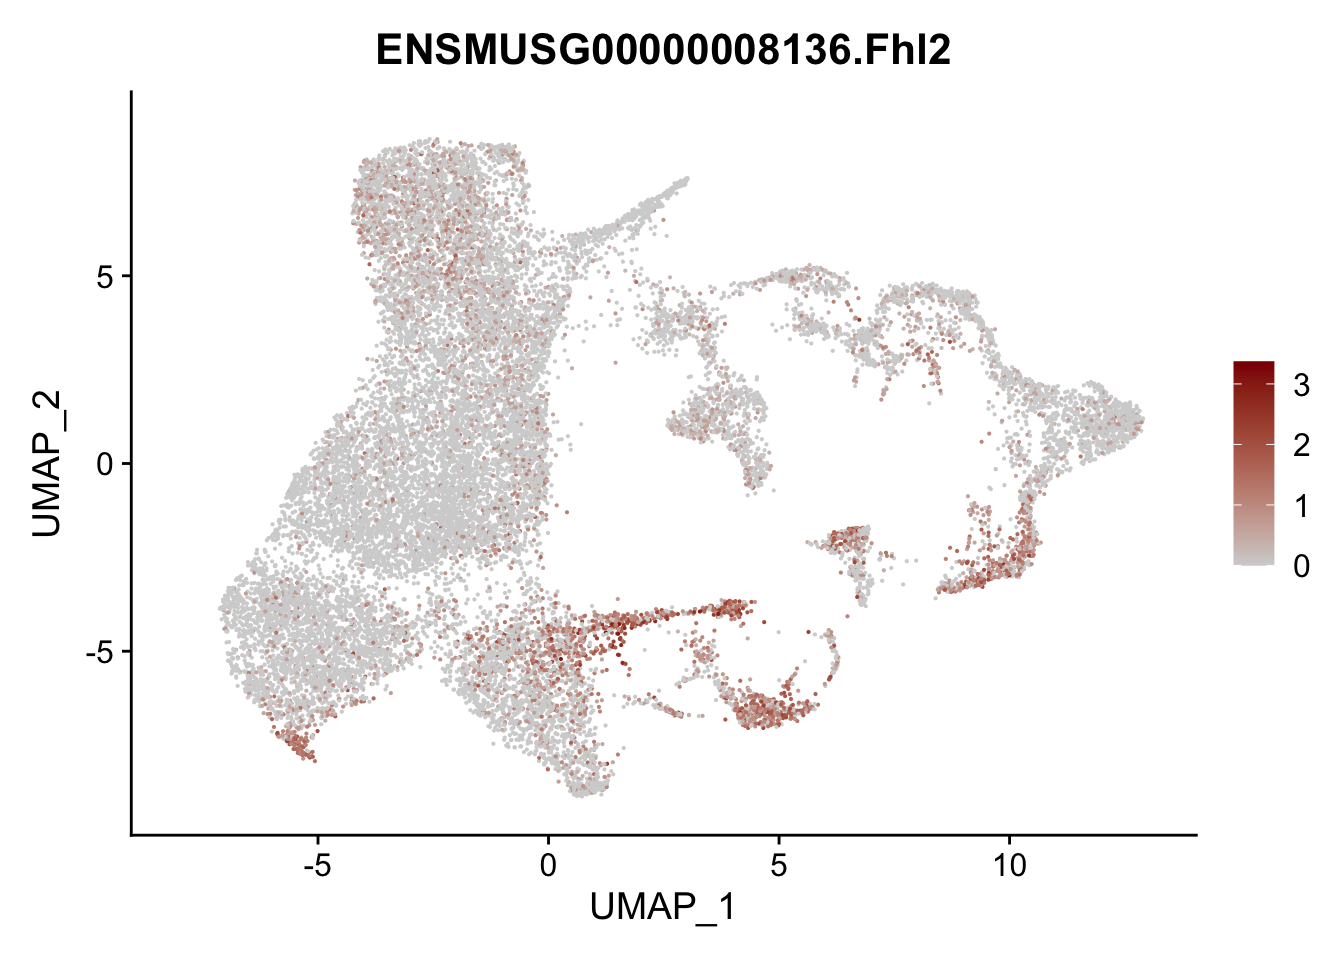
vis sel FRC marker
genes <- data.frame(gene=rownames(seurat)) %>%
    mutate(geneID=gsub("^.*\\.", "", gene))

selGenesAll <- data.frame(geneID=c("Rosa26eyfp", "Ccl19", "Ccl21a", "Cxcl13",
                                   "Fbln1", "Col15a1", "Cnn1", "Acta2", "Rgs5",
                                   "Cox4i2", "Pi16", "Cd34", "Emp1", "Ogn",
                                   "Fhl2")) %>%
  left_join(., genes, by = "geneID")

pList <- sapply(selGenesAll$gene, function(x){
p <- FeaturePlot(seurat, reduction = "umap",
            features = x,
            cols=c("lightgrey", "darkred"),
            order = F)+
  theme(legend.position="right")
  plot(p)
})
project signature
signDat <- read_delim(file = paste0(basedir,
                    "/data/signGenes.txt"),
                    delim = "\t")
genes <- data.frame(geneID=rownames(seurat)) %>%
  mutate(gene=gsub("^.*\\.", "", geneID))
signDat <- signDat %>% left_join(.,genes, by="gene")
allSign <- unique(signDat$grp)

sce <- as.SingleCellExperiment(seurat)

cutOff <- 4
pal = viridis::viridis(100)
sc <- scale_colour_gradientn(colours = pal, limits=c(0, cutOff))

lapply(unique(signDat$grp), function(sign){
  signGenes <- signDat %>% dplyr::filter(grp == sign)
  sceSub <- sce[which(rownames(sce) %in% signGenes$geneID),]
  cntMat <- rowSums(t(as.matrix(sceSub@assays@data$logcounts)))/nrow(signGenes)
  sceSub$sign <- cntMat
  sceSub$sign[which(sceSub$sign > cutOff)] <- cutOff
  sceSub$sign[which(sceSub$sign < 0)] <- 0
  p <- visGroup_adapt(sceSub, 'sign', dim_red = 'UMAP') +
    sc +
    guides(colour = guide_colourbar(title = '')) +
    ggtitle(paste0(signGenes$gene, collapse=", ")) +
    theme_classic() +
    theme(axis.text = element_blank(),
          axis.ticks = element_blank()) +
    labs(x='Dimension 1', y='Dimension 2')
  p
})
[[1]]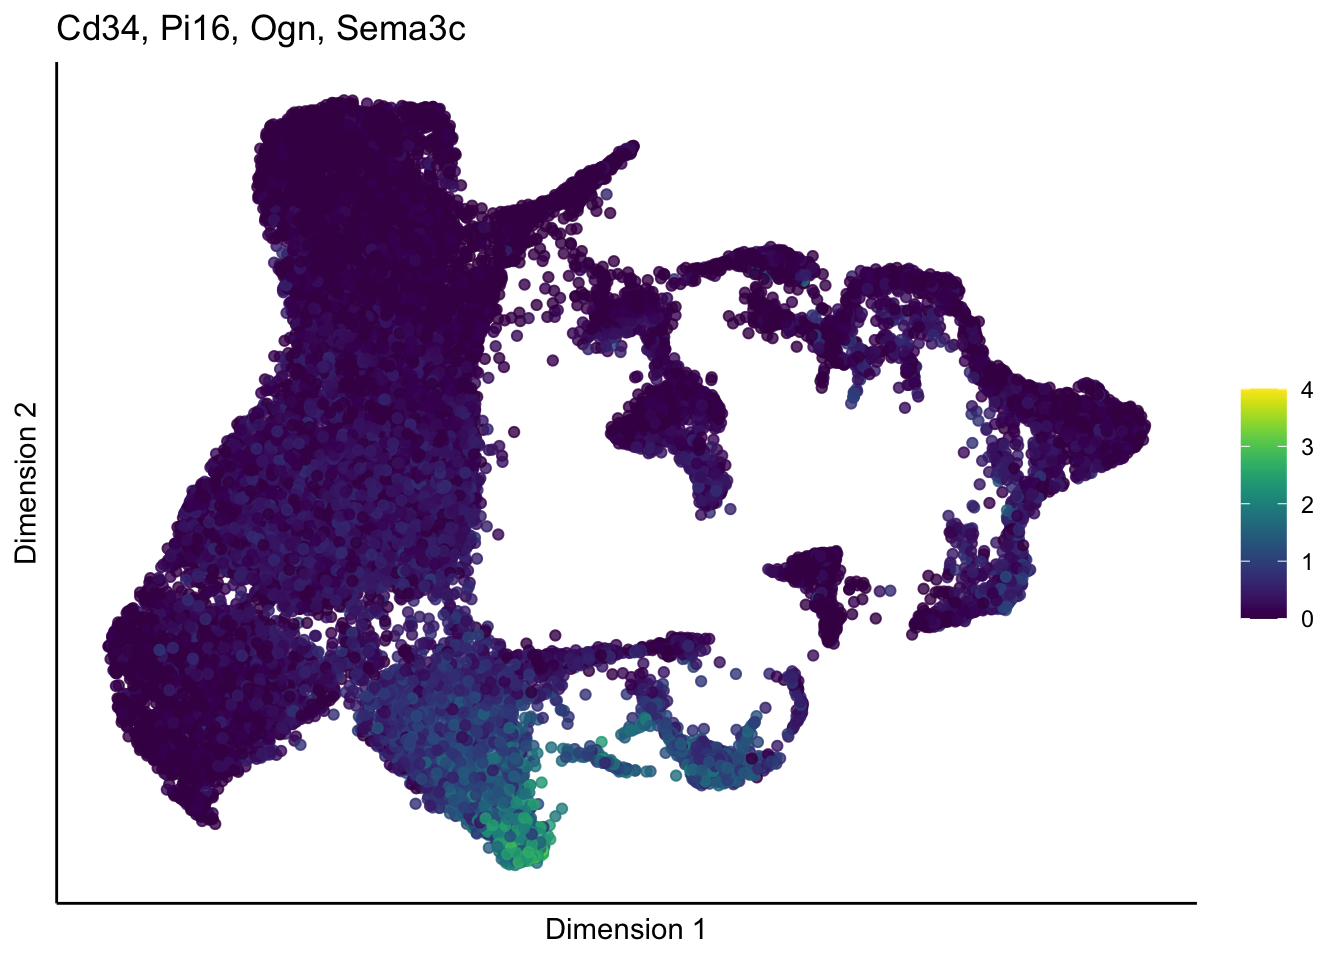
[[2]]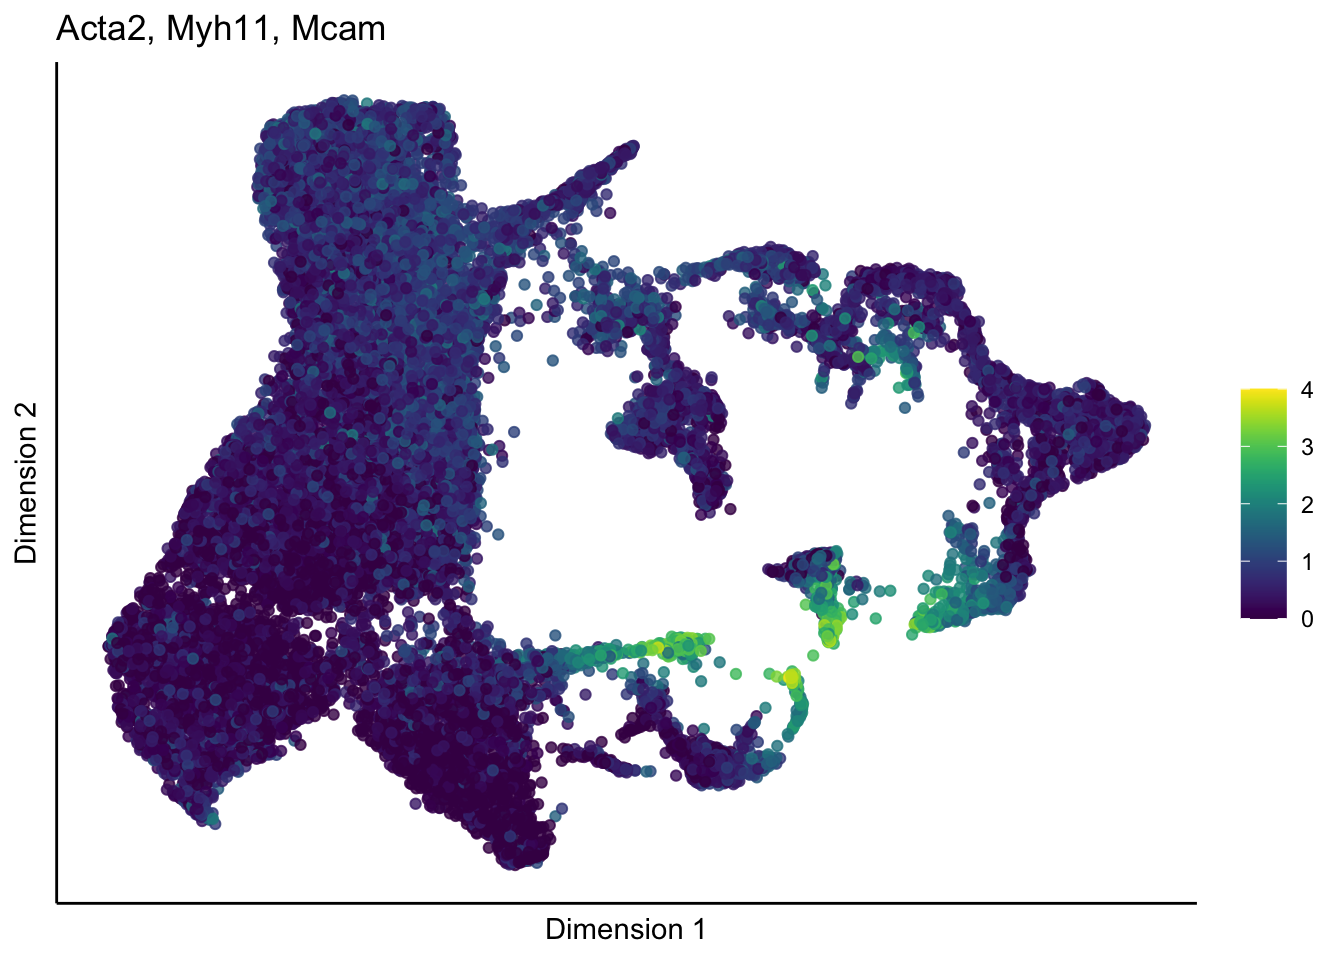
[[3]]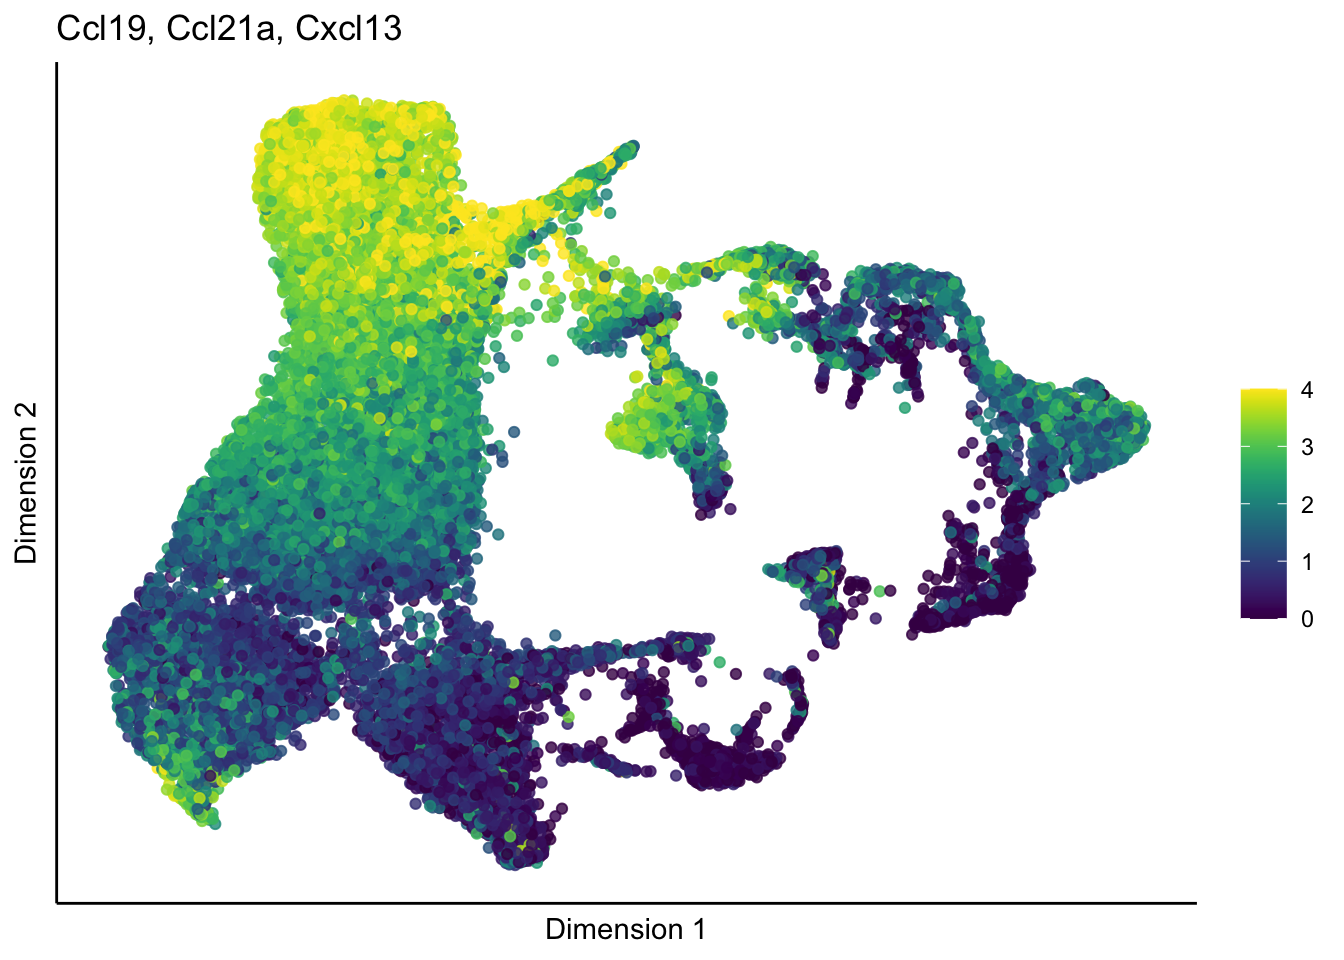
cutOff <- 2
pal = viridis::viridis(100)
sc <- scale_colour_gradientn(colours = pal, limits=c(0, cutOff))

lapply(unique(signDat$grp), function(sign){
  signGenes <- signDat %>% dplyr::filter(grp == sign)
  sceSub <- sce[which(rownames(sce) %in% signGenes$geneID),]
  cntMat <- rowSums(t(as.matrix(sceSub@assays@data$logcounts)))/nrow(signGenes)
  sceSub$sign <- cntMat
  sceSub$sign[which(sceSub$sign > cutOff)] <- cutOff
  sceSub$sign[which(sceSub$sign < 0)] <- 0
  p <- visGroup_adapt(sceSub, 'sign', dim_red = 'UMAP') +
    sc +
    guides(colour = guide_colourbar(title = '')) +
    ggtitle(paste0(signGenes$gene, collapse=", ")) +
    theme_classic() +
    theme(axis.text = element_blank(),
          axis.ticks = element_blank()) +
    labs(x='Dimension 1', y='Dimension 2')
  p
})
[[1]]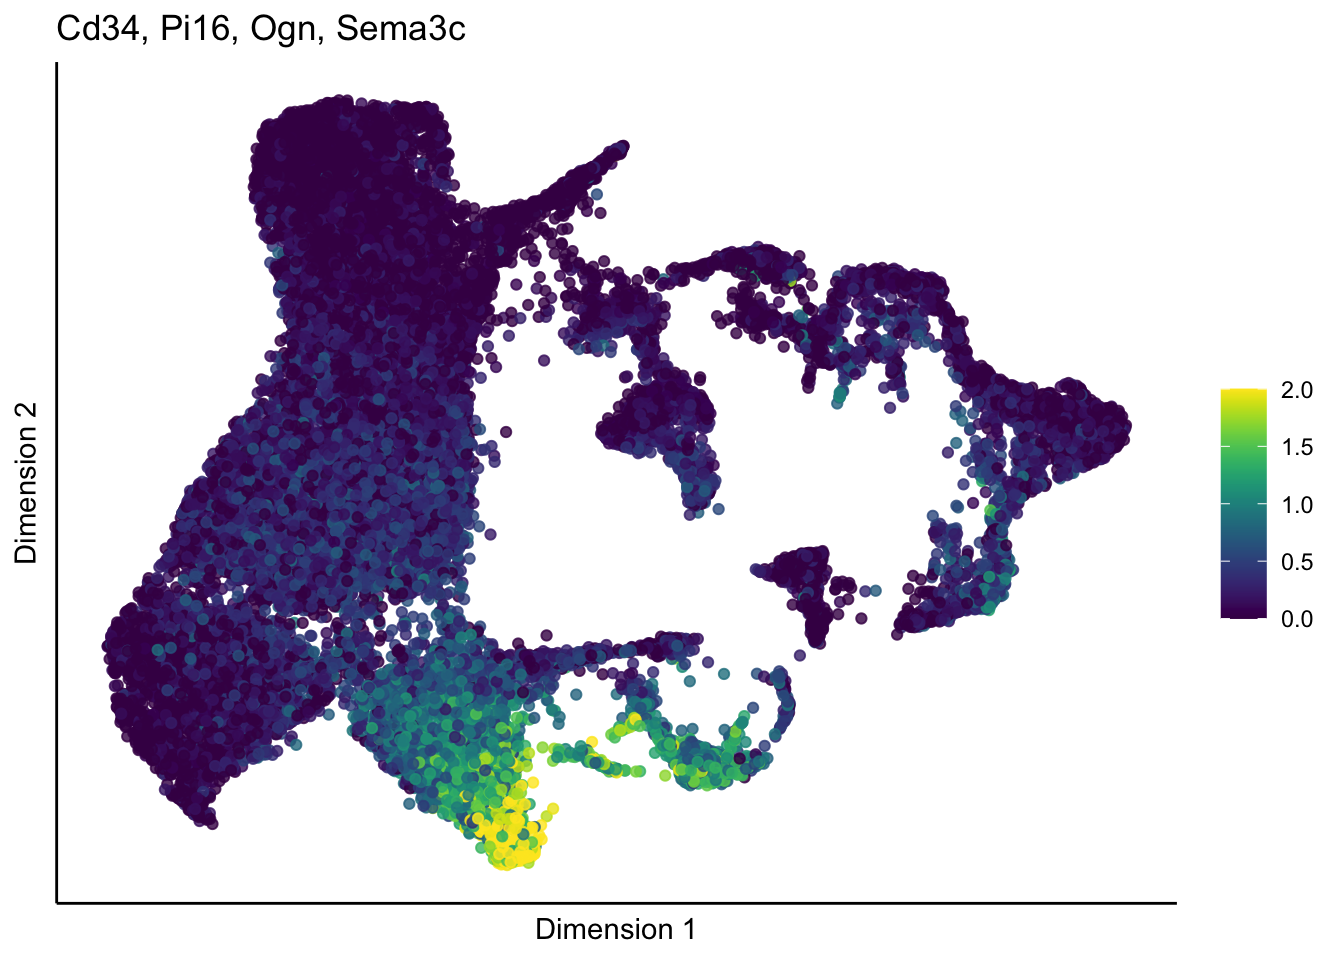
[[2]]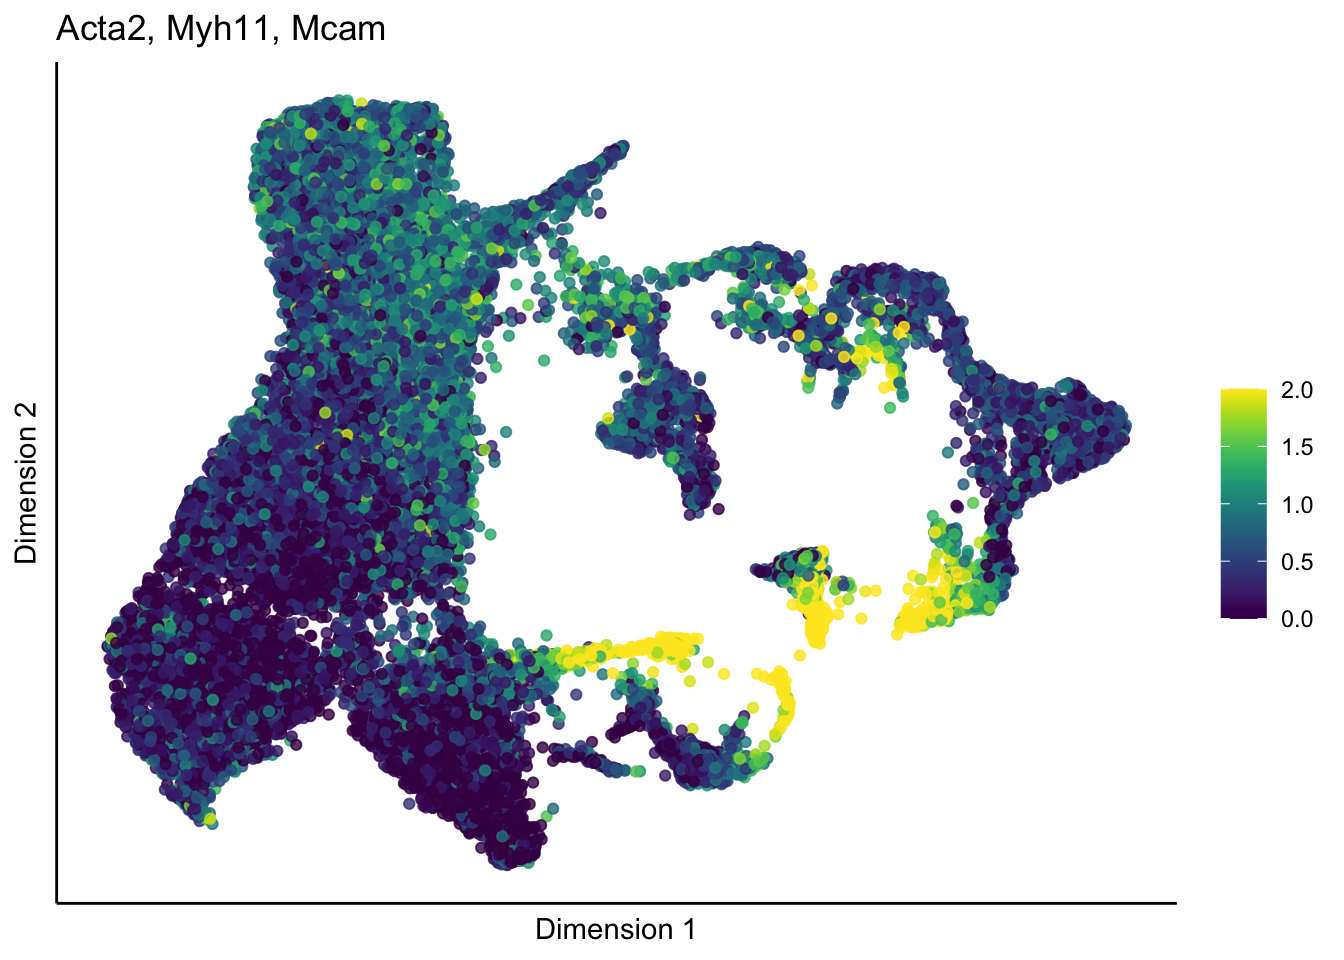
[[3]]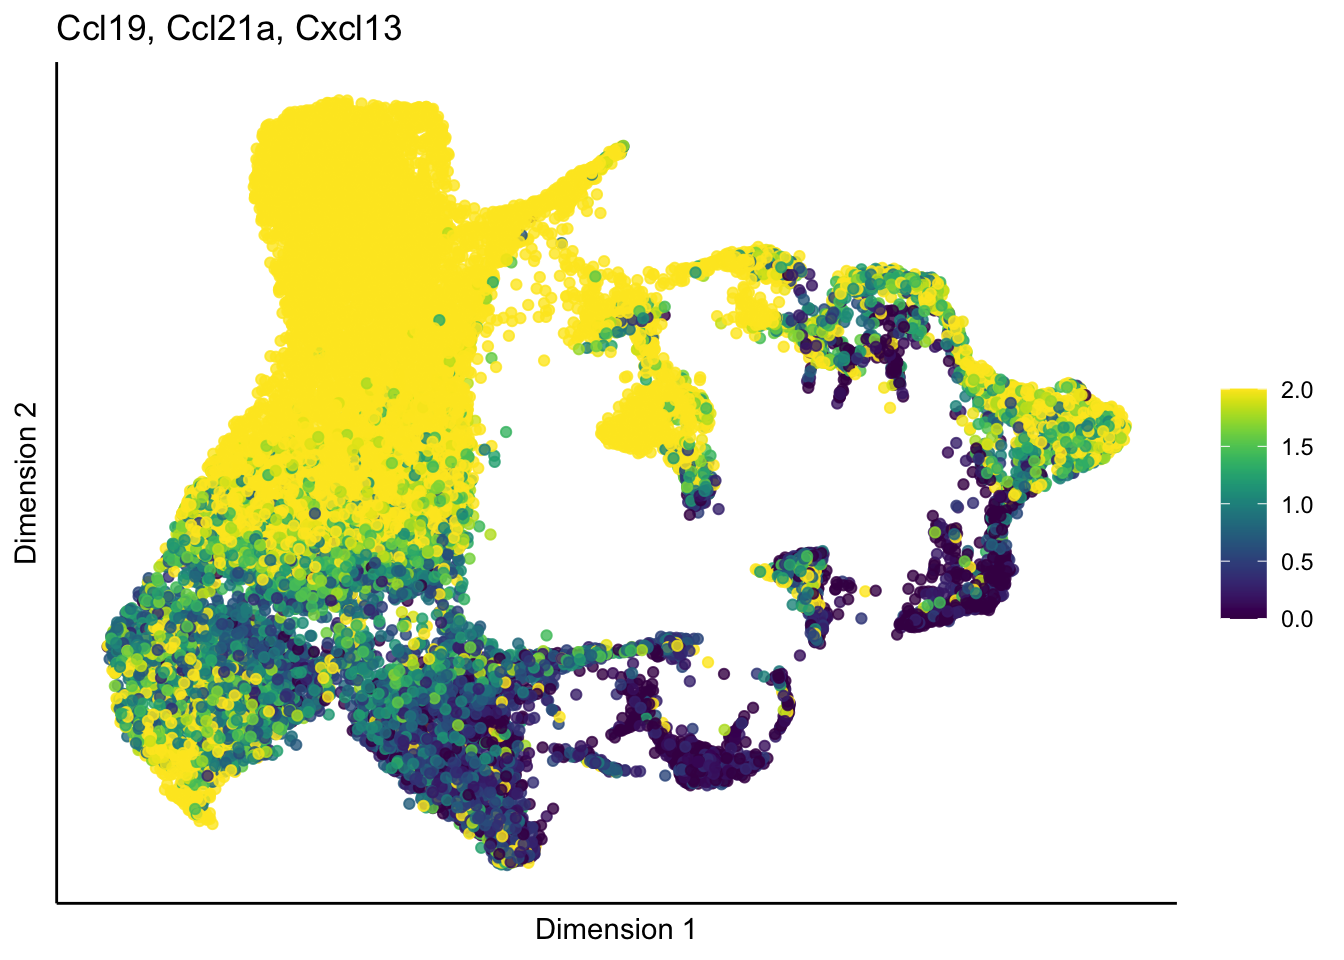
Slingshot
seuratSub <- subset(seurat, cond == "WT")
seuratSub <- FindNeighbors(object = seuratSub, reduction = "pca", dims = 1:20)
res <- c(0.8,0.6,0.25,0.4)
for (i in 1:length(res)) {
  seuratSub <- FindClusters(object = seuratSub, resolution = res[i],
                         random.seed = 1234)
  }
Modularity Optimizer version 1.3.0 by Ludo Waltman and Nees Jan van Eck
Number of nodes: 16877
Number of edges: 558988
Running Louvain algorithm...
Maximum modularity in 10 random starts: 0.8760
Number of communities: 18
Elapsed time: 1 seconds
Modularity Optimizer version 1.3.0 by Ludo Waltman and Nees Jan van Eck
Number of nodes: 16877
Number of edges: 558988
Running Louvain algorithm...
Maximum modularity in 10 random starts: 0.8919
Number of communities: 15
Elapsed time: 2 seconds
Modularity Optimizer version 1.3.0 by Ludo Waltman and Nees Jan van Eck
Number of nodes: 16877
Number of edges: 558988
Running Louvain algorithm...
Maximum modularity in 10 random starts: 0.9322
Number of communities: 11
Elapsed time: 1 seconds
Modularity Optimizer version 1.3.0 by Ludo Waltman and Nees Jan van Eck
Number of nodes: 16877
Number of edges: 558988
Running Louvain algorithm...
Maximum modularity in 10 random starts: 0.9098
Number of communities: 12
Elapsed time: 1 secondsseuratSub$time <- 1
seuratSub$time[which(seuratSub$age == "P7")] <- 2
seuratSub$time[which(seuratSub$age == "3w")] <- 3
seuratSub$time[which(seuratSub$age %in% c("8w", "E17to7wk"))] <- 4
seuratSub$age2 <- seurat$age
seuratSub$age2[which(seuratSub$age %in% c("8w", "E17to7wk"))] <- "8w"
DimPlot(seuratSub, reduction = "umap", group.by = "RNA_snn_res.0.4",
cols = colPal)+
theme_bw() +
theme(axis.text = element_blank(), axis.ticks = element_blank(),
panel.grid.minor = element_blank()) +
xlab("UMAP1") +
ylab("UMAP2")
sce <- as.SingleCellExperiment(seuratSub)
sce <- slingshot(sce, clusterLabels = 'RNA_snn_res.0.4', reducedDim = 'UMAP',
                 start.clus = "6", times = sce$time, end.clus = c("0", "2", "3", "9", "10"),
                 dist.method="simple", extend = 'n', stretch=0)

clustDat <- data.frame(clustCol=colPal) %>% rownames_to_column(., "cluster")
ageDat <- data.frame(ageCol=colAge) %>% rownames_to_column(., "age")
colDat <- data.frame(cluster=sce$RNA_snn_res.0.4) %>%
  mutate(age=sce$age2) %>% left_join(., clustDat, by="cluster") %>%
  left_join(., ageDat, by="age")

plot(reducedDims(sce)$UMAP, col = colDat$clustCol, pch=16, asp = 1)
lines(SlingshotDataSet(sce), lwd=2, type = 'lineages', col = 'black')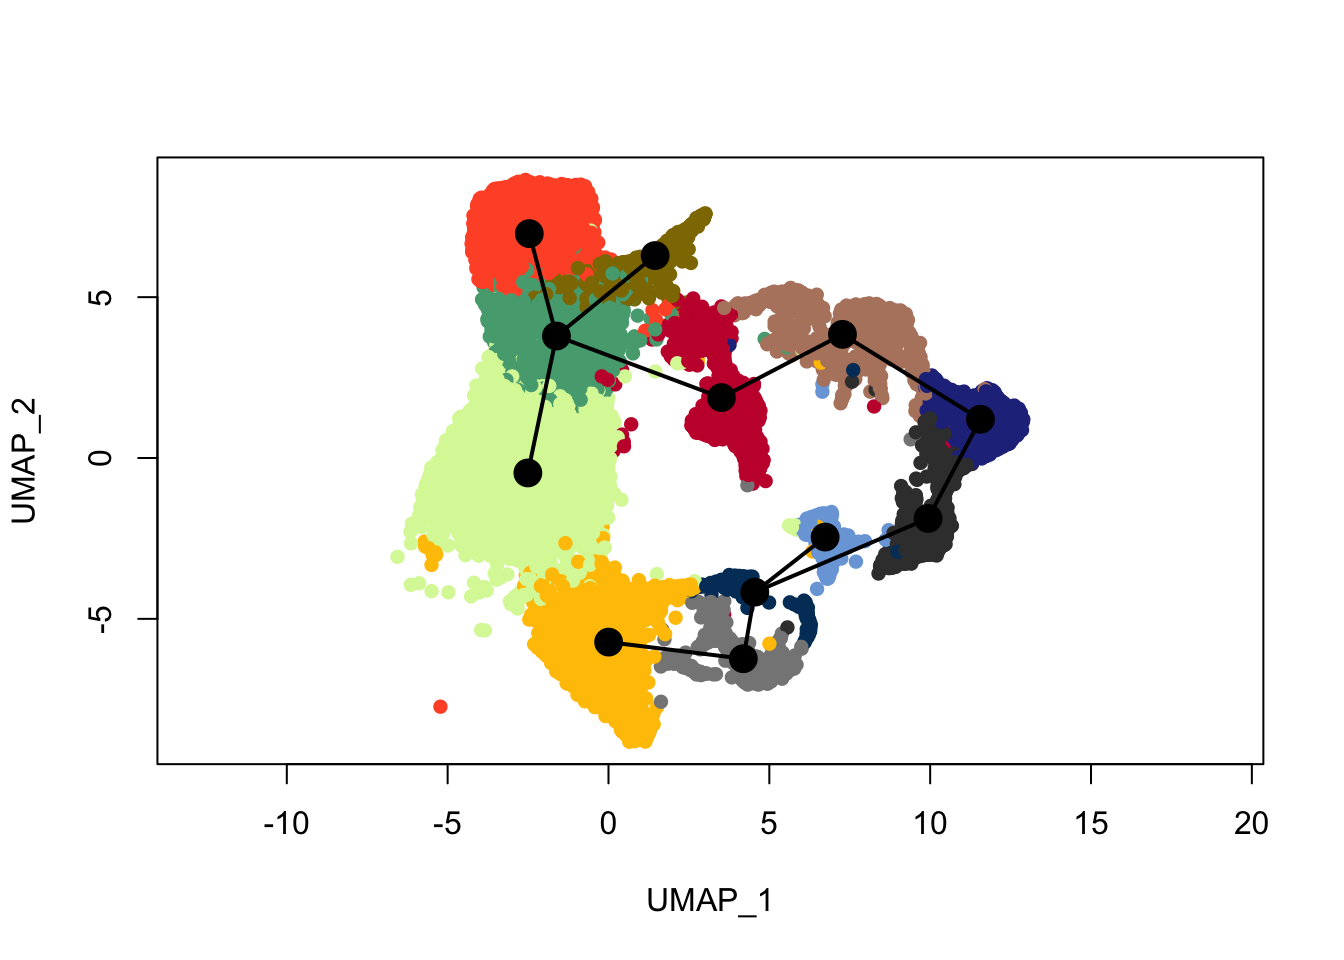
plot(reducedDims(sce)$UMAP, col = colDat$ageCol, pch=16, asp = 1)
lines(SlingshotDataSet(sce), lwd=2, type = 'lineages', col = 'black')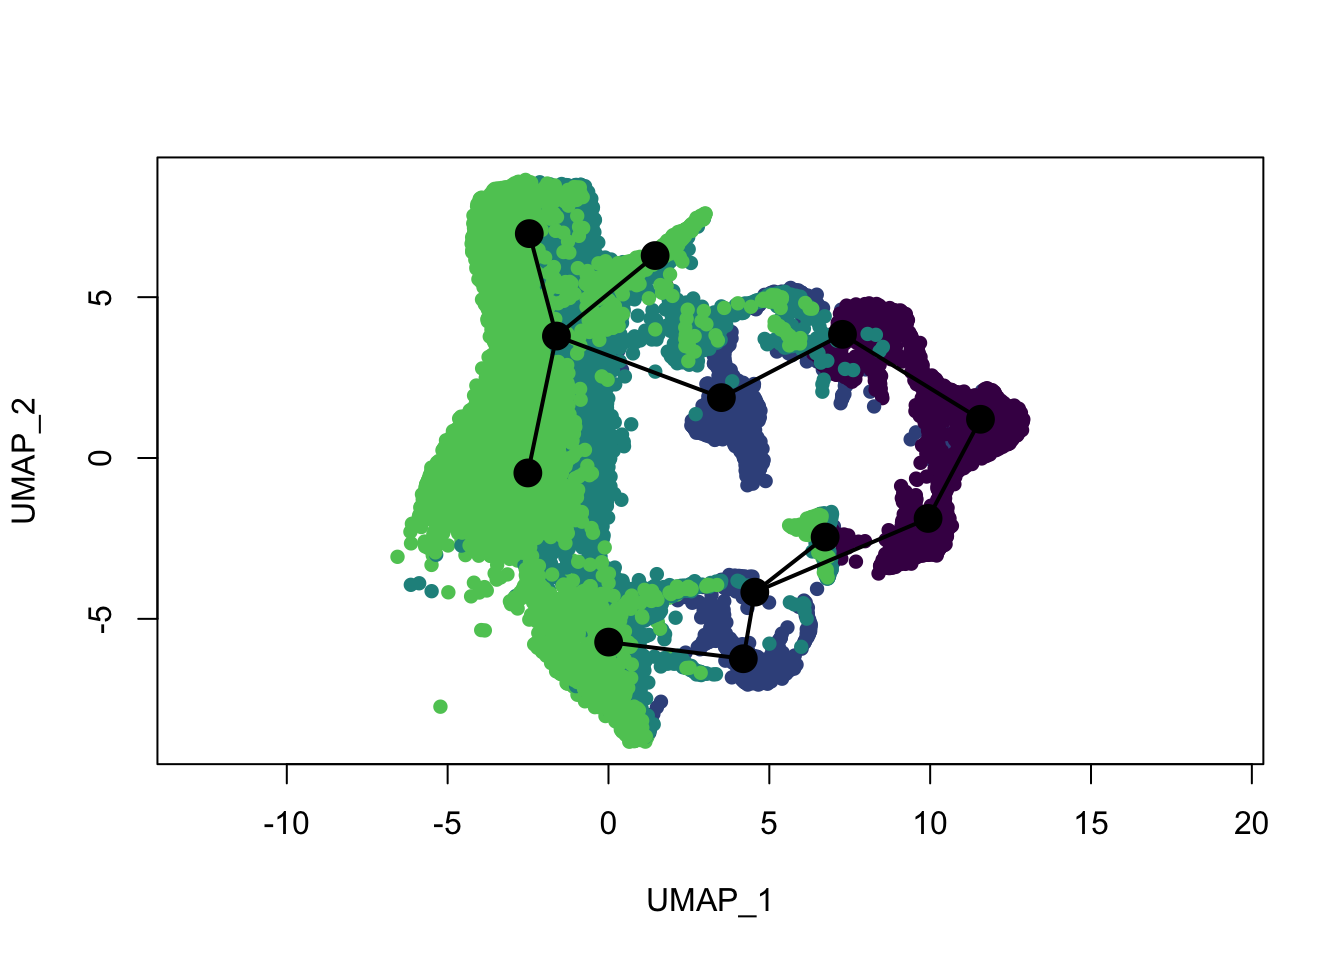
plot(reducedDims(sce)$UMAP, col = colDat$clustCol, pch=16, asp = 1)
lines(SlingshotDataSet(sce), lwd=2, col='black')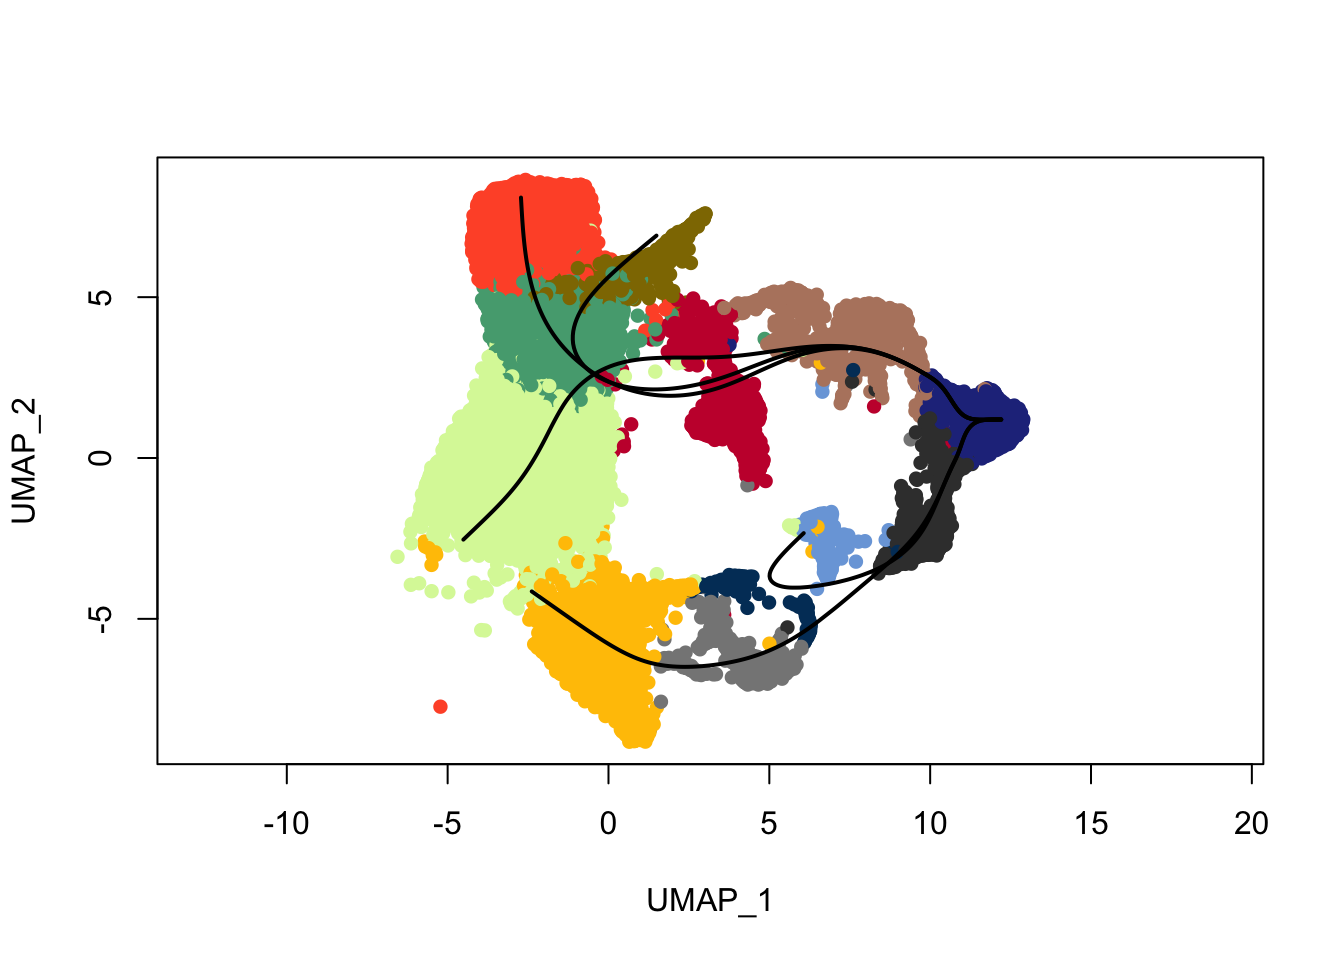
plot(reducedDims(sce)$UMAP, col = colDat$ageCol, pch=16, asp = 1)
lines(SlingshotDataSet(sce), lwd=2, col='black')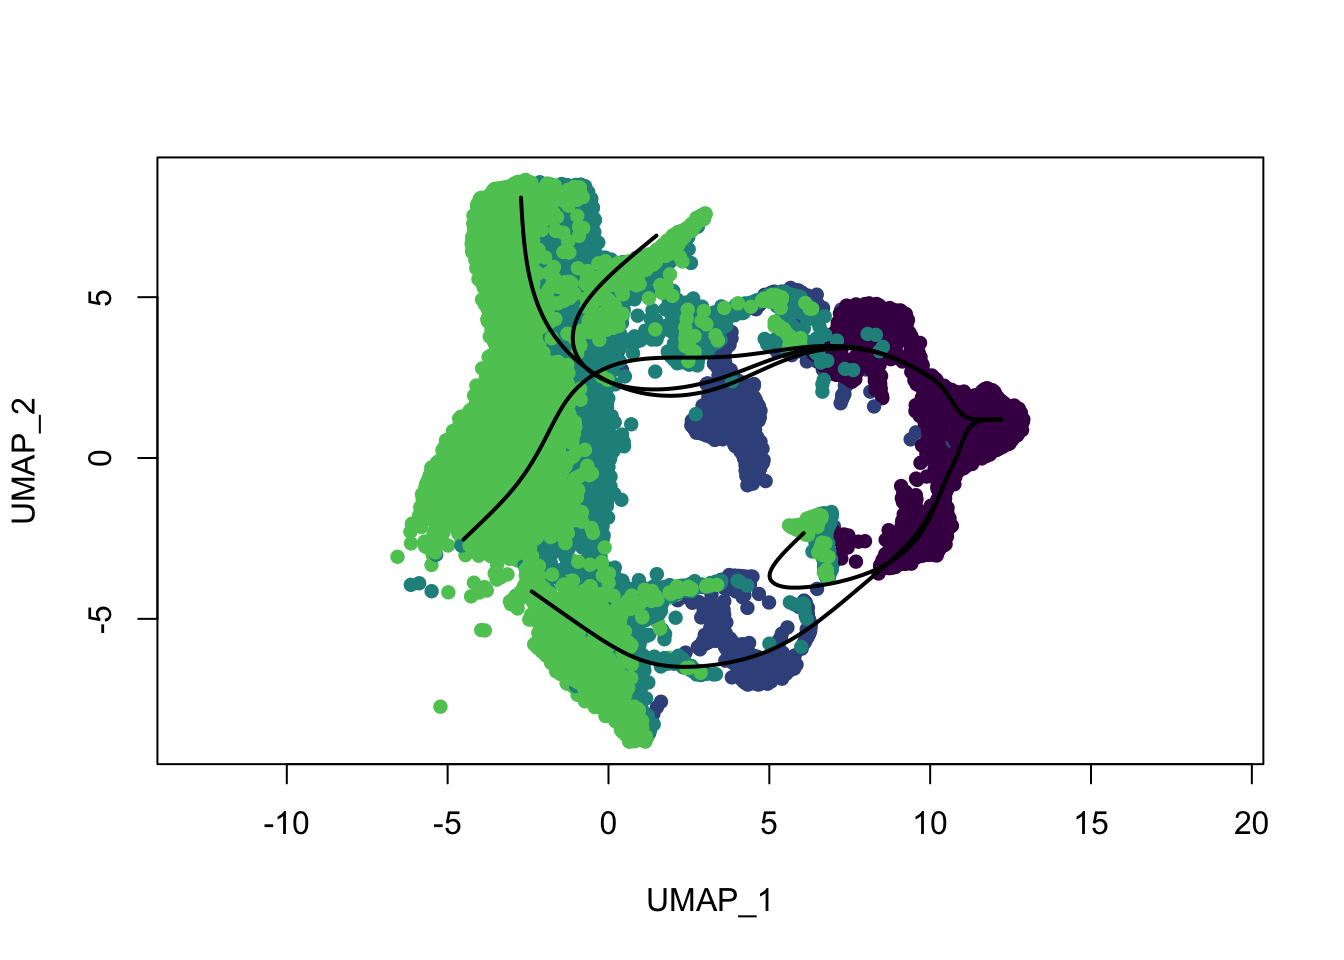
save slingshot data
saveRDS(sce, file=paste0(basedir, "/data/slingshot/WT_allTime_mLNonly",
                         "_EYFPonly_labelTrans_slingshot_sce.rds"))
session info
sessionInfo()R version 4.3.0 (2023-04-21)
Platform: x86_64-apple-darwin20 (64-bit)
Running under: macOS Ventura 13.4.1
Matrix products: default
BLAS: /Library/Frameworks/R.framework/Versions/4.3-x86_64/Resources/lib/libRblas.0.dylib
LAPACK: /Library/Frameworks/R.framework/Versions/4.3-x86_64/Resources/lib/libRlapack.dylib; LAPACK version 3.11.0
locale:
[1] en_US.UTF-8/en_US.UTF-8/en_US.UTF-8/C/en_US.UTF-8/en_US.UTF-8
time zone: Europe/Berlin
tzcode source: internal
attached base packages:
[1] stats4 stats graphics grDevices utils datasets methods
[8] base
other attached packages:
[1] Matrix_1.6-5 monocle3_1.3.1
[3] slingshot_2.8.0 TrajectoryUtils_1.8.0
[5] princurve_2.1.6 tradeSeq_1.14.0
[7] viridis_0.6.5 viridisLite_0.4.2
[9] ggsci_3.0.1 scran_1.28.2
[11] scater_1.28.0 scuttle_1.10.3
[13] pheatmap_1.0.12 RColorBrewer_1.1-3
[15] SingleCellExperiment_1.22.0 SummarizedExperiment_1.30.2
[17] Biobase_2.60.0 GenomicRanges_1.52.1
[19] GenomeInfoDb_1.36.4 IRanges_2.36.0
[21] S4Vectors_0.40.1 BiocGenerics_0.48.0
[23] MatrixGenerics_1.12.3 matrixStats_1.2.0
[25] runSeurat3_0.1.0 here_1.0.1
[27] magrittr_2.0.3 Seurat_5.0.2
[29] SeuratObject_5.0.1 sp_2.1-3
[31] lubridate_1.9.3 forcats_1.0.0
[33] stringr_1.5.1 dplyr_1.1.4
[35] purrr_1.0.2 readr_2.1.5
[37] tidyr_1.3.1 tibble_3.2.1
[39] ggplot2_3.5.0 tidyverse_2.0.0
loaded via a namespace (and not attached):
[1] RcppAnnoy_0.0.22 splines_4.3.0
[3] later_1.3.2 bitops_1.0-7
[5] polyclip_1.10-6 fastDummies_1.7.3
[7] lifecycle_1.0.4 edgeR_3.42.4
[9] rprojroot_2.0.4 vroom_1.6.5
[11] globals_0.16.2 lattice_0.22-5
[13] MASS_7.3-60.0.1 limma_3.56.2
[15] plotly_4.10.4 rmarkdown_2.26
[17] yaml_2.3.8 metapod_1.8.0
[19] httpuv_1.6.14 sctransform_0.4.1
[21] spam_2.10-0 spatstat.sparse_3.0-3
[23] reticulate_1.35.0 minqa_1.2.6
[25] cowplot_1.1.3 pbapply_1.7-2
[27] abind_1.4-5 zlibbioc_1.46.0
[29] Rtsne_0.17 RCurl_1.98-1.14
[31] GenomeInfoDbData_1.2.10 ggrepel_0.9.5
[33] irlba_2.3.5.1 listenv_0.9.1
[35] spatstat.utils_3.0-4 terra_1.7-71
[37] goftest_1.2-3 RSpectra_0.16-1
[39] dqrng_0.3.2 spatstat.random_3.2-3
[41] fitdistrplus_1.1-11 parallelly_1.37.1
[43] DelayedMatrixStats_1.22.6 leiden_0.4.3.1
[45] codetools_0.2-19 DelayedArray_0.26.7
[47] tidyselect_1.2.0 farver_2.1.1
[49] lme4_1.1-35.1 ScaledMatrix_1.8.1
[51] spatstat.explore_3.2-6 jsonlite_1.8.8
[53] BiocNeighbors_1.18.0 ellipsis_0.3.2
[55] progressr_0.14.0 ggridges_0.5.6
[57] survival_3.5-8 tools_4.3.0
[59] ica_1.0-3 Rcpp_1.0.12
[61] glue_1.7.0 gridExtra_2.3
[63] mgcv_1.9-1 xfun_0.42
[65] withr_3.0.0 fastmap_1.1.1
[67] boot_1.3-30 bluster_1.10.0
[69] fansi_1.0.6 digest_0.6.34
[71] rsvd_1.0.5 timechange_0.3.0
[73] R6_2.5.1 mime_0.12
[75] colorspace_2.1-0 scattermore_1.2
[77] tensor_1.5 spatstat.data_3.0-4
[79] utf8_1.2.4 generics_0.1.3
[81] data.table_1.15.2 httr_1.4.7
[83] htmlwidgets_1.6.4 S4Arrays_1.0.6
[85] uwot_0.1.16 pkgconfig_2.0.3
[87] gtable_0.3.4 lmtest_0.9-40
[89] XVector_0.40.0 htmltools_0.5.7
[91] dotCall64_1.1-1 scales_1.3.0
[93] png_0.1-8 knitr_1.45
[95] rstudioapi_0.15.0 tzdb_0.4.0
[97] reshape2_1.4.4 nloptr_2.0.3
[99] nlme_3.1-164 zoo_1.8-12
[101] KernSmooth_2.23-22 vipor_0.4.7
[103] parallel_4.3.0 miniUI_0.1.1.1
[105] pillar_1.9.0 grid_4.3.0
[107] vctrs_0.6.5 RANN_2.6.1
[109] promises_1.2.1 BiocSingular_1.16.0
[111] beachmat_2.16.0 xtable_1.8-4
[113] cluster_2.1.6 beeswarm_0.4.0
[115] evaluate_0.23 locfit_1.5-9.9
[117] cli_3.6.2 compiler_4.3.0
[119] rlang_1.1.3 crayon_1.5.2
[121] future.apply_1.11.1 labeling_0.4.3
[123] plyr_1.8.9 ggbeeswarm_0.7.2
[125] stringi_1.8.3 deldir_2.0-4
[127] BiocParallel_1.34.2 munsell_0.5.0
[129] lazyeval_0.2.2 spatstat.geom_3.2-9
[131] RcppHNSW_0.6.0 hms_1.1.3
[133] patchwork_1.2.0 bit64_4.0.5
[135] sparseMatrixStats_1.12.2 future_1.33.1
[137] statmod_1.5.0 shiny_1.8.0
[139] ROCR_1.0-11 igraph_2.0.2
[141] bit_4.0.5 date()[1] "Wed Apr 24 09:03:38 2024"