suppressPackageStartupMessages({
  library(tidyverse)
  library(ggplot2)
  library(here)
  library(SingleCellExperiment)
  library(RColorBrewer)
  library(pheatmap)
  library(scater)
  library(scran)
  library(ggsci)
  library(viridis)
  library(tradeSeq)
  library(slingshot)
  library(clusterExperiment)
  library(decoupleR)
  library(OmnipathR)
  library(ensembldb)
  library(org.Mm.eg.db)
  library(biomaRt)
  library(clusterProfiler)
  library(DOSE)
  library(enrichplot)
  library(ReactomePA)
})summarize and vis tradeSeq output - mLN all timepoints
load packages
set dir and load sample
basedir <- here()

## sce object after slingshot
sce <- readRDS(paste0(basedir, "/data/slingshot/WT_allTime_mLNonly",
                         "_EYFPonly_labelTrans_slingshot_sce.rds"))

## tradeSeq fitGAM out
sceGAM <- readRDS(paste0(basedir, "/data/slingshot/tradeSEQ/WT_allTime_mLNonly",
                         "_EYFPonly_labelTrans_slingshot_TSsub5000_sceGAM.rds"))
table(rowData(sceGAM)$tradeSeq$converged)
TRUE
2000
## genes with diff expression pattern
clustList <- readRDS(paste0(basedir, "/data/slingshot/tradeSEQ/diffLinGeneCluster.rds"))
colCond <- c("#446a7f", "#cb7457")
names(colCond) <- c("LTbR", "WT")
colAge <- c("#440154FF", "#3B528BFF", "#21908CFF", "#5DC863FF", "#FDE725FF")
names(colAge) <- c("E18" , "P7", "3w", "8w","E17to7wk")
colPal <- c("#DAF7A6", "#FFC300", "#FF5733", "#C70039", "#900C3F", "#b66e8d",
"#61a4ba", "#6178ba", "#54a87f", "#25328a",
"#b6856e", "#0073C2FF", "#EFC000FF", "#868686FF", "#CD534CFF",
"#7AA6DCFF", "#003C67FF", "#8F7700FF", "#3B3B3BFF", "#A73030FF",
"#4A6990FF")[1:length(unique(sce$RNA_snn_res.0.4))]
names(colPal) <- unique(sce$RNA_snn_res.0.4)
colLab <- c("#42a071", "#900C3F","#b66e8d", "#61a4ba", "#424671", "#003C67FF",
"#e3953d", "#714542", "#b6856e", "#a4a4a4")
names(colLab) <- c("FDC/MRC", "TRC", "TBRC", "MedRC/IFRC", "MedRC" , "actMedRC",
"PRC", "Pi16+RC", "VSMC", "unassigned")
### color lineages
colLin <- c("#e3953d", "#424671","#900C3F", "#42a071", "#b6856e")
names(colLin) <- c("1", "2", "3", "4", "5")vis Slingshot
clustDat <- data.frame(clustCol=colPal) %>% rownames_to_column(., "cluster")
ageDat <- data.frame(ageCol=colAge) %>% rownames_to_column(., "age")
colDat <- data.frame(cluster=sce$RNA_snn_res.0.4) %>%
  mutate(age=sce$age2) %>% left_join(., clustDat, by="cluster") %>%
  left_join(., ageDat, by="age")

plot(reducedDims(sce)$UMAP, col = colDat$clustCol, pch=16, asp = 1)
lines(SlingshotDataSet(sce), lwd=2, type = 'lineages', col = 'black')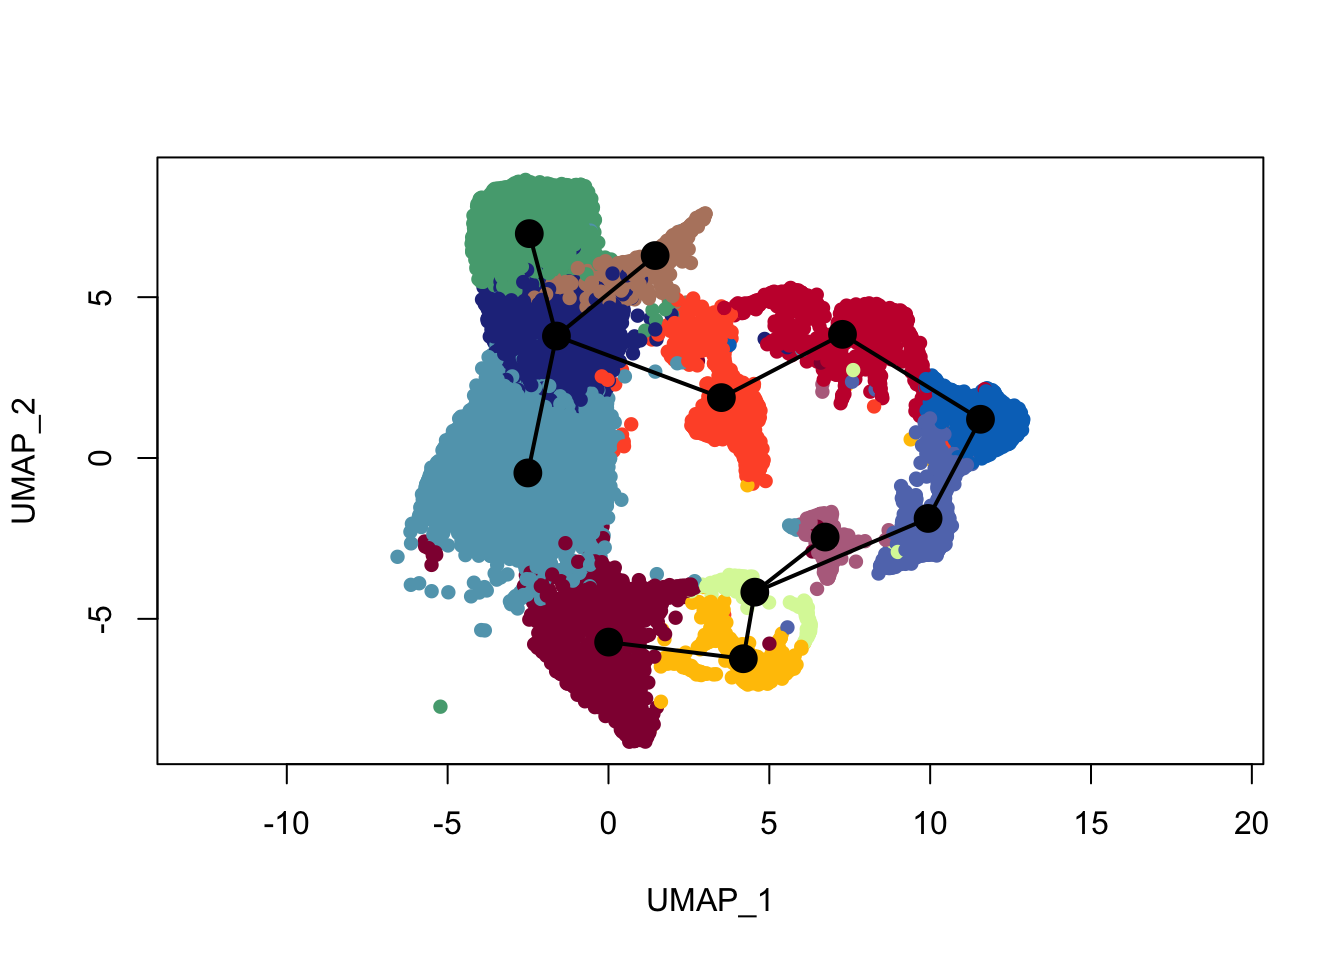
plot(reducedDims(sce)$UMAP, col = colDat$ageCol, pch=16, asp = 1)
lines(SlingshotDataSet(sce), lwd=2, type = 'lineages', col = 'black')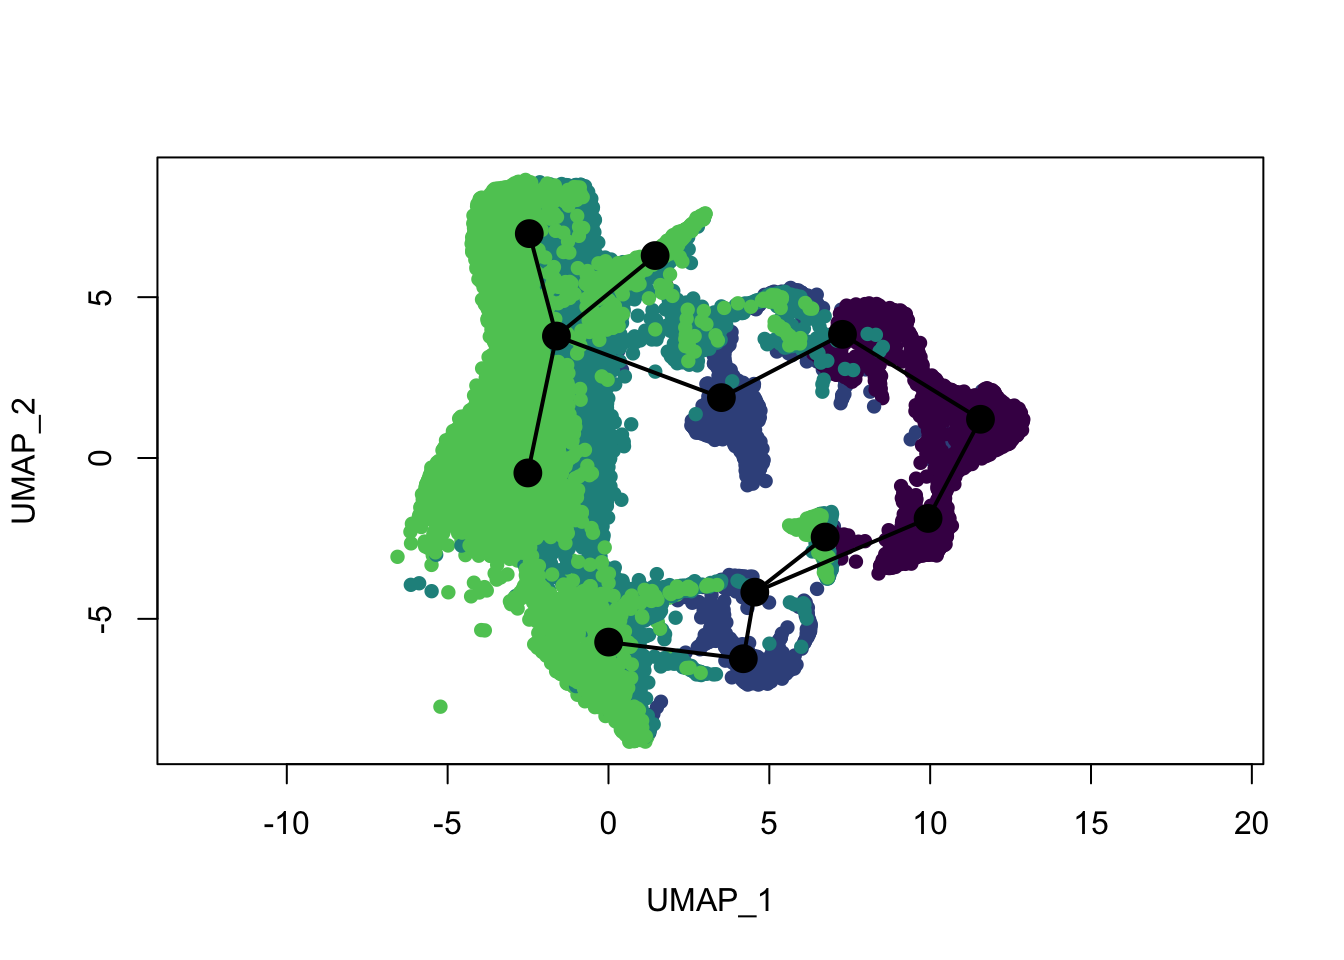
plot(reducedDims(sce)$UMAP, col = colDat$clustCol, pch=16, asp = 1)
lines(SlingshotDataSet(sce), lwd=2, col='black')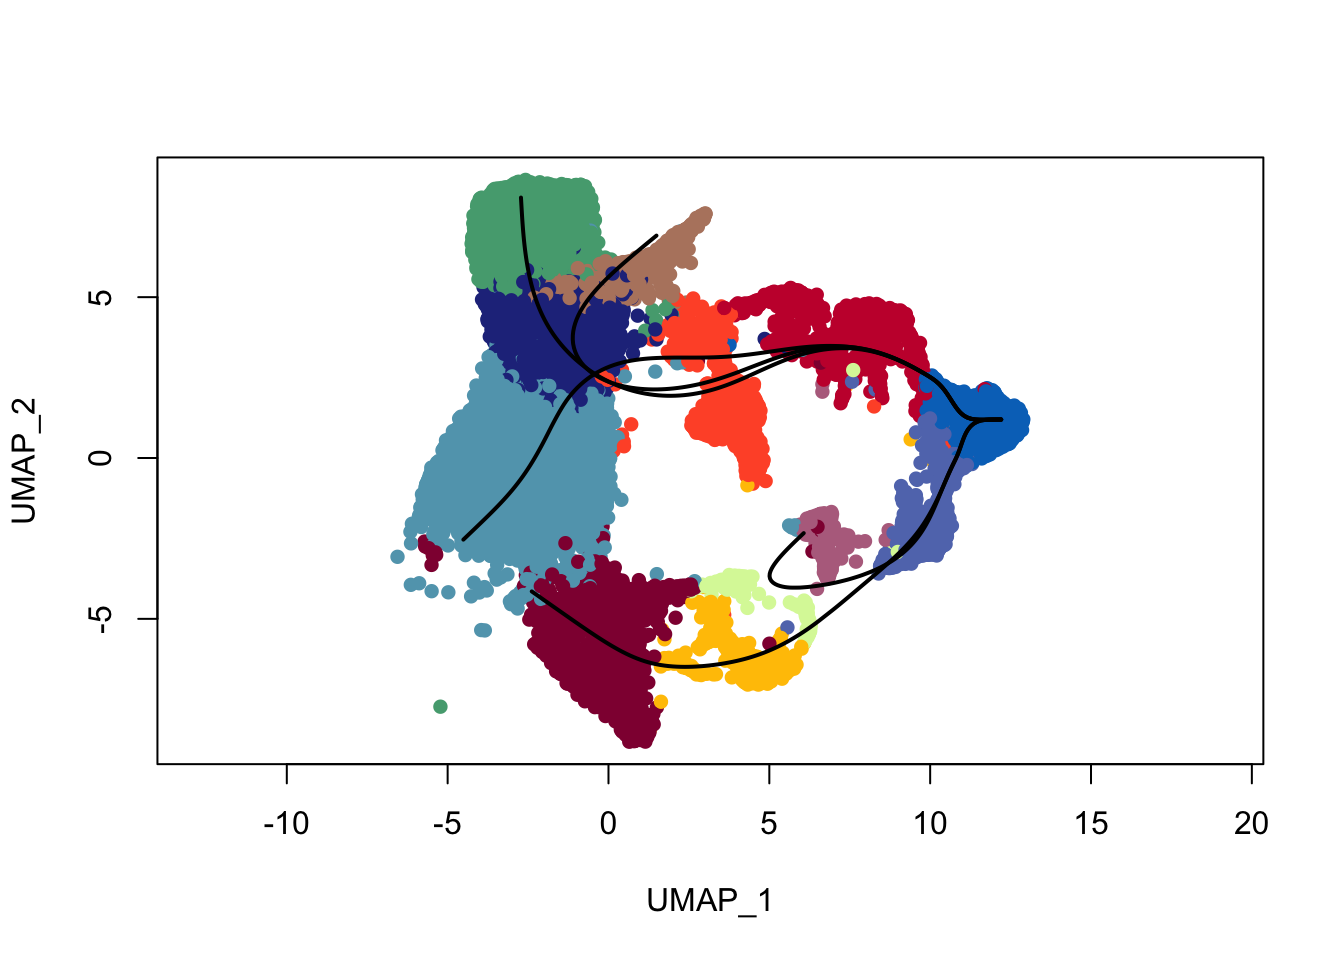
plot(reducedDims(sce)$UMAP, col = colDat$ageCol, pch=16, asp = 1)
lines(SlingshotDataSet(sce), lwd=2, col='black')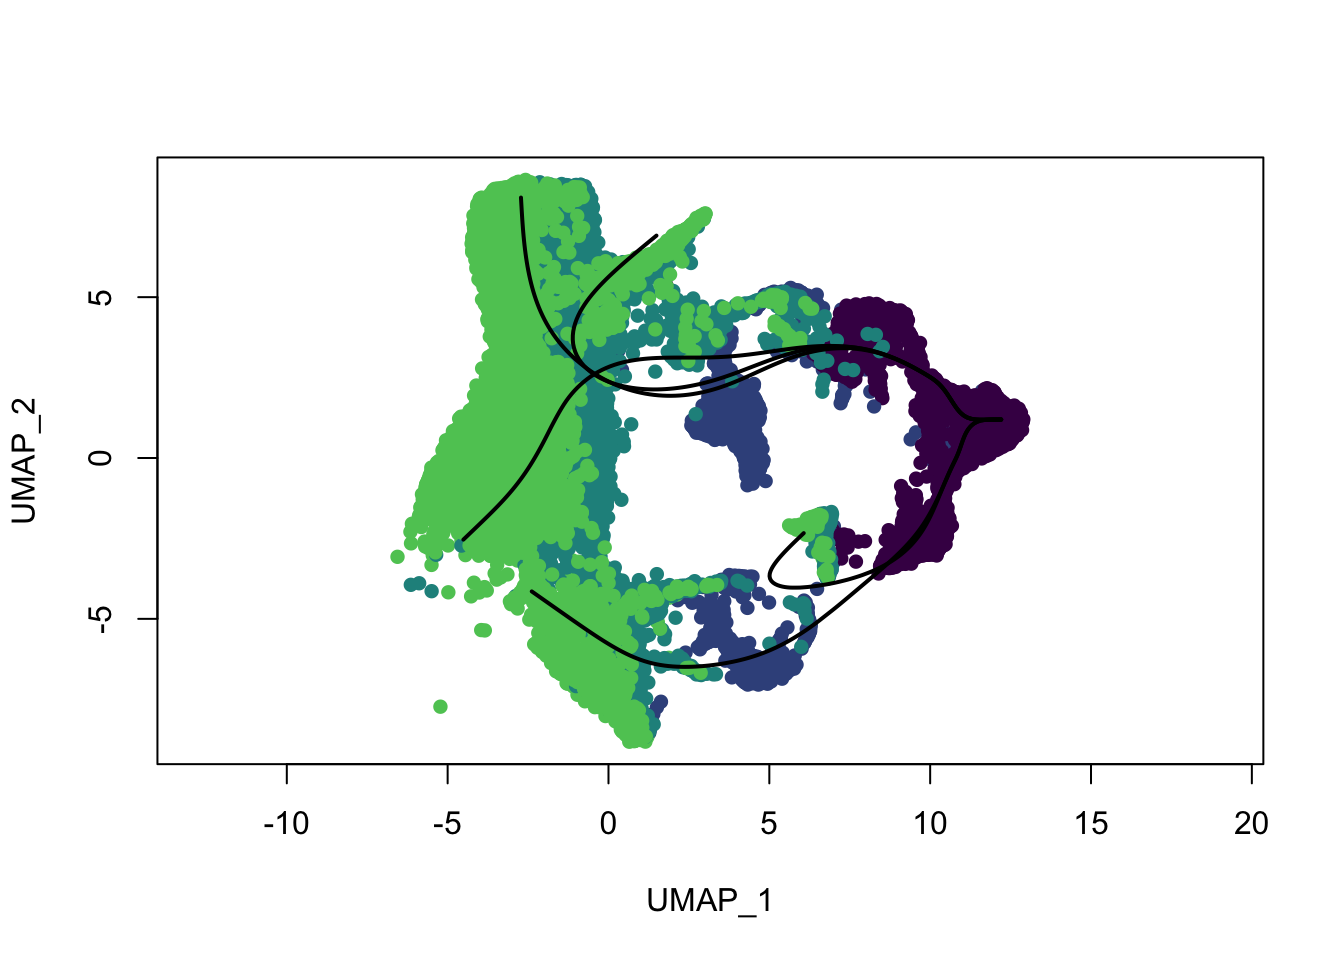
colors <- colorRampPalette(brewer.pal(11,'PuOr')[-6])(100)
plotcol <- colors[cut(slingAvgPseudotime(SlingshotDataSet(sce)), breaks=100)]

plot(reducedDims(sce)$UMAP, col = plotcol, pch=16, asp = 1)
lines(SlingshotDataSet(sce), lwd=2, col='black')
plot(reducedDims(sce)$UMAP, col = "#bfbcbd", pch=16, asp = 1)
lines(SlingshotDataSet(sce), lwd=4, col=colLin)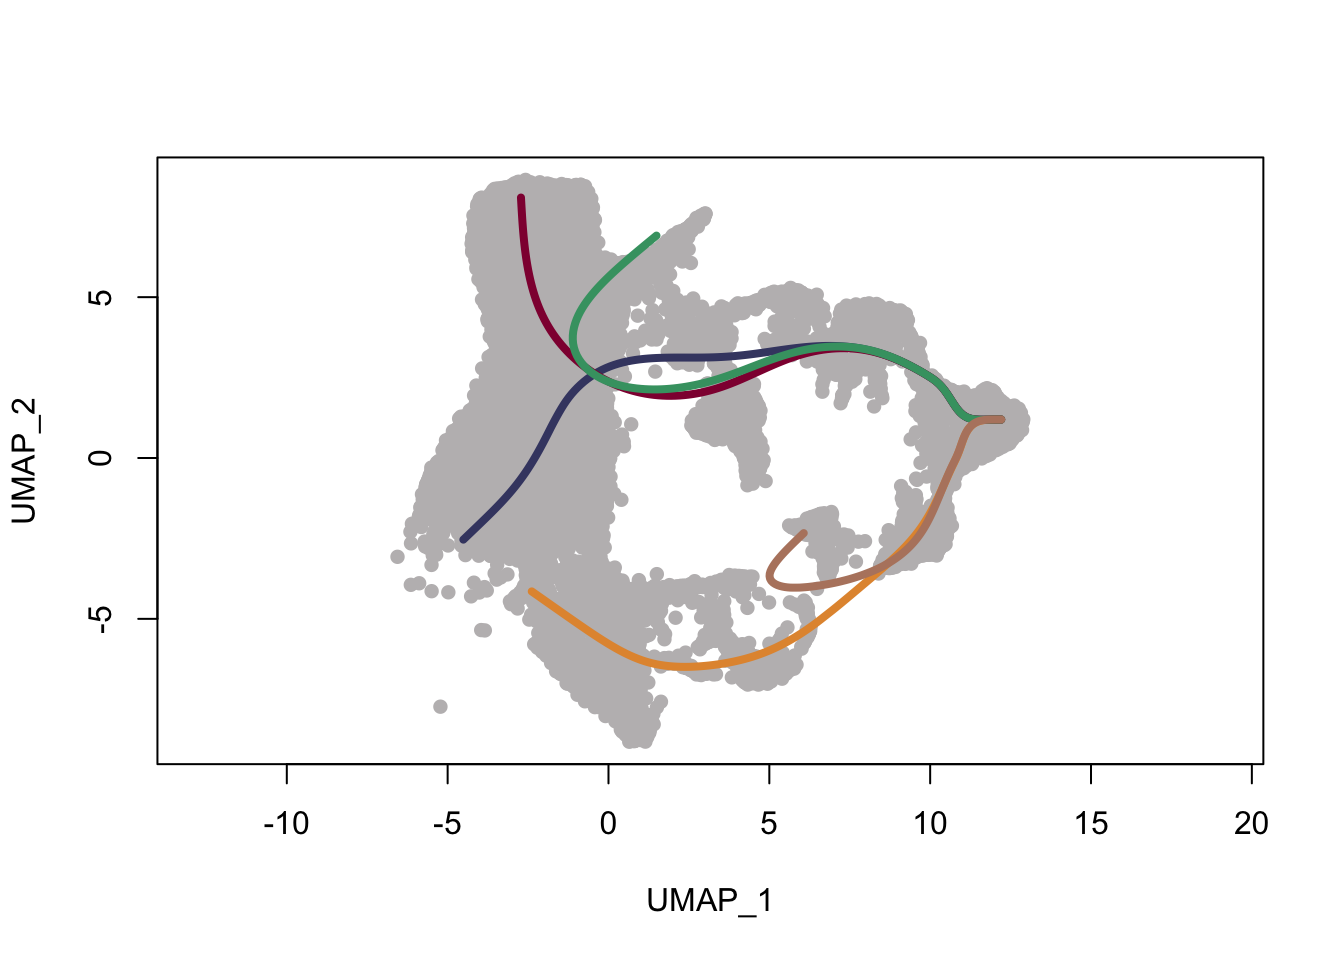
Between lineage comparison
patternRes <- patternTest(sceGAM, l2fc = log2(2))
oPat <- order(patternRes$waldStat, decreasing = TRUE)
head(rownames(patternRes)[oPat])
[1] "ENSMUSG00000022037.Clu" "ENSMUSG00000030605.Mfge8"
[3] "ENSMUSG00000094686.Ccl21a" "ENSMUSG00000026879.Gsn"
[5] "ENSMUSG00000071005.Ccl19" "ENSMUSG00000025491.Ifitm1"rankGene <- rownames(patternRes)[oPat]
lapply(rankGene[1:2], function(selGene){
plotSmoothers(sceGAM, counts(sceGAM), gene = selGene, curvesCols=colLin,
nPoints = 100) +
ggtitle(selGene) +
scale_color_manual(values=colLin)
})[[1]]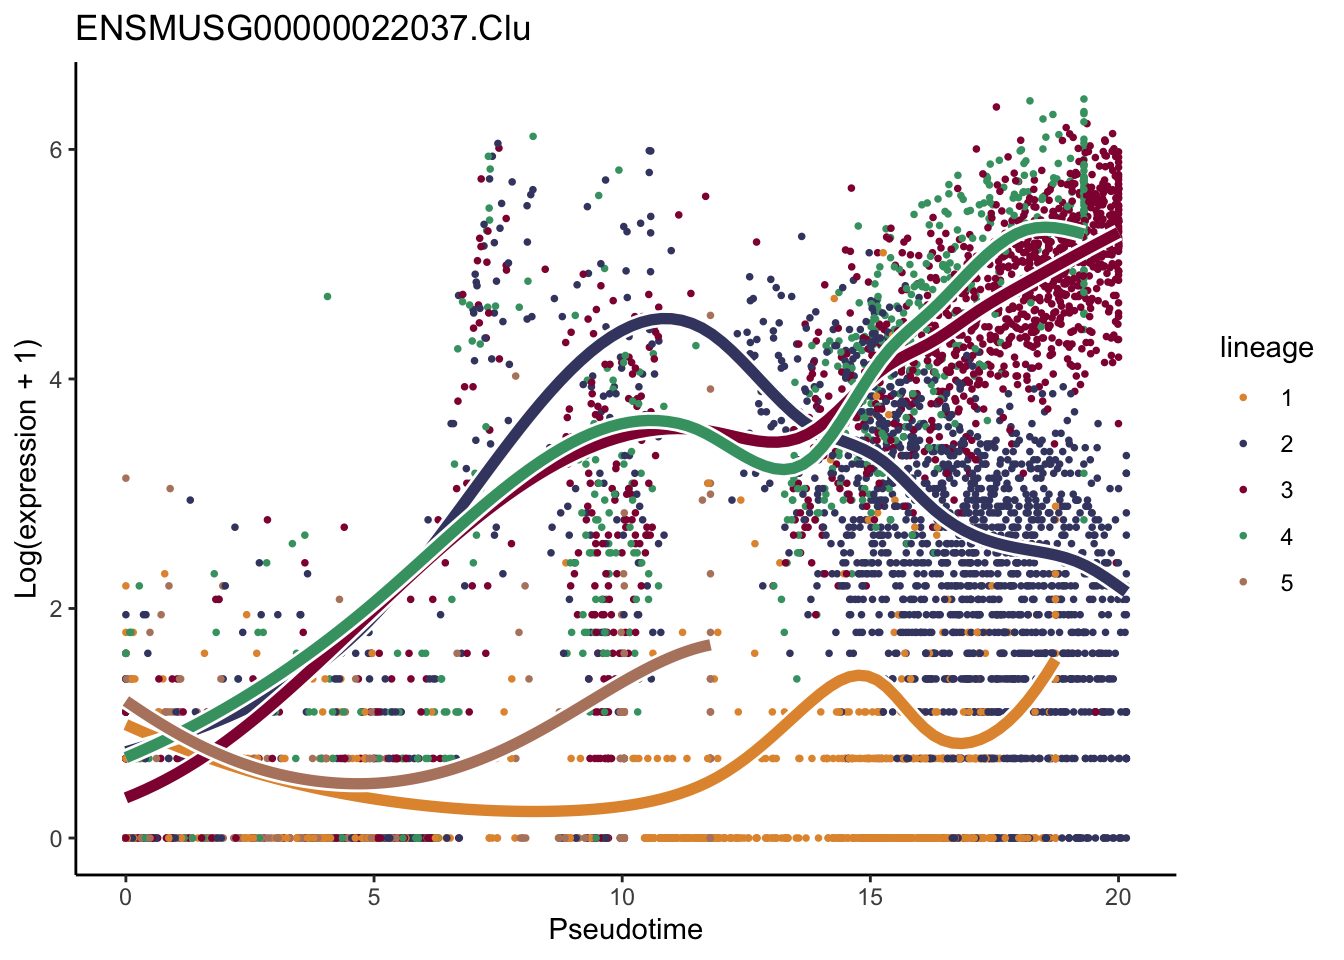
[[2]]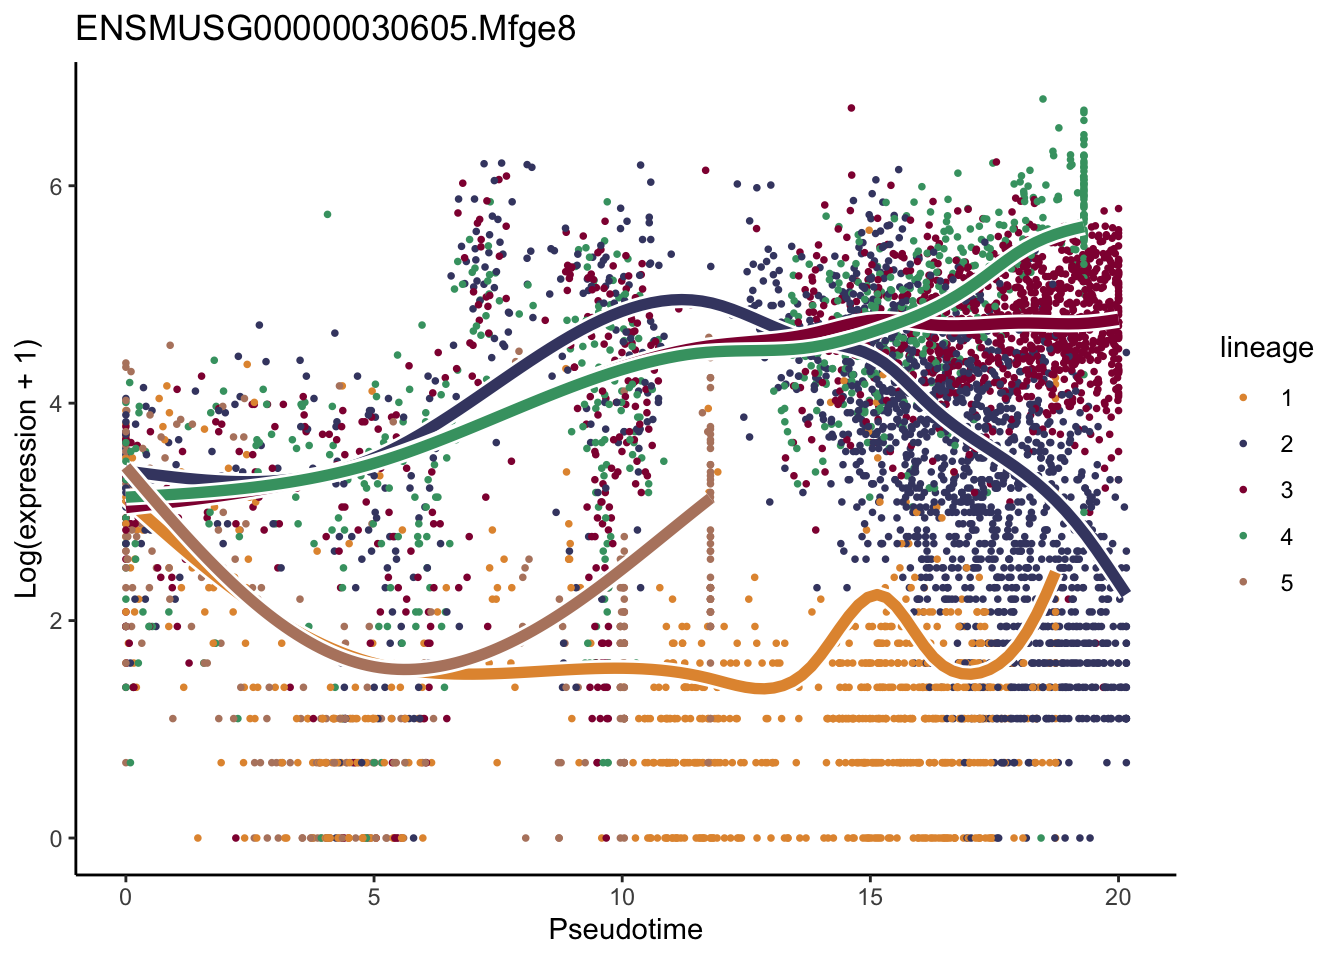
lapply(rankGene[1:30], function(selGene){
  plotGeneCount(SlingshotDataSet(sce), counts(sce), gene = selGene) +
    scale_color_gradientn( colours = c("#e7e7e7", "#c98599", "#8a062d"))
})
[[1]]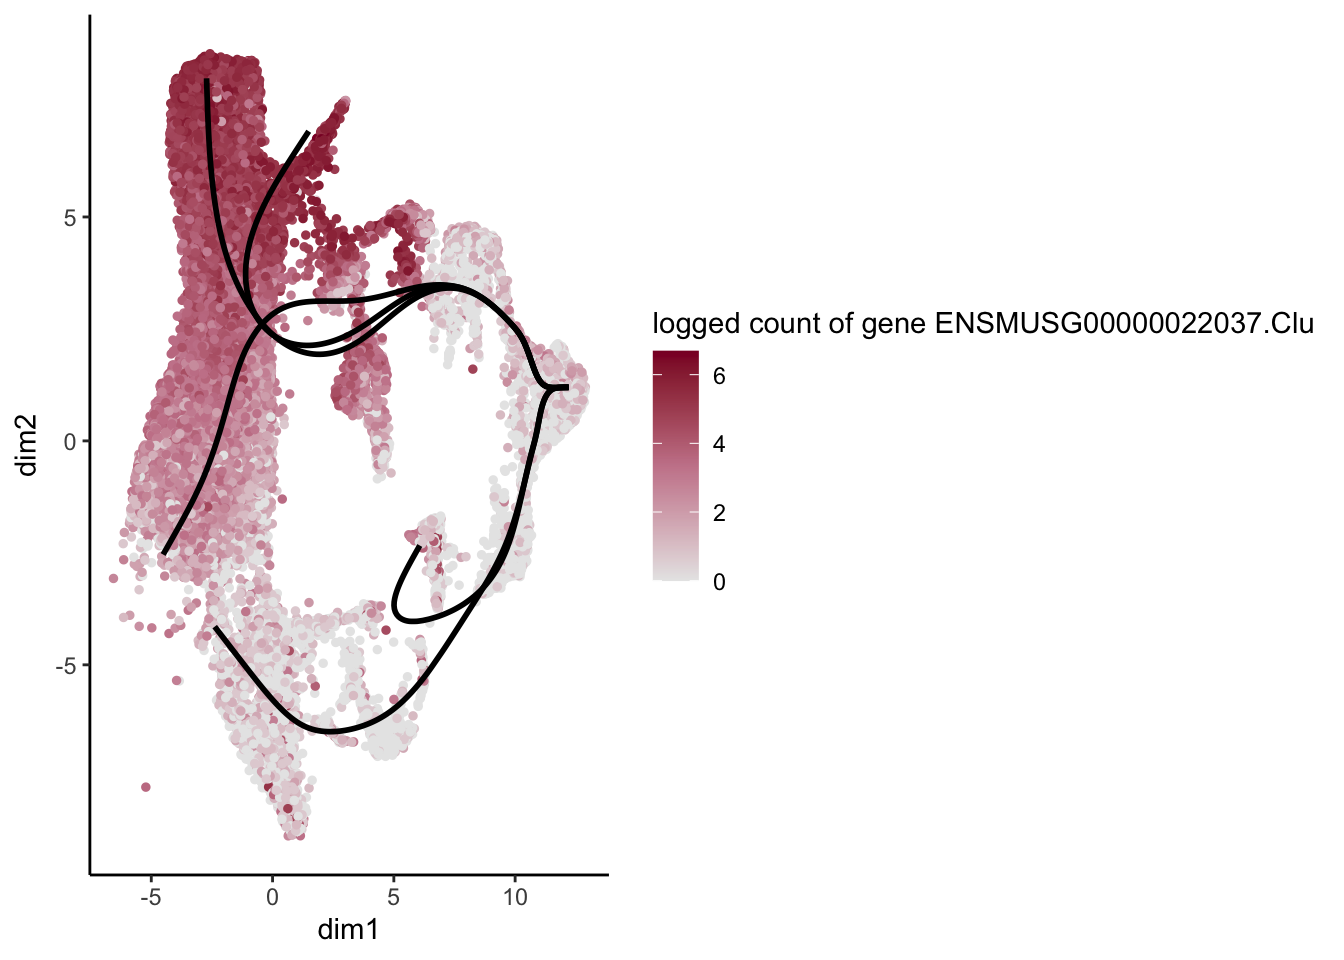
[[2]]
[[3]]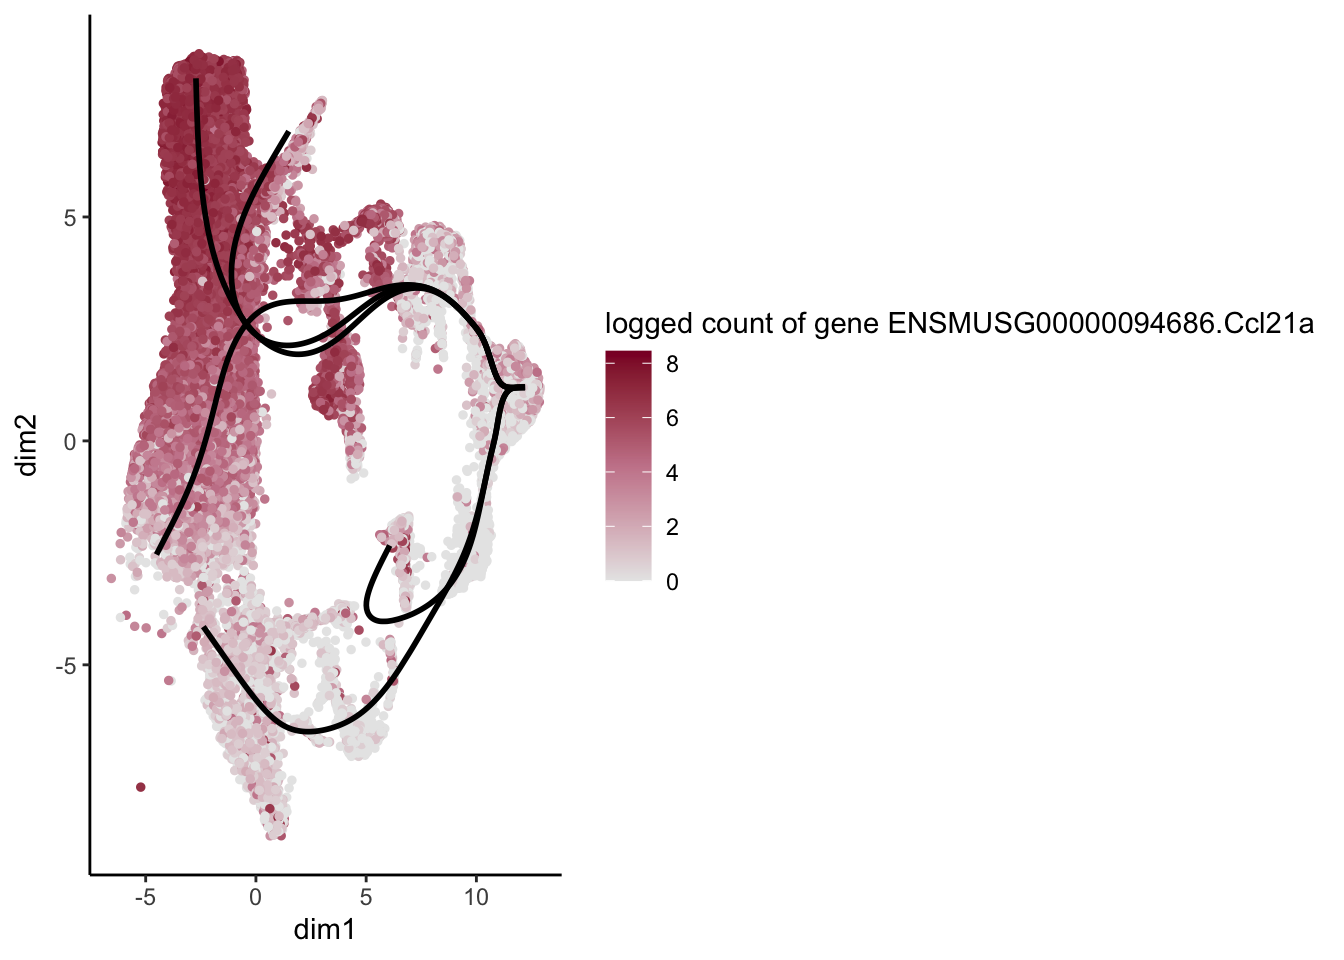
[[4]]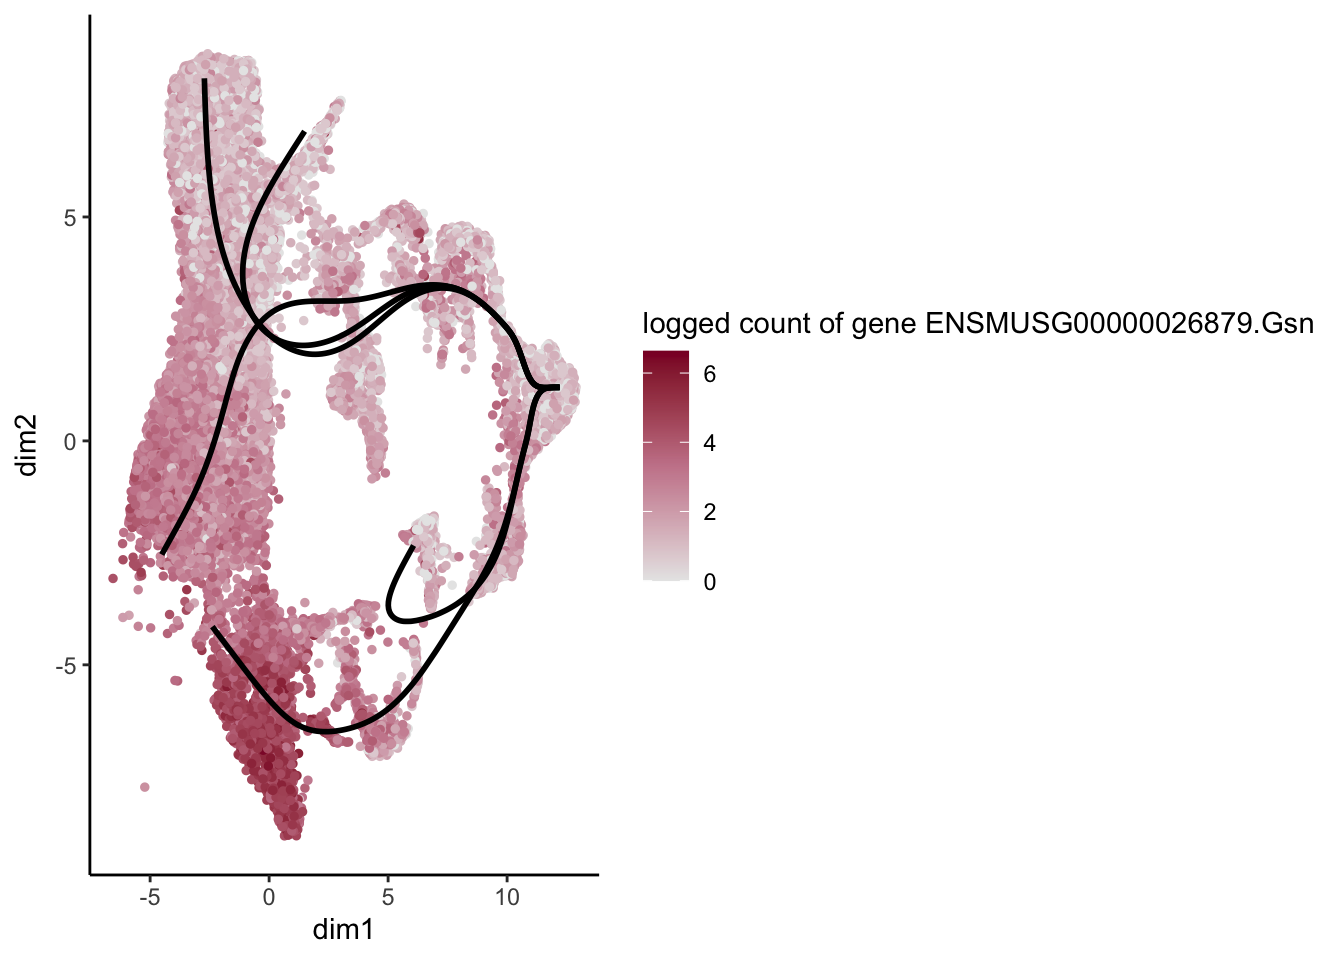
[[5]]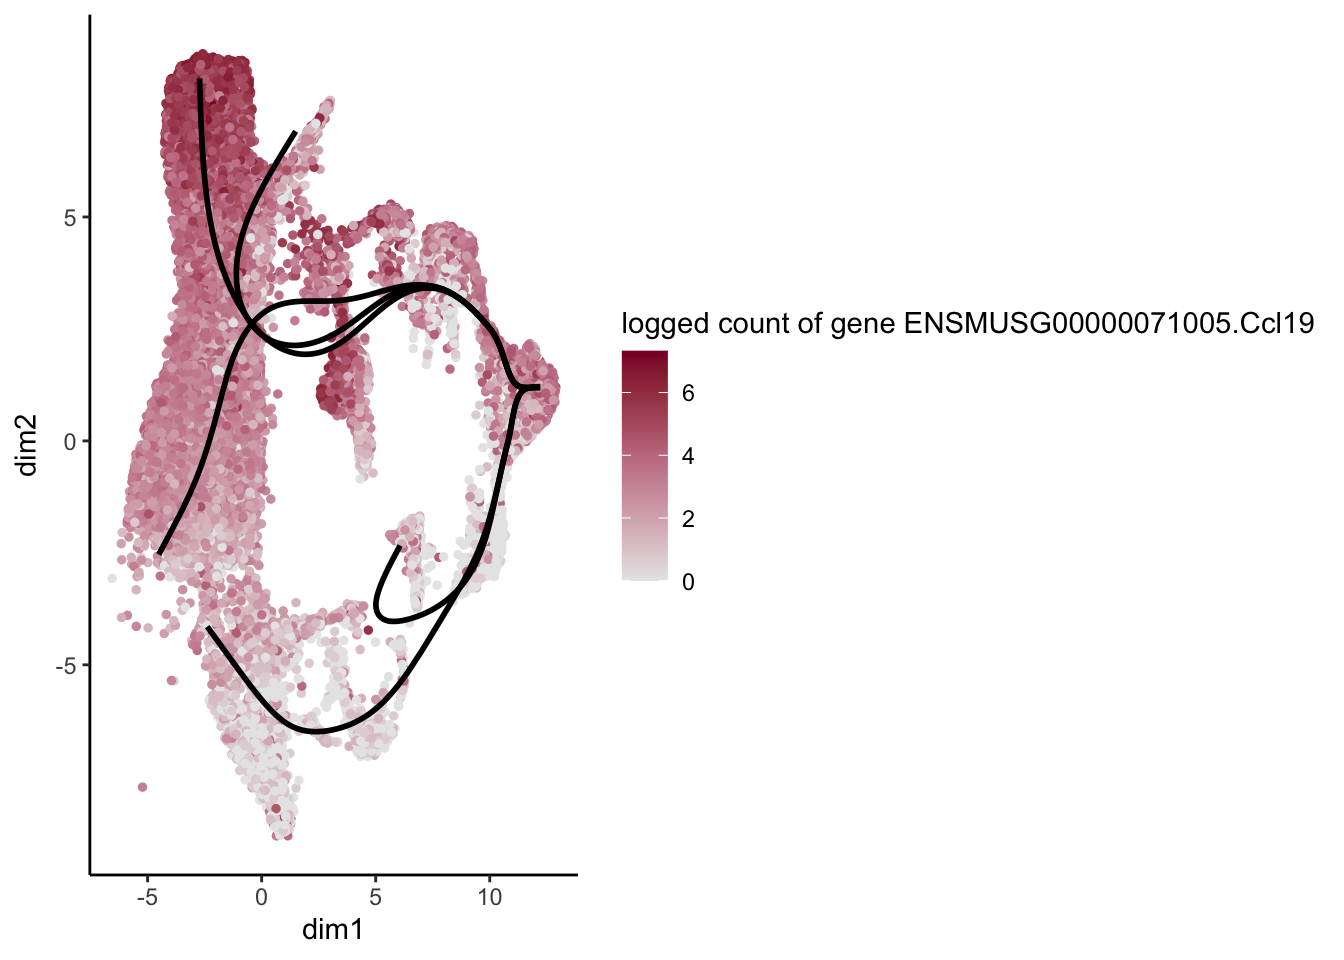
[[6]]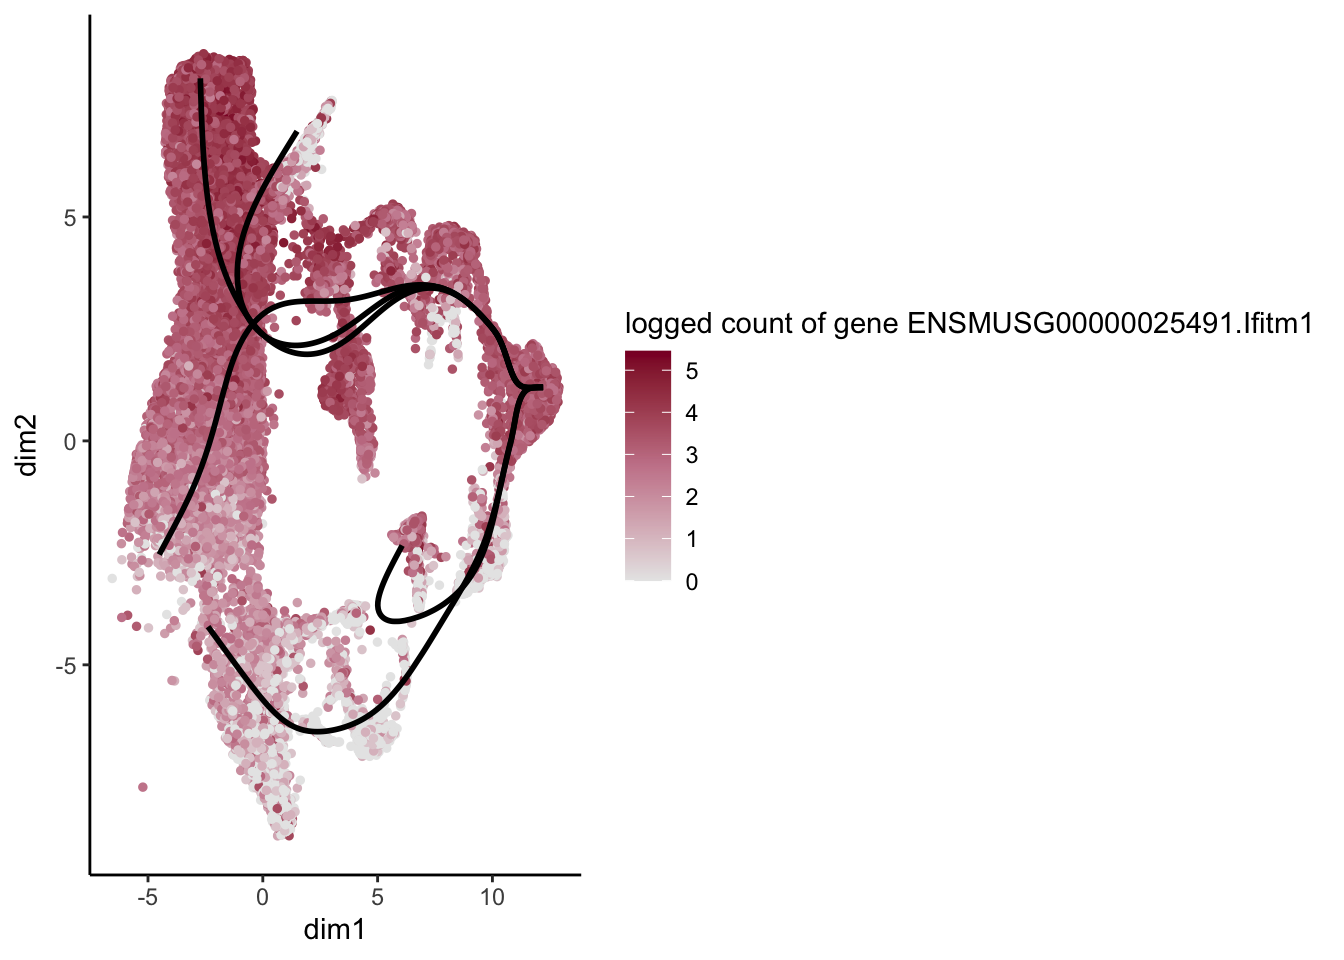
[[7]]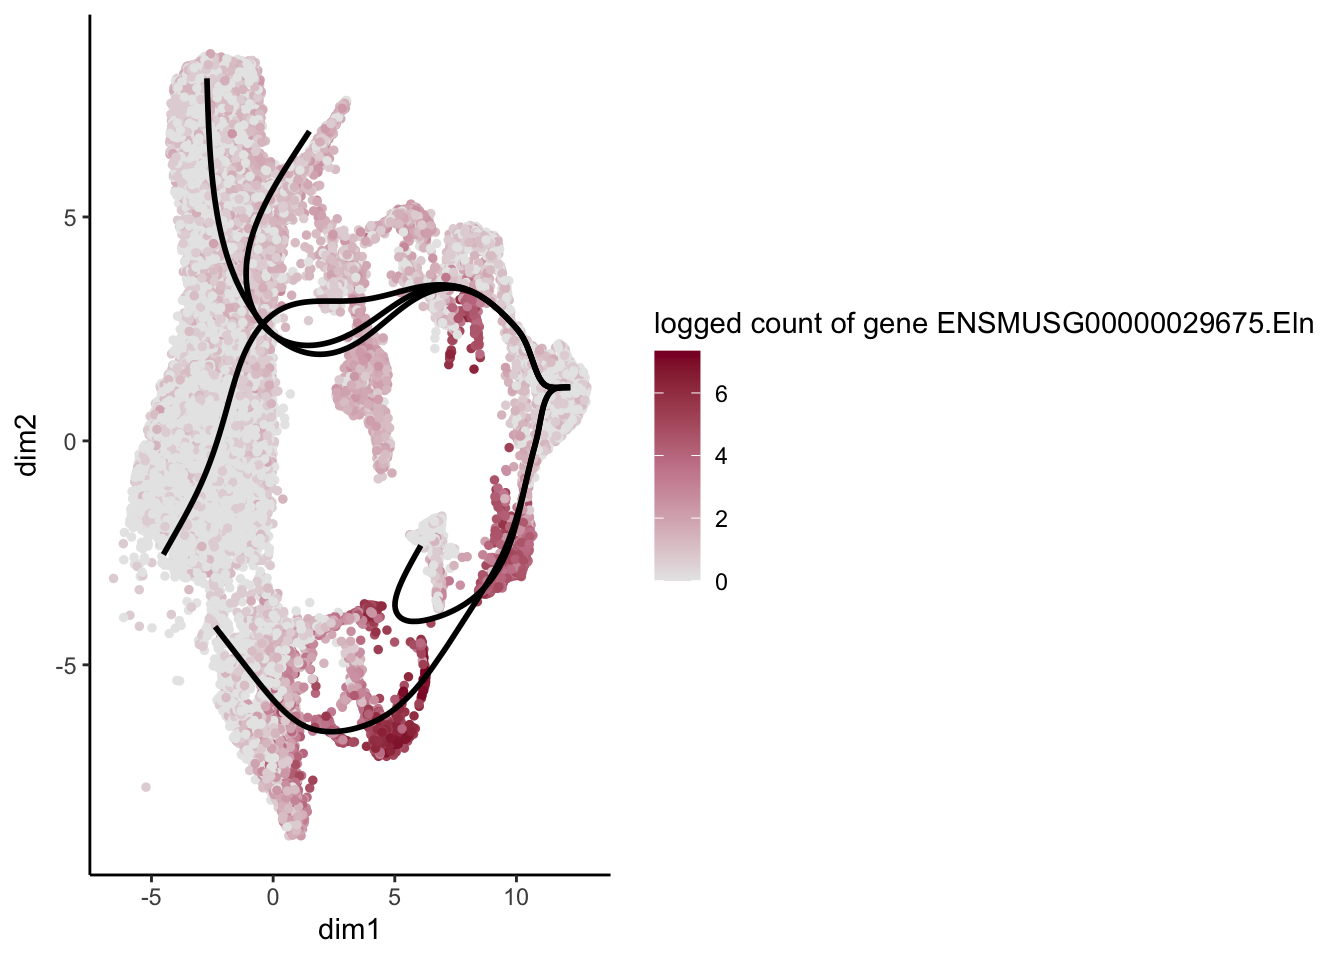
[[8]]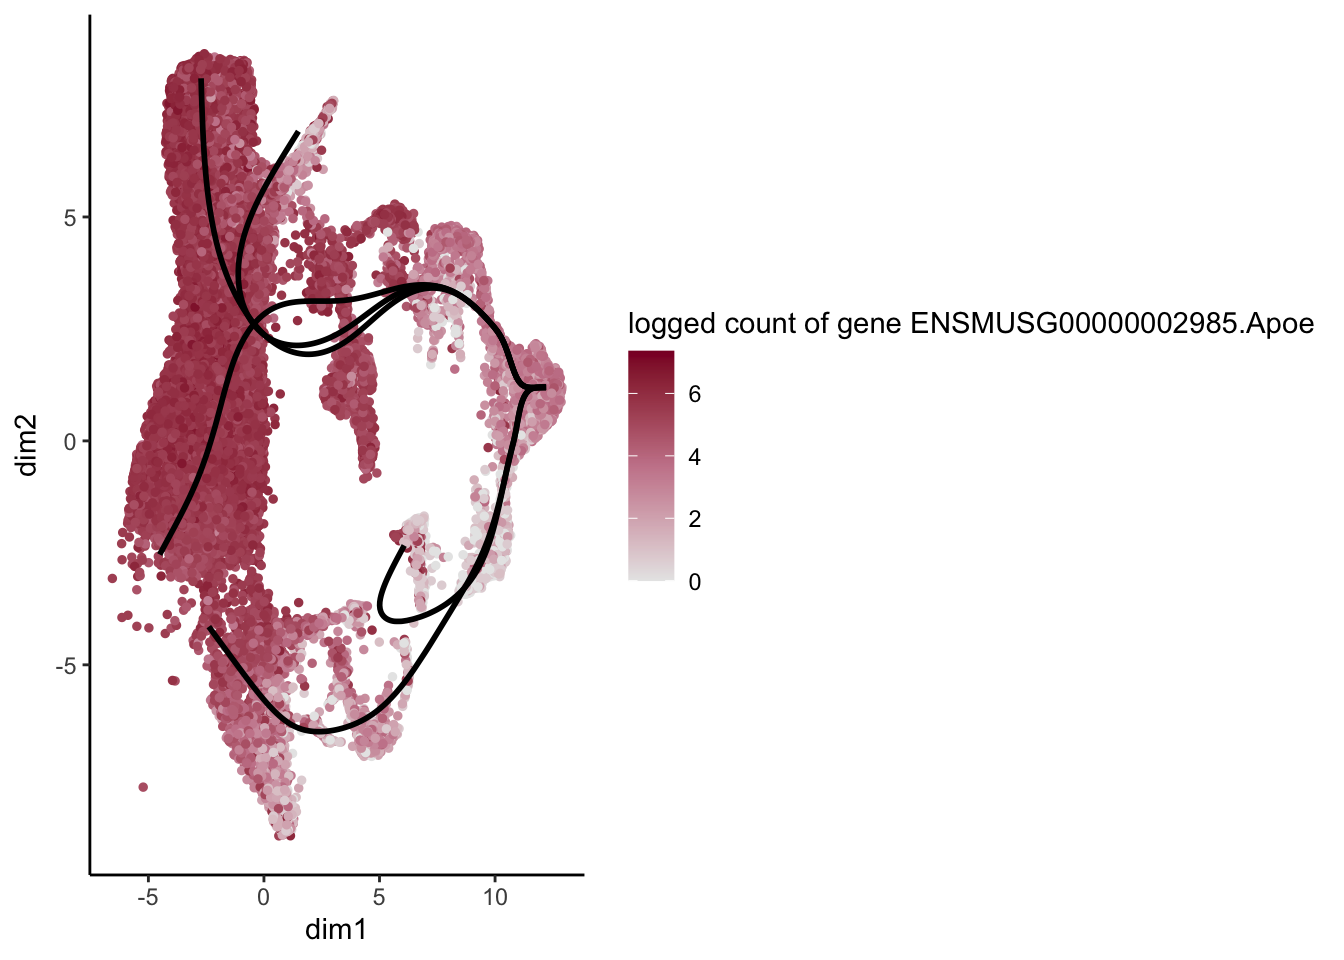
[[9]]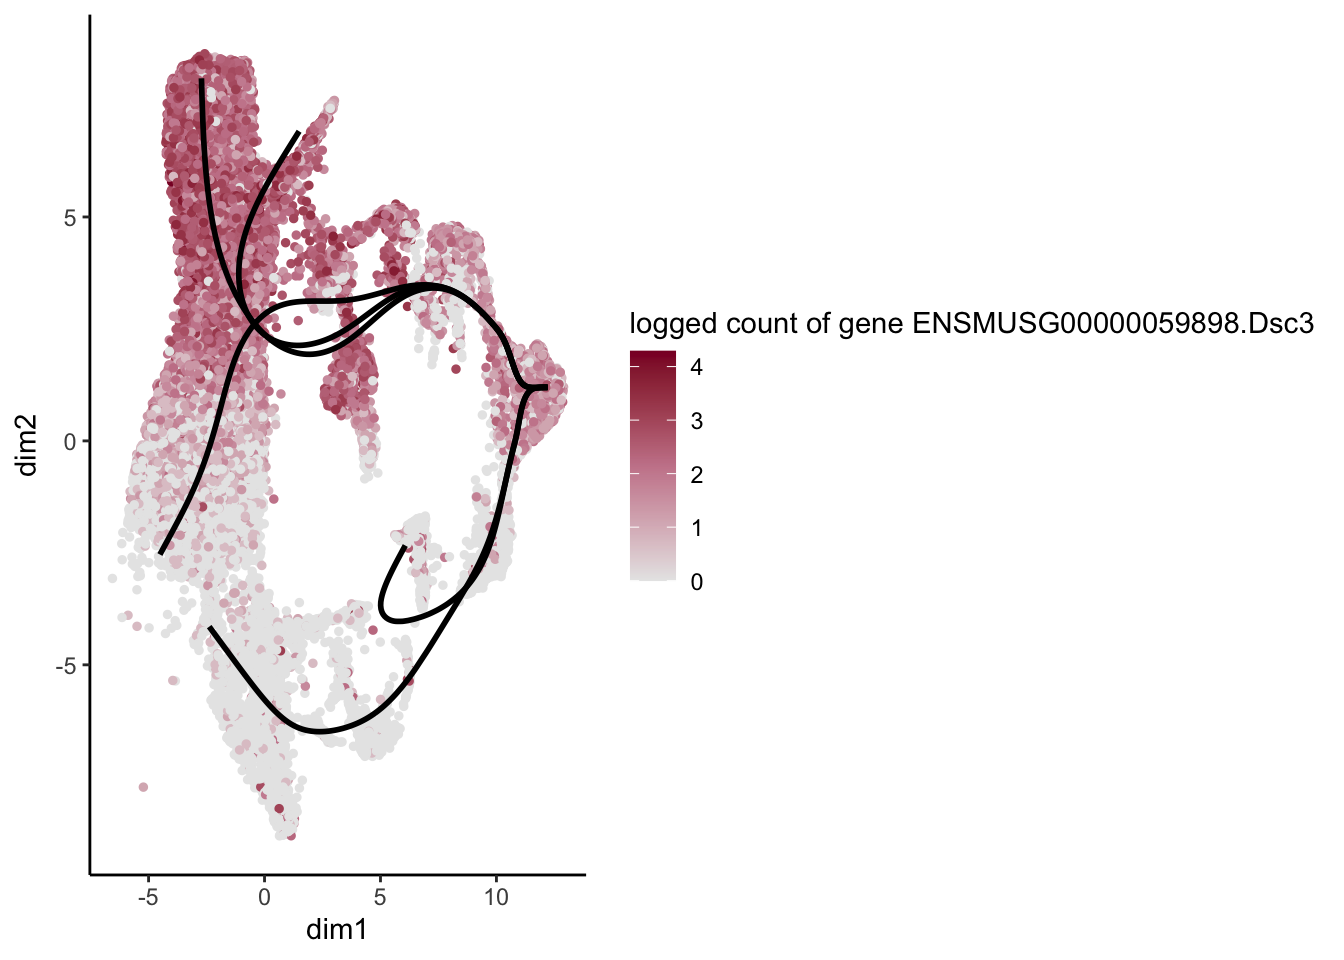
[[10]]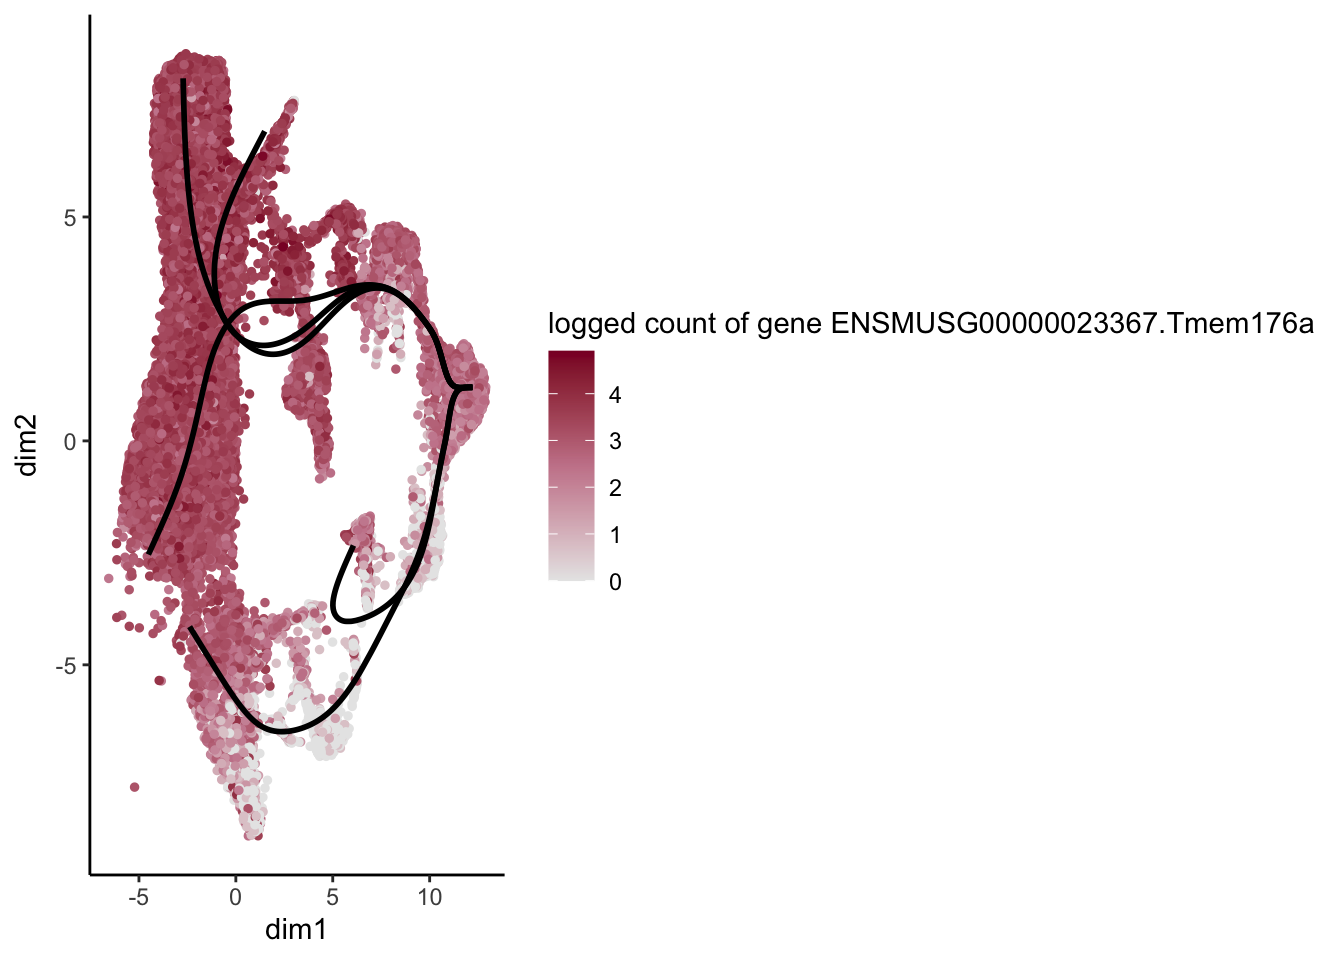
[[11]]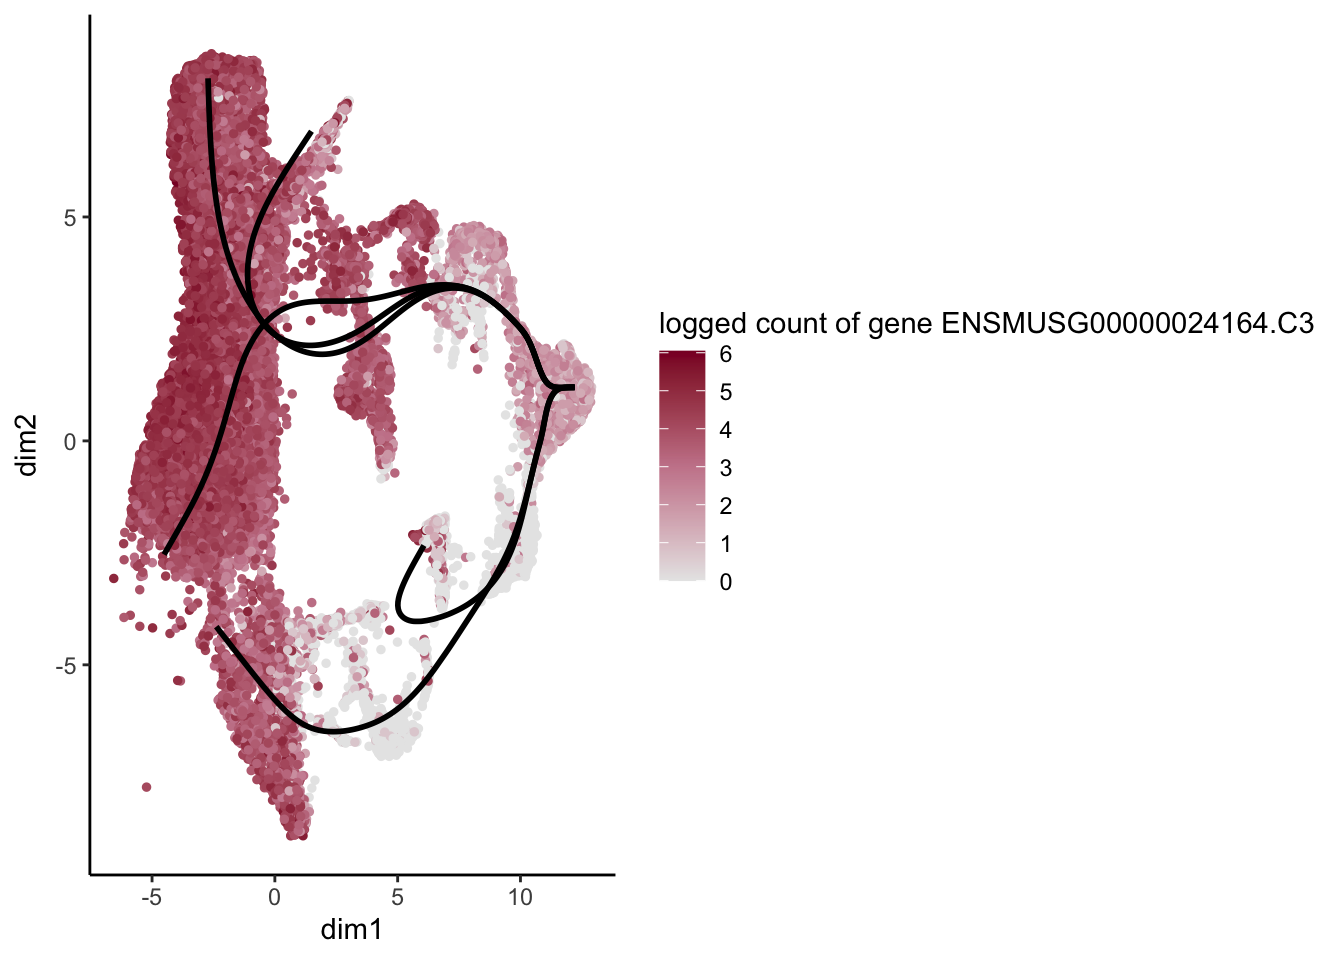
[[12]]
[[13]]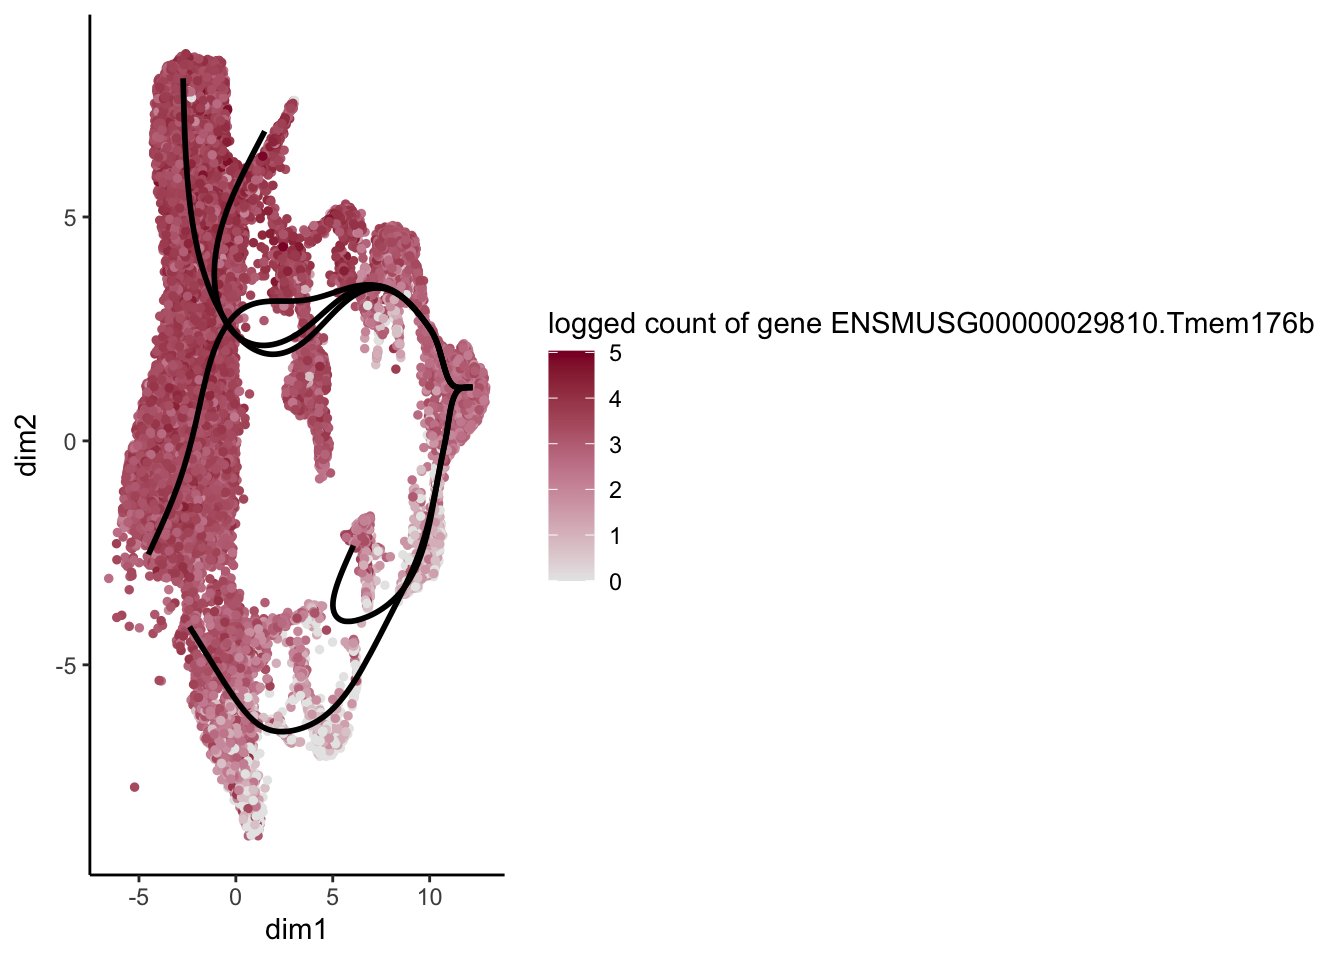
[[14]]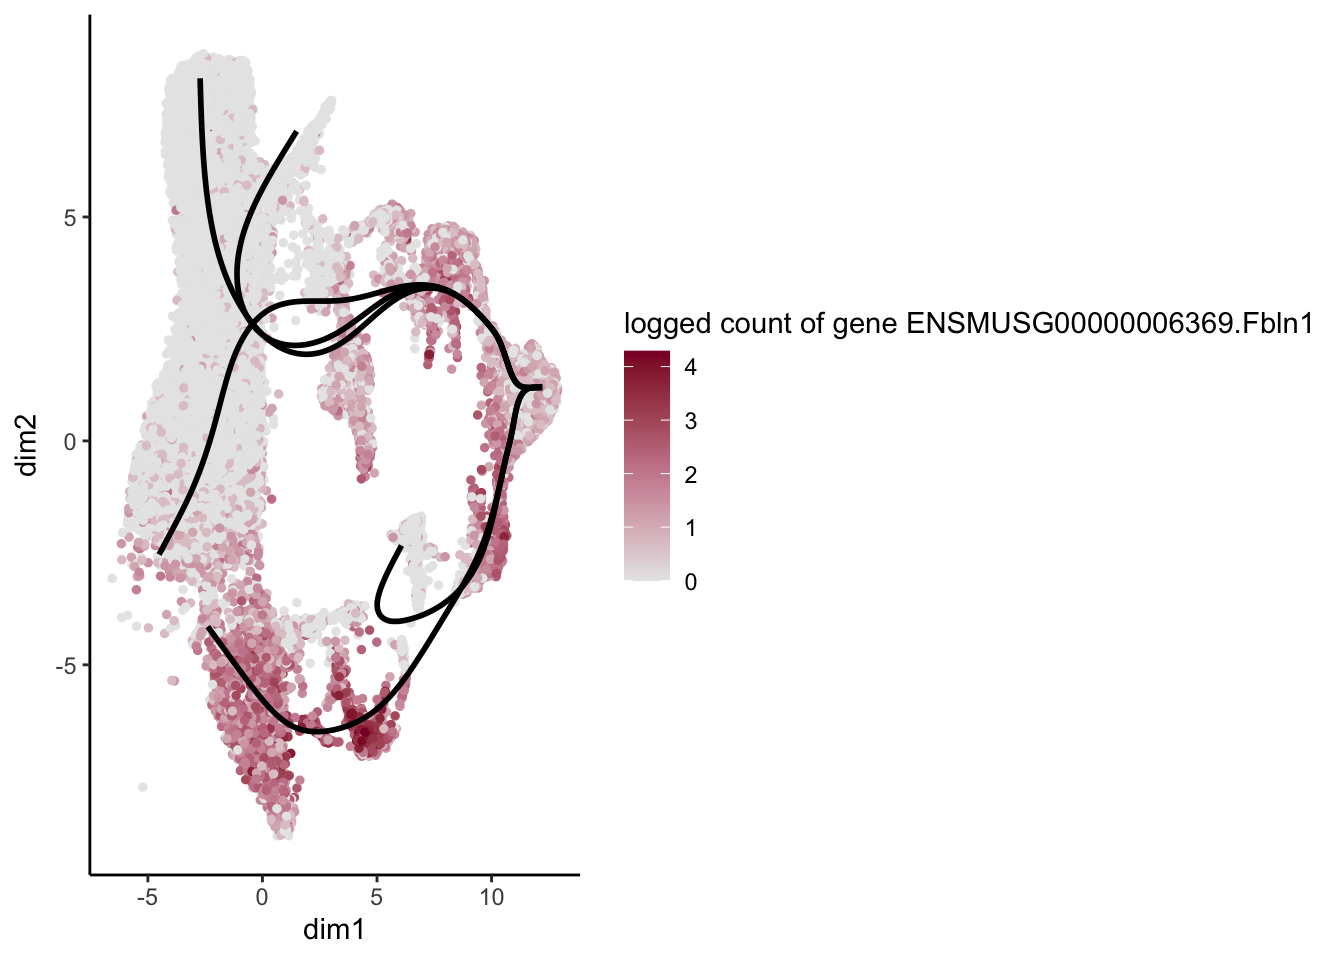
[[15]]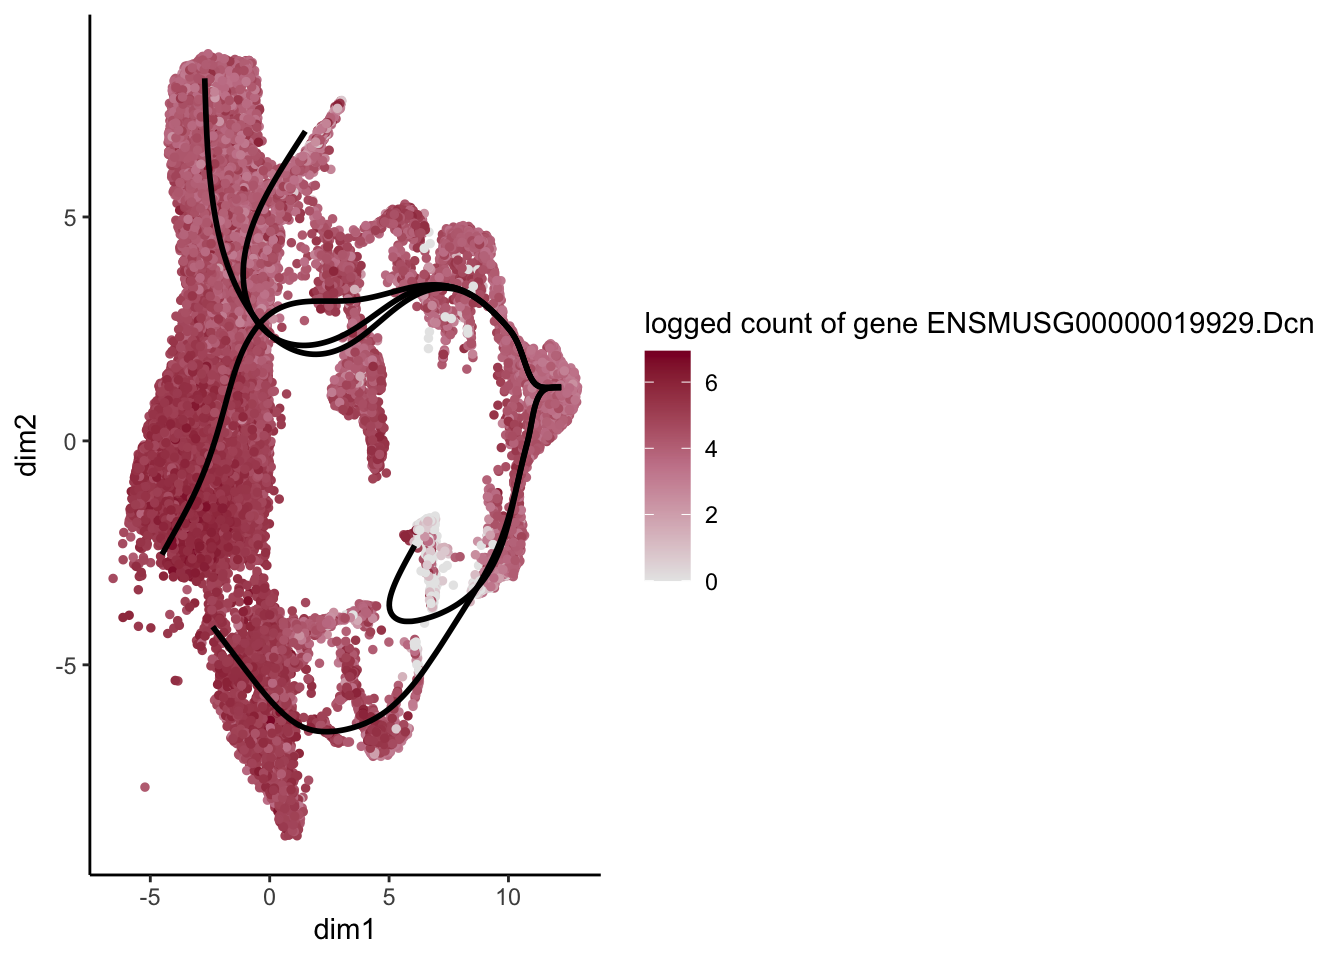
[[16]]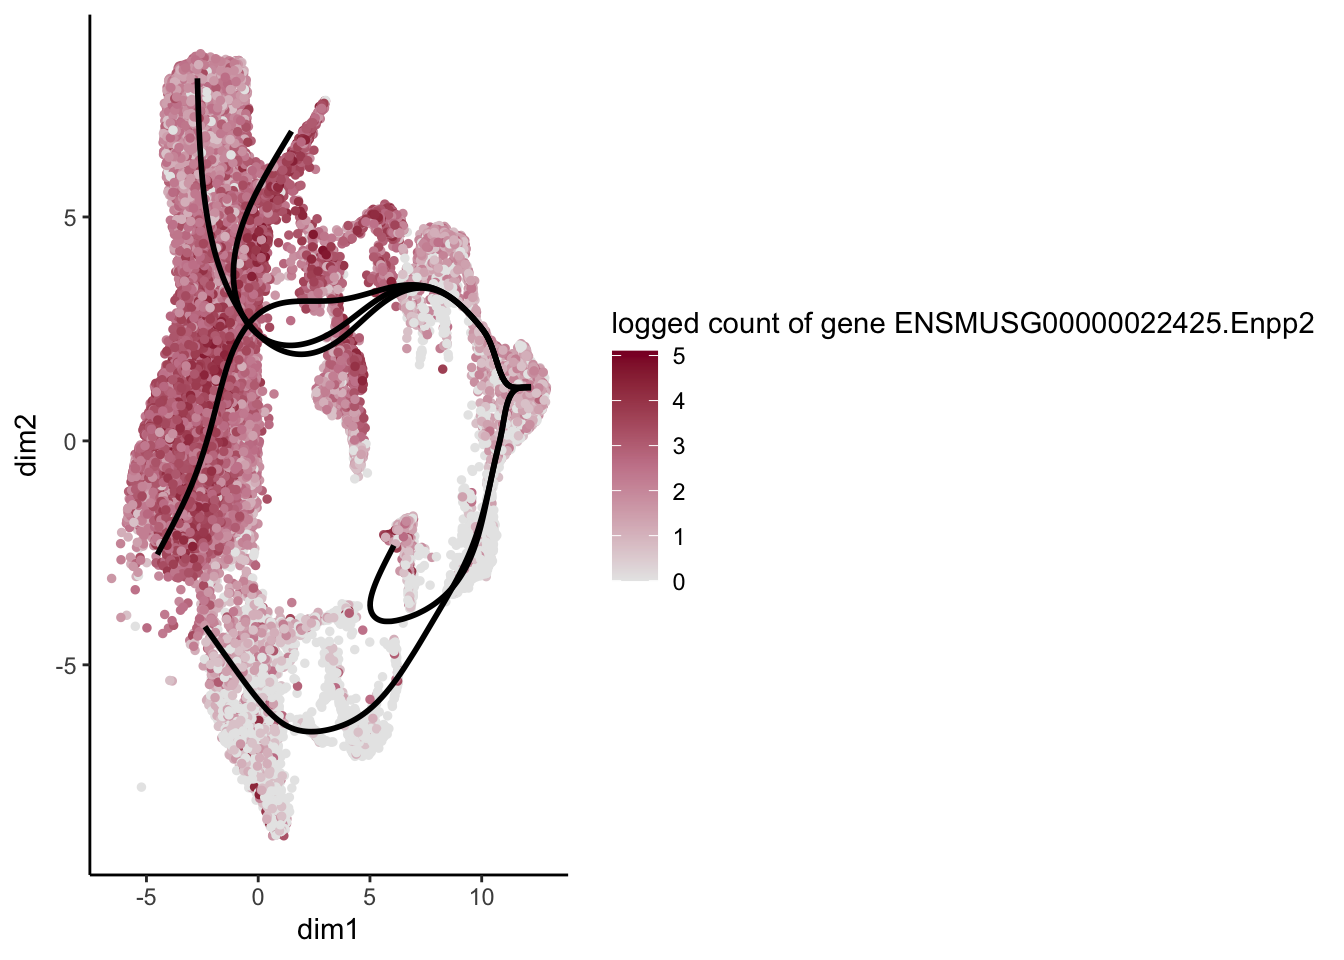
[[17]]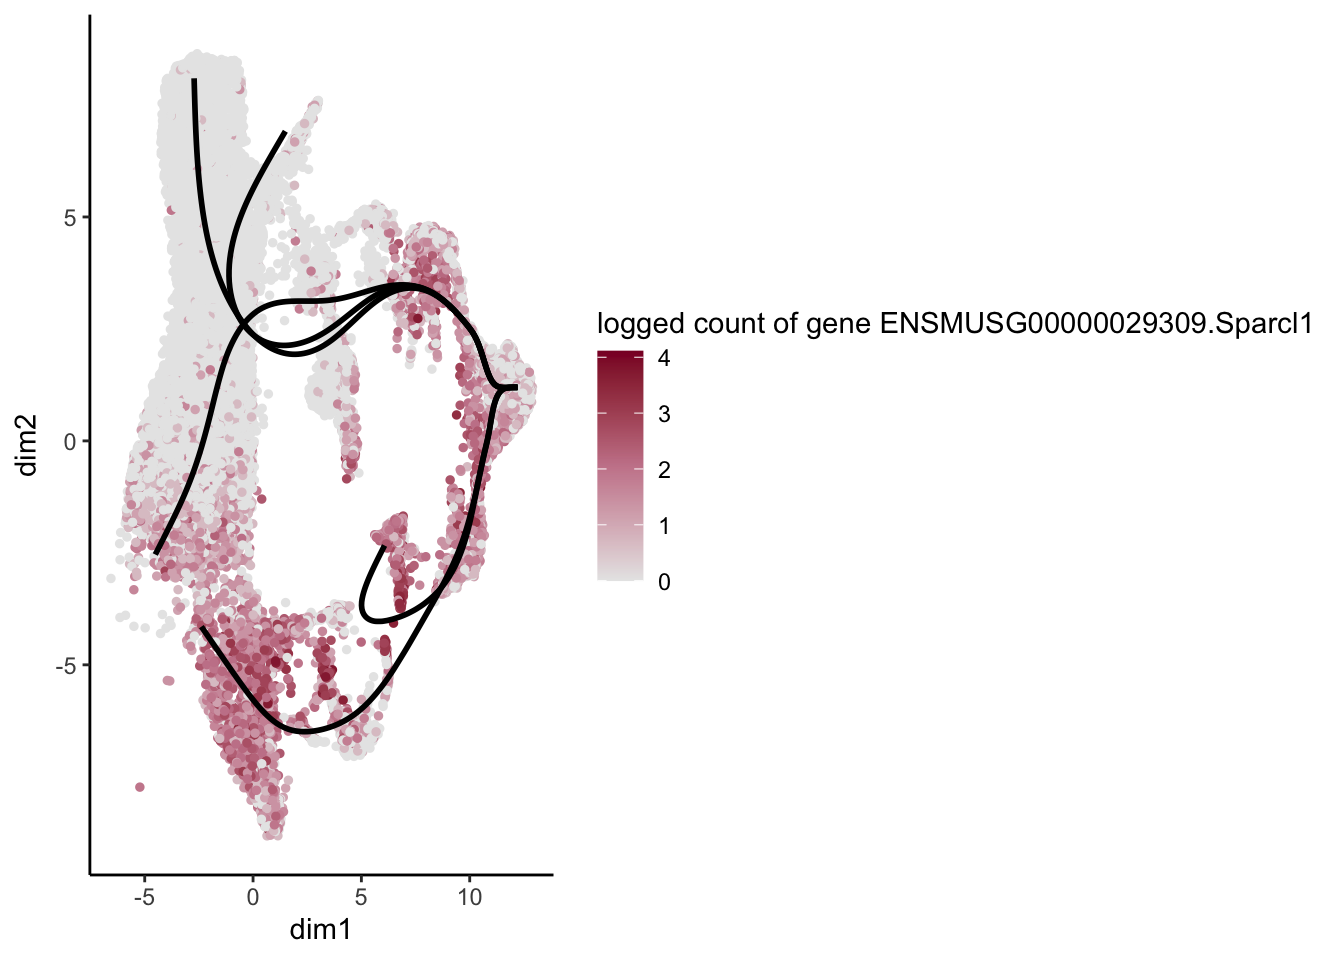
[[18]]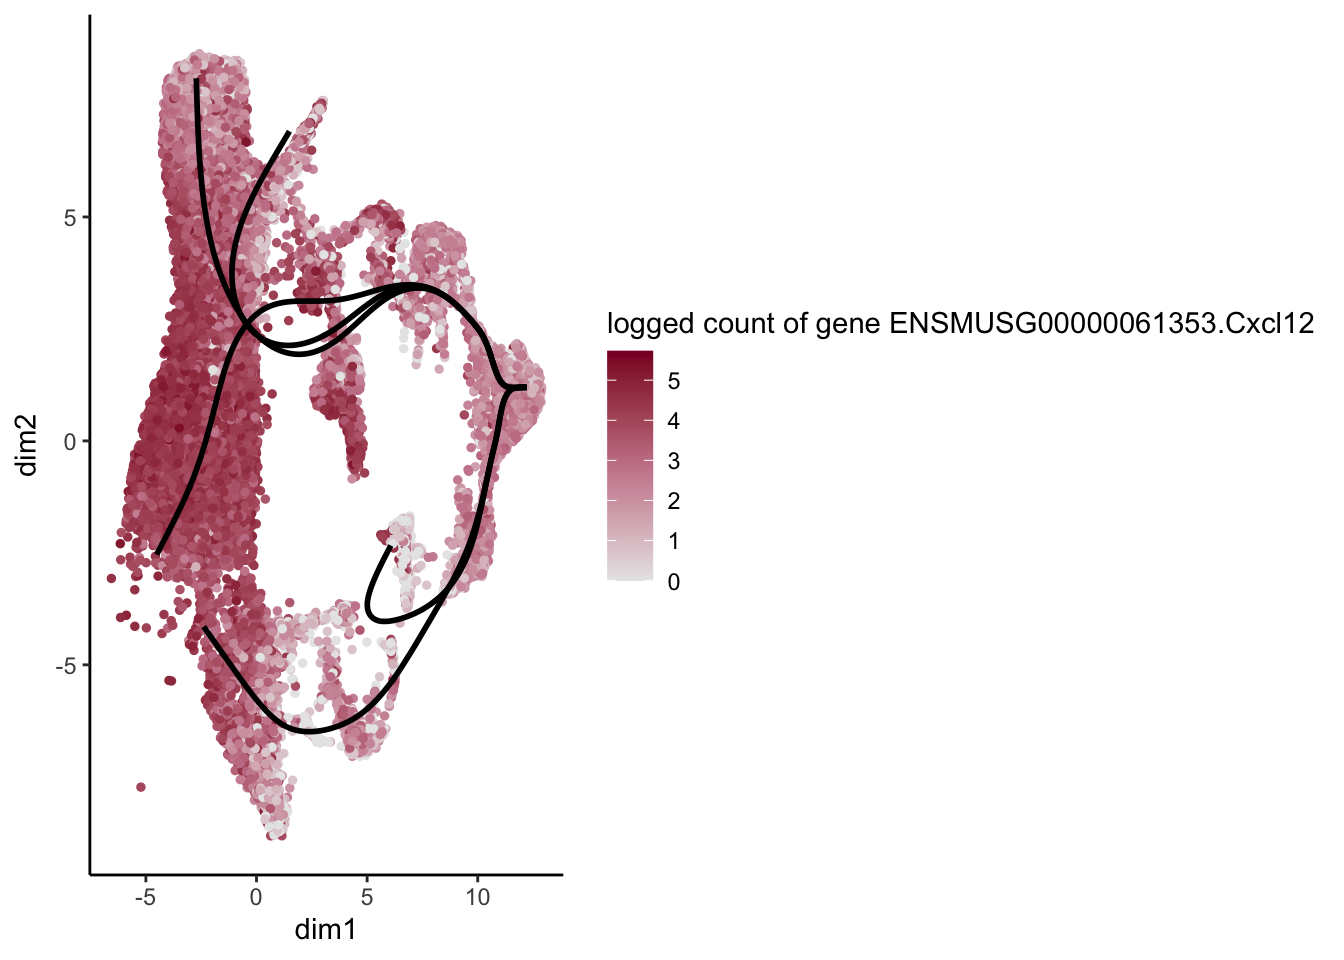
[[19]]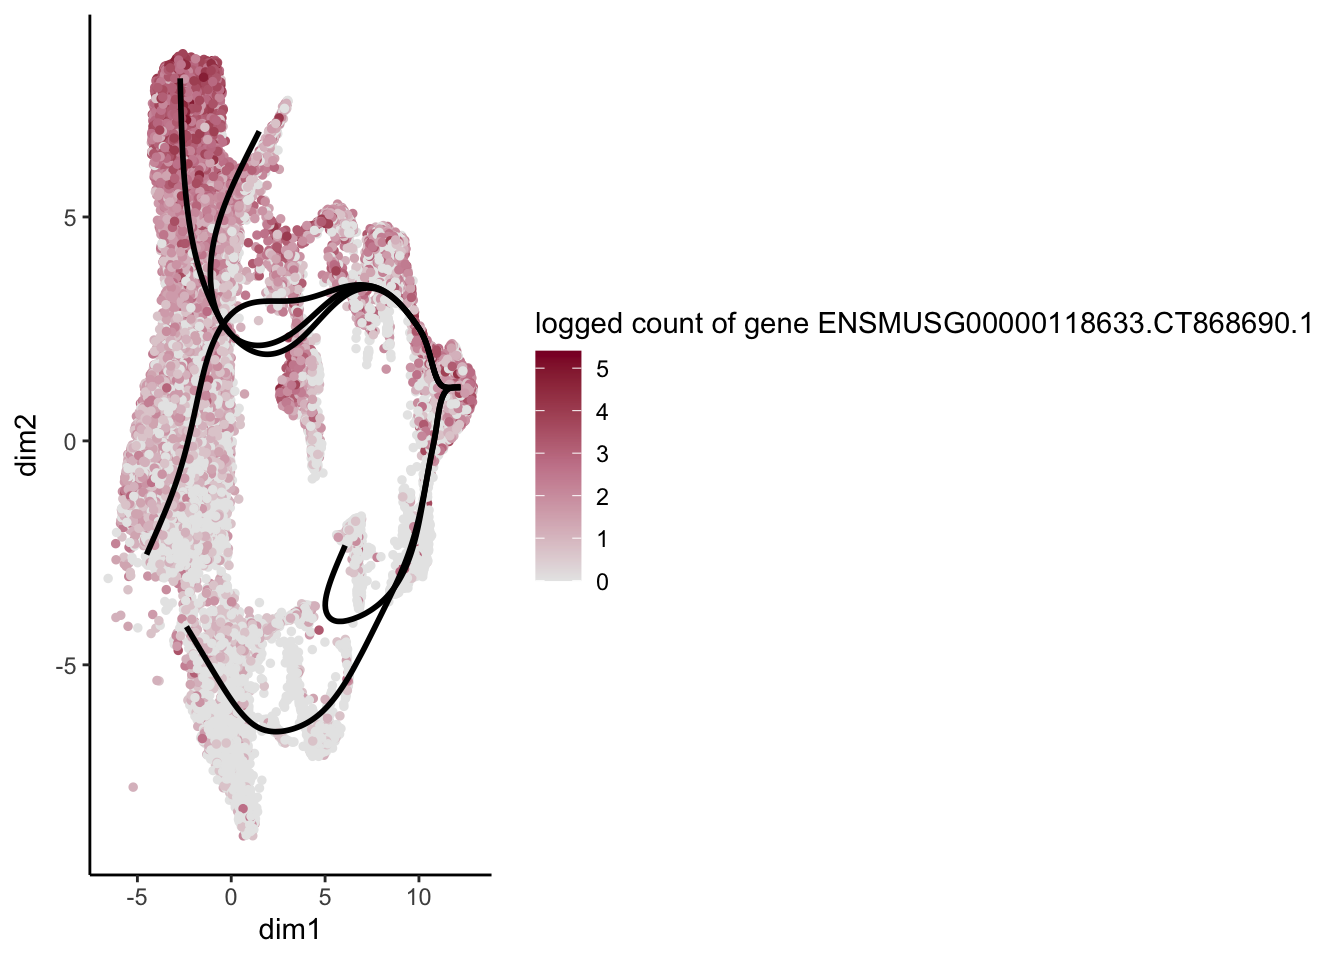
[[20]]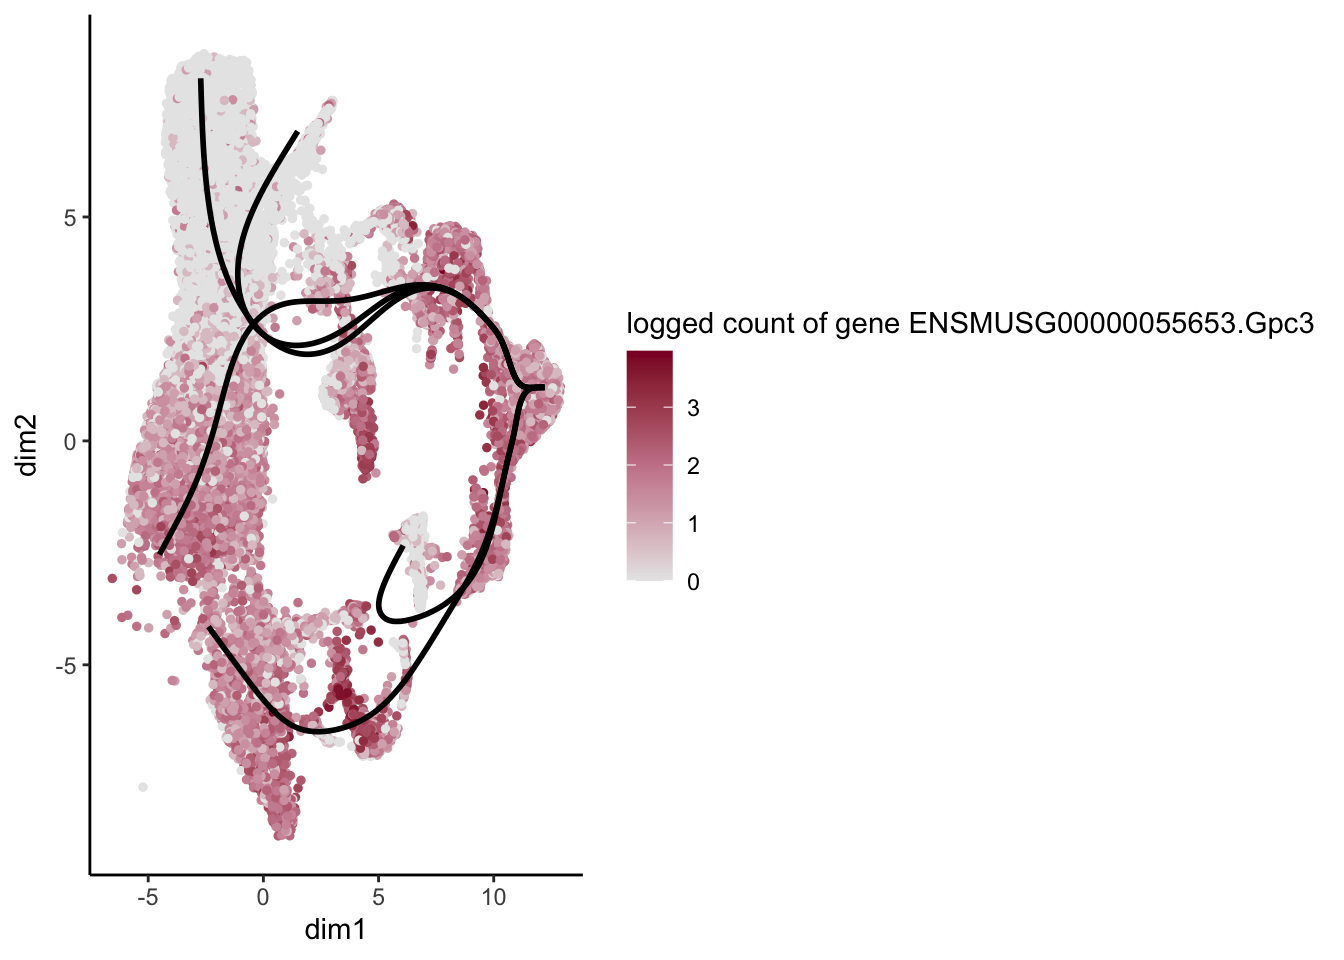
[[21]]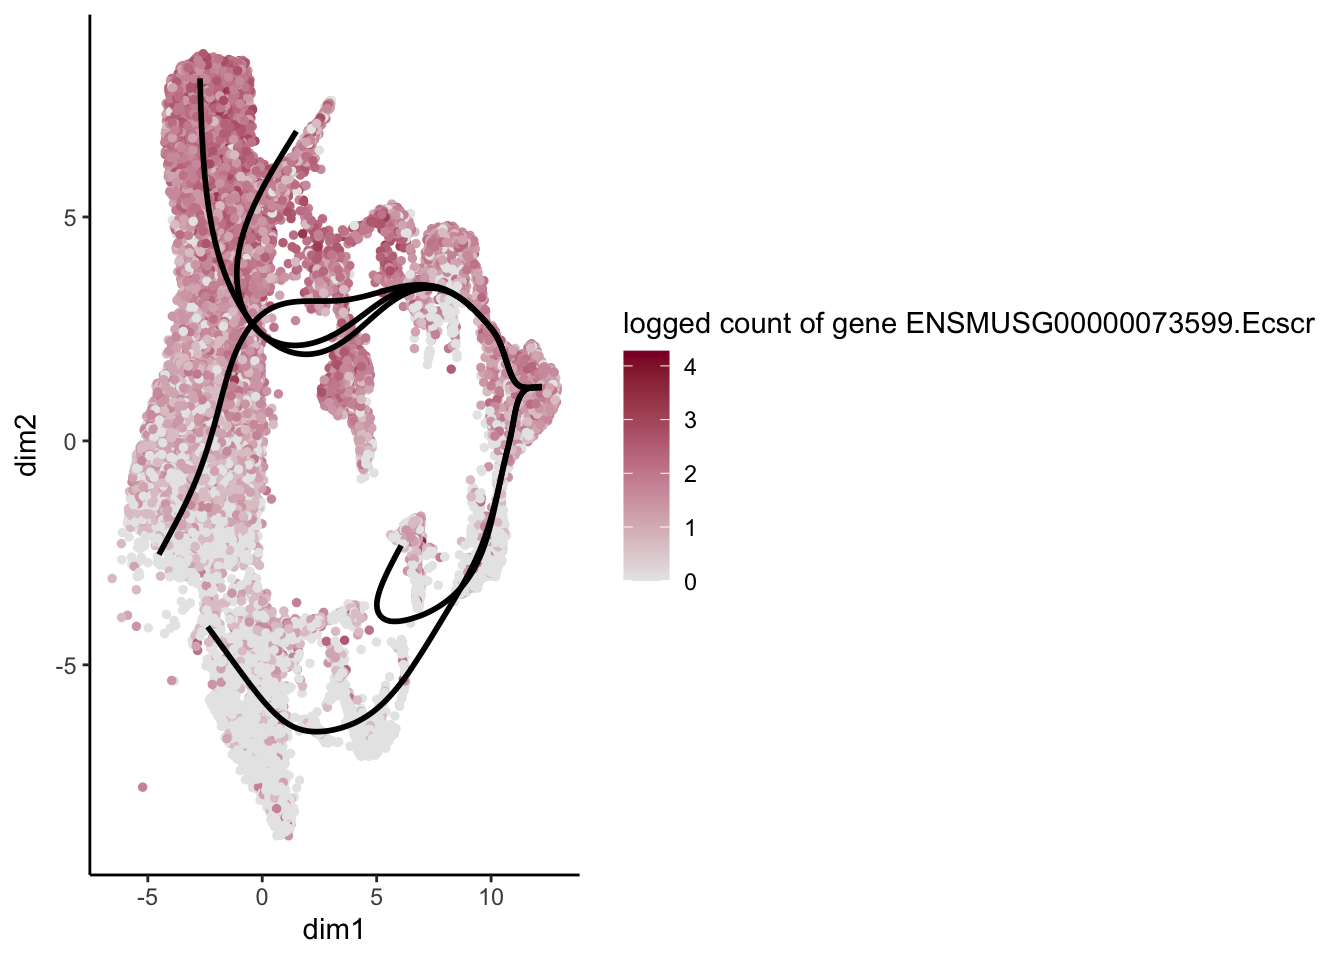
[[22]]
[[23]]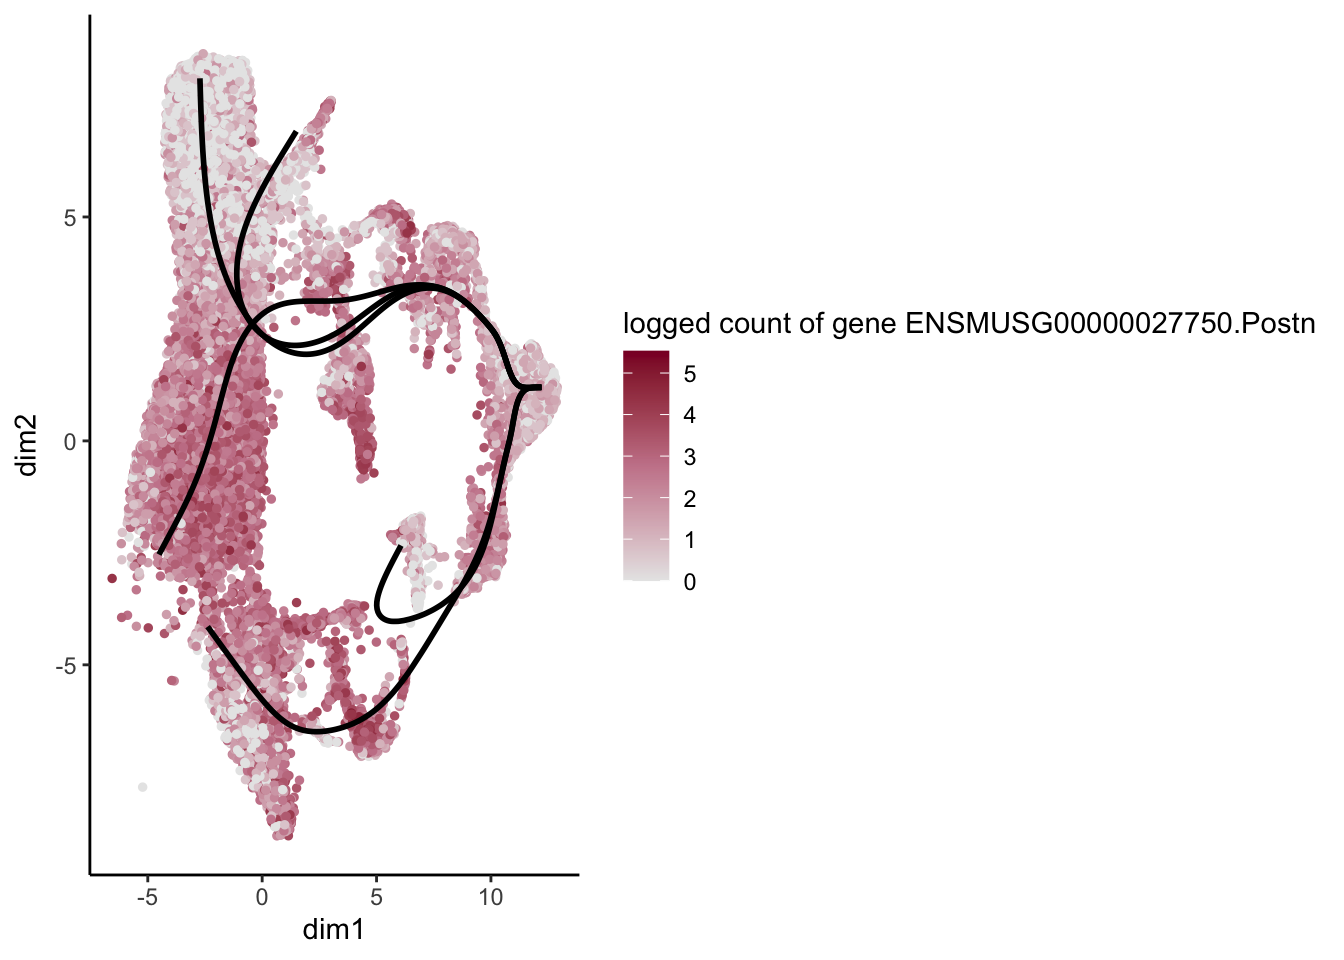
[[24]]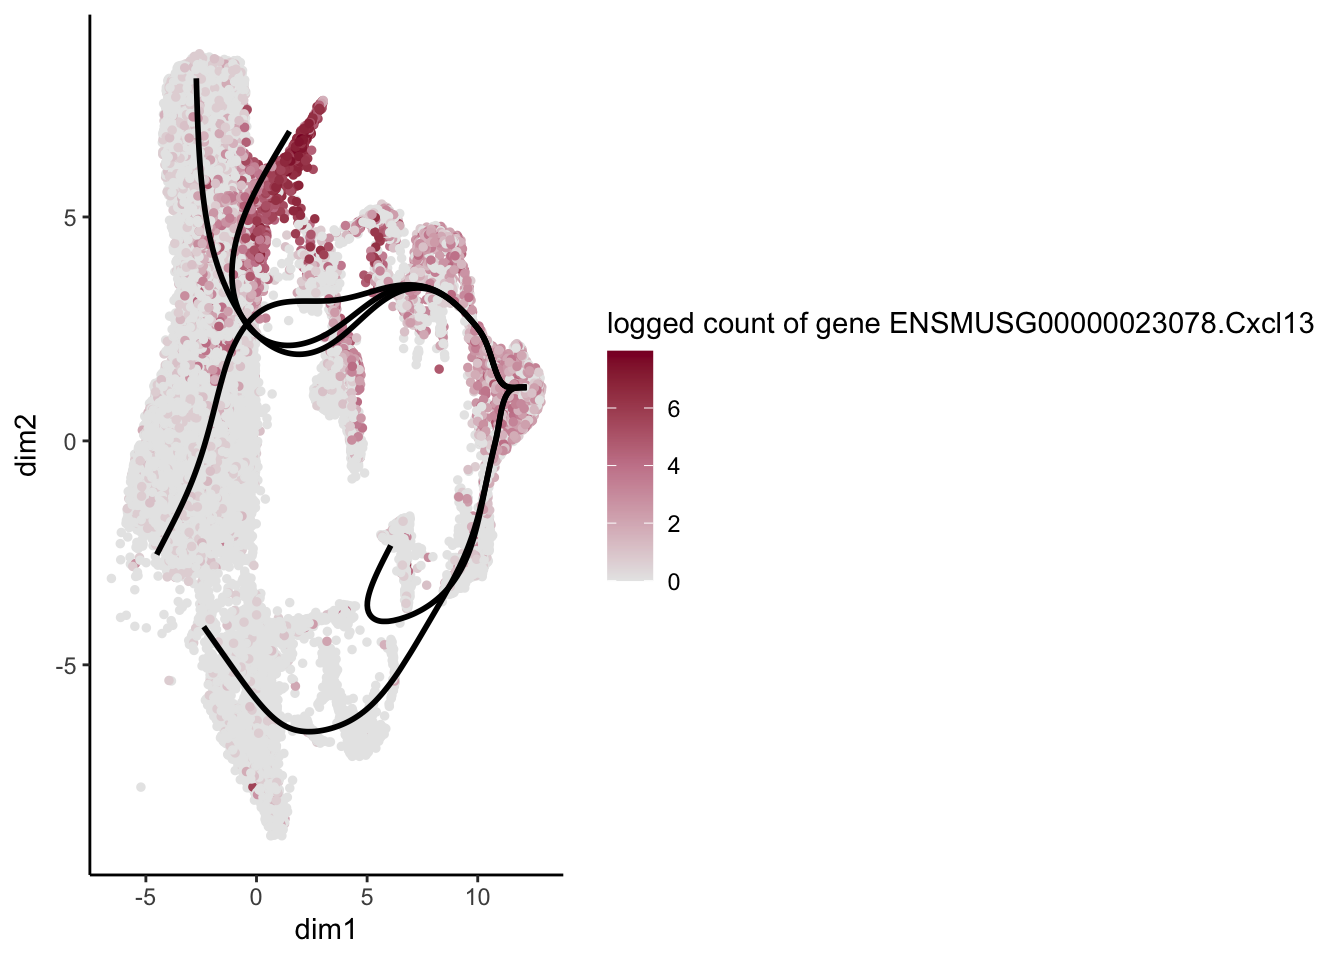
[[25]]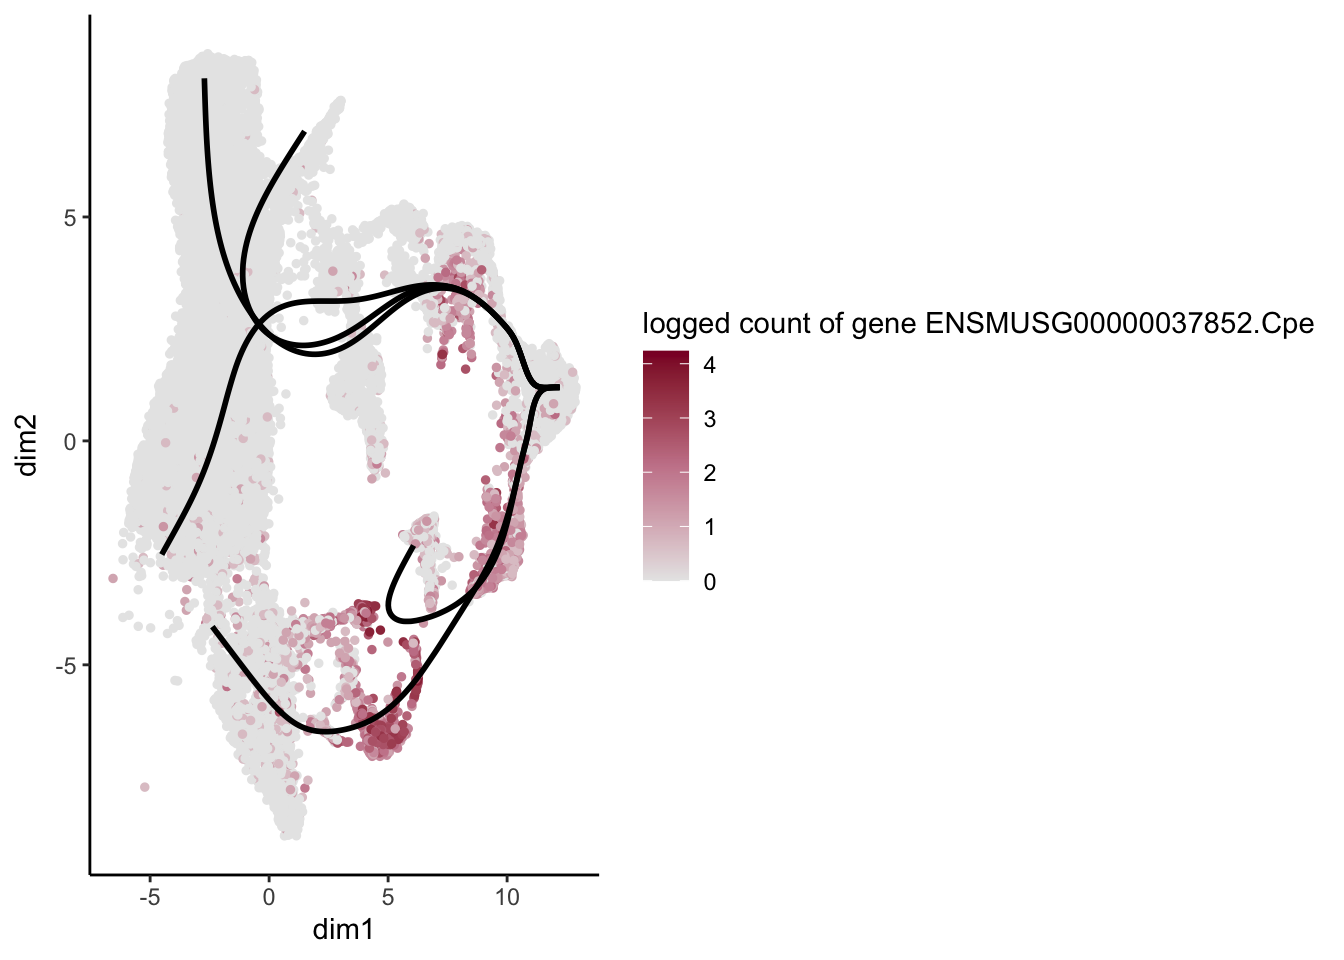
[[26]]
[[27]]
[[28]]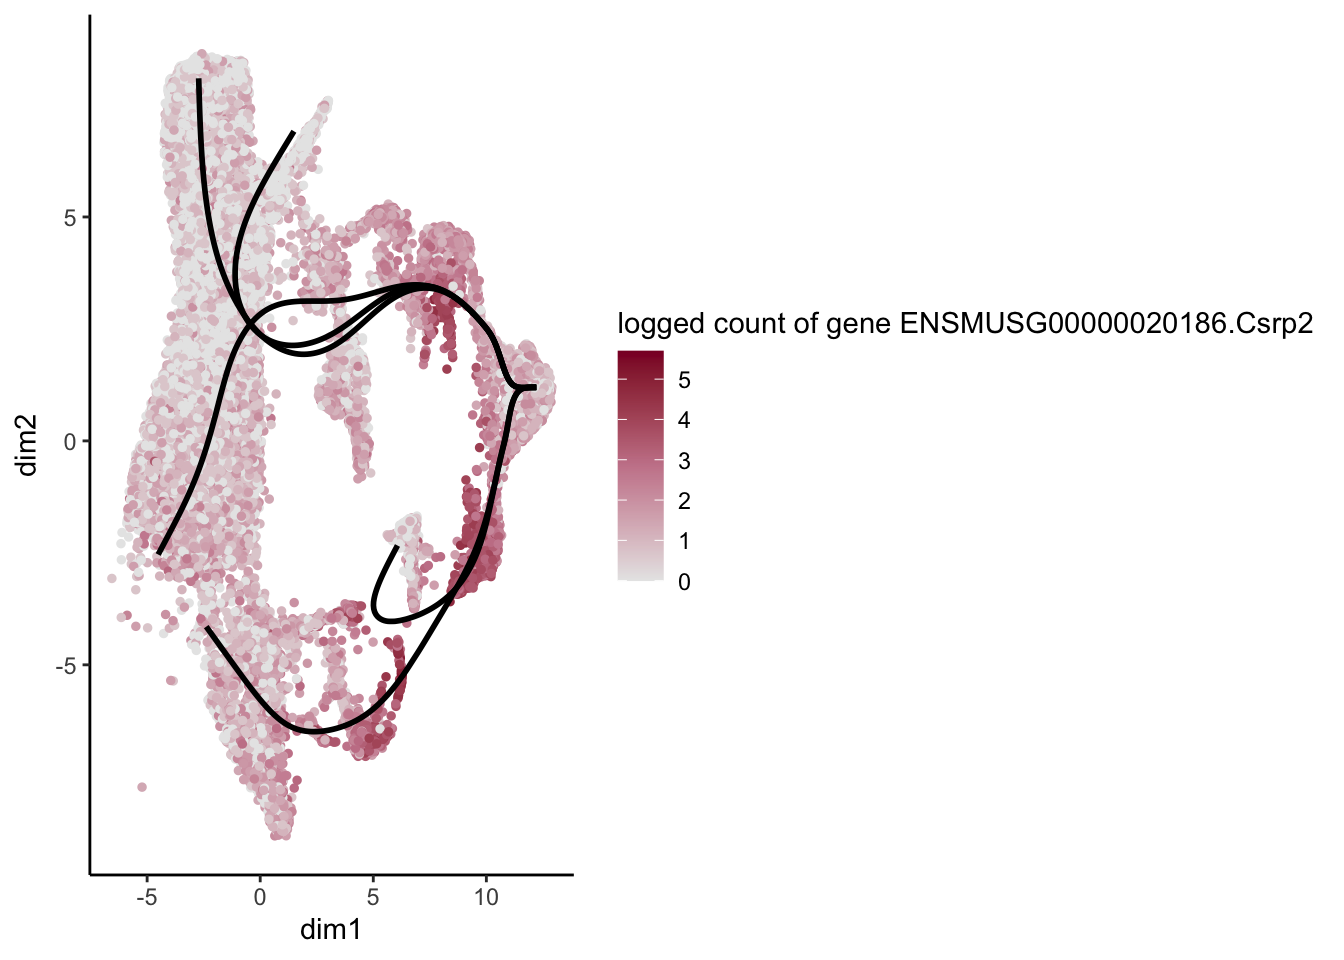
[[29]]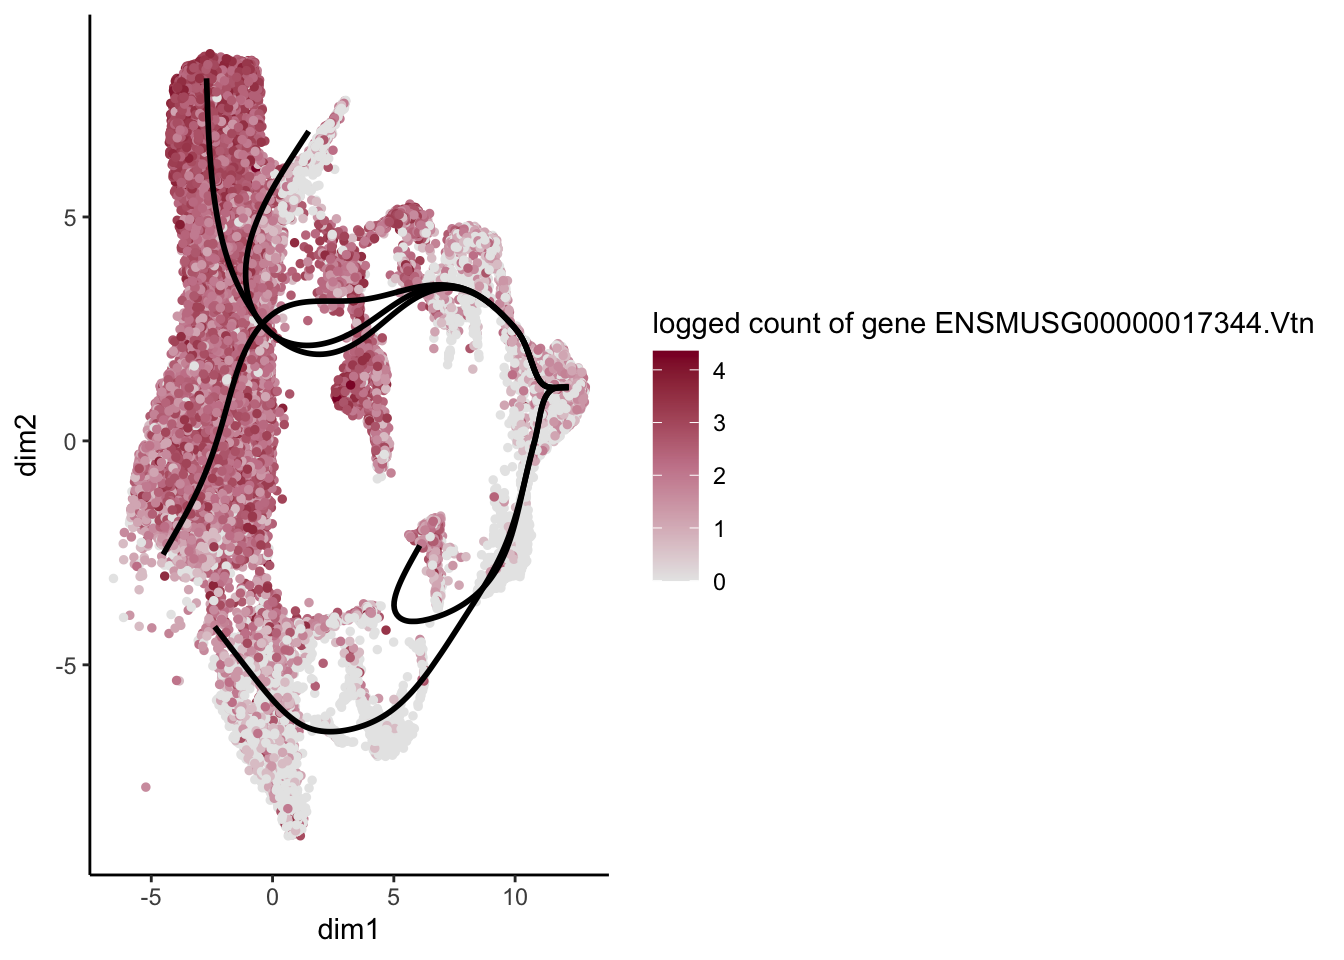
[[30]]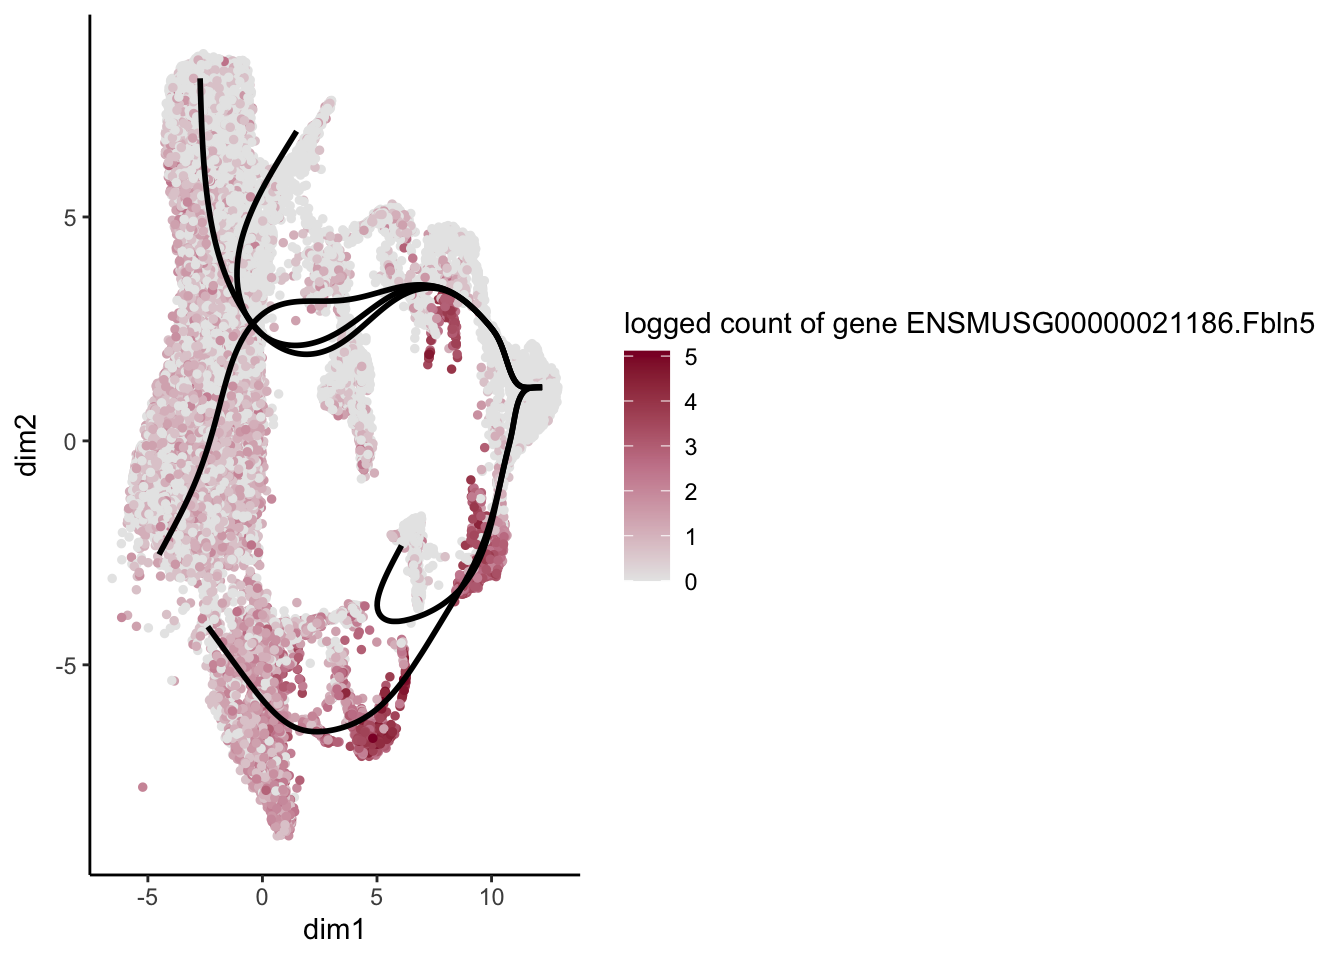
cluster genes between lineages
nPointsClus <- 50
signGenes <- patternRes %>% dplyr::filter(pvalue<0.01)
signGenes <- patternRes %>% dplyr::slice_max(., waldStat, n = 150)
clusPat <- clusterExpressionPatterns(sceGAM, nPoints = nPointsClus, ncores = 4,
                                     genes = rownames(signGenes), nReducedDims=8,
                                     consensusProportion = 0.7, minSizes = 8)
36 parameter combinations, 36 use sequential method, 36 use subsampling method
Running Clustering on Parameter Combinations...
done.clusterLabels <- primaryCluster(clusPat$rsec)
cUniq <- unique(clusterLabels)
cUniq <- cUniq[!cUniq == -1] # remove unclustered genes
for (xx in cUniq) {
cId <- which(clusterLabels == xx)
p <- ggplot(data = data.frame(x = 1:nPointsClus,
y = rep(range(clusPat$yhatScaled[cId, ]),
nPointsClus / 2)),
aes(x = x, y = y)) +
geom_point(alpha = 0) +
labs(title = paste0("Cluster ", xx), x = "Pseudotime", y = "Normalized expression") +
theme_classic() +
theme(plot.title = element_text(hjust = 0.5))
for (ii in 1:length(cId)) {
geneId <- rownames(clusPat$yhatScaled)[cId[ii]]
p <- p +
geom_line(data = data.frame(x = rep(1:nPointsClus, 5),
y = clusPat$yhatScaled[geneId, ],
lineage = rep(1:5, each = nPointsClus)),
aes(col = as.character(lineage), group = lineage), lwd = 1.5)
}
p <- p + guides(color = FALSE) +
scale_color_manual(values = colLin,
breaks = c("1", "2", "3", "4", "5"))
print(p)
}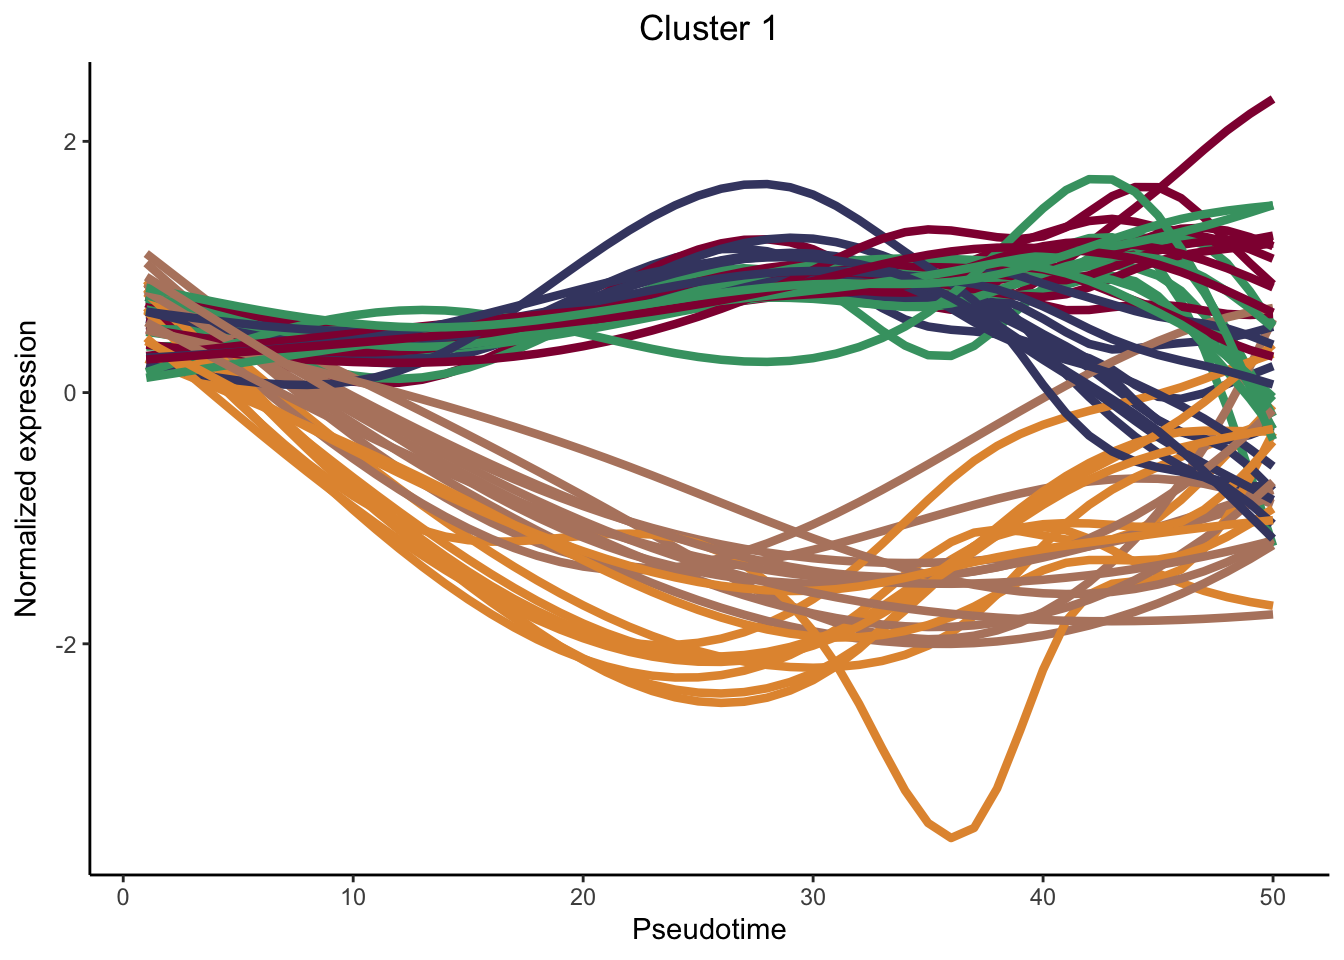
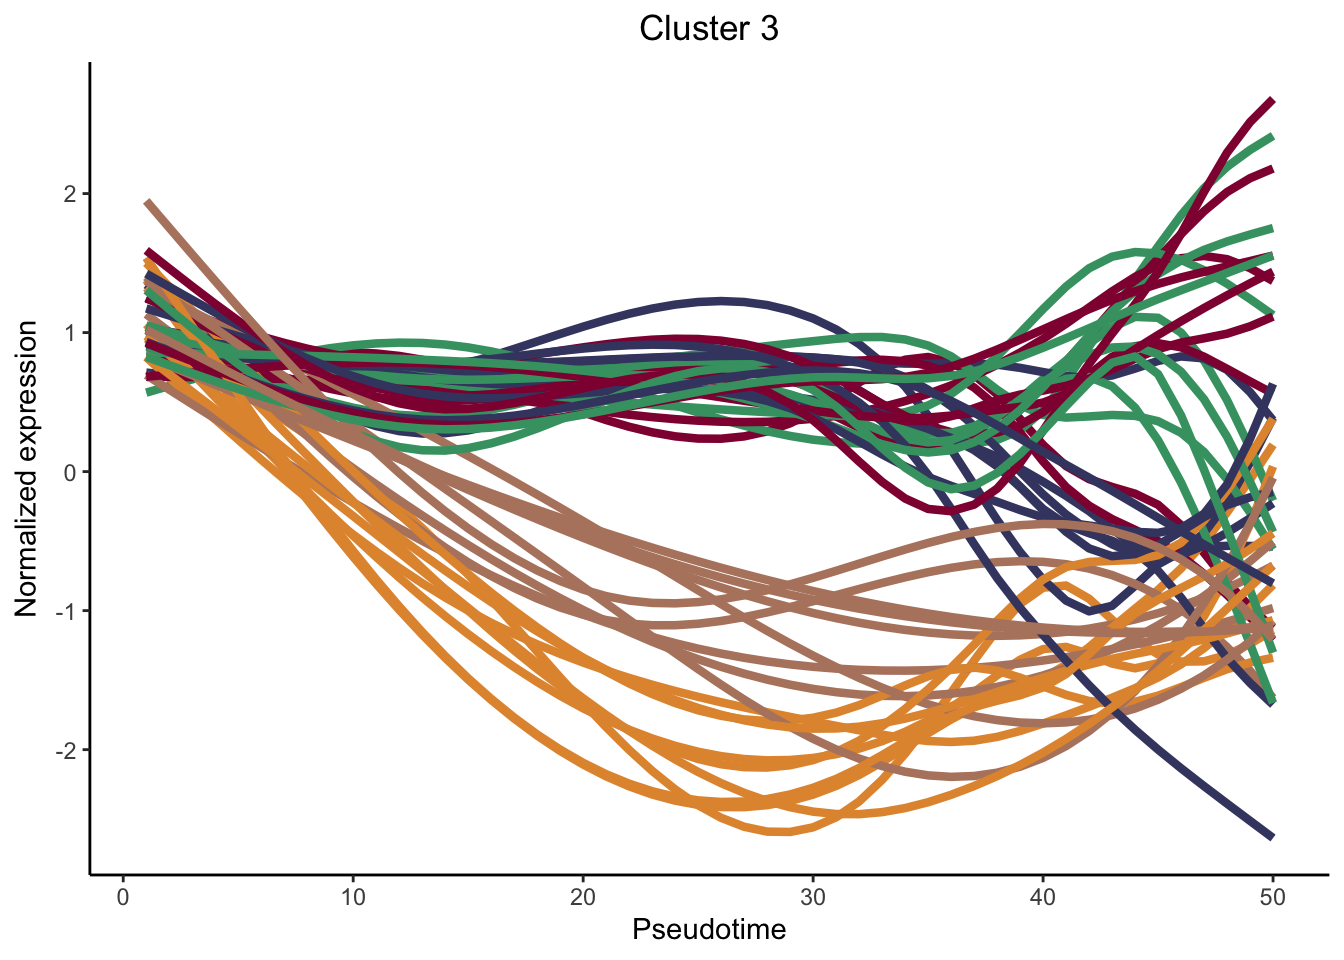
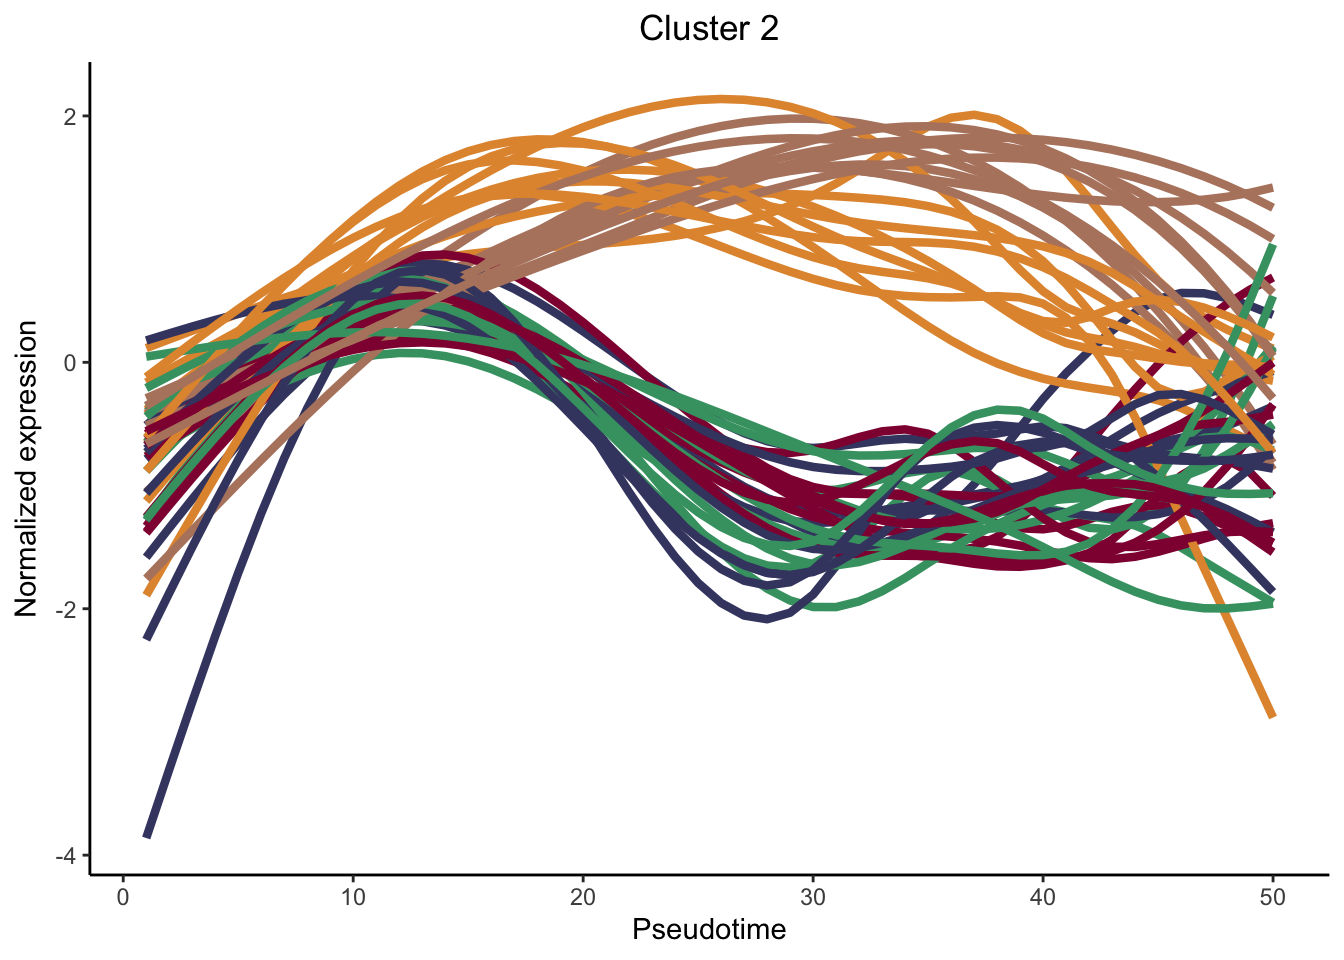
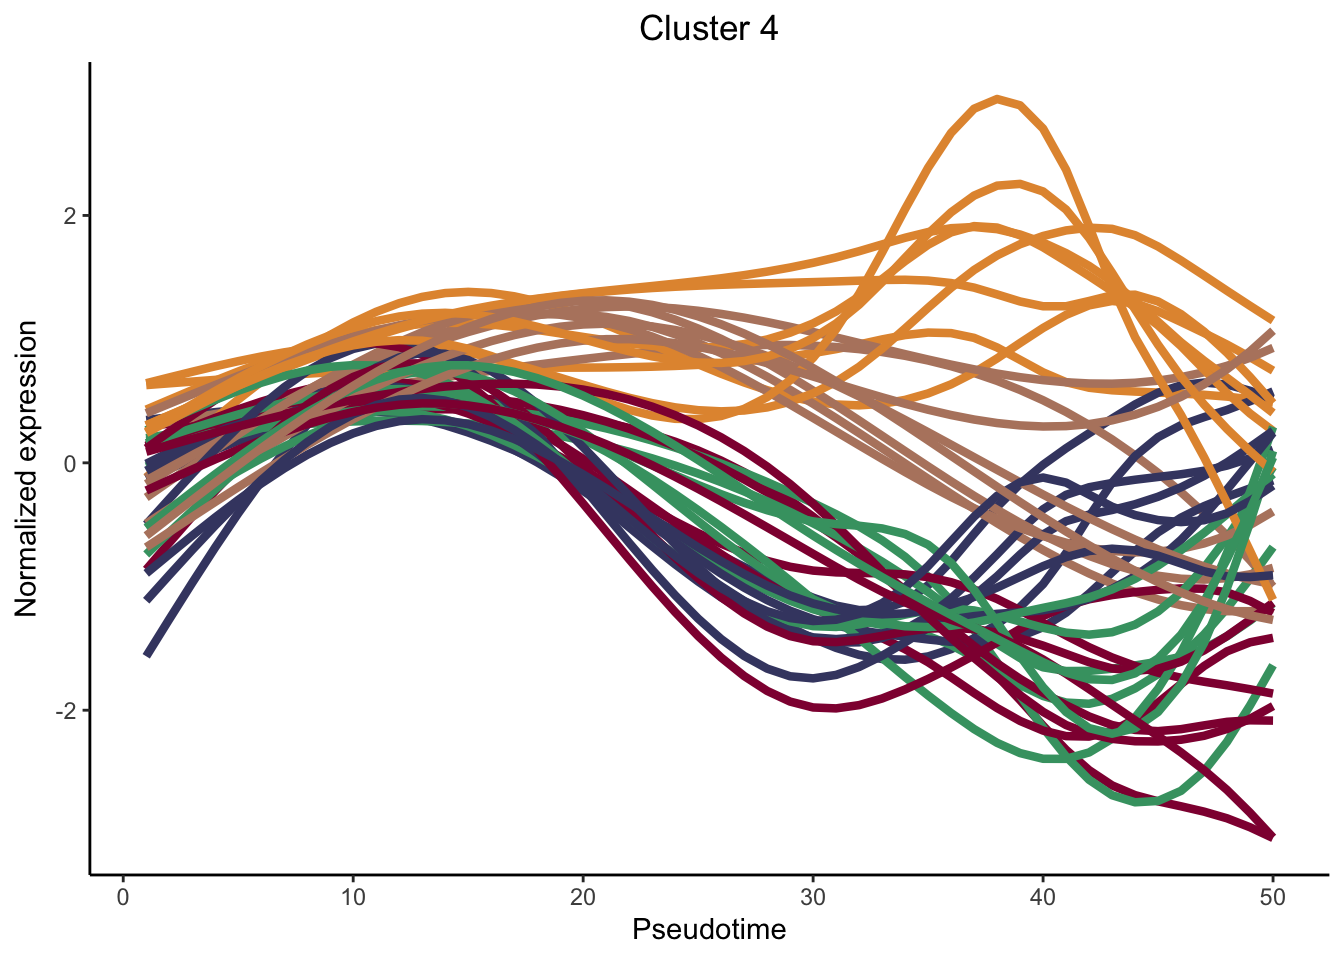
clustList <- lapply(cUniq, function(cl){
  cId <- which(clusterLabels == cl)
  genes <- rownames(clusPat$yhatScaled)[cId]
  print(cl)
  print(genes)
})
[1] 1
[1] "ENSMUSG00000071005.Ccl19" "ENSMUSG00000025491.Ifitm1"
[3] "ENSMUSG00000059898.Dsc3" "ENSMUSG00000024810.Il33"
[5] "ENSMUSG00000026208.Des" "ENSMUSG00000025930.Msc"
[7] "ENSMUSG00000073599.Ecscr" "ENSMUSG00000028072.Ntrk1"
[9] "ENSMUSG00000019139.Isyna1" "ENSMUSG00000026158.Ogfrl1"
[11] "ENSMUSG00000051379.Flrt3"
[1] 3
[1] "ENSMUSG00000023078.Cxcl13" "ENSMUSG00000118633.CT868690.1"
[3] "ENSMUSG00000022015.Tnfsf11" "ENSMUSG00000057367.Birc2"
[5] "ENSMUSG00000022577.Ly6h" "ENSMUSG00000041481.Serpina3g"
[7] "ENSMUSG00000020310.Madcam1" "ENSMUSG00000095298.Gm12407"
[9] "ENSMUSG00000097804.Gm16685"
[1] 2
[1] "ENSMUSG00000030116.Mfap5" "ENSMUSG00000020186.Csrp2"
[3] "ENSMUSG00000038400.Pmepa1" "ENSMUSG00000037852.Cpe"
[5] "ENSMUSG00000059430.Actg2" "ENSMUSG00000037362.Ccn3"
[7] "ENSMUSG00000026249.Serpine2" "ENSMUSG00000005583.Mef2c"
[9] "ENSMUSG00000031558.Slit2" "ENSMUSG00000007655.Cav1"
[1] 4
[1] "ENSMUSG00000055653.Gpc3" "ENSMUSG00000029309.Sparcl1"
[3] "ENSMUSG00000006369.Fbln1" "ENSMUSG00000016494.Cd34"
[5] "ENSMUSG00000045573.Penk" "ENSMUSG00000030208.Emp1"
[7] "ENSMUSG00000056481.Cd248" "ENSMUSG00000064080.Fbln2" names(clustList) <- cUniqsession info
sessionInfo()R version 4.3.0 (2023-04-21)
Platform: x86_64-apple-darwin20 (64-bit)
Running under: macOS Ventura 13.4.1
Matrix products: default
BLAS: /Library/Frameworks/R.framework/Versions/4.3-x86_64/Resources/lib/libRblas.0.dylib
LAPACK: /Library/Frameworks/R.framework/Versions/4.3-x86_64/Resources/lib/libRlapack.dylib; LAPACK version 3.11.0
locale:
[1] en_US.UTF-8/en_US.UTF-8/en_US.UTF-8/C/en_US.UTF-8/en_US.UTF-8
time zone: Europe/Berlin
tzcode source: internal
attached base packages:
[1] stats4 stats graphics grDevices utils datasets methods
[8] base
other attached packages:
[1] Matrix_1.6-5 ReactomePA_1.44.0
[3] enrichplot_1.20.3 DOSE_3.26.2
[5] clusterProfiler_4.8.3 biomaRt_2.56.1
[7] org.Mm.eg.db_3.17.0 ensembldb_2.24.1
[9] AnnotationFilter_1.24.0 GenomicFeatures_1.52.2
[11] AnnotationDbi_1.62.2 OmnipathR_3.8.2
[13] decoupleR_2.6.0 clusterExperiment_2.20.0
[15] slingshot_2.8.0 TrajectoryUtils_1.8.0
[17] princurve_2.1.6 tradeSeq_1.14.0
[19] viridis_0.6.5 viridisLite_0.4.2
[21] ggsci_3.0.1 scran_1.28.2
[23] scater_1.28.0 scuttle_1.10.3
[25] pheatmap_1.0.12 RColorBrewer_1.1-3
[27] SingleCellExperiment_1.22.0 SummarizedExperiment_1.30.2
[29] Biobase_2.60.0 GenomicRanges_1.52.1
[31] GenomeInfoDb_1.36.4 IRanges_2.36.0
[33] S4Vectors_0.40.1 BiocGenerics_0.48.0
[35] MatrixGenerics_1.12.3 matrixStats_1.2.0
[37] here_1.0.1 lubridate_1.9.3
[39] forcats_1.0.0 stringr_1.5.1
[41] dplyr_1.1.4 purrr_1.0.2
[43] readr_2.1.5 tidyr_1.3.1
[45] tibble_3.2.1 ggplot2_3.5.0
[47] tidyverse_2.0.0
loaded via a namespace (and not attached):
[1] fs_1.6.3 ProtGenerics_1.32.0
[3] bitops_1.0-7 HDO.db_0.99.1
[5] httr_1.4.7 doParallel_1.0.17
[7] zinbwave_1.22.0 tools_4.3.0
[9] backports_1.4.1 utf8_1.2.4
[11] R6_2.5.1 HDF5Array_1.28.1
[13] lazyeval_0.2.2 mgcv_1.9-1
[15] rhdf5filters_1.12.1 withr_3.0.0
[17] graphite_1.46.0 prettyunits_1.2.0
[19] gridExtra_2.3 cli_3.6.2
[21] scatterpie_0.2.1 labeling_0.4.3
[23] genefilter_1.82.1 pbapply_1.7-2
[25] yulab.utils_0.1.4 Rsamtools_2.16.0
[27] gson_0.1.0 limma_3.56.2
[29] readxl_1.4.3 rstudioapi_0.15.0
[31] RSQLite_2.3.5 howmany_0.3-1
[33] gridGraphics_0.5-1 generics_0.1.3
[35] BiocIO_1.10.0 GO.db_3.17.0
[37] ggbeeswarm_0.7.2 fansi_1.0.6
[39] logger_0.3.0 abind_1.4-5
[41] lifecycle_1.0.4 yaml_2.3.8
[43] edgeR_3.42.4 qvalue_2.32.0
[45] rhdf5_2.44.0 BiocFileCache_2.8.0
[47] grid_4.3.0 blob_1.2.4
[49] dqrng_0.3.2 crayon_1.5.2
[51] lattice_0.22-5 beachmat_2.16.0
[53] cowplot_1.1.3 annotate_1.78.0
[55] KEGGREST_1.40.1 pillar_1.9.0
[57] knitr_1.45 metapod_1.8.0
[59] fgsea_1.26.0 rjson_0.2.21
[61] codetools_0.2-19 fastmatch_1.1-4
[63] glue_1.7.0 ggfun_0.1.4
[65] downloader_0.4 RNeXML_2.4.11
[67] data.table_1.15.2 treeio_1.24.3
[69] vctrs_0.6.5 png_0.1-8
[71] locfdr_1.1-8 cellranger_1.1.0
[73] gtable_0.3.4 kernlab_0.9-32
[75] cachem_1.0.8 xfun_0.42
[77] S4Arrays_1.0.6 phylobase_0.8.12
[79] tidygraph_1.3.1 survival_3.5-8
[81] iterators_1.0.14 statmod_1.5.0
[83] bluster_1.10.0 nlme_3.1-164
[85] ggtree_3.8.2 bit64_4.0.5
[87] progress_1.2.3 filelock_1.0.3
[89] rprojroot_2.0.4 irlba_2.3.5.1
[91] vipor_0.4.7 colorspace_2.1-0
[93] DBI_1.2.2 ade4_1.7-22
[95] tidyselect_1.2.0 bit_4.0.5
[97] compiler_4.3.0 curl_5.2.1
[99] graph_1.78.0 rvest_1.0.4
[101] BiocNeighbors_1.18.0 xml2_1.3.6
[103] DelayedArray_0.26.7 shadowtext_0.1.3
[105] rtracklayer_1.60.1 checkmate_2.3.1
[107] scales_1.3.0 NMF_0.27
[109] rappdirs_0.3.3 digest_0.6.34
[111] rmarkdown_2.26 XVector_0.40.0
[113] htmltools_0.5.7 pkgconfig_2.0.3
[115] sparseMatrixStats_1.12.2 dbplyr_2.4.0
[117] fastmap_1.1.1 rlang_1.1.3
[119] htmlwidgets_1.6.4 DelayedMatrixStats_1.22.6
[121] farver_2.1.1 jsonlite_1.8.8
[123] BiocParallel_1.34.2 GOSemSim_2.26.1
[125] BiocSingular_1.16.0 RCurl_1.98-1.14
[127] magrittr_2.0.3 ggplotify_0.1.2
[129] GenomeInfoDbData_1.2.10 patchwork_1.2.0
[131] Rhdf5lib_1.22.1 munsell_0.5.0
[133] Rcpp_1.0.12 ape_5.7-1
[135] stringi_1.8.3 ggraph_2.2.0
[137] zlibbioc_1.46.0 MASS_7.3-60.0.1
[139] plyr_1.8.9 parallel_4.3.0
[141] ggrepel_0.9.5 rncl_0.8.7
[143] graphlayouts_1.1.0 Biostrings_2.68.1
[145] splines_4.3.0 hms_1.1.3
[147] locfit_1.5-9.9 igraph_2.0.2
[149] uuid_1.2-0 rngtools_1.5.2
[151] softImpute_1.4-1 reshape2_1.4.4
[153] ScaledMatrix_1.8.1 XML_3.99-0.16.1
[155] evaluate_0.23 tweenr_2.0.3
[157] tzdb_0.4.0 foreach_1.5.2
[159] polyclip_1.10-6 ggforce_0.4.2
[161] gridBase_0.4-7 rsvd_1.0.5
[163] xtable_1.8-4 reactome.db_1.84.0
[165] restfulr_0.0.15 tidytree_0.4.6
[167] later_1.3.2 aplot_0.2.2
[169] memoise_2.0.1 beeswarm_0.4.0
[171] registry_0.5-1 GenomicAlignments_1.36.0
[173] cluster_2.1.6 timechange_0.3.0 date()[1] "Wed Apr 24 09:31:30 2024"