suppressPackageStartupMessages({
  library(tidyverse)
  library(Seurat)
  library(magrittr)
  library(dplyr)
  library(purrr)
  library(ggplot2)
  library(here)
  library(runSeurat3)
  library(SingleCellExperiment)
  library(RColorBrewer)
  library(pheatmap)
  library(scater)
  library(scran)
  library(ggsci)
  library(viridis)
  library(tradeSeq)
  library(slingshot)
  library(clusterExperiment)
})run TradeSeq mLN
load packages
set dir and load sample
basedir <- here()
sce <- readRDS(paste0(basedir, "/data/slingshot/WT_allTime_mLNonly",
                         "_EYFPonly_labelTrans_slingshot_sce.rds"))

colCond <- c("#446a7f", "#cb7457")
names(colCond) <- c("LTbR", "WT")

colAge <- c("#440154FF", "#3B528BFF", "#21908CFF", "#5DC863FF", "#FDE725FF")
names(colAge) <- c("E18" , "P7", "3w", "8w","E17to7wk")

colPal <- c("#DAF7A6", "#FFC300", "#FF5733", "#C70039", "#900C3F", "#b66e8d",
            "#61a4ba", "#6178ba", "#54a87f",  "#25328a",
            "#b6856e", "#0073C2FF", "#EFC000FF", "#868686FF", "#CD534CFF",
            "#7AA6DCFF", "#003C67FF", "#8F7700FF", "#3B3B3BFF", "#A73030FF",
            "#4A6990FF")[1:length(unique(sce$RNA_snn_res.0.4))]
names(colPal) <- unique(sce$RNA_snn_res.0.4)

colLab <- c("#42a071", "#900C3F","#b66e8d", "#61a4ba", "#424671", "#003C67FF",
            "#e3953d", "#714542", "#b6856e", "#a4a4a4")

names(colLab) <- c("FDC/MRC", "TRC", "TBRC", "MedRC/IFRC", "MedRC" , "actMedRC",
                   "PRC", "Pi16+RC", "VSMC", "unassigned")
Slingshot
clustDat <- data.frame(clustCol=colPal) %>% rownames_to_column(., "cluster")
ageDat <- data.frame(ageCol=colAge) %>% rownames_to_column(., "age")
colDat <- data.frame(cluster=sce$RNA_snn_res.0.4) %>%
  mutate(age=sce$age2) %>% left_join(., clustDat, by="cluster") %>%
  left_join(., ageDat, by="age")

plot(reducedDims(sce)$UMAP, col = colDat$clustCol, pch=16, asp = 1)
lines(SlingshotDataSet(sce), lwd=2, type = 'lineages', col = 'black')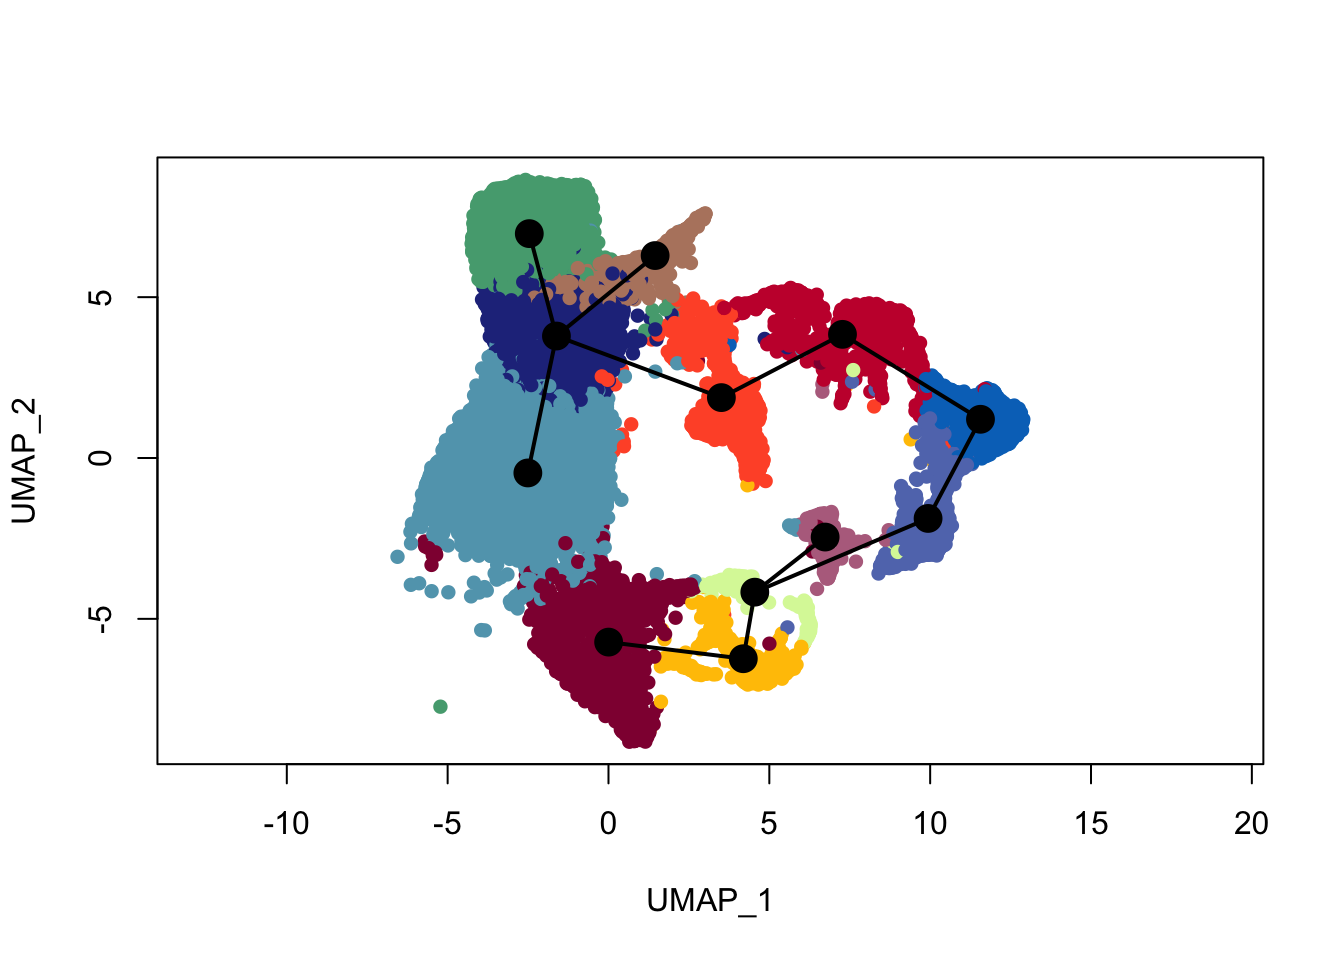
plot(reducedDims(sce)$UMAP, col = colDat$ageCol, pch=16, asp = 1)
lines(SlingshotDataSet(sce), lwd=2, type = 'lineages', col = 'black')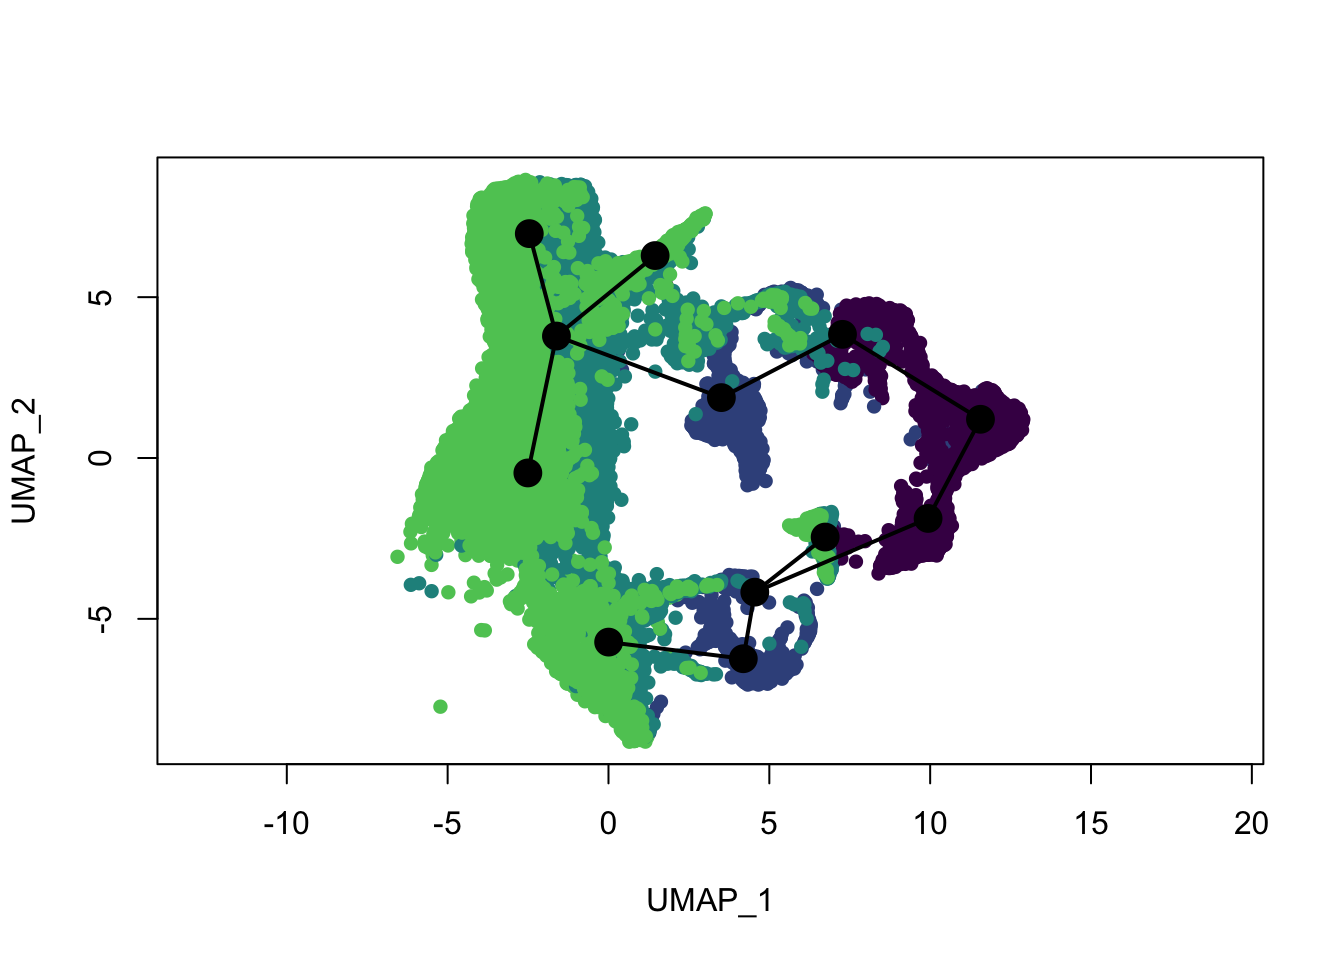
plot(reducedDims(sce)$UMAP, col = colDat$clustCol, pch=16, asp = 1)
lines(SlingshotDataSet(sce), lwd=2, col='black')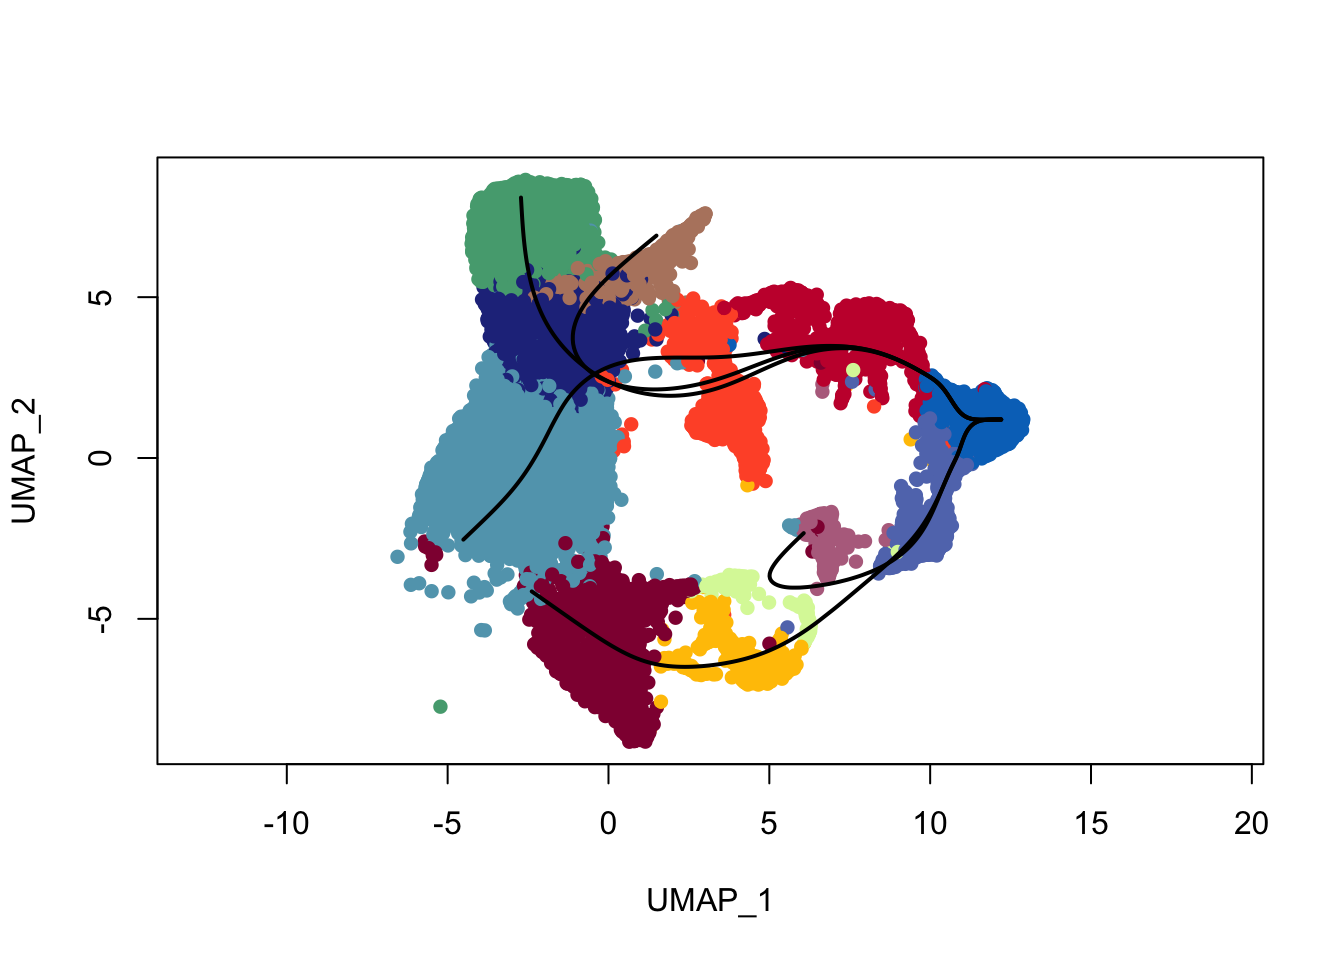
plot(reducedDims(sce)$UMAP, col = colDat$ageCol, pch=16, asp = 1)
lines(SlingshotDataSet(sce), lwd=2, col='black')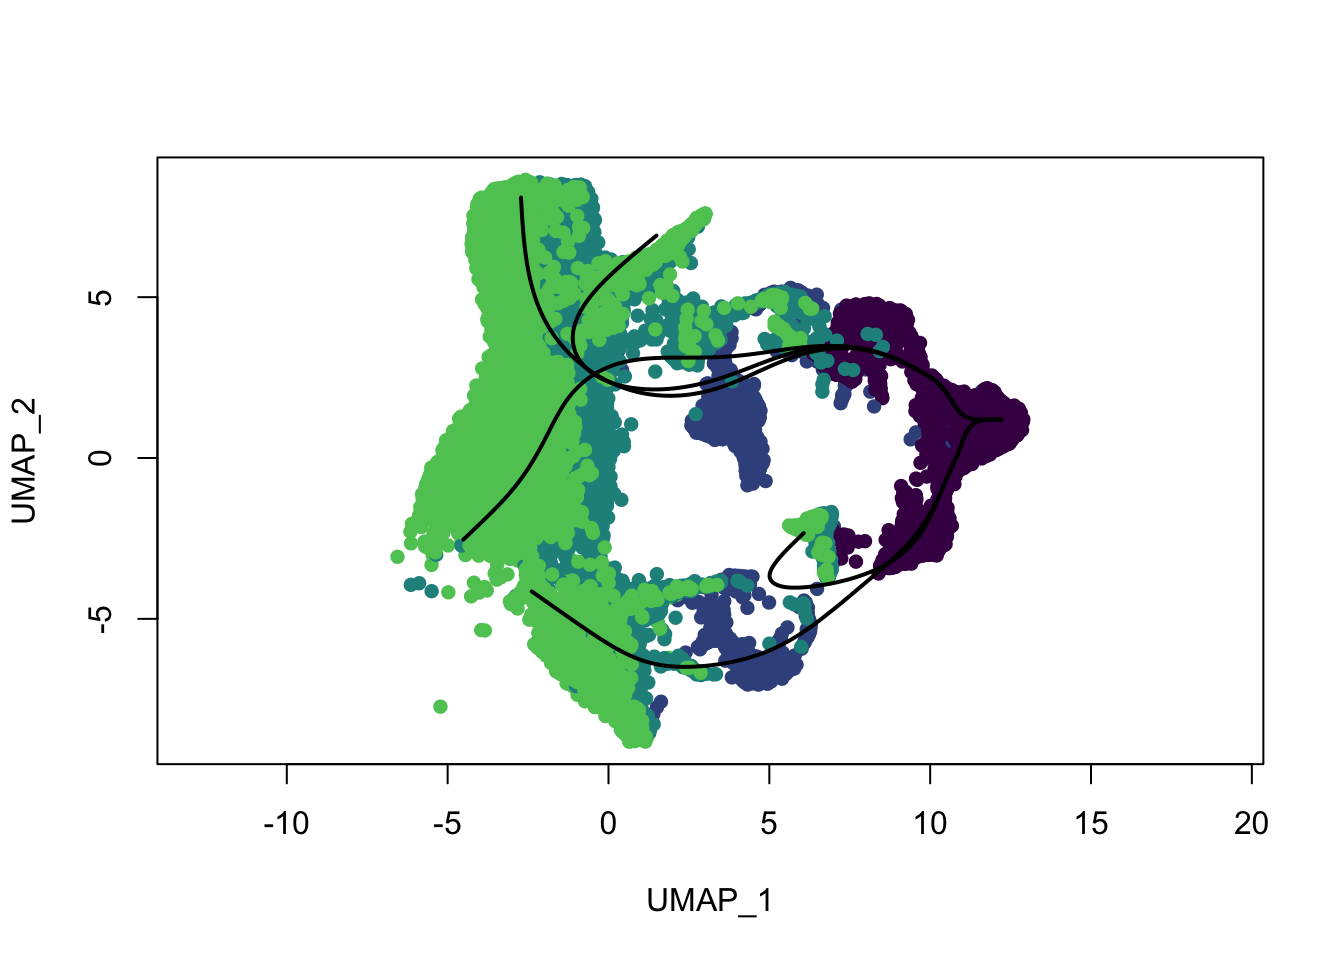
summary(sce$slingPseudotime_1) Min. 1st Qu. Median Mean 3rd Qu. Max. NA's
0.000 2.220 10.899 9.125 15.290 18.731 12697 summary(sce$slingPseudotime_2) Min. 1st Qu. Median Mean 3rd Qu. Max. NA's
0.000 8.936 14.650 12.693 17.334 20.158 7157 summary(sce$slingPseudotime_3) Min. 1st Qu. Median Mean 3rd Qu. Max. NA's
0.00 7.06 14.60 12.33 17.75 20.00 8721 summary(sce$slingPseudotime_4) Min. 1st Qu. Median Mean 3rd Qu. Max. NA's
0.00 5.64 10.41 10.40 15.33 19.30 10463 summary(sce$slingPseudotime_5) Min. 1st Qu. Median Mean 3rd Qu. Max. NA's
0.000 0.710 2.592 3.946 5.923 11.778 14661 colors <- colorRampPalette(rev(brewer.pal(11,'Spectral')))(100)
plotcol <- colors[cut(slingAvgPseudotime(SlingshotDataSet(sce)), breaks=100)]
plot(reducedDims(sce)$UMAP, col = plotcol, pch=16, asp = 1)
lines(SlingshotDataSet(sce), lwd=2, col='black')
colors <- colorRampPalette(brewer.pal(11,'Spectral')[-6])(100)
plotcol <- colors[cut(slingAvgPseudotime(SlingshotDataSet(sce)), breaks=100)]

plot(reducedDims(sce)$UMAP, col = plotcol, pch=16, asp = 1)
lines(SlingshotDataSet(sce), lwd=2, col='black')
colors <- colorRampPalette(brewer.pal(11,'YlOrRd'))(100)
plotcol <- colors[cut(slingAvgPseudotime(SlingshotDataSet(sce)), breaks=100)]

plot(reducedDims(sce)$UMAP, col = plotcol, pch=16, asp = 1)
lines(SlingshotDataSet(sce), lwd=2, col='black')
colors <- colorRampPalette(brewer.pal(11,'YlGnBu'))(100)
plotcol <- colors[cut(slingAvgPseudotime(SlingshotDataSet(sce)), breaks=100)]

plot(reducedDims(sce)$UMAP, col = plotcol, pch=16, asp = 1)
lines(SlingshotDataSet(sce), lwd=2, col='black')
colors <- colorRampPalette(brewer.pal(11,'PuOr')[-6])(100)
plotcol <- colors[cut(slingAvgPseudotime(SlingshotDataSet(sce)), breaks=100)]

plot(reducedDims(sce)$UMAP, col = plotcol, pch=16, asp = 1)
lines(SlingshotDataSet(sce), lwd=2, col='black')
### color lineages
colLin <- c("#e3953d", "#424671","#900C3F", "#42a071", "#b6856e")
names(colLin) <- c("1", "2", "3", "4", "5")

plot(reducedDims(sce)$UMAP, col = "#bfbcbd", pch=16, asp = 1)
lines(SlingshotDataSet(sce), lwd=4, col=colLin)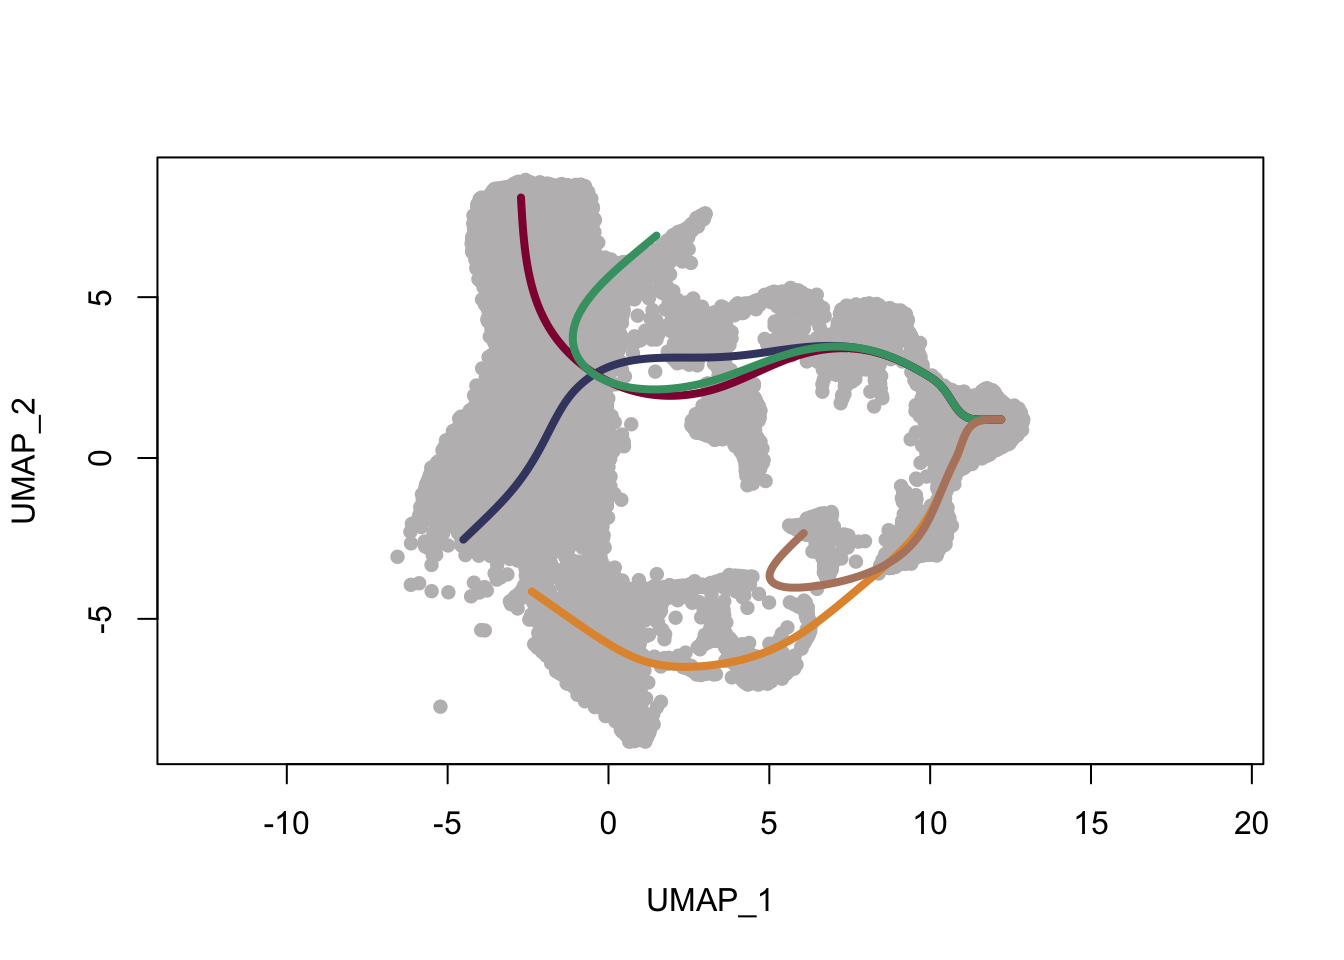
tradeSeq
evaluate k
icMat <- evaluateK(counts = counts(sce), sds = SlingshotDataSet(sce), k = 3:10,
                   nGenes = 200, verbose = T)
subsample sce
## subsample sce
dim(sce)
[1] 31899 16877cellSub <- data.frame(cell=colnames(sce)) %>% sample_n(5000)
sceSub <- sce[,cellSub$cell]
dim(sceSub)[1] 31899 5000colDat <- data.frame(cluster=sceSub$RNA_snn_res.0.4) %>%
mutate(age=sceSub$age2) %>% left_join(., clustDat, by="cluster") %>%
left_join(., ageDat, by="age")
plot(reducedDims(sceSub)$UMAP, col = colDat$clustCol, pch=16, asp = 1)
lines(SlingshotDataSet(sceSub), lwd=2, col='black')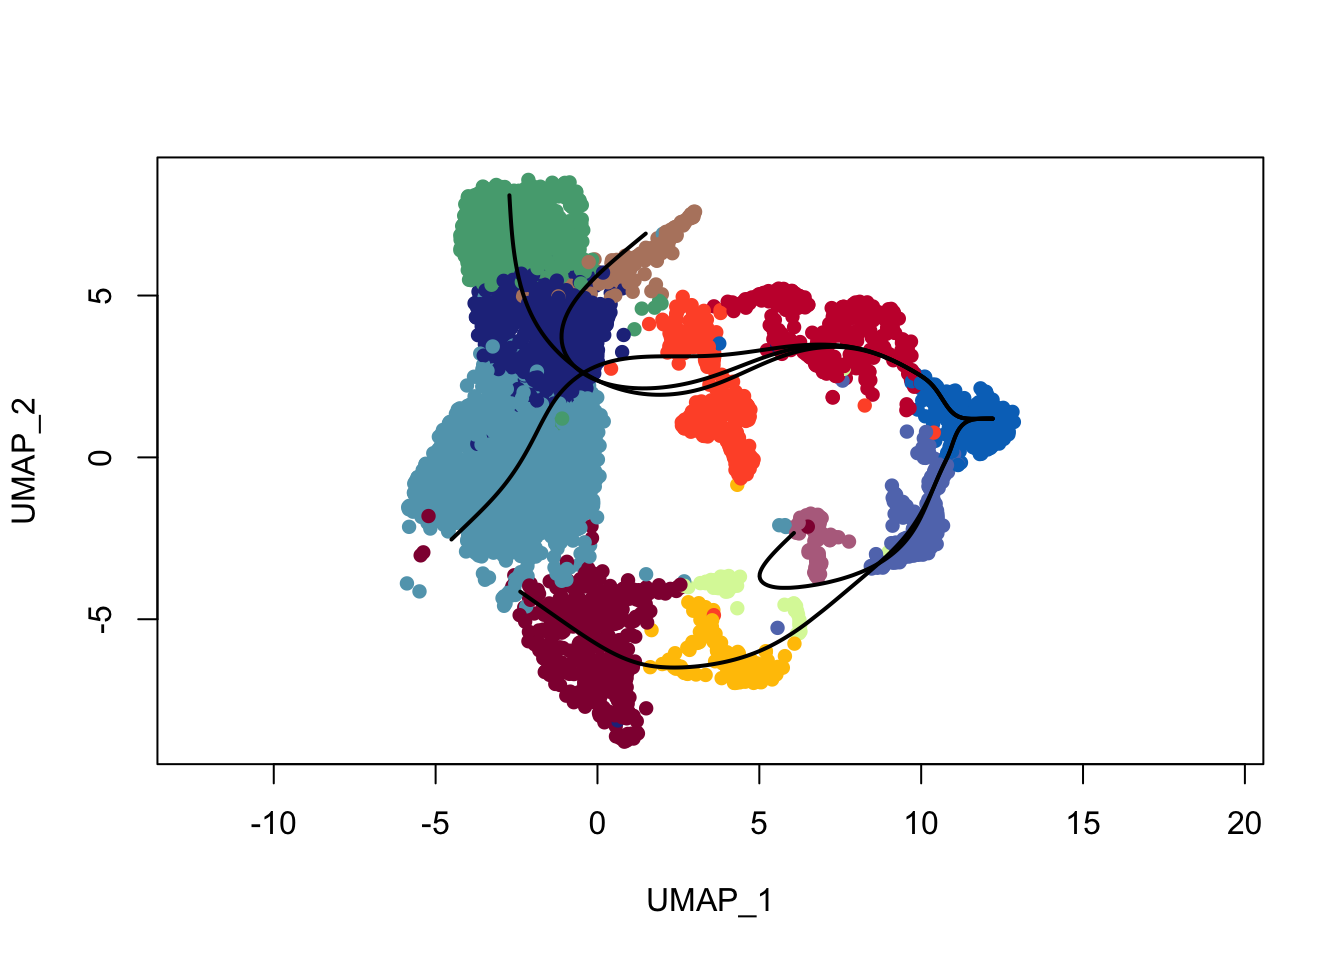
plot(reducedDims(sceSub)$UMAP, col = colDat$ageCol, pch=16, asp = 1)
lines(SlingshotDataSet(sceSub), lwd=2, col='black')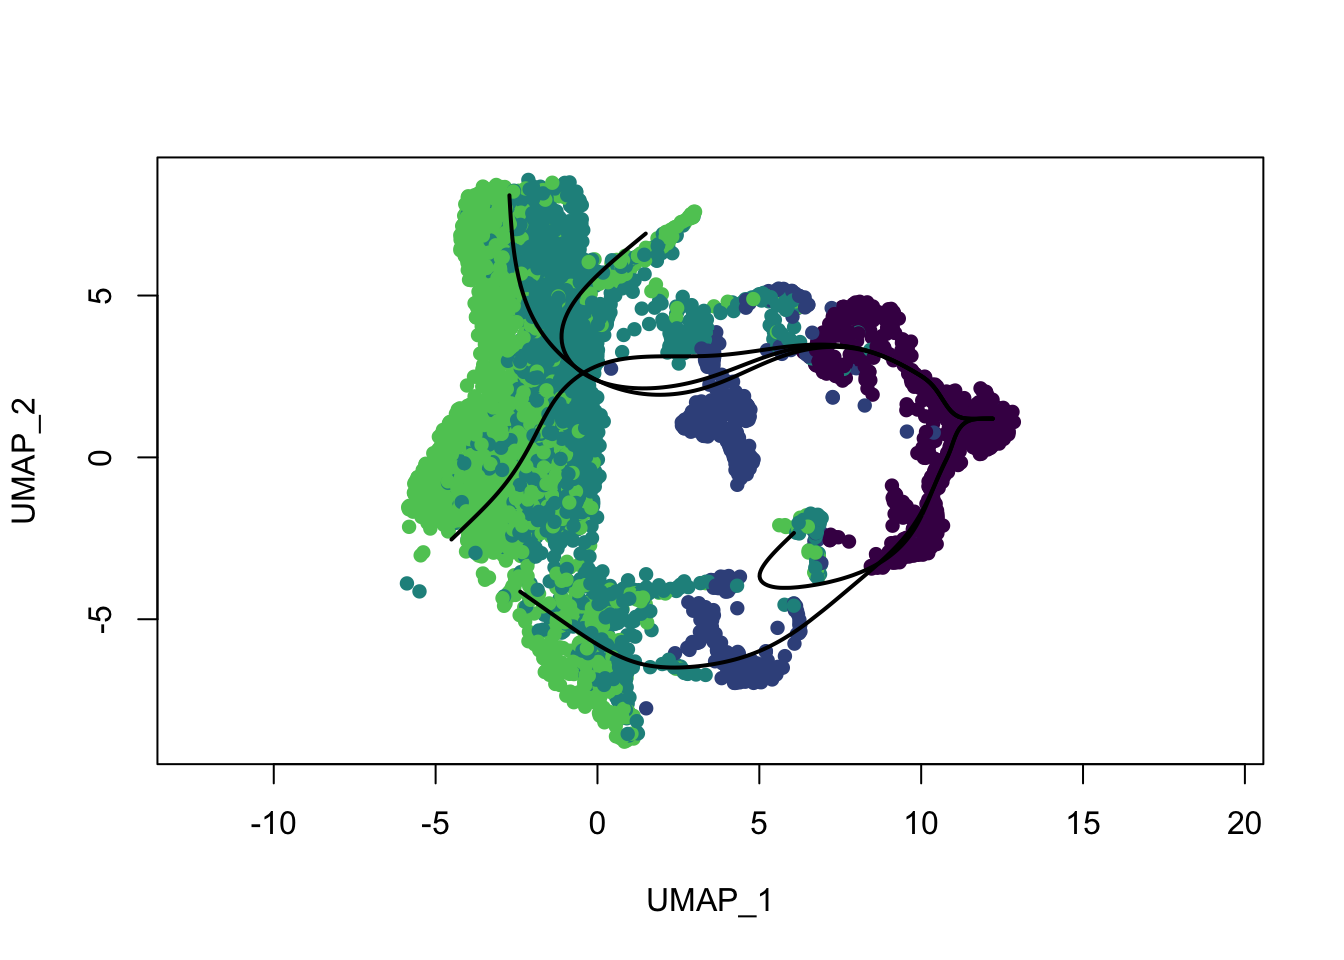
fitGAM
## only hvg
dec.sceSub <- modelGeneVar(sceSub)
topHVG <- getTopHVGs(dec.sceSub, n=2000)


pseudotime <- slingPseudotime(SlingshotDataSet(sce), na = FALSE)
pseudotimeSub <- pseudotime[cellSub$cell,]
cellWeights <- slingCurveWeights(SlingshotDataSet(sce))
cellWeightsSub <- cellWeights[cellSub$cell,]


## run on server
# sceGAM <- fitGAM(counts = counts(sceSub), pseudotime = pseudotimeSub,
#                  cellWeights = cellWeightsSub,
#                  nknots = 10, verbose = T, parallel=T, genes=topHVG)

saveRDS(sceSub, paste0(basedir, "/data/slingshot/tradeSEQ/WT_allTime_mLNonly",
                         "_EYFPonly_labelTrans_slingshot_TSsub5000_sce.rds"))
saveRDS(pseudotimeSub, paste0(basedir, "/data/slingshot/tradeSEQ/WT_allTime_mLNonly",
                         "_EYFPonly_labelTrans_slingshot_TSsub5000_pseudotime.rds"))
saveRDS(cellWeightsSub, paste0(basedir, "/data/slingshot/tradeSEQ/WT_allTime_mLNonly",
                         "_EYFPonly_labelTrans_slingshot_TSsub5000_cellweights.rds"))
saveRDS(topHVG, paste0(basedir, "/data/slingshot/tradeSEQ/WT_allTime_mLNonly",
                         "_EYFPonly_labelTrans_slingshot_TSsub5000_topHVG.rds"))
load GAM
sceGAM <- readRDS(paste0(basedir, "/data/slingshot/tradeSEQ/WT_allTime_mLNonly",
                         "_EYFPonly_labelTrans_slingshot_TSsub5000_sceGAM.rds"))
table(rowData(sceGAM)$tradeSeq$converged)
TRUE
2000
Between lineage comparison
patternRes <- patternTest(sceGAM, l2fc = log2(2))
oPat <- order(patternRes$waldStat, decreasing = TRUE)
head(rownames(patternRes)[oPat])
[1] "ENSMUSG00000022037.Clu" "ENSMUSG00000030605.Mfge8"
[3] "ENSMUSG00000094686.Ccl21a" "ENSMUSG00000026879.Gsn"
[5] "ENSMUSG00000071005.Ccl19" "ENSMUSG00000025491.Ifitm1"rankGene <- rownames(patternRes)[oPat]
lapply(rankGene[1:50], function(selGene){
plotSmoothers(sceGAM, counts(sceGAM), gene = selGene, curvesCols=colLin) +
ggtitle(selGene) +
scale_color_manual(values=colLin)
})[[1]]
[[2]]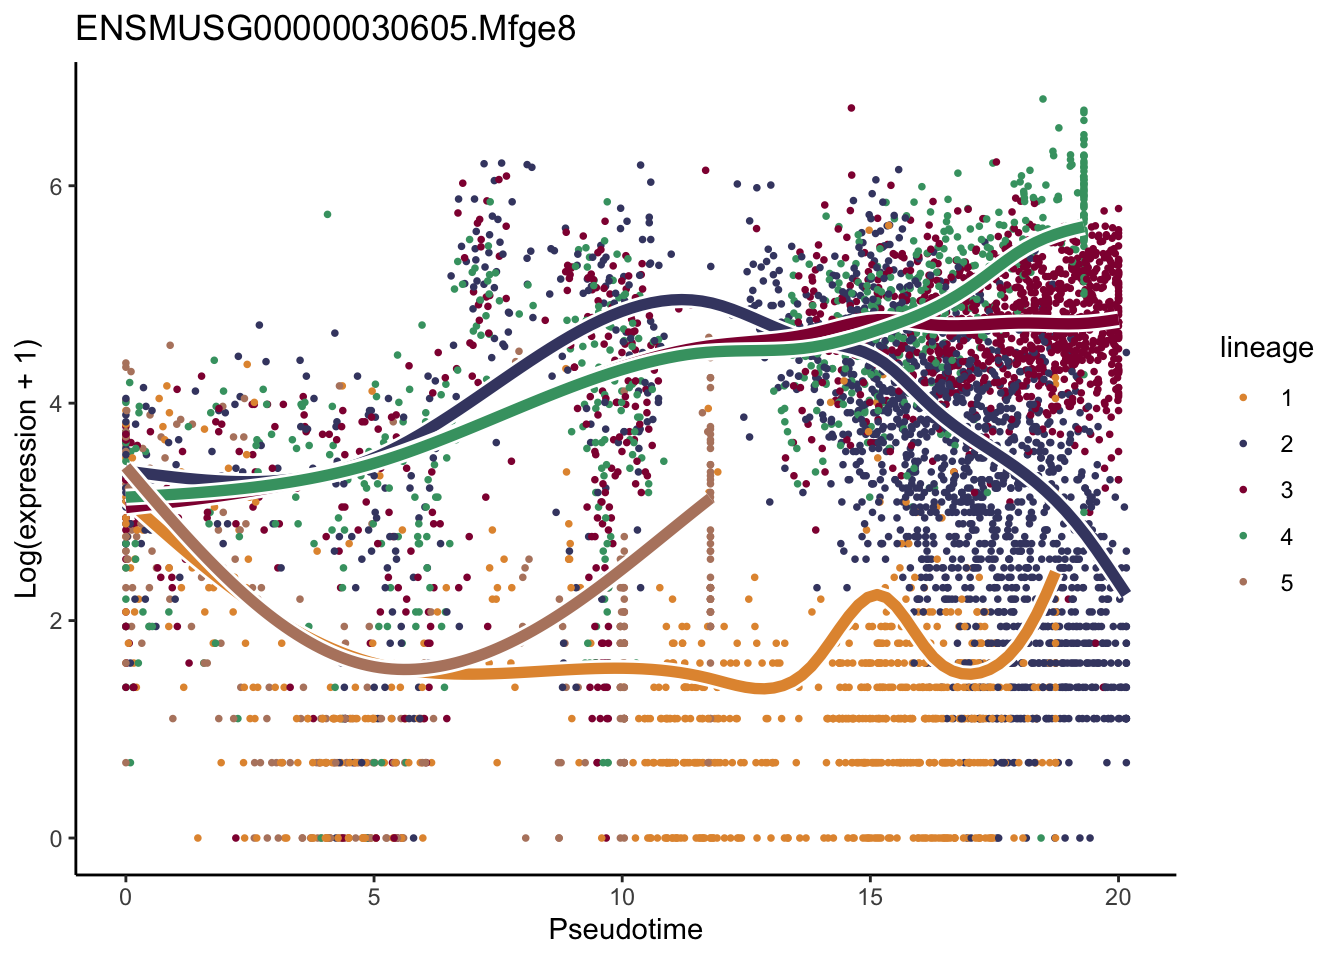
[[3]]
[[4]]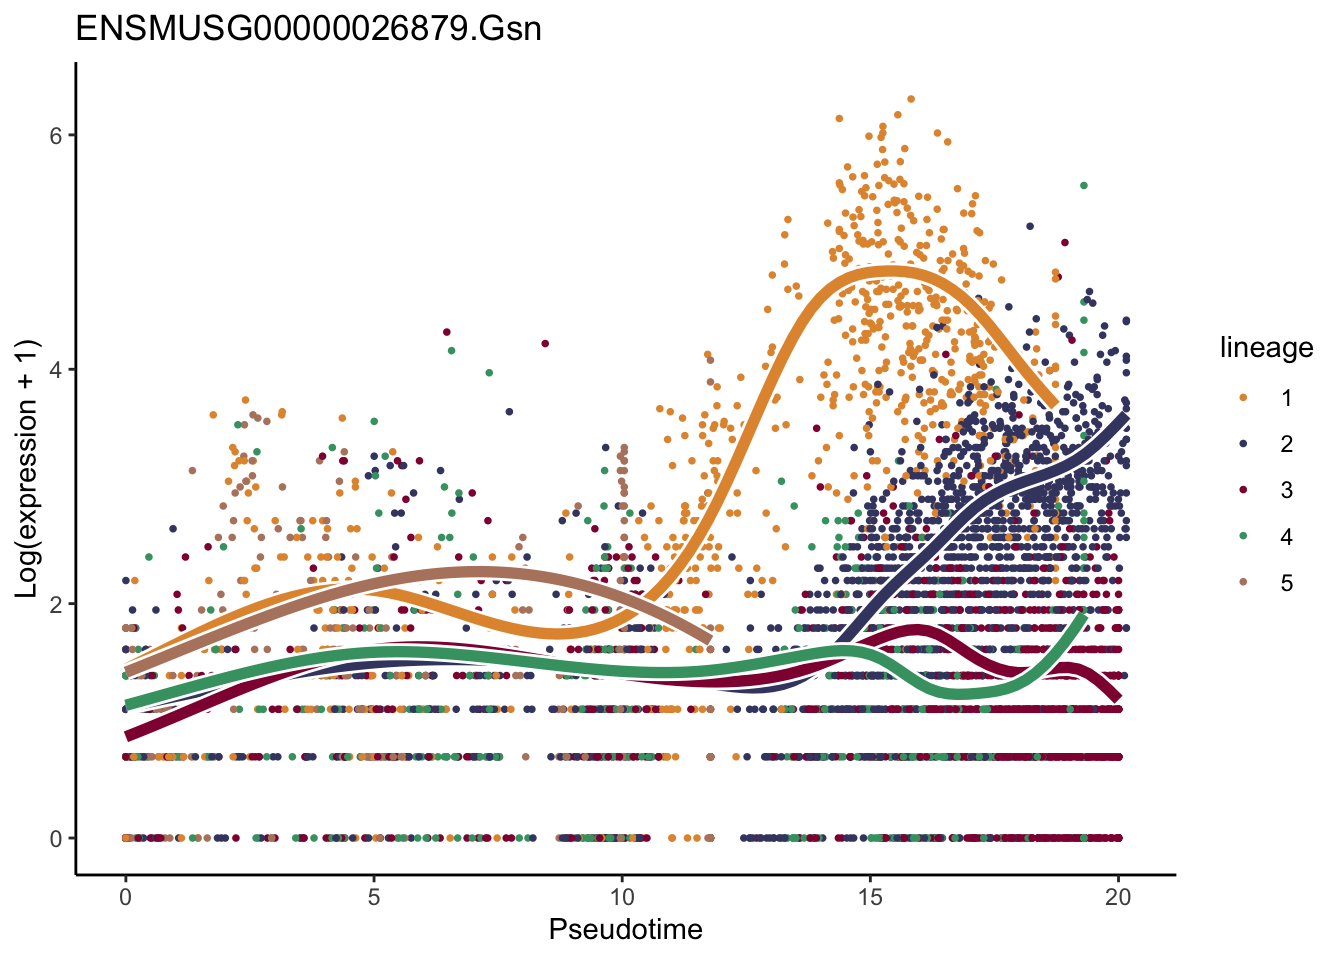
[[5]]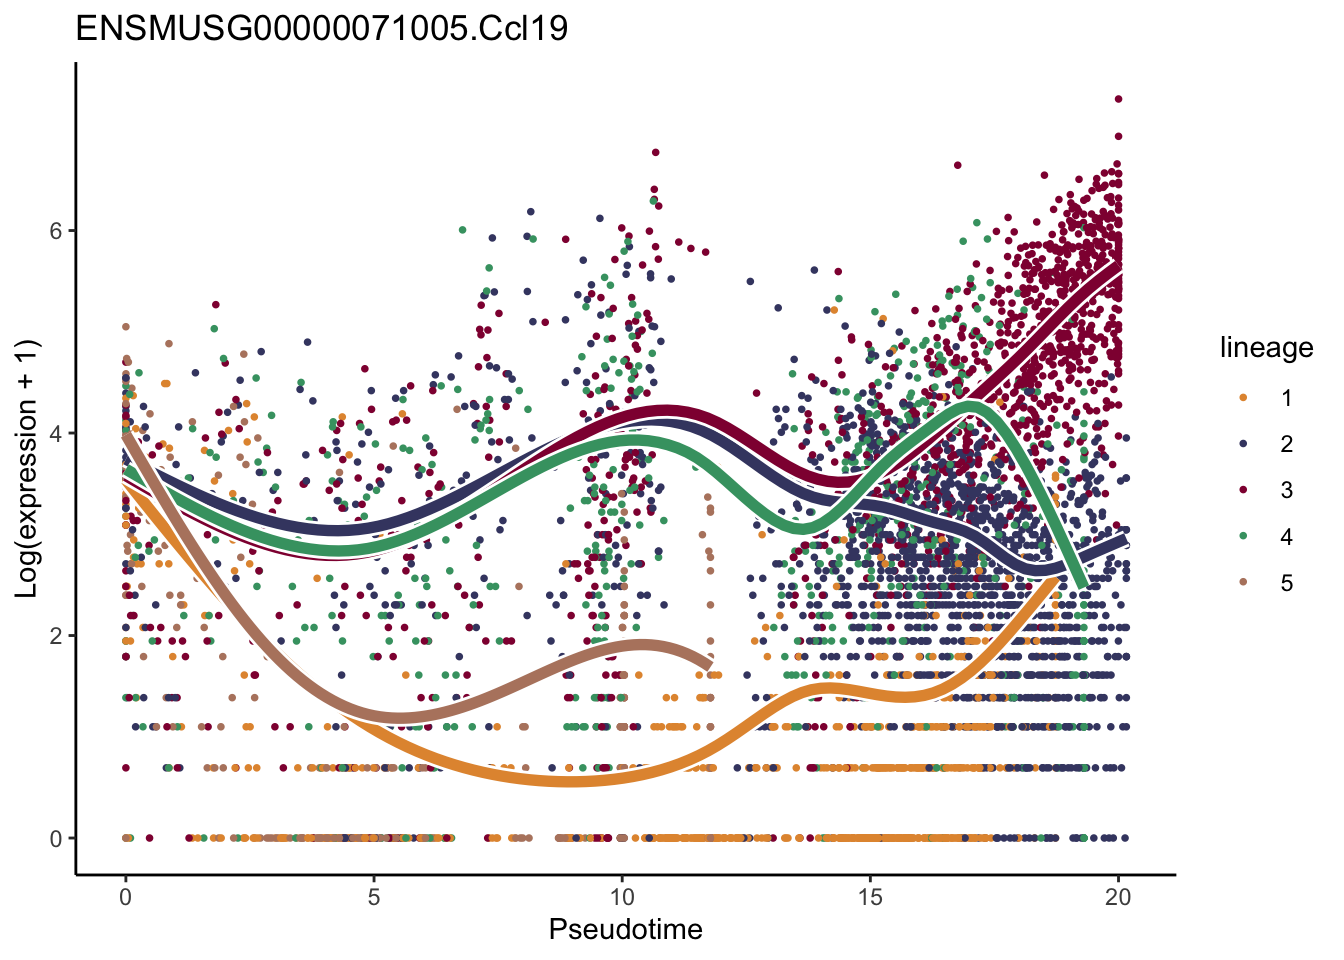
[[6]]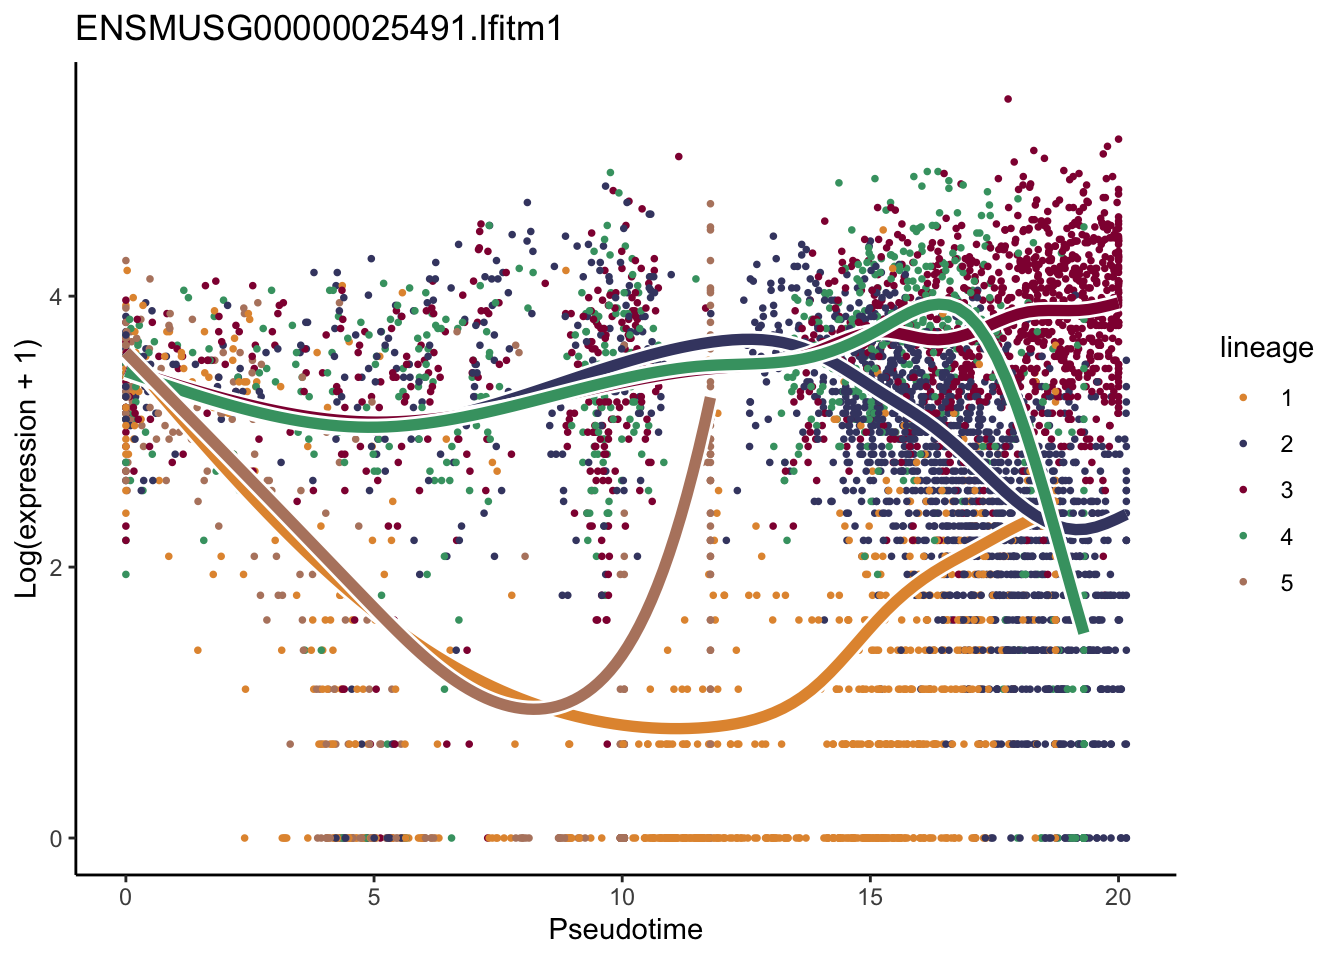
[[7]]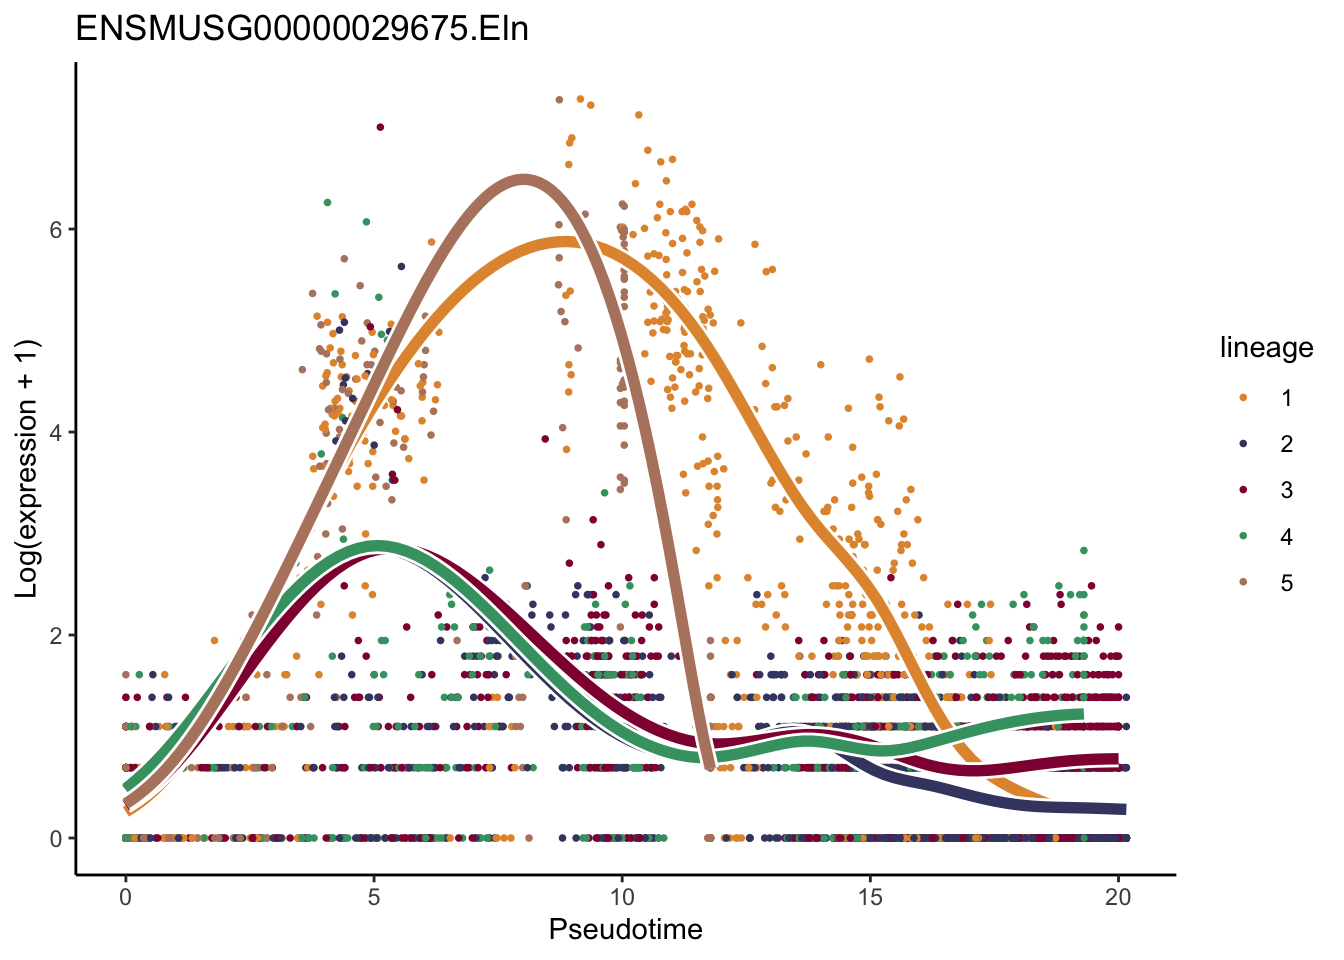
[[8]]
[[9]]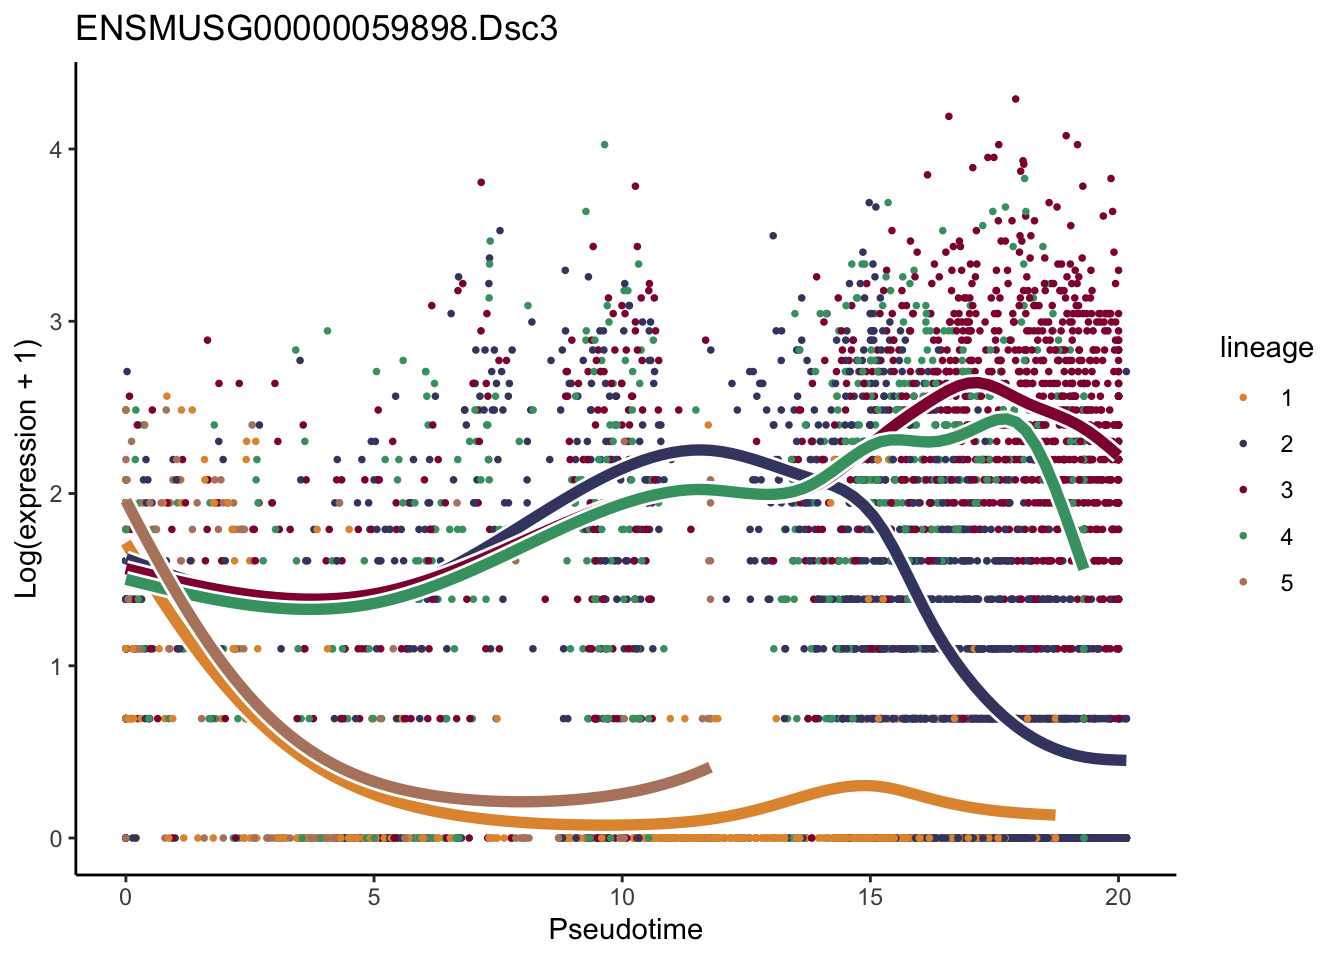
[[10]]
[[11]]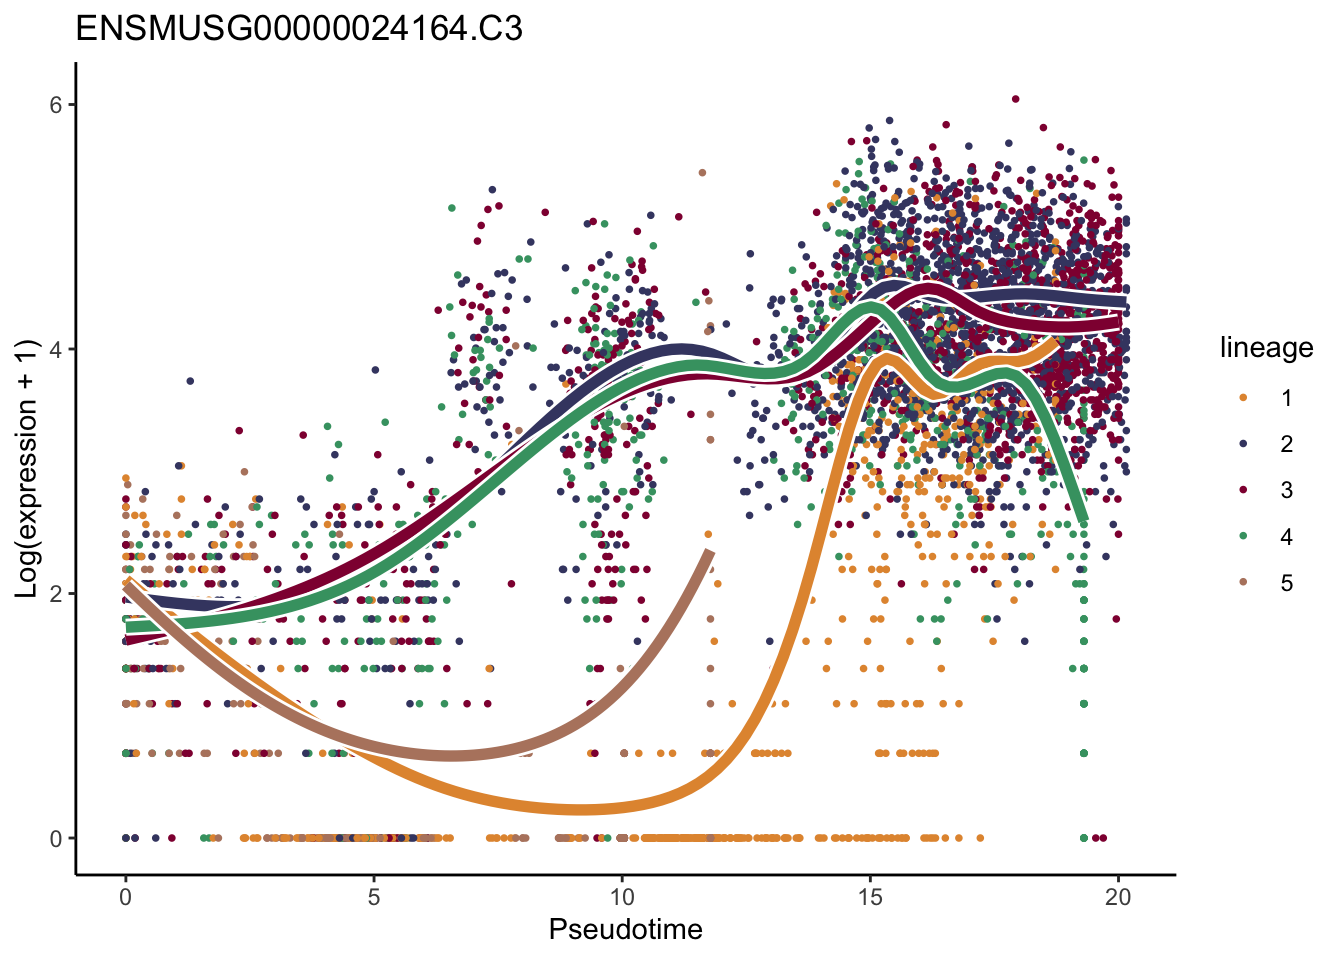
[[12]]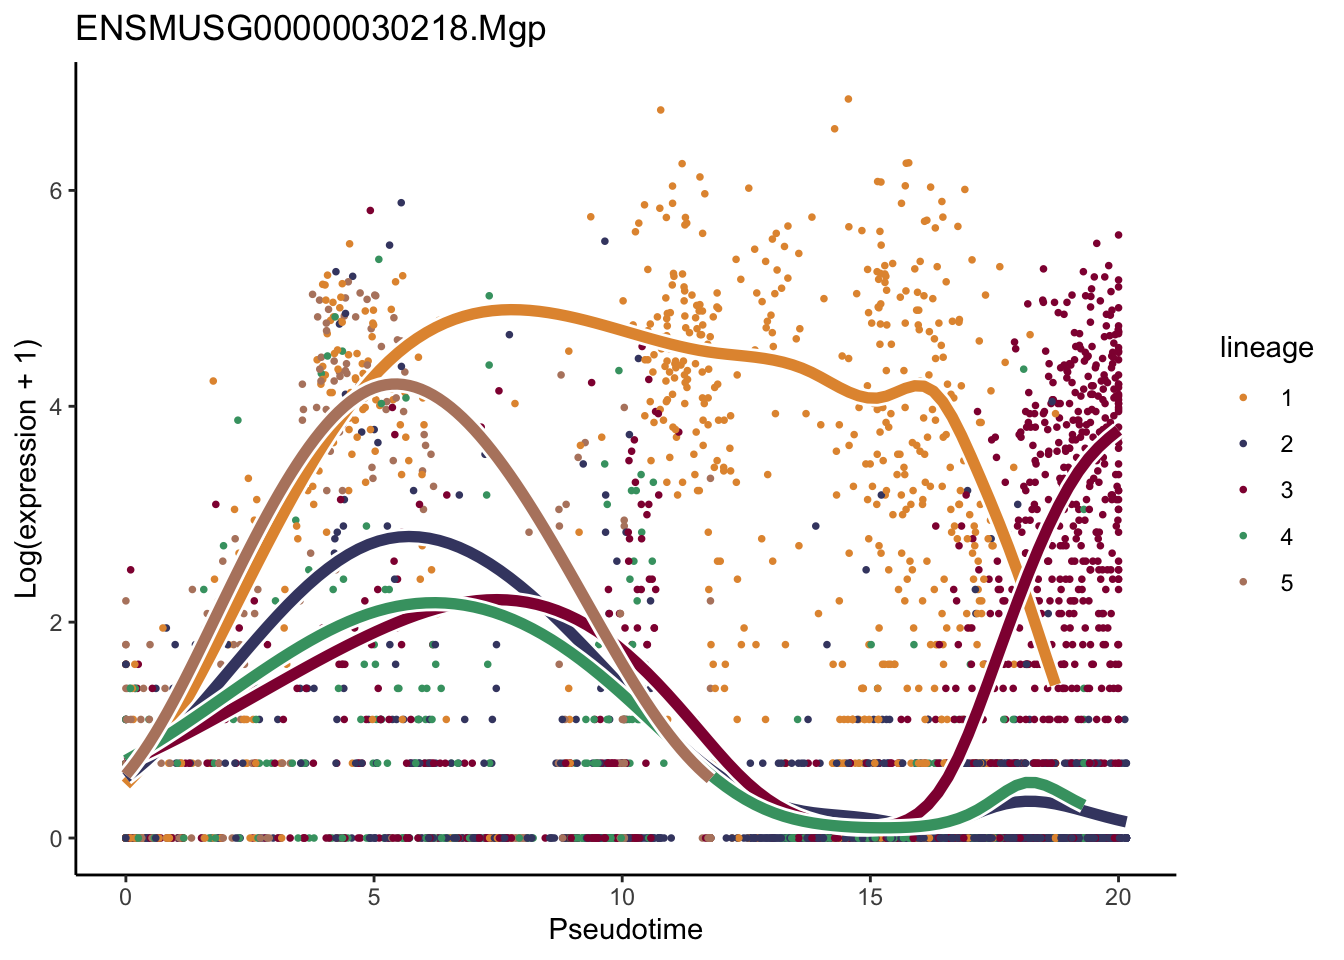
[[13]]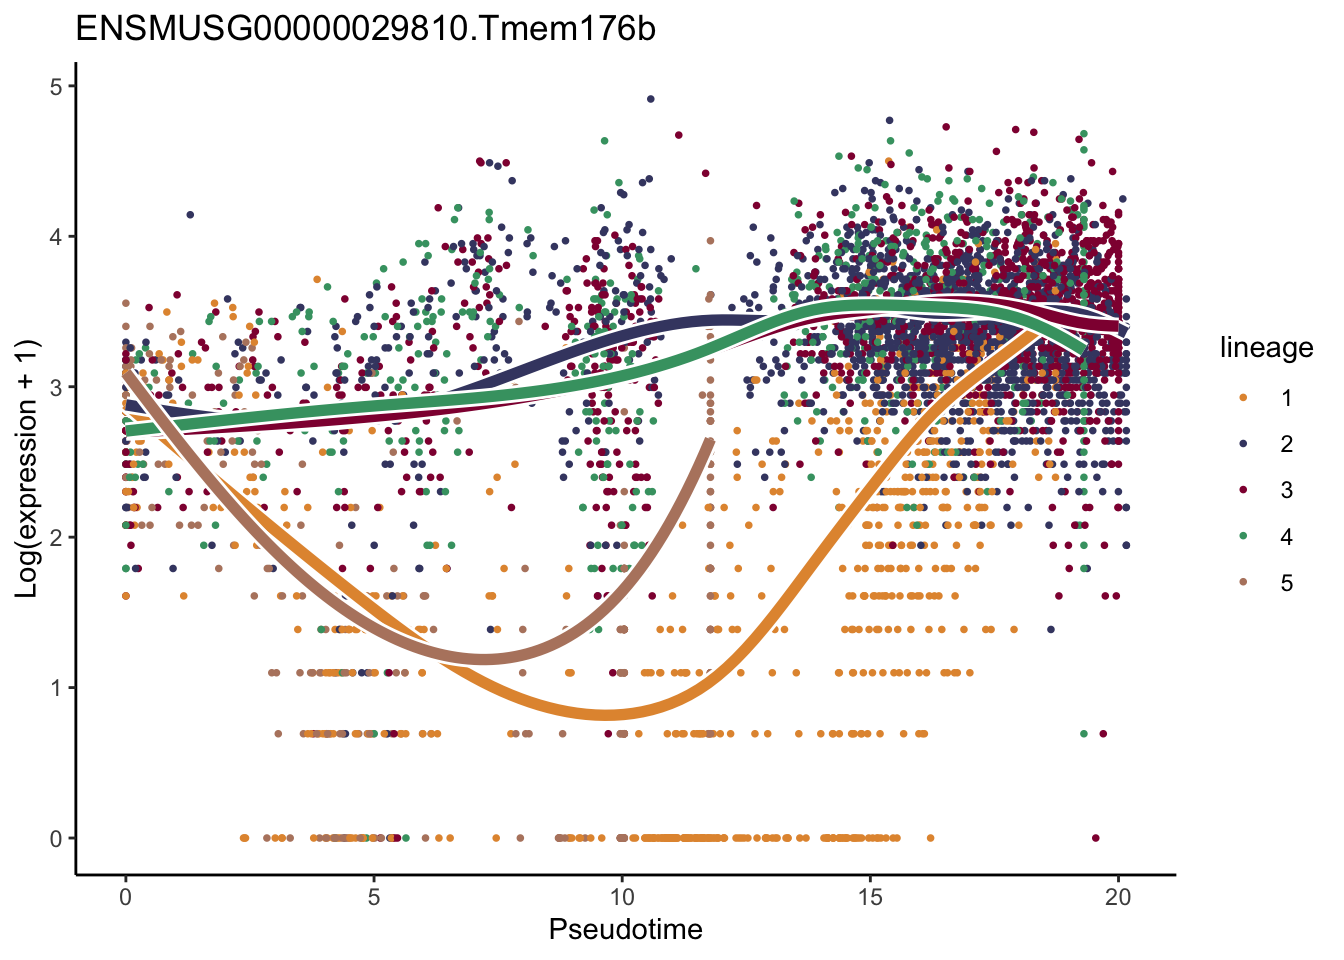
[[14]]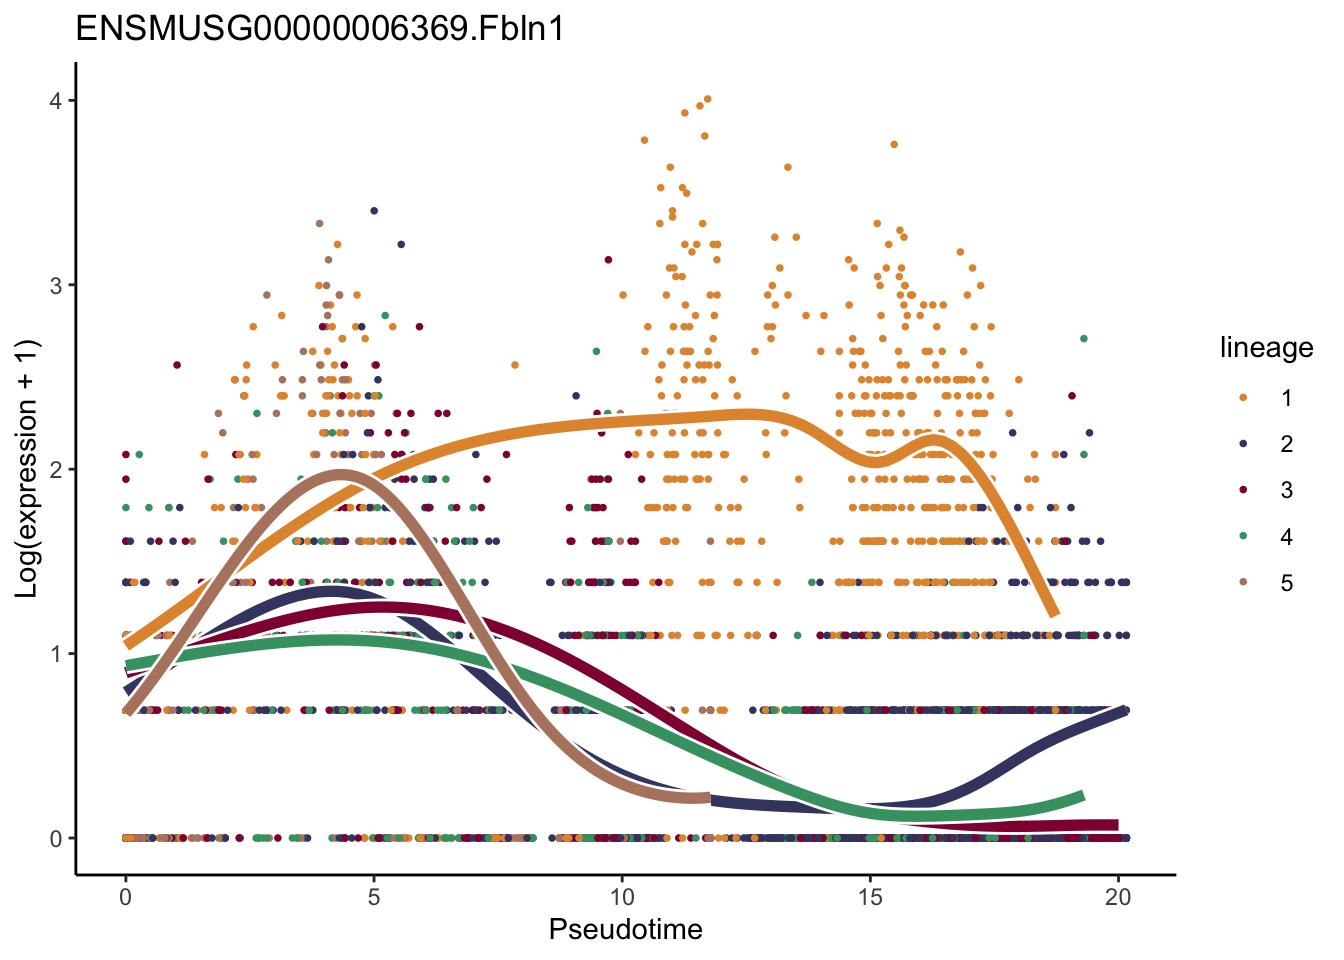
[[15]]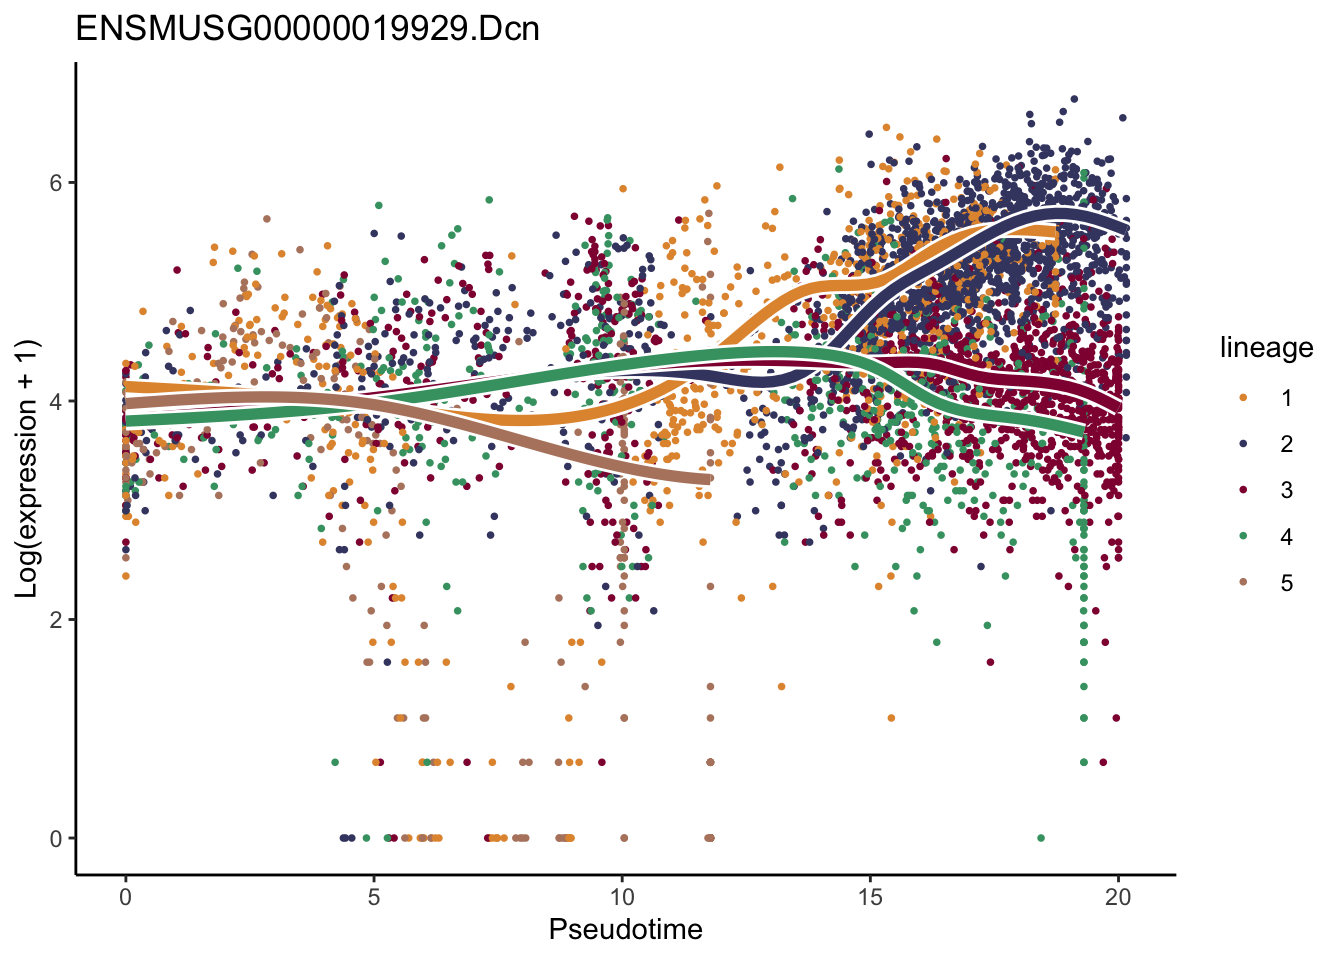
[[16]]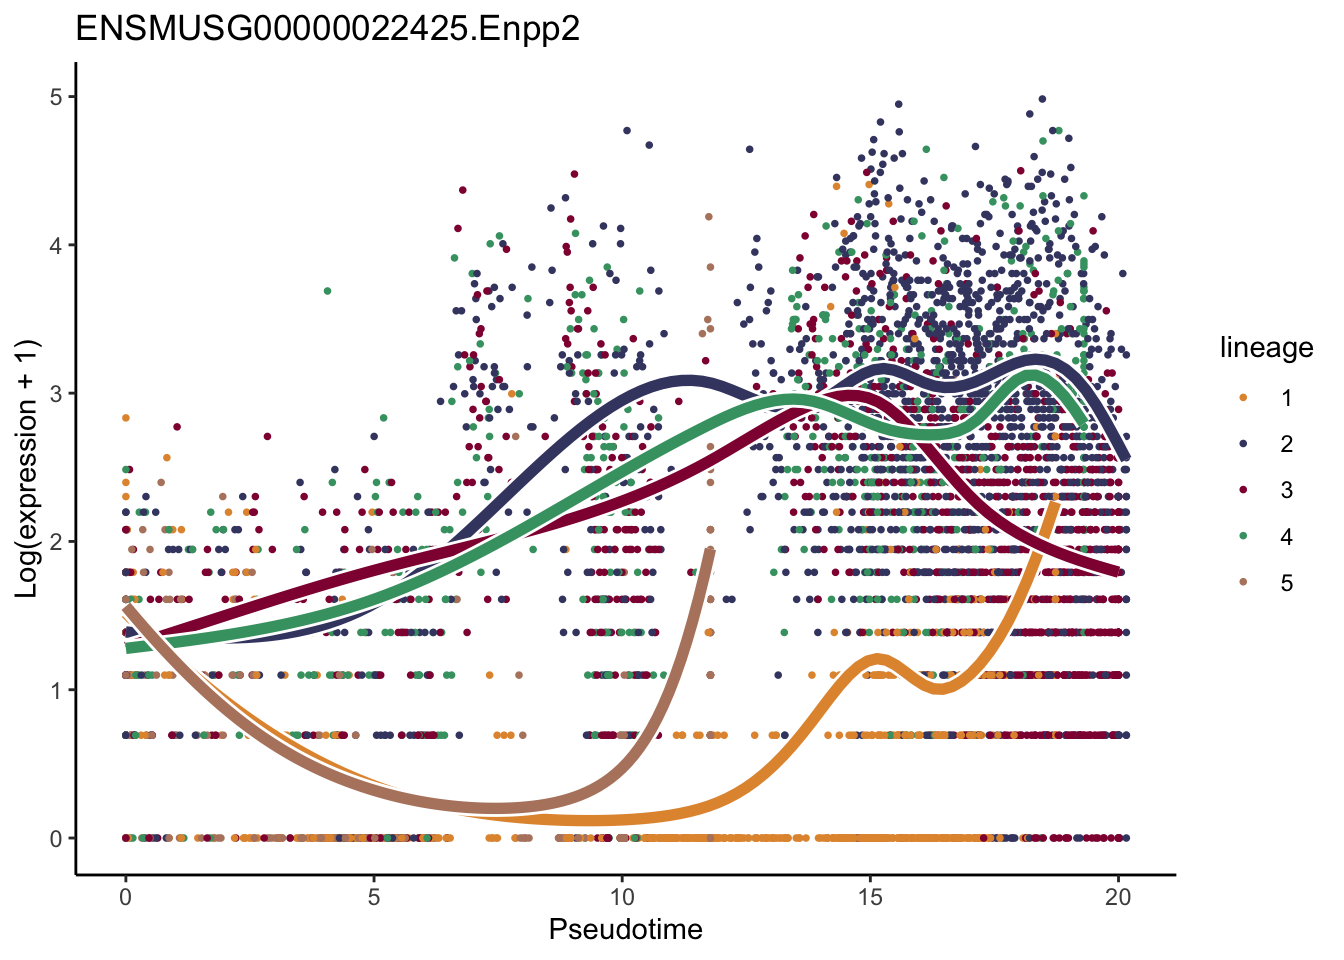
[[17]]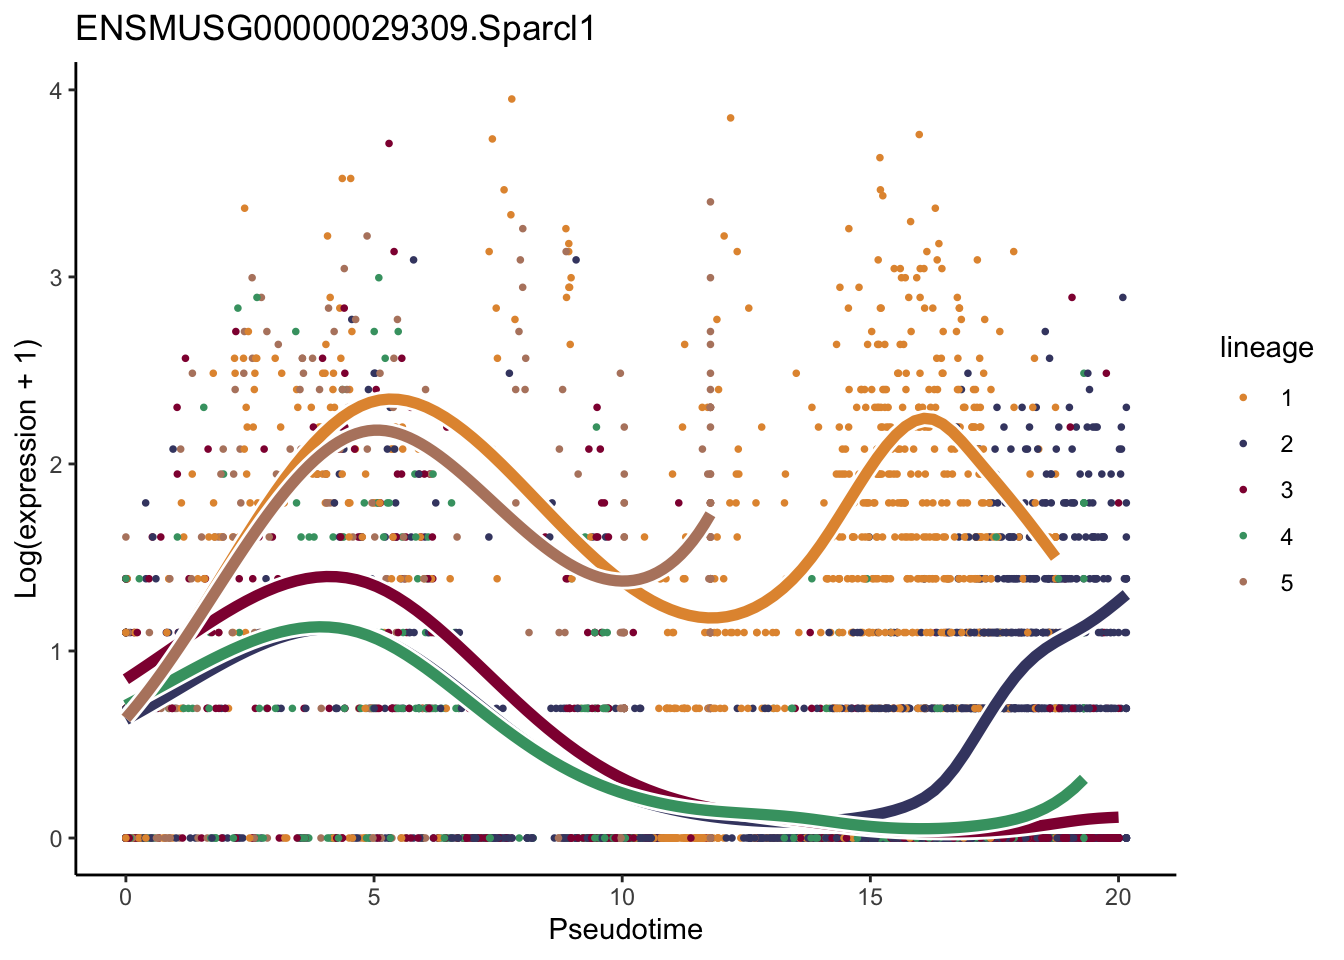
[[18]]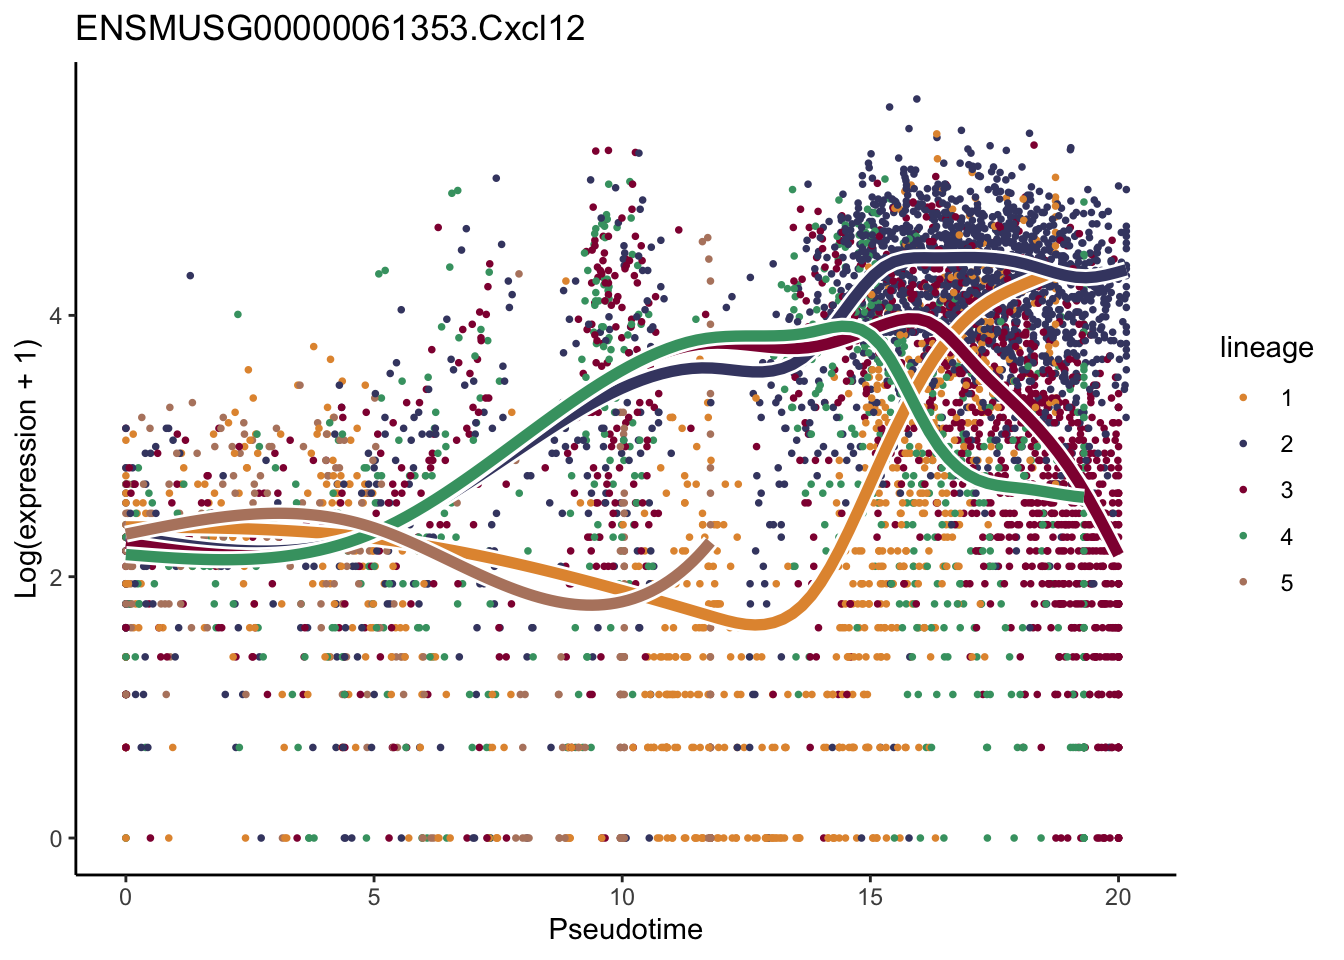
[[19]]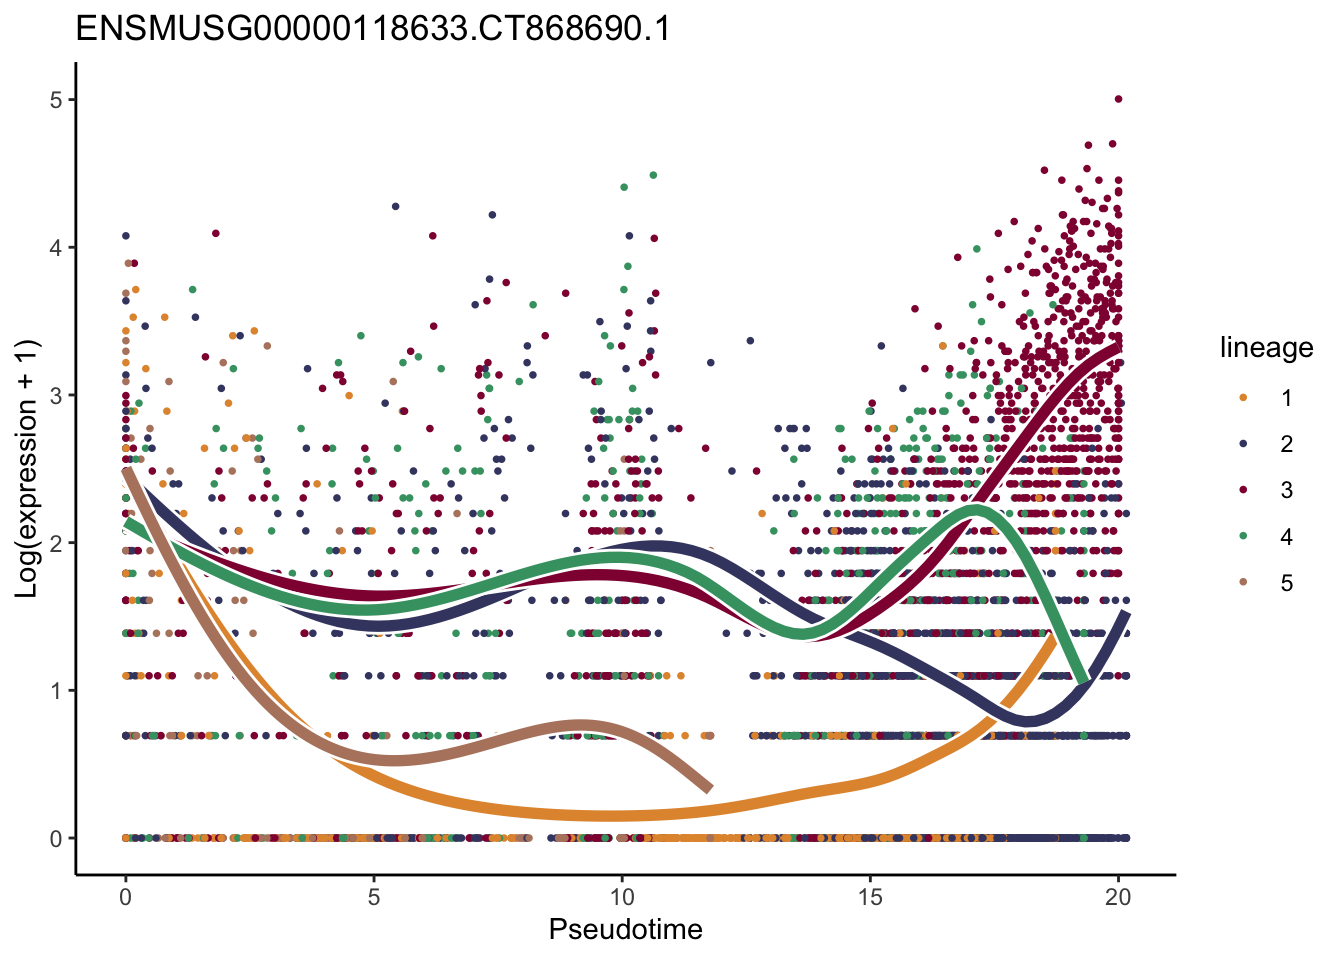
[[20]]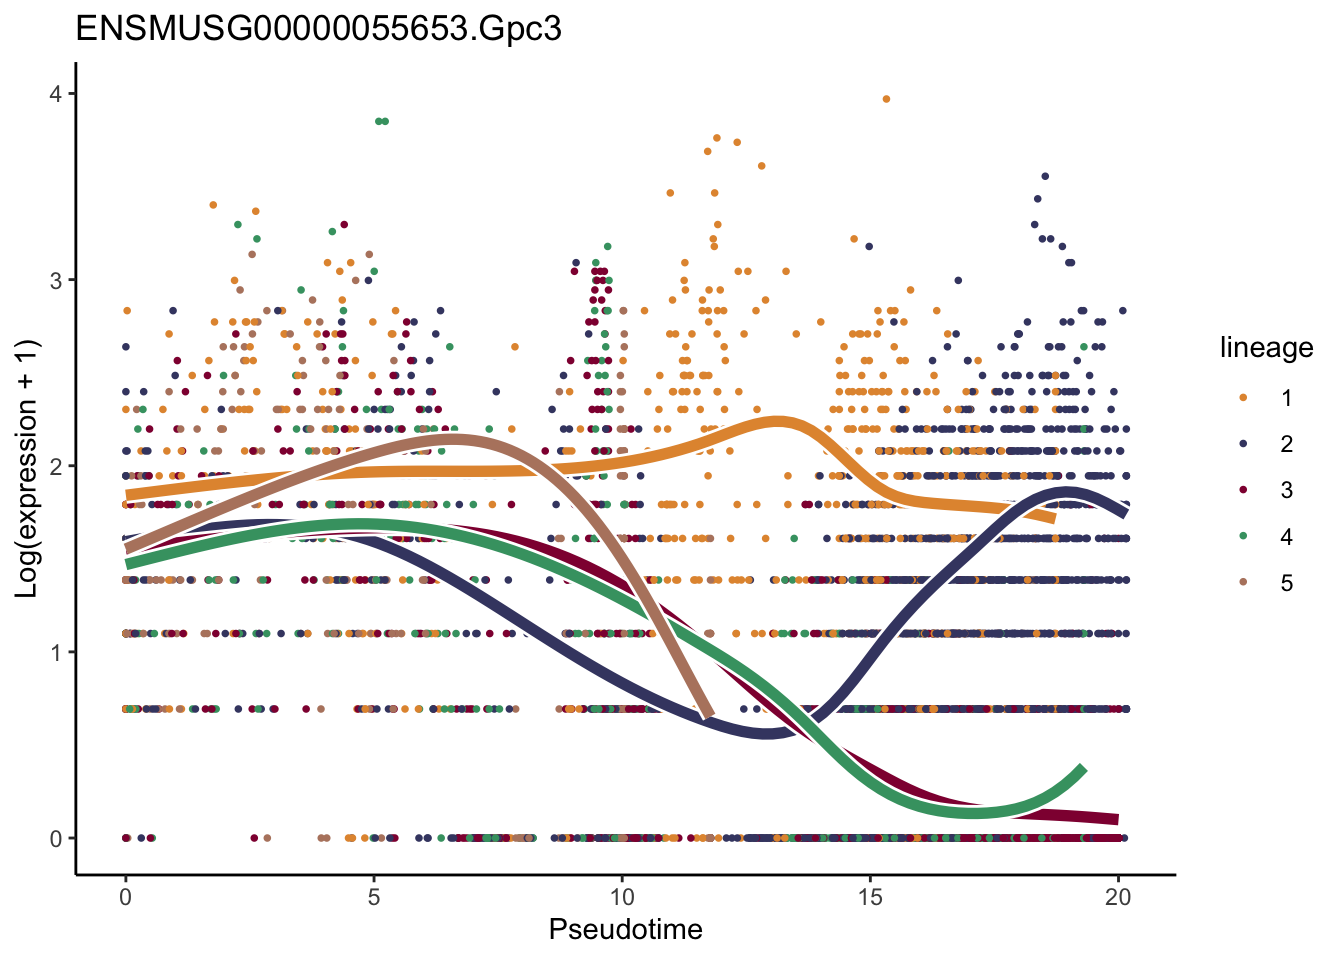
[[21]]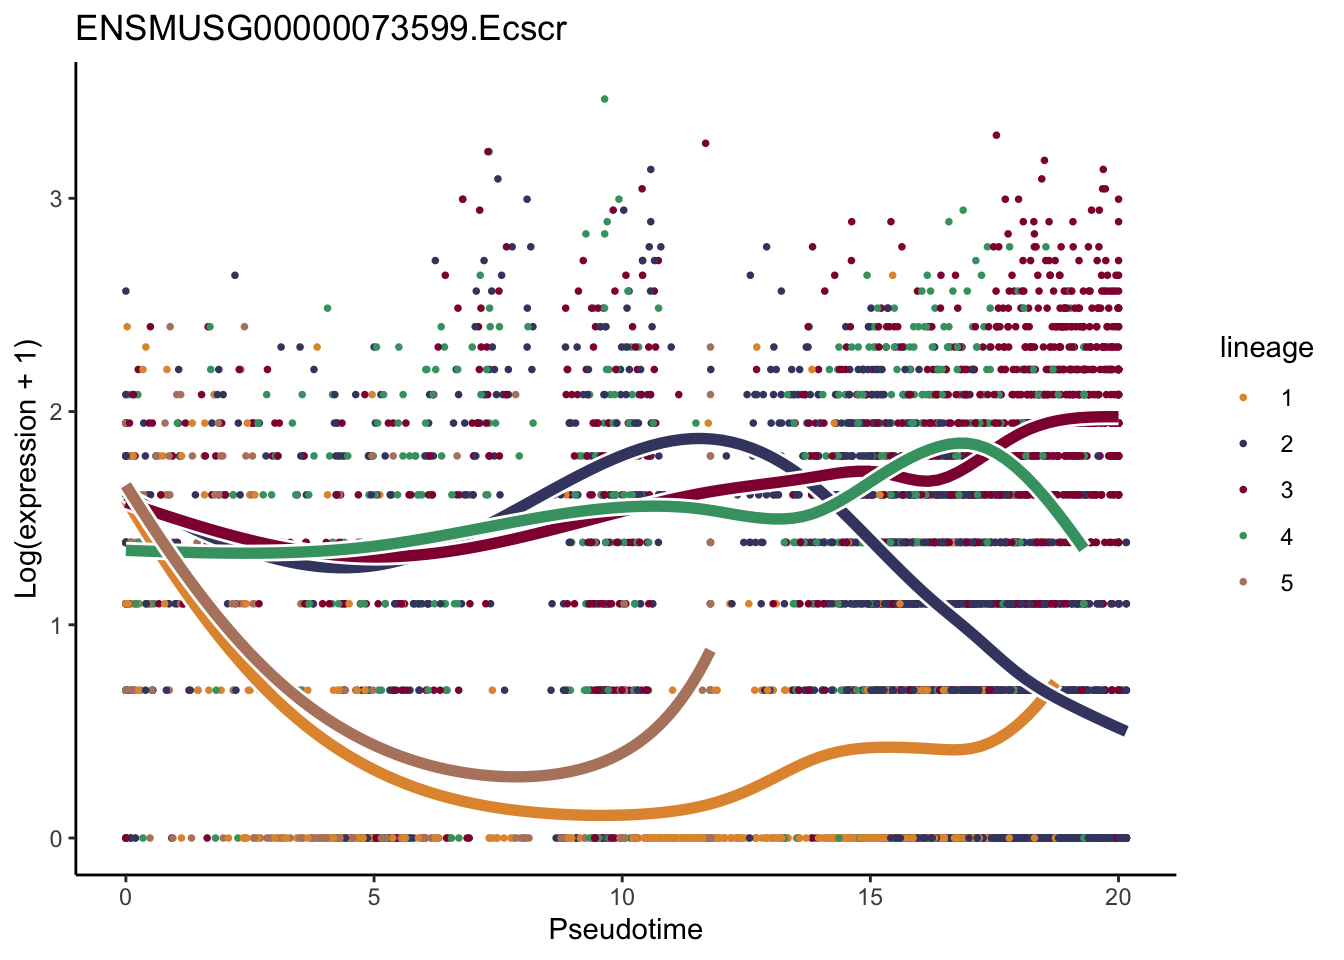
[[22]]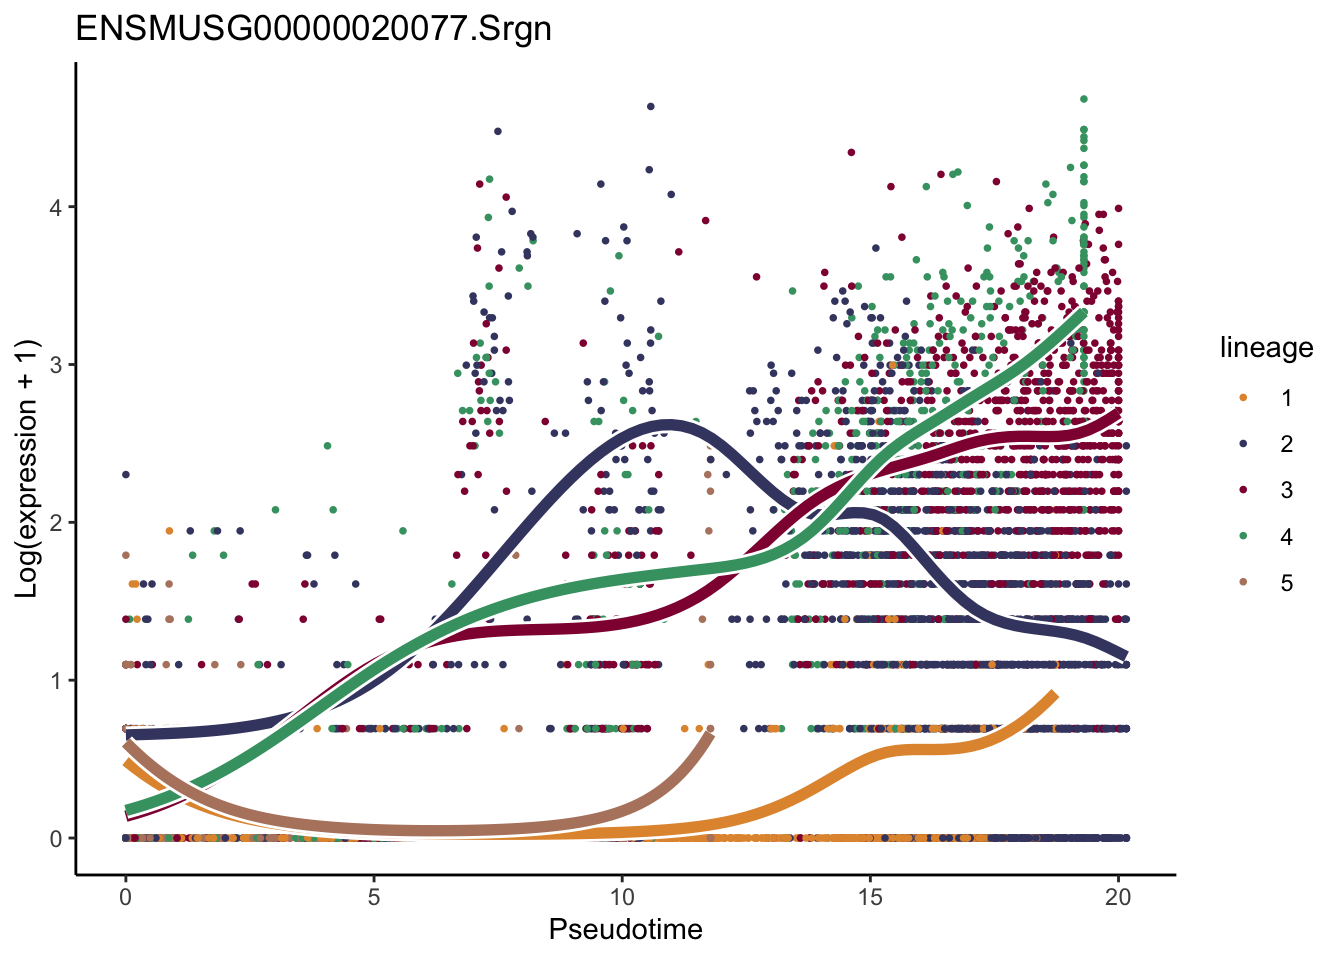
[[23]]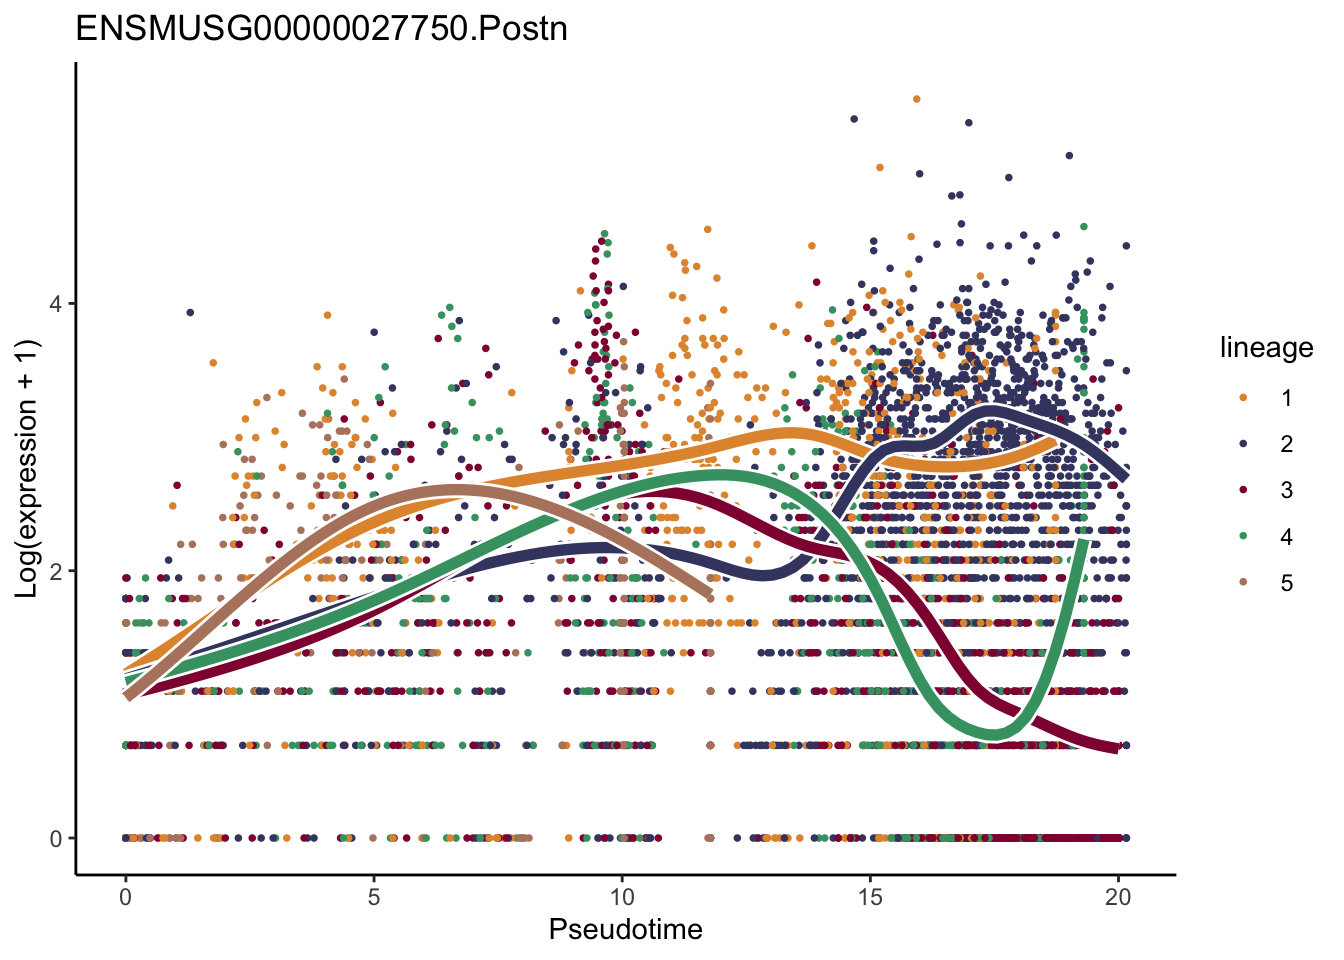
[[24]]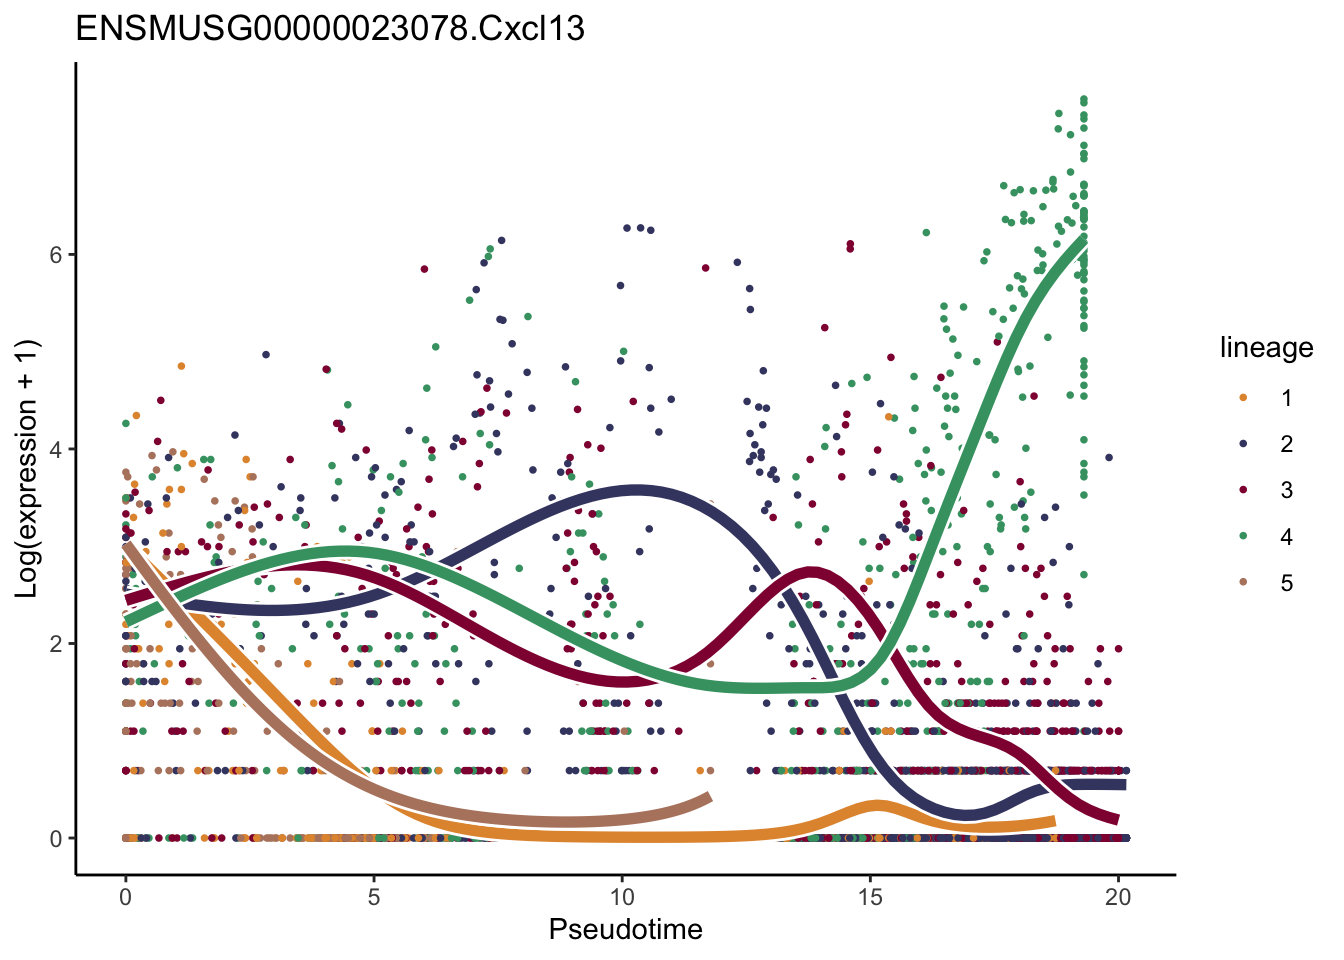
[[25]]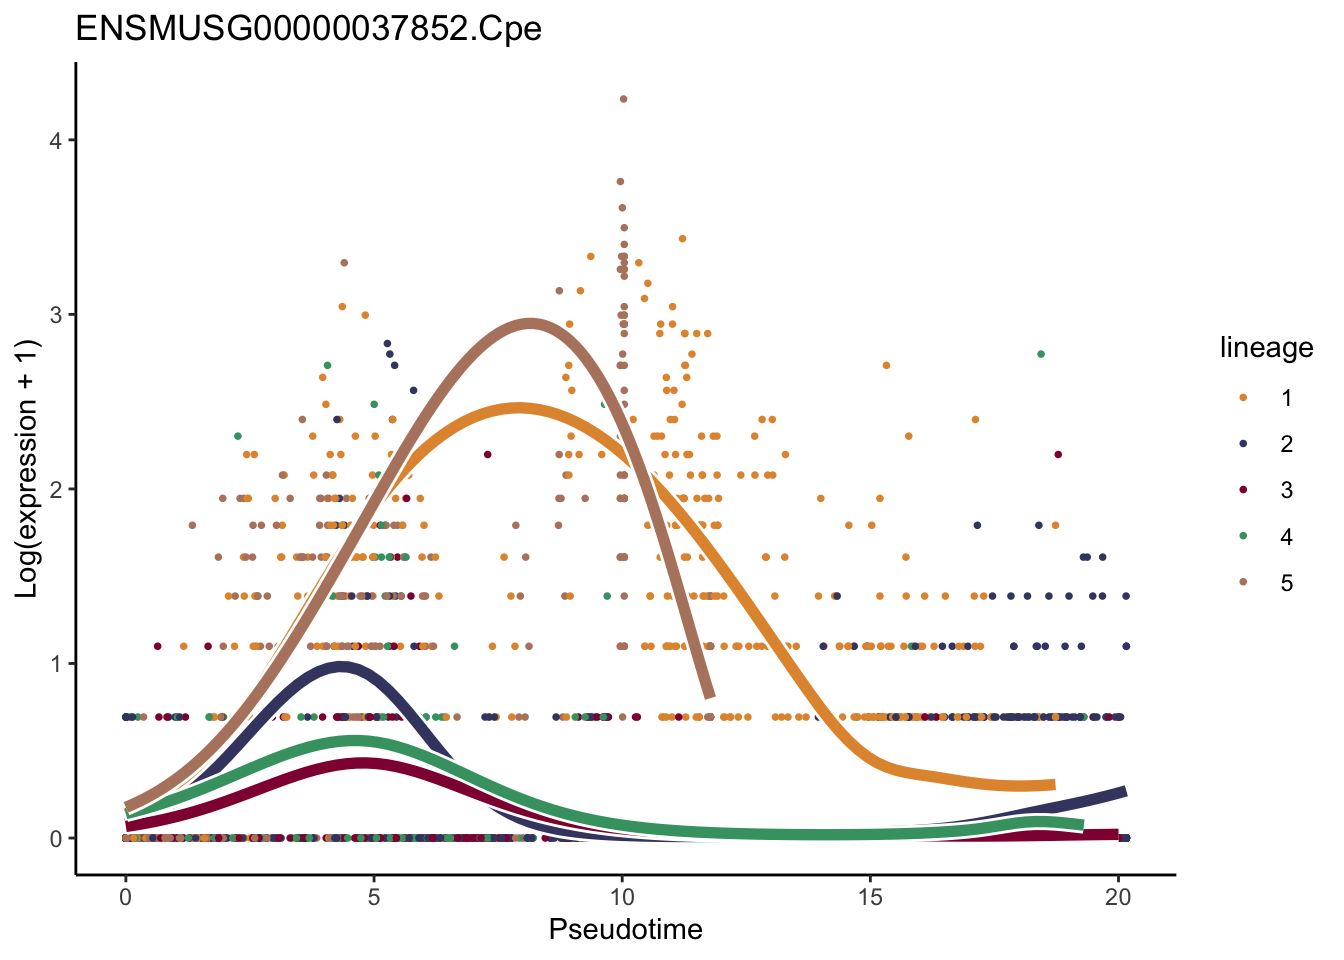
[[26]]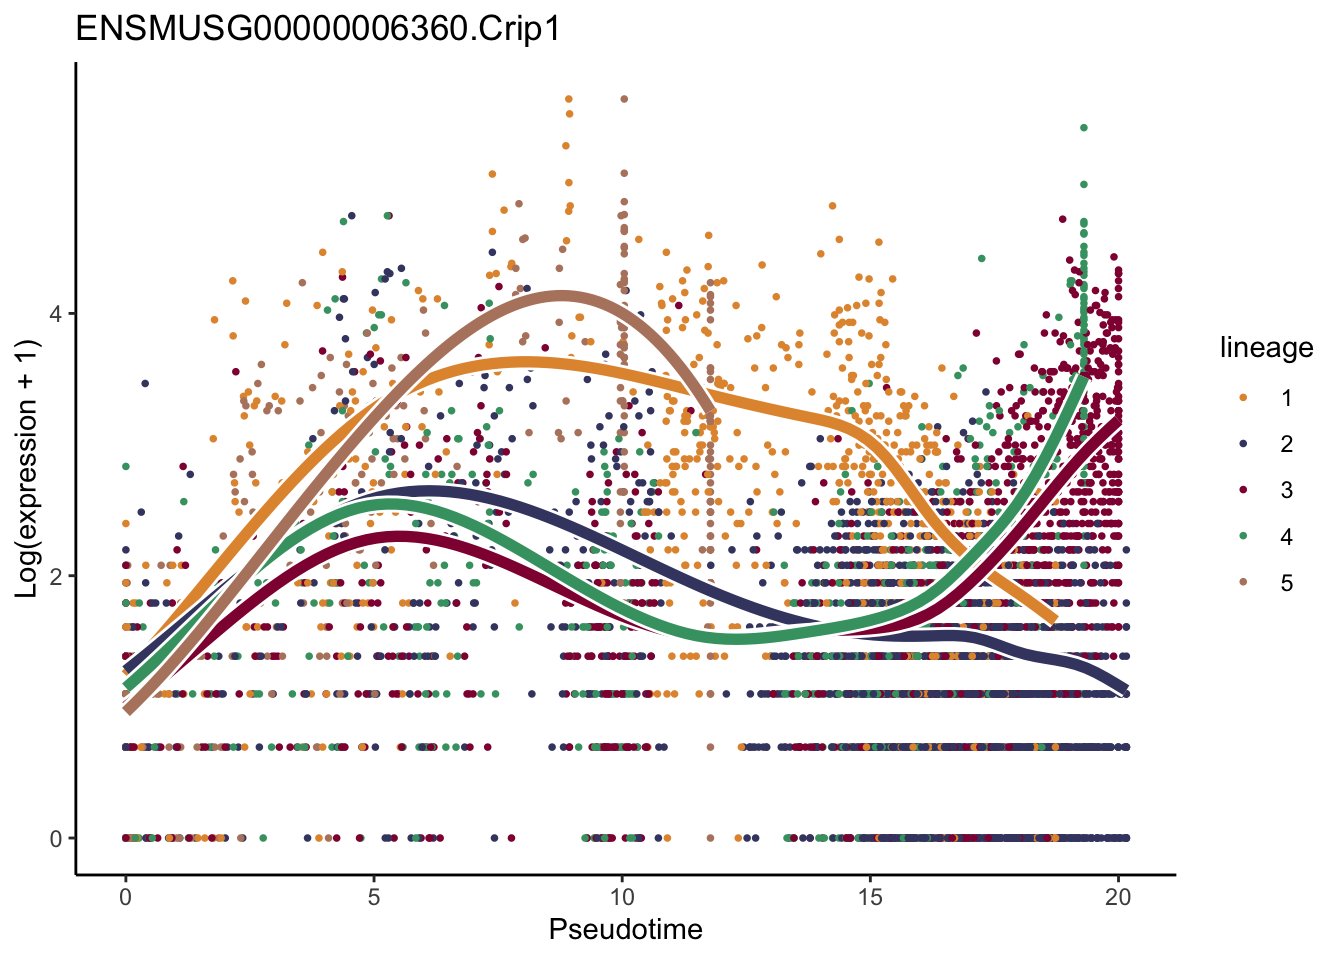
[[27]]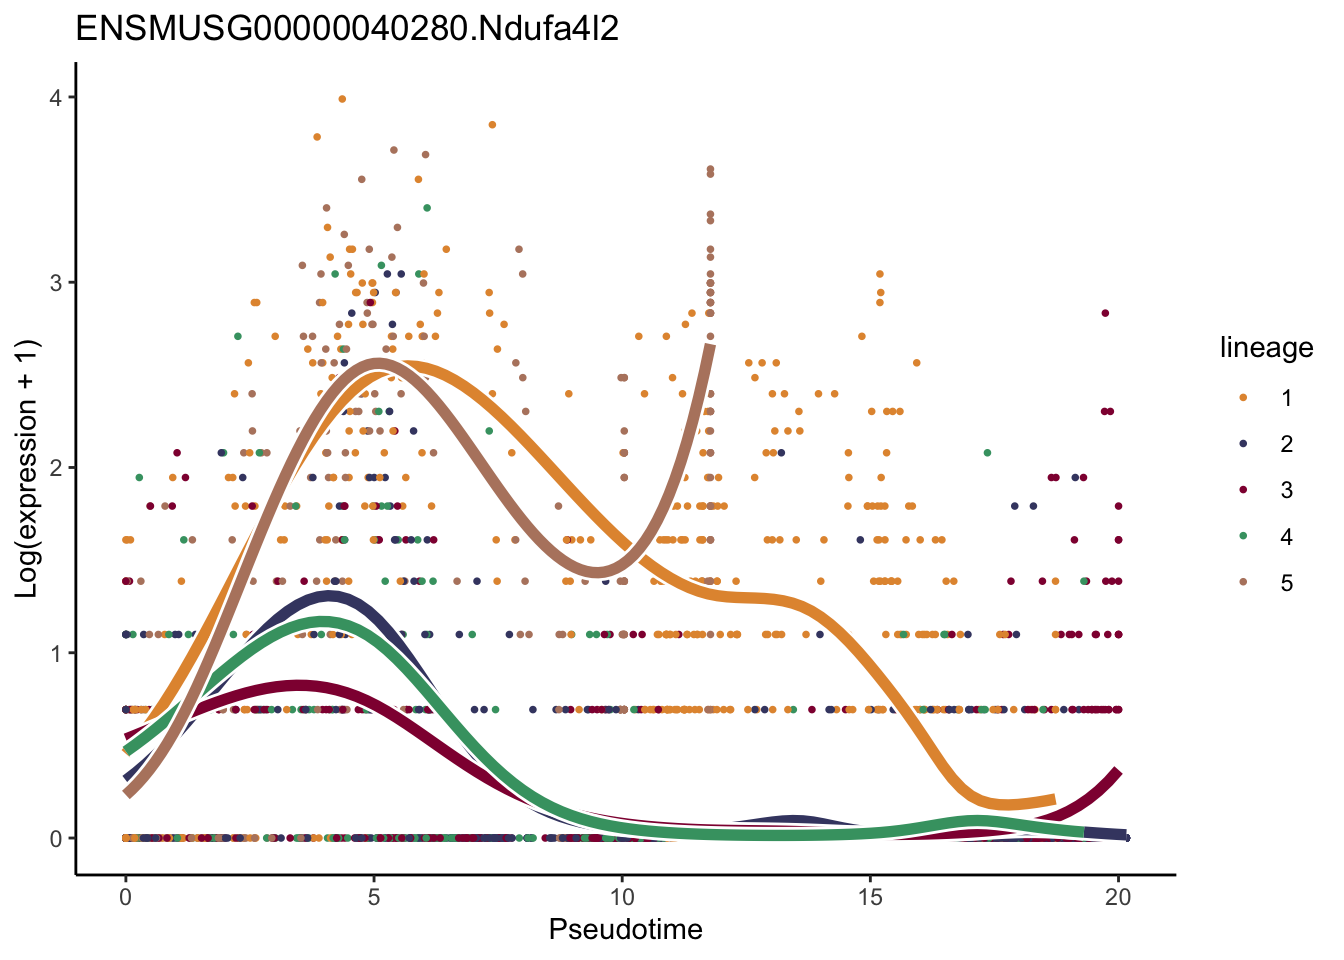
[[28]]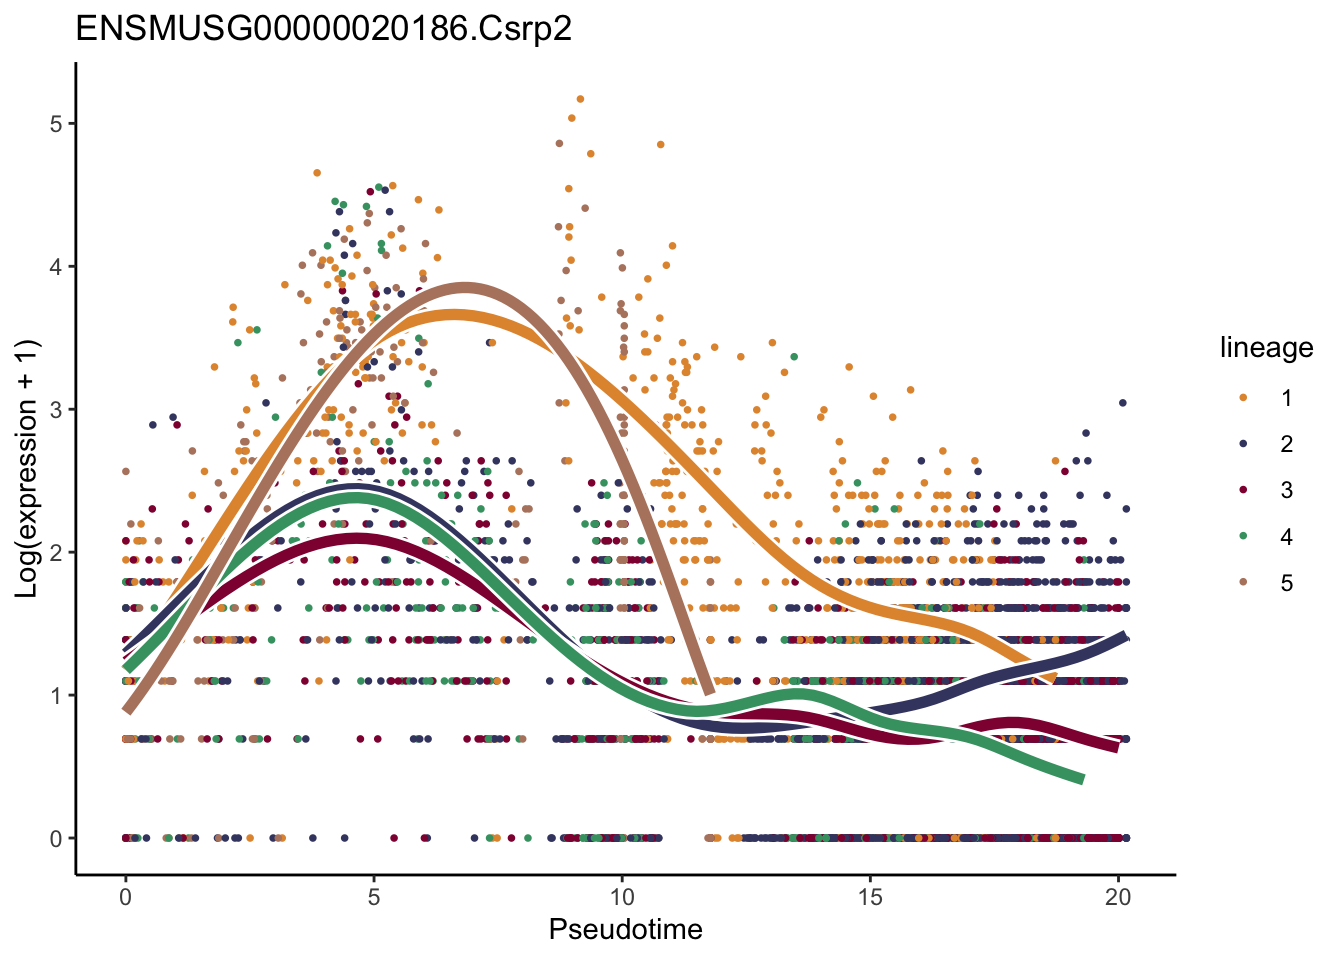
[[29]]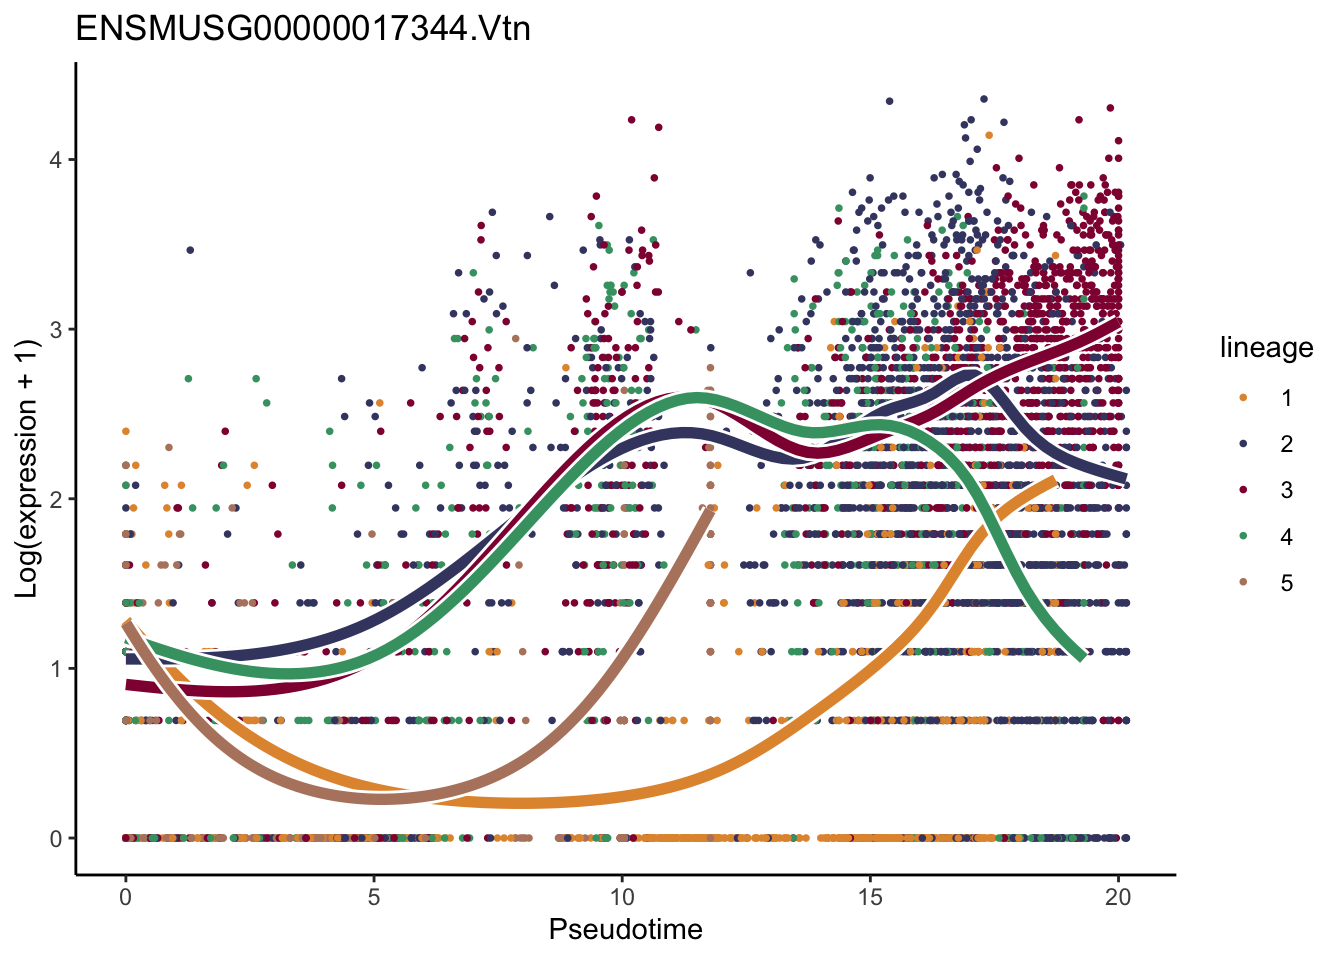
[[30]]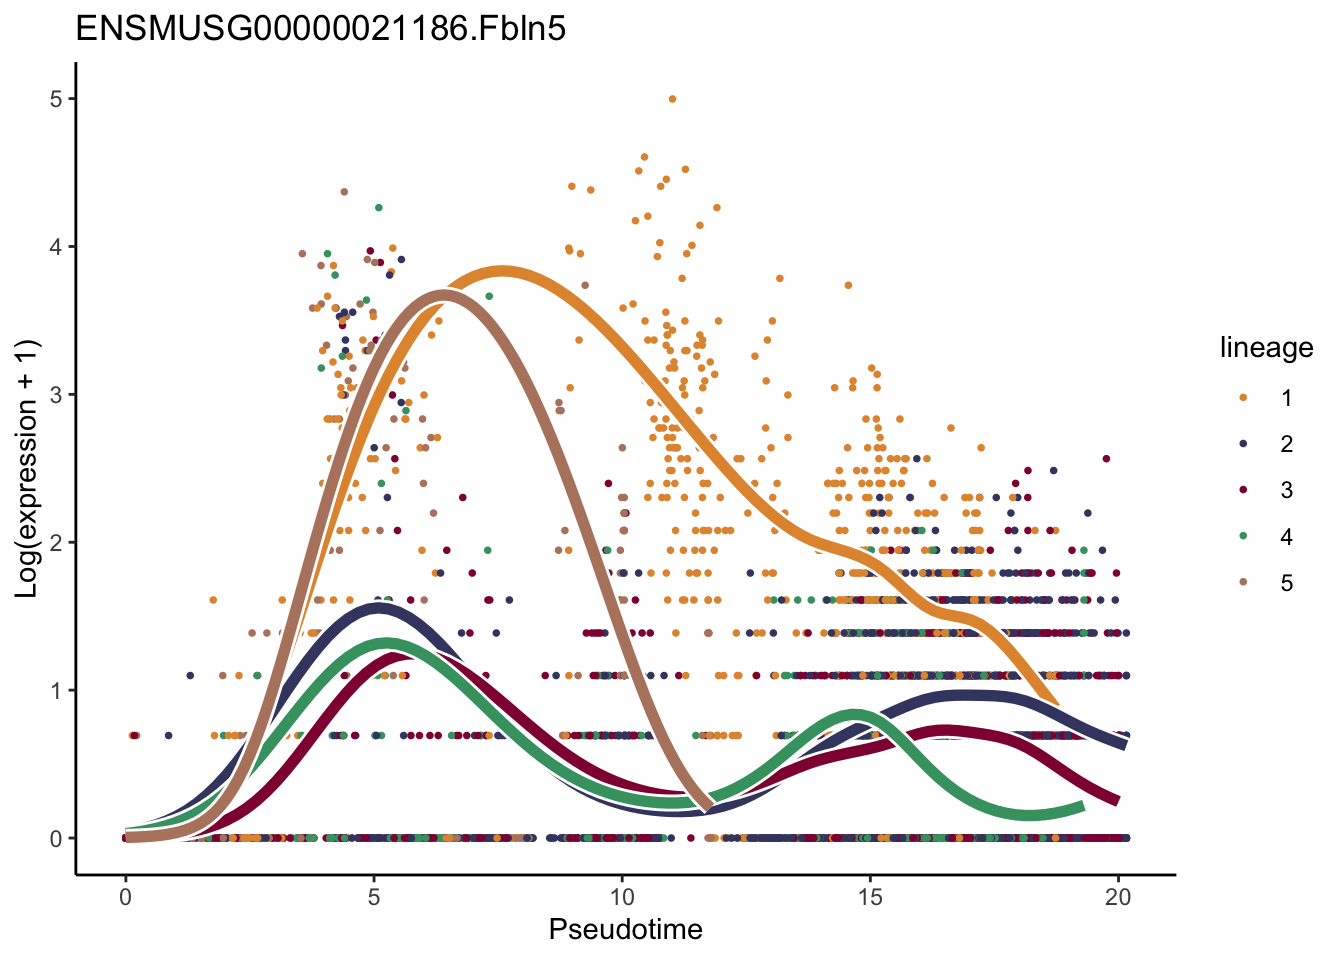
[[31]]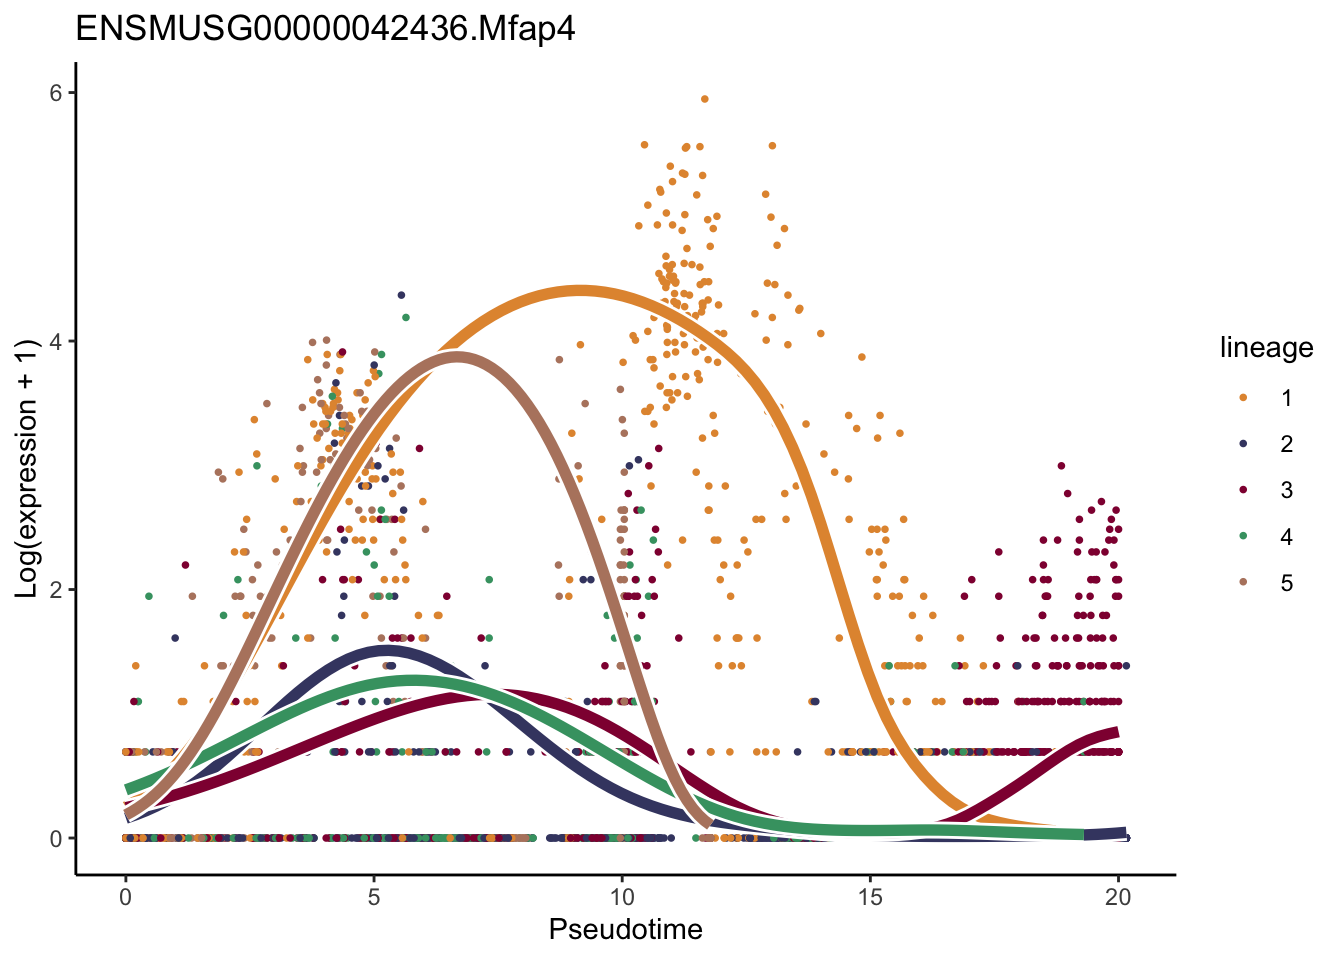
[[32]]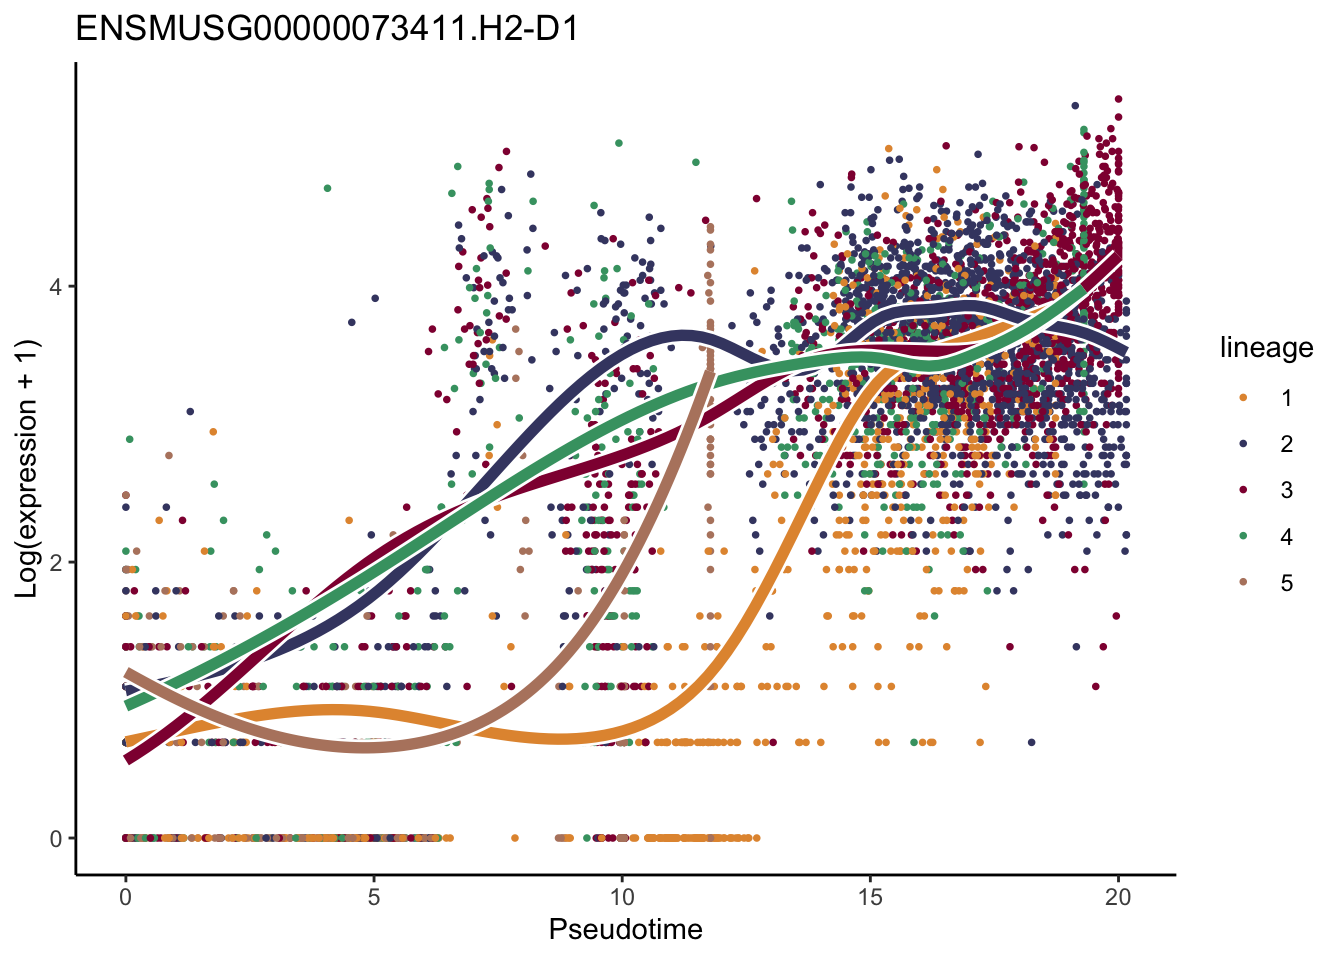
[[33]]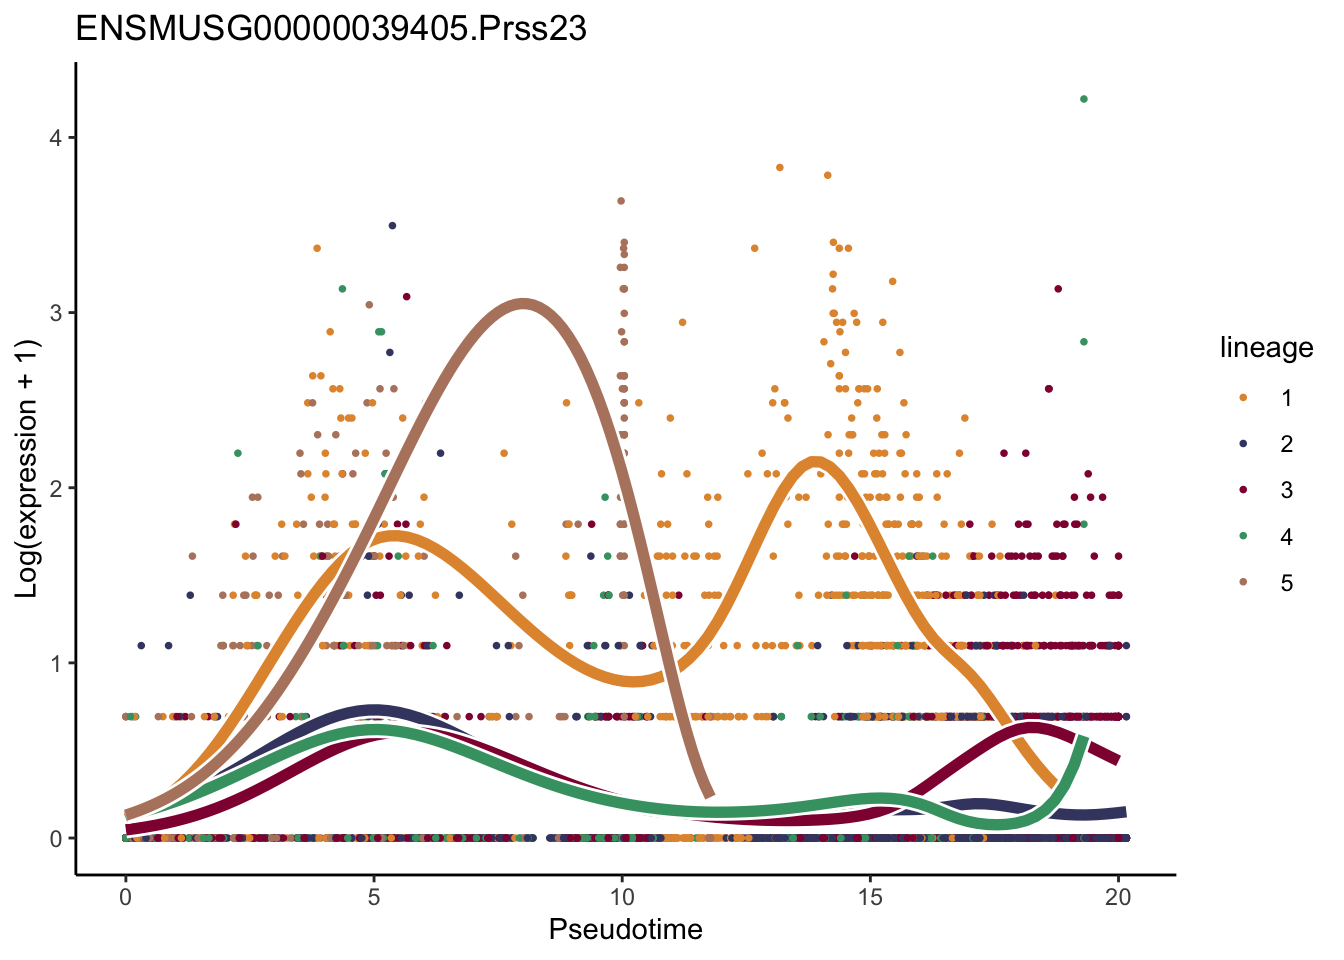
[[34]]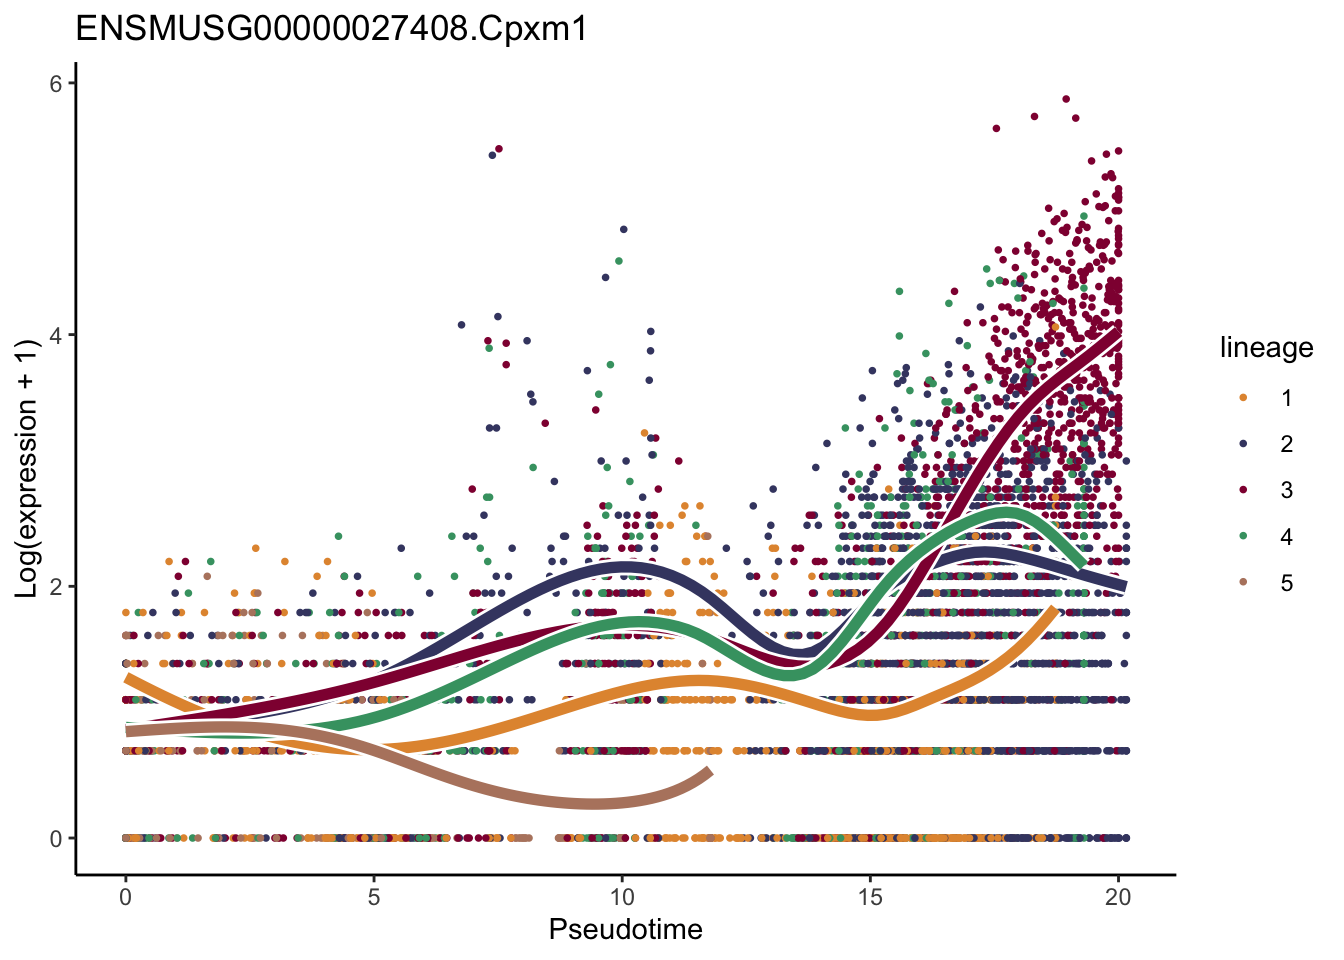
[[35]]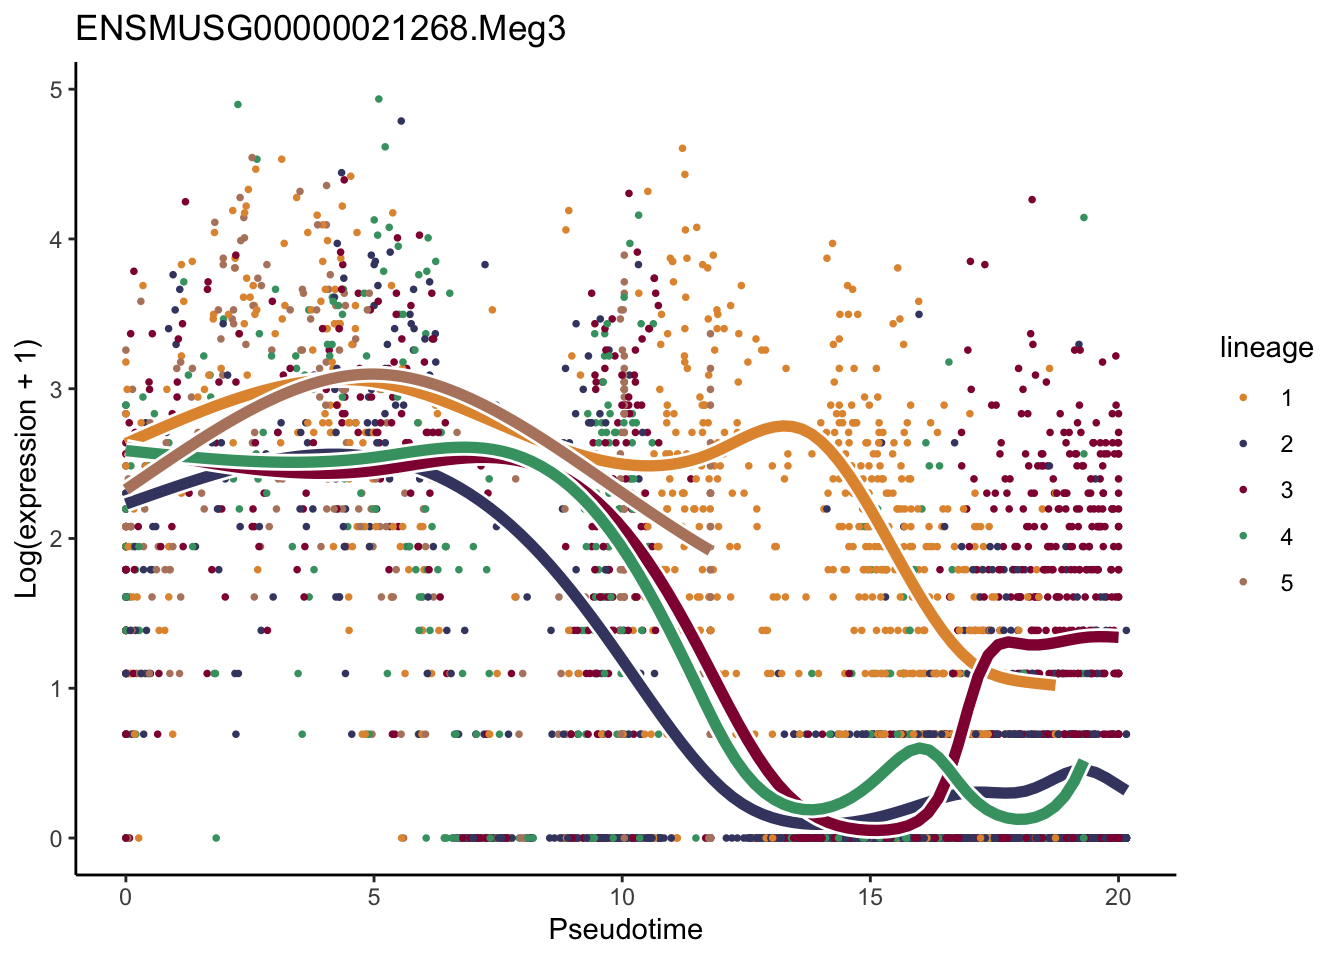
[[36]]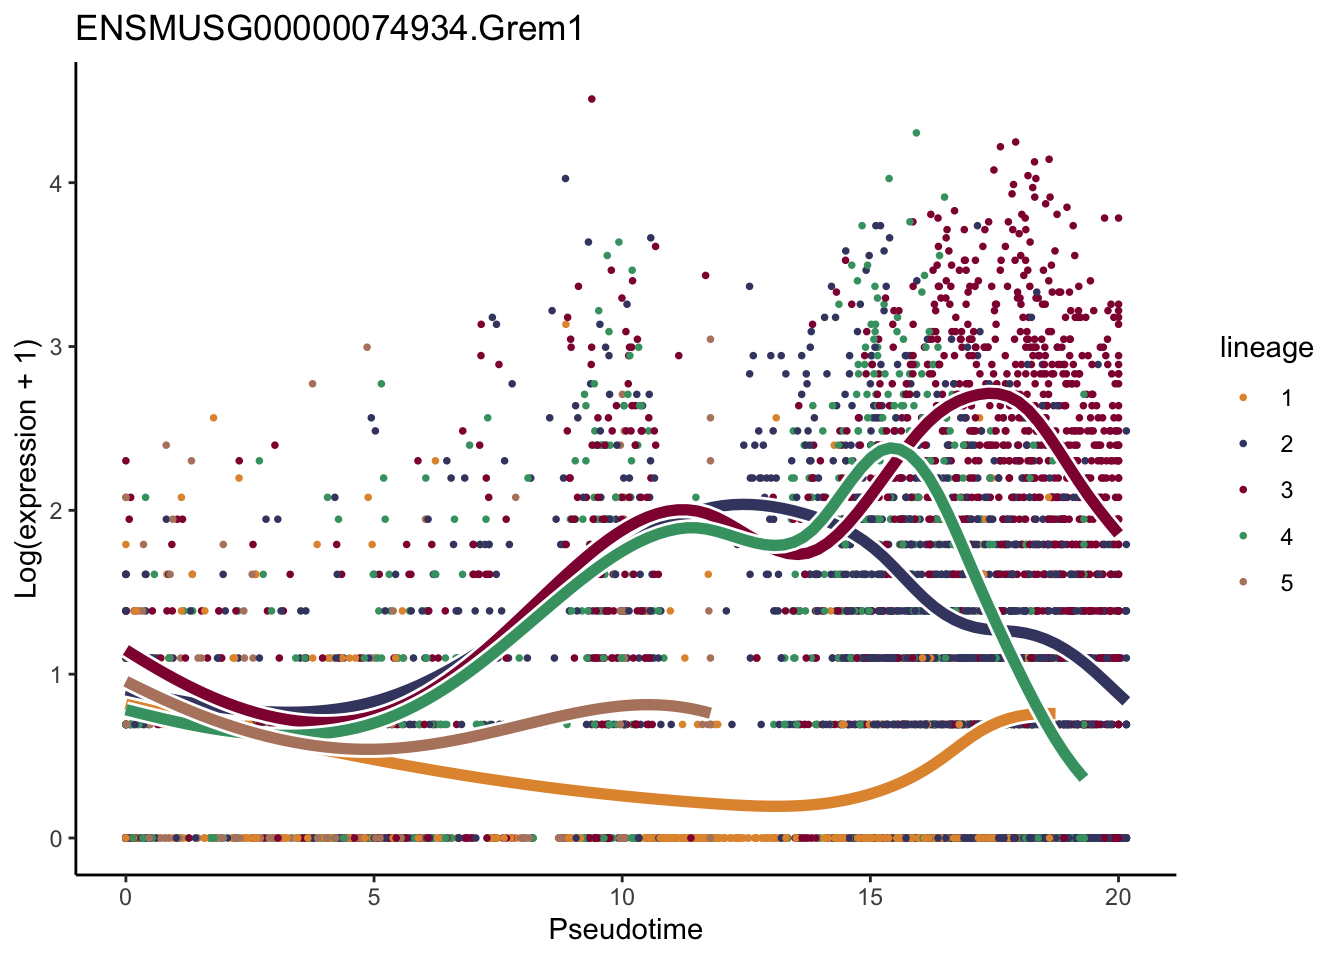
[[37]]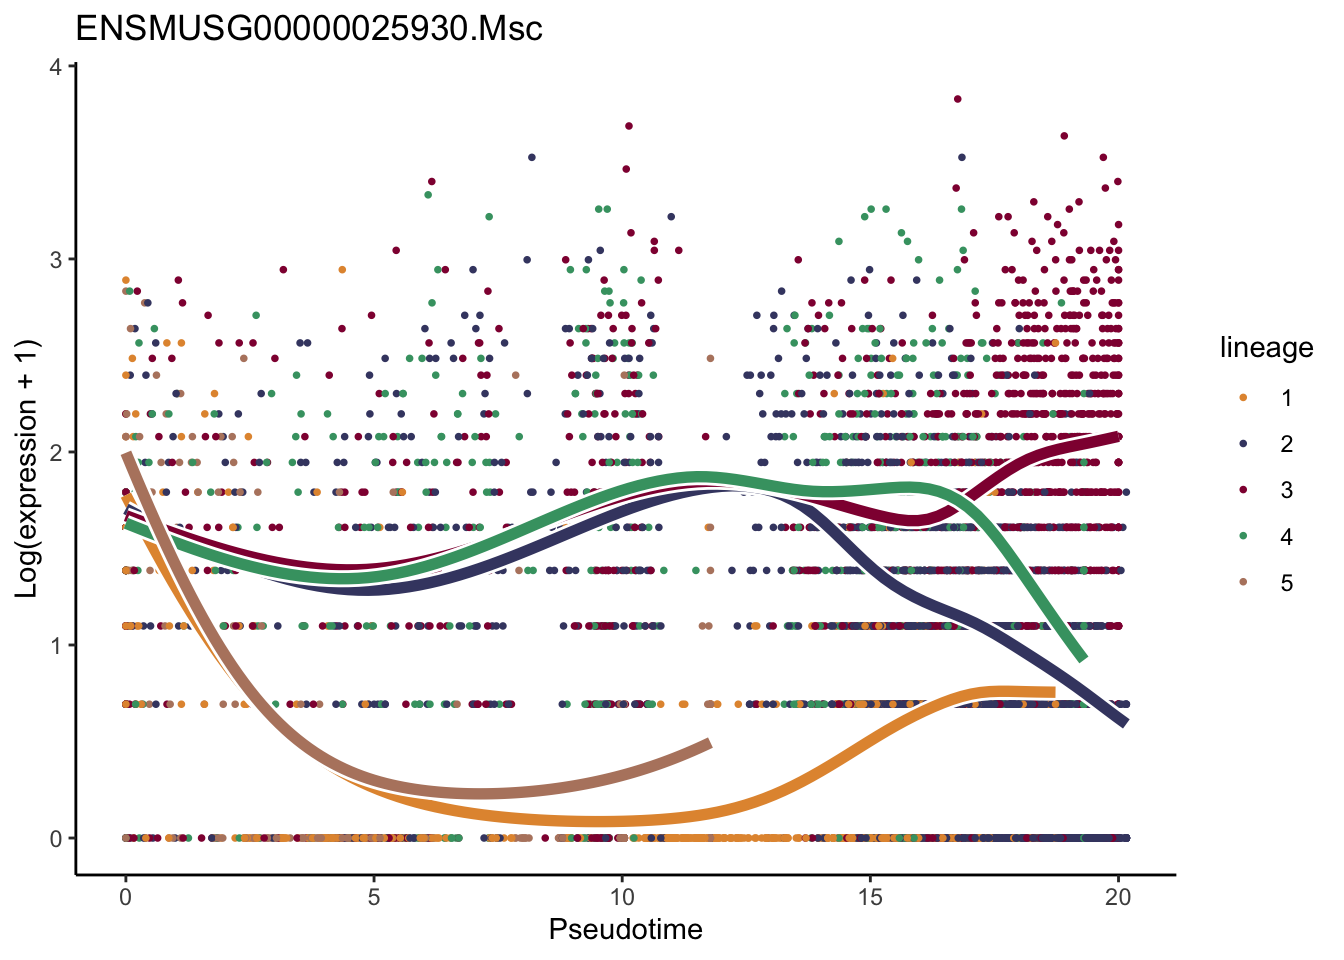
[[38]]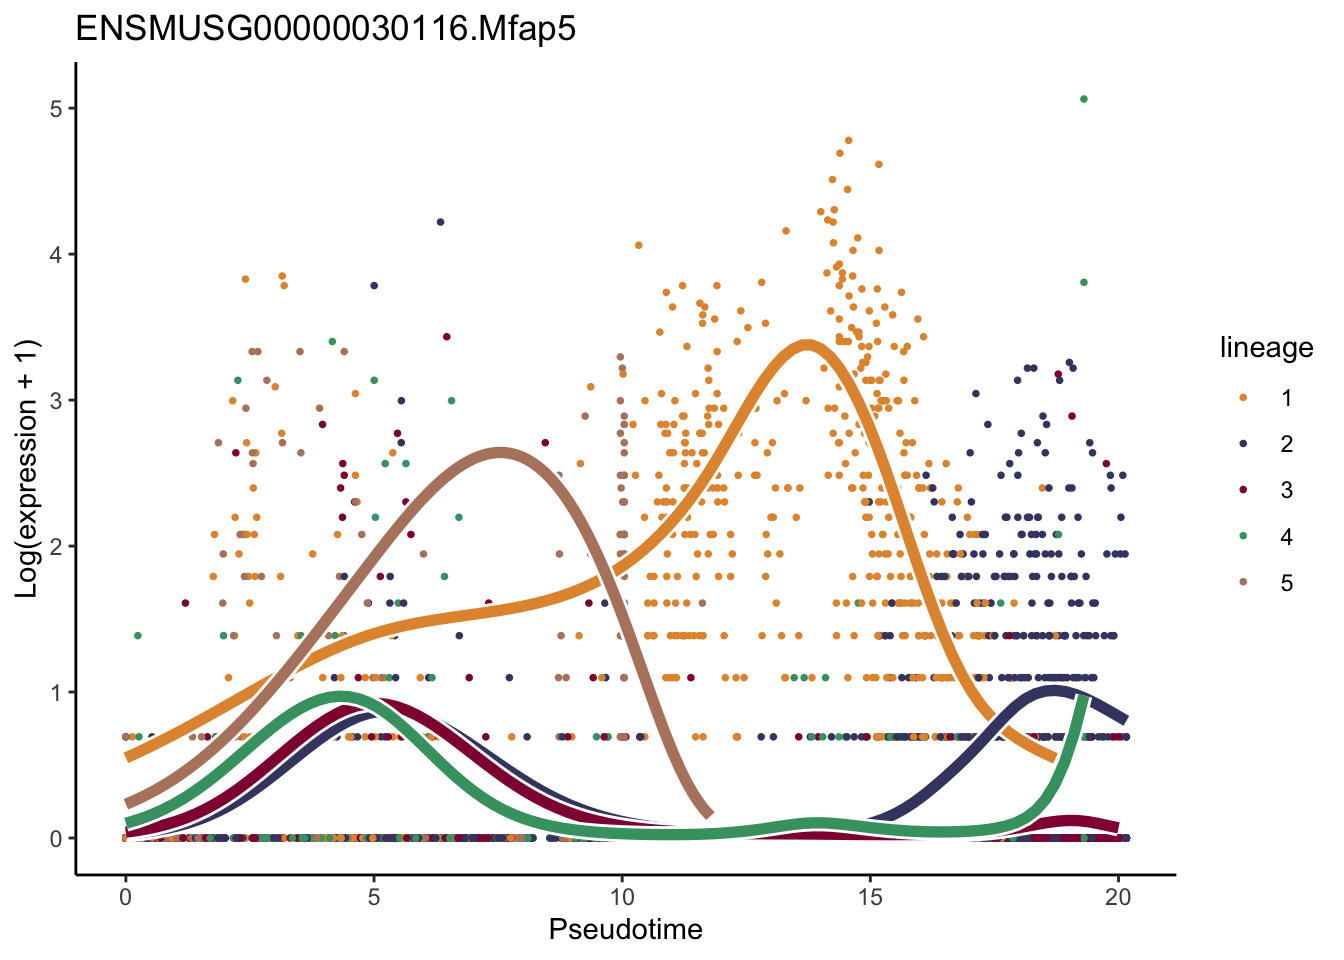
[[39]]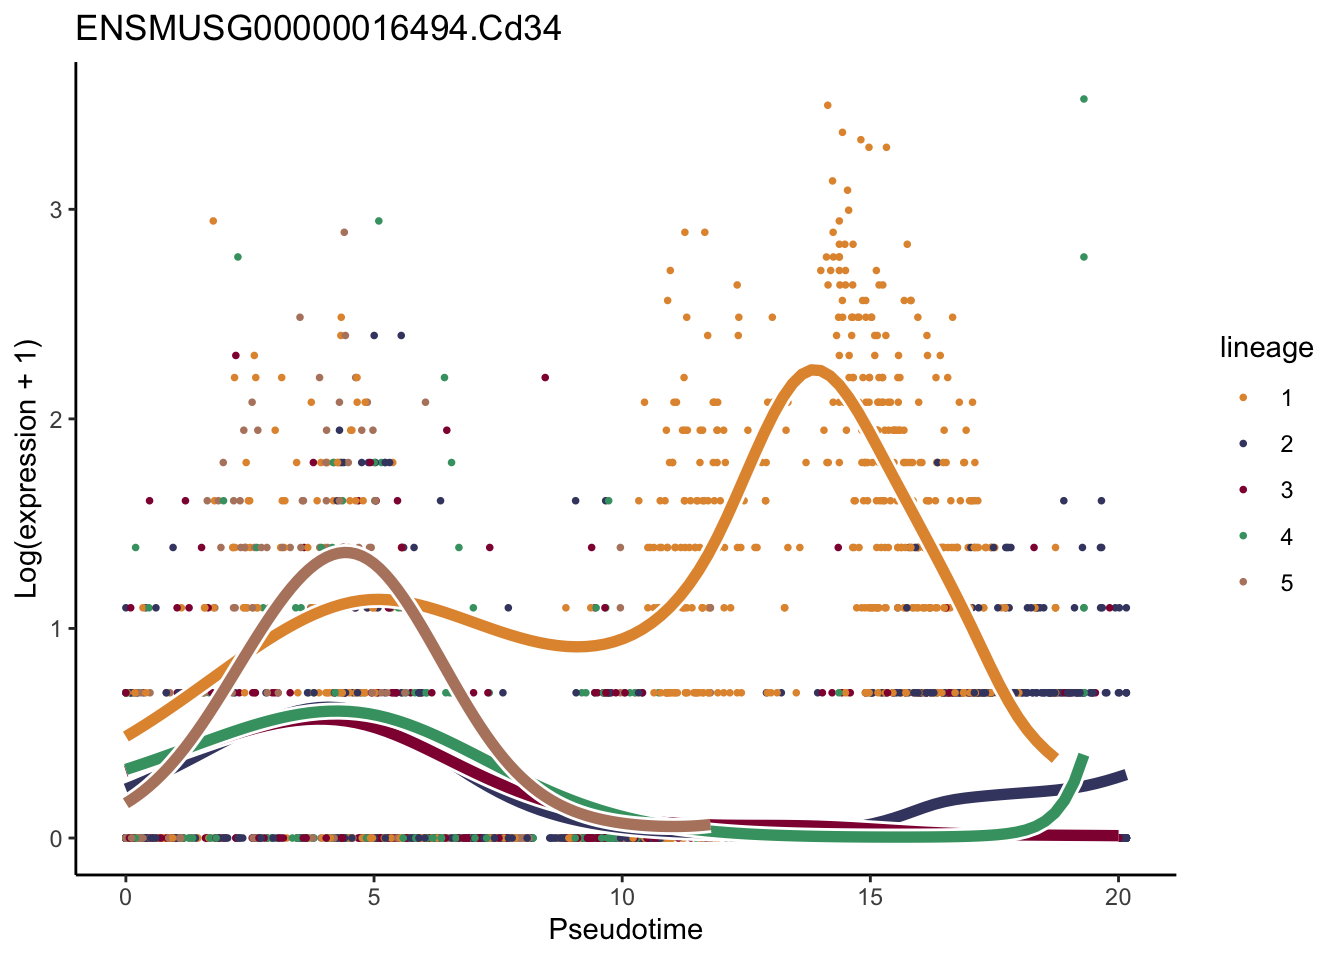
[[40]]
[[41]]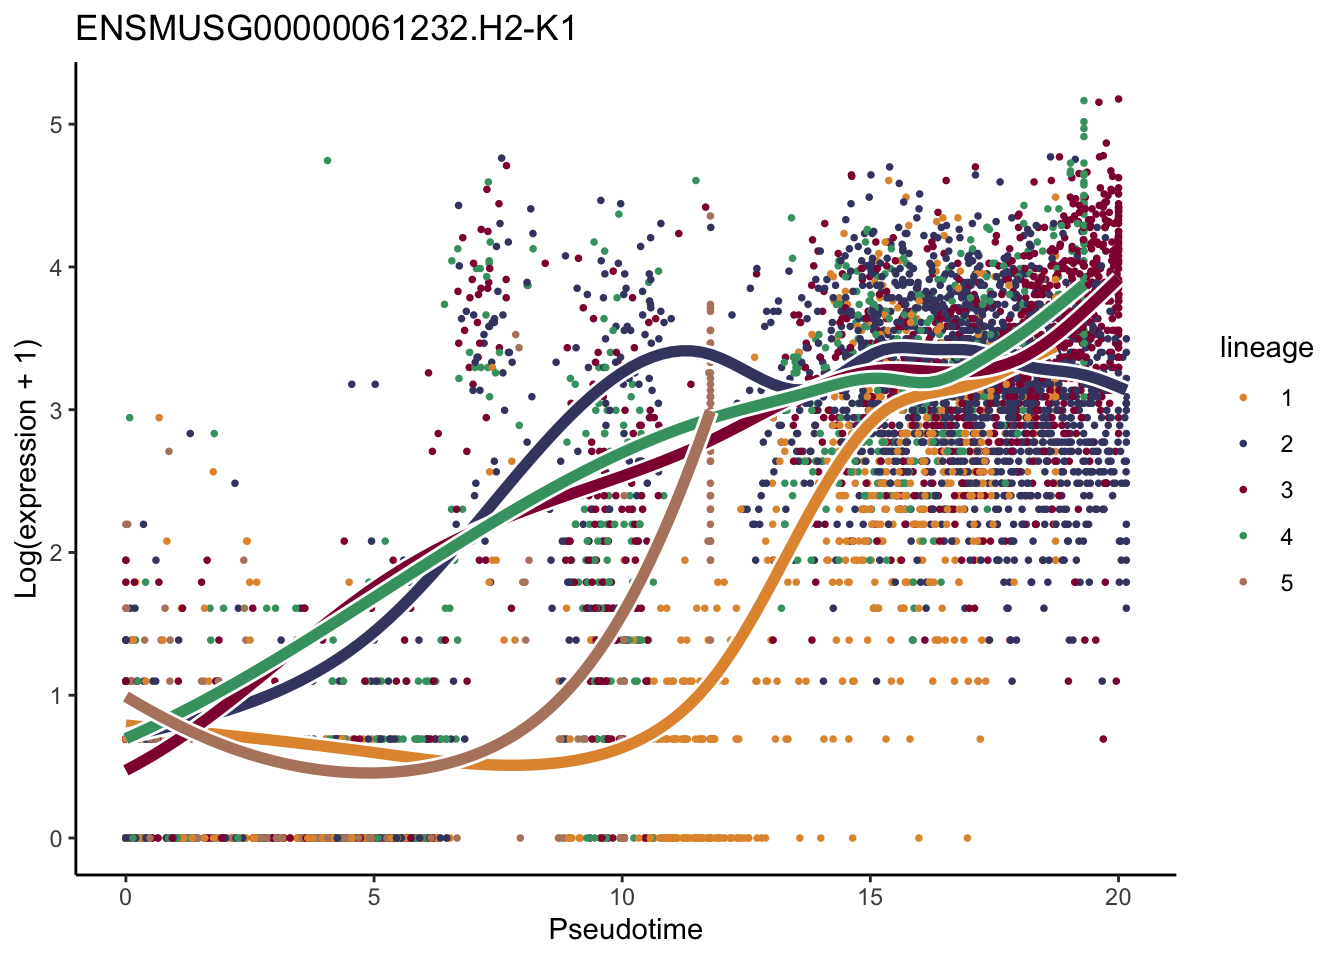
[[42]]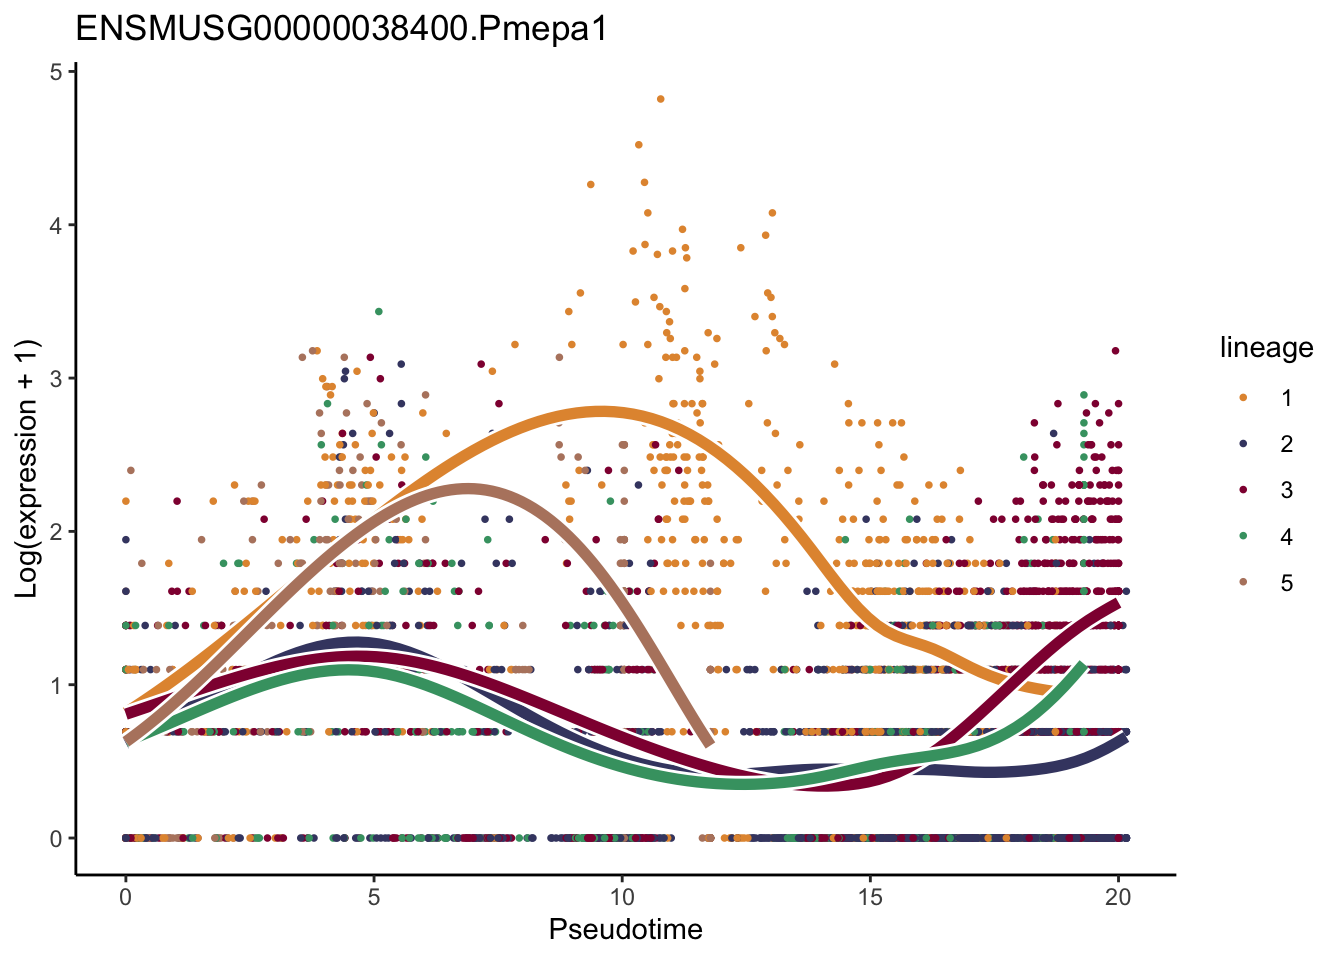
[[43]]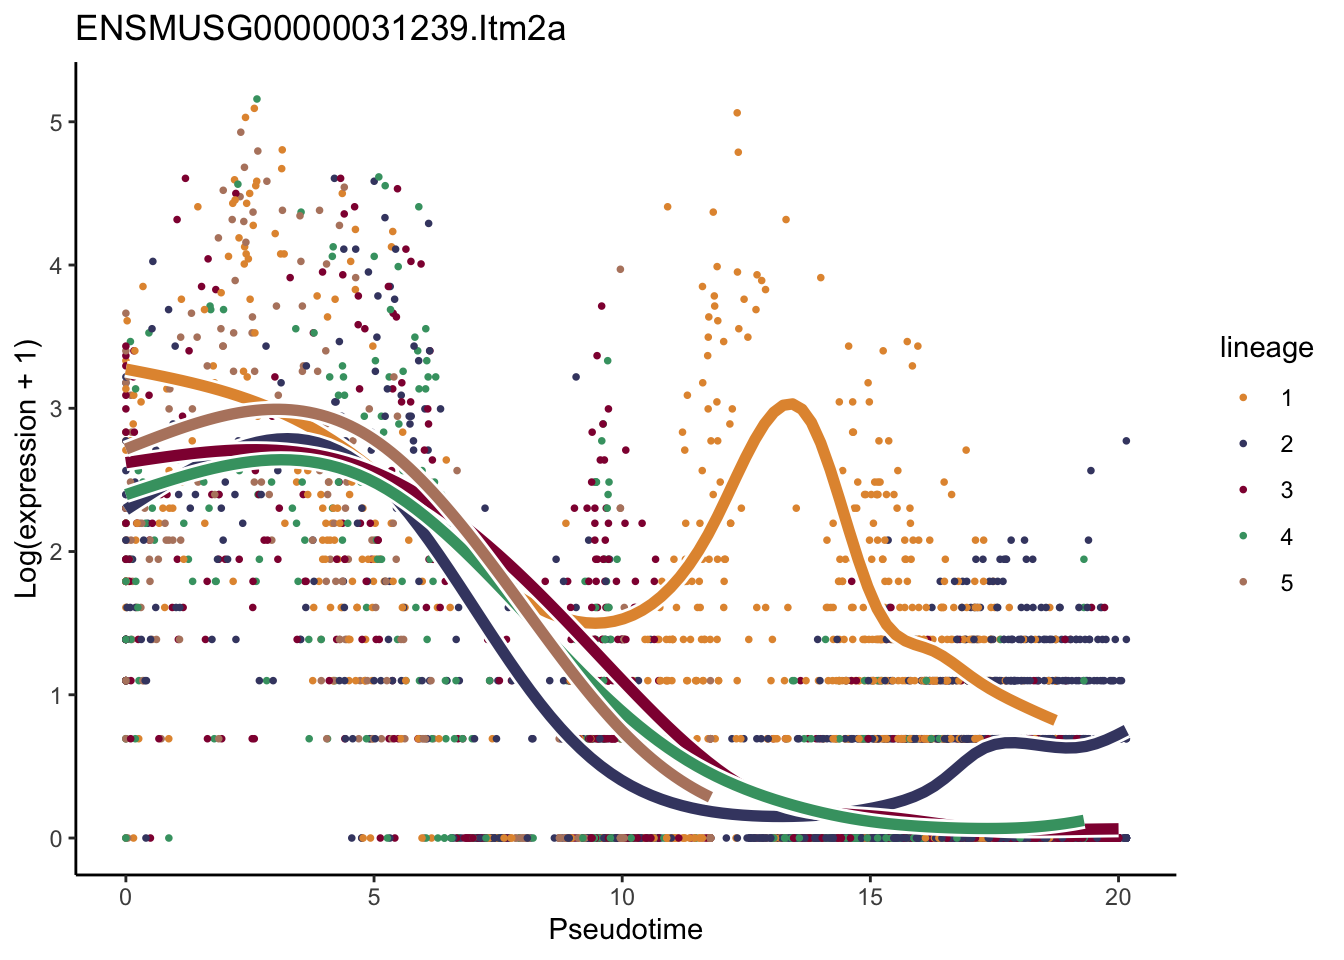
[[44]]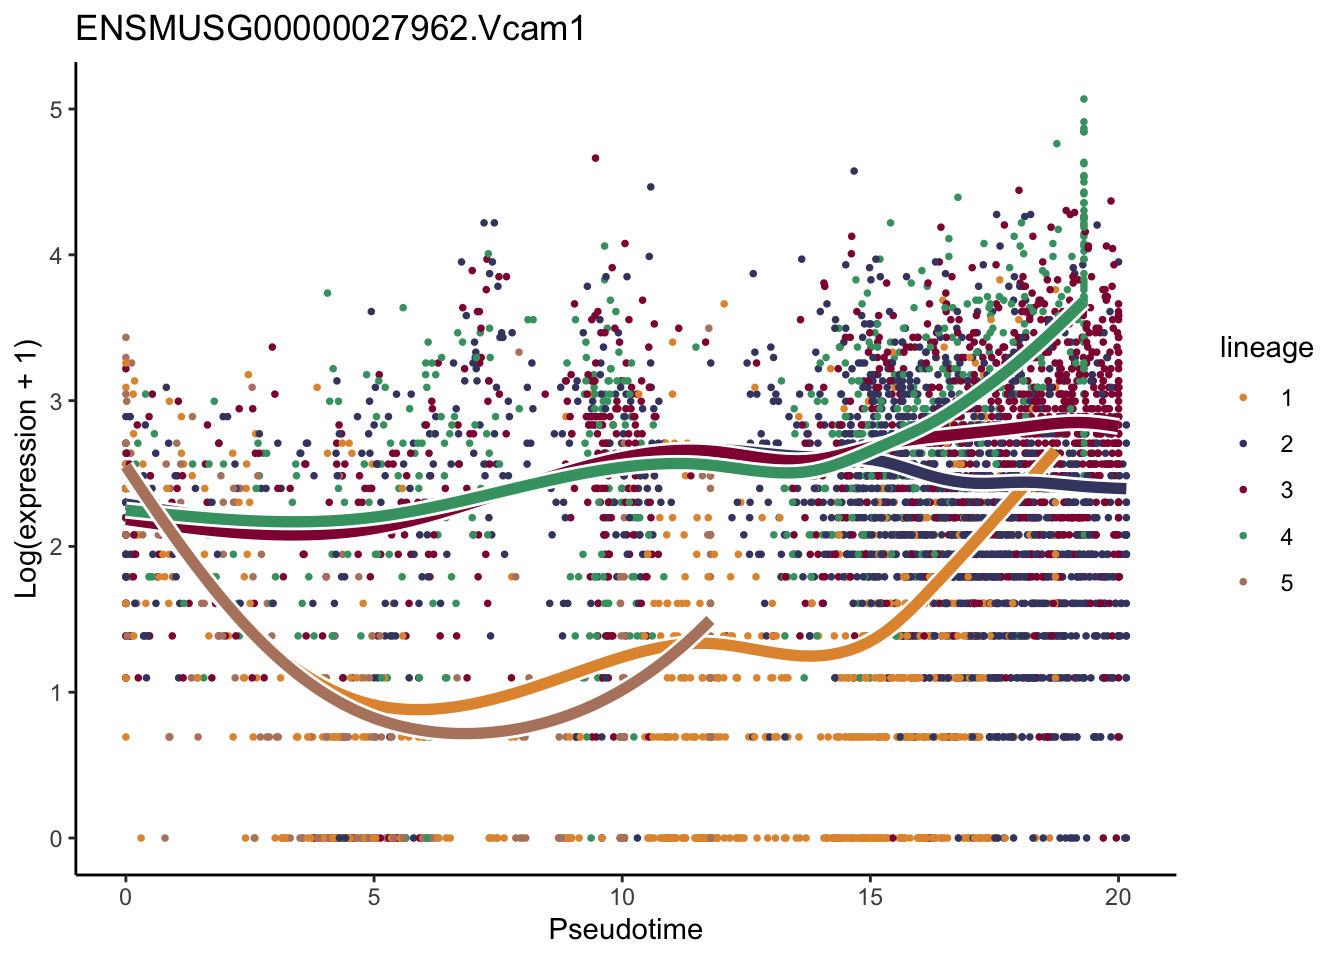
[[45]]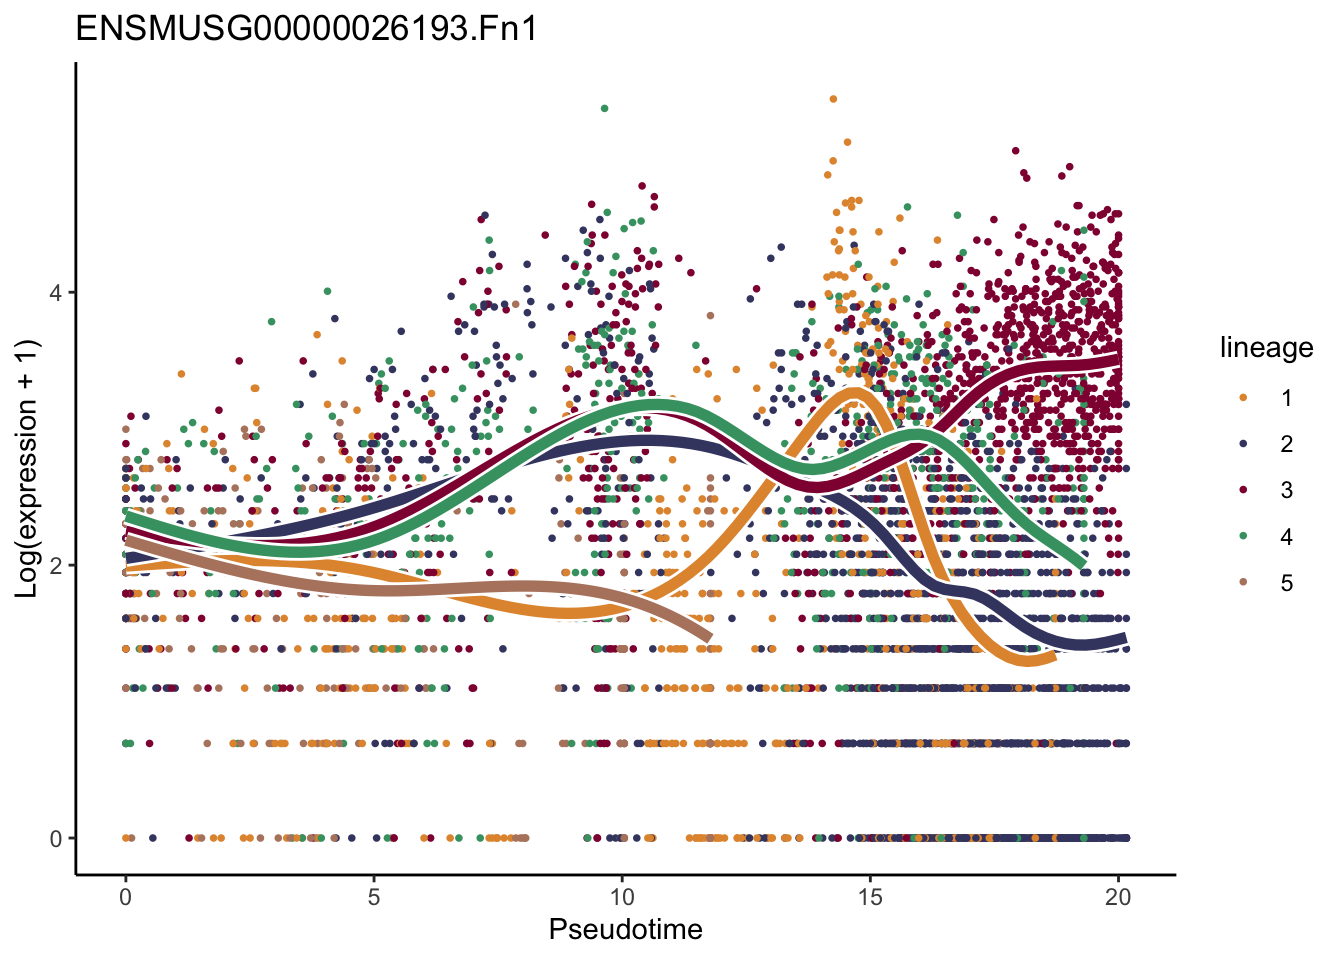
[[46]]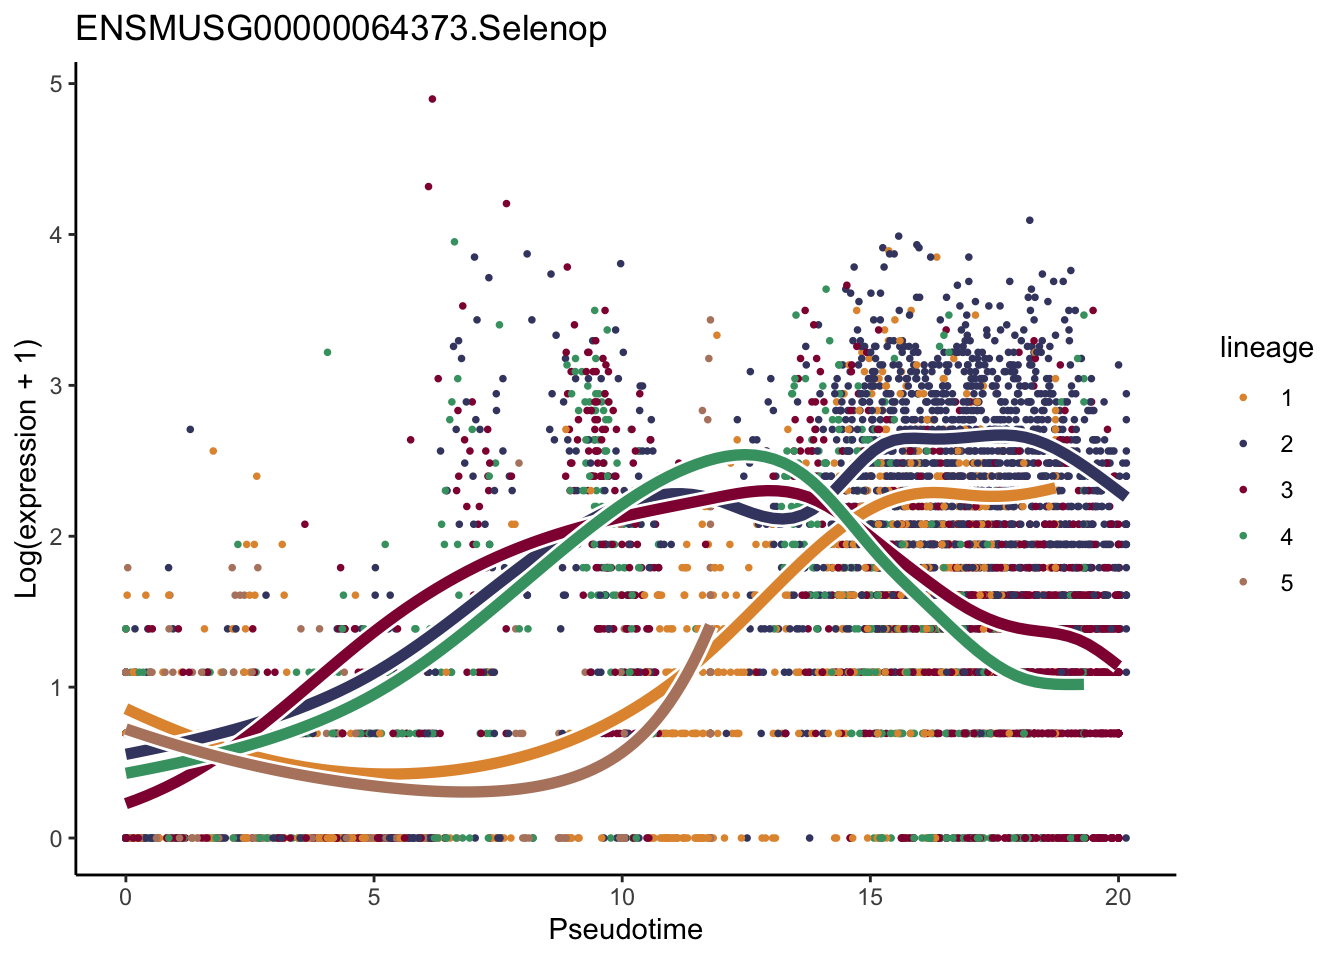
[[47]]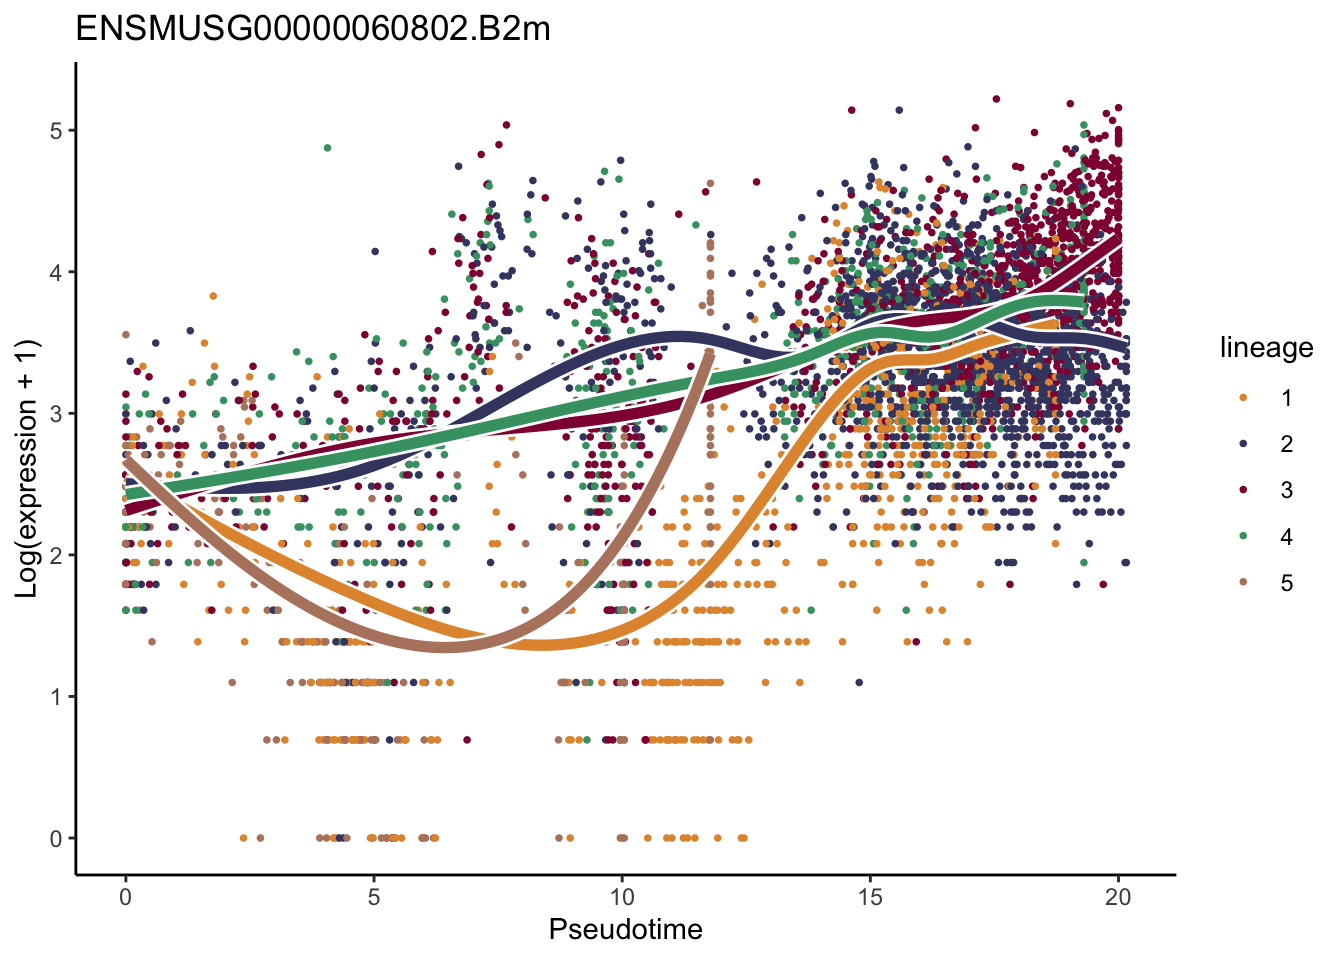
[[48]]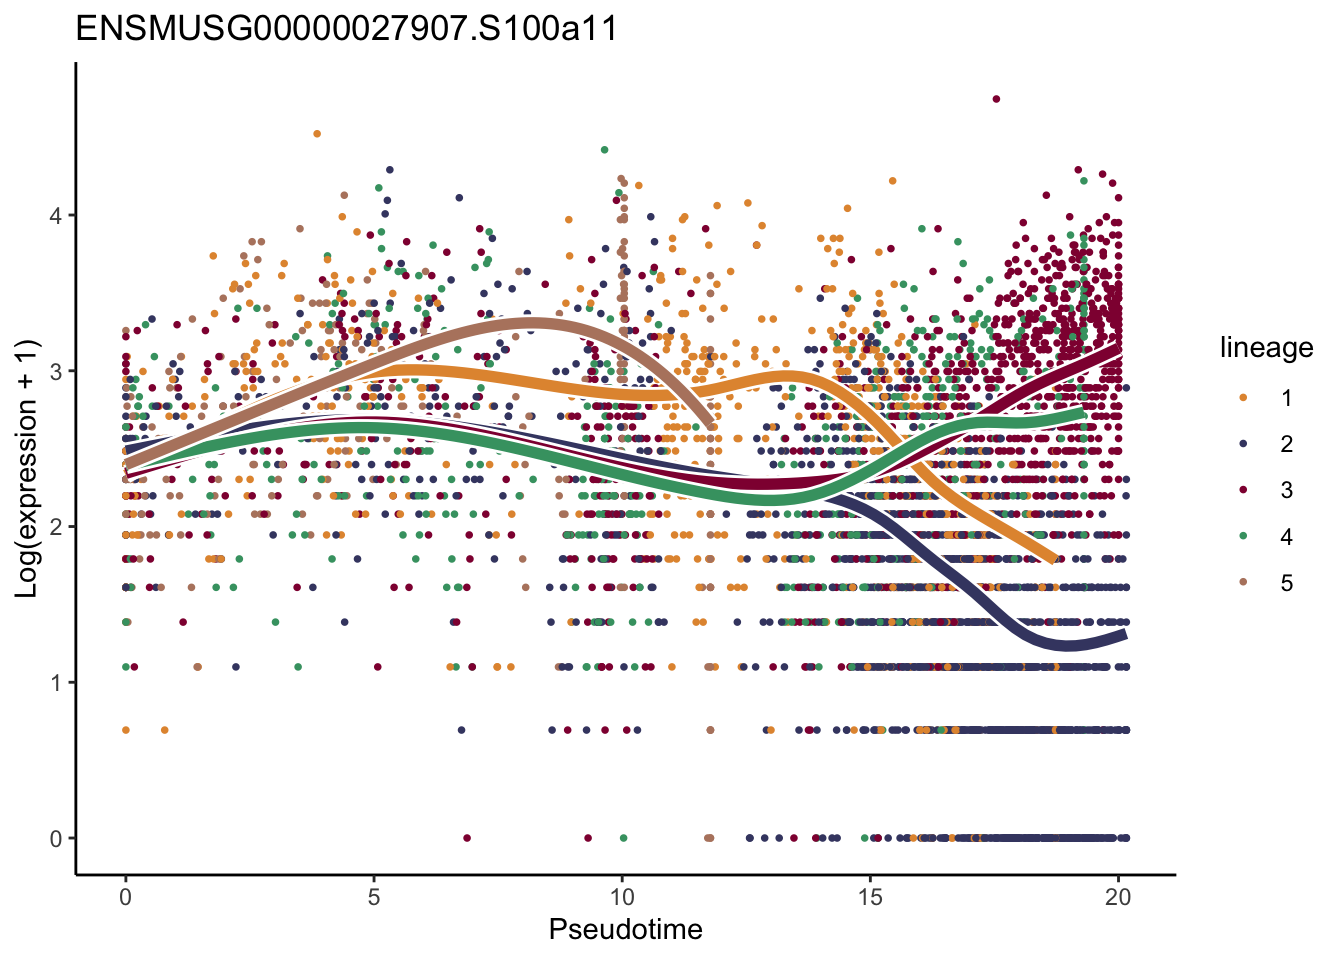
[[49]]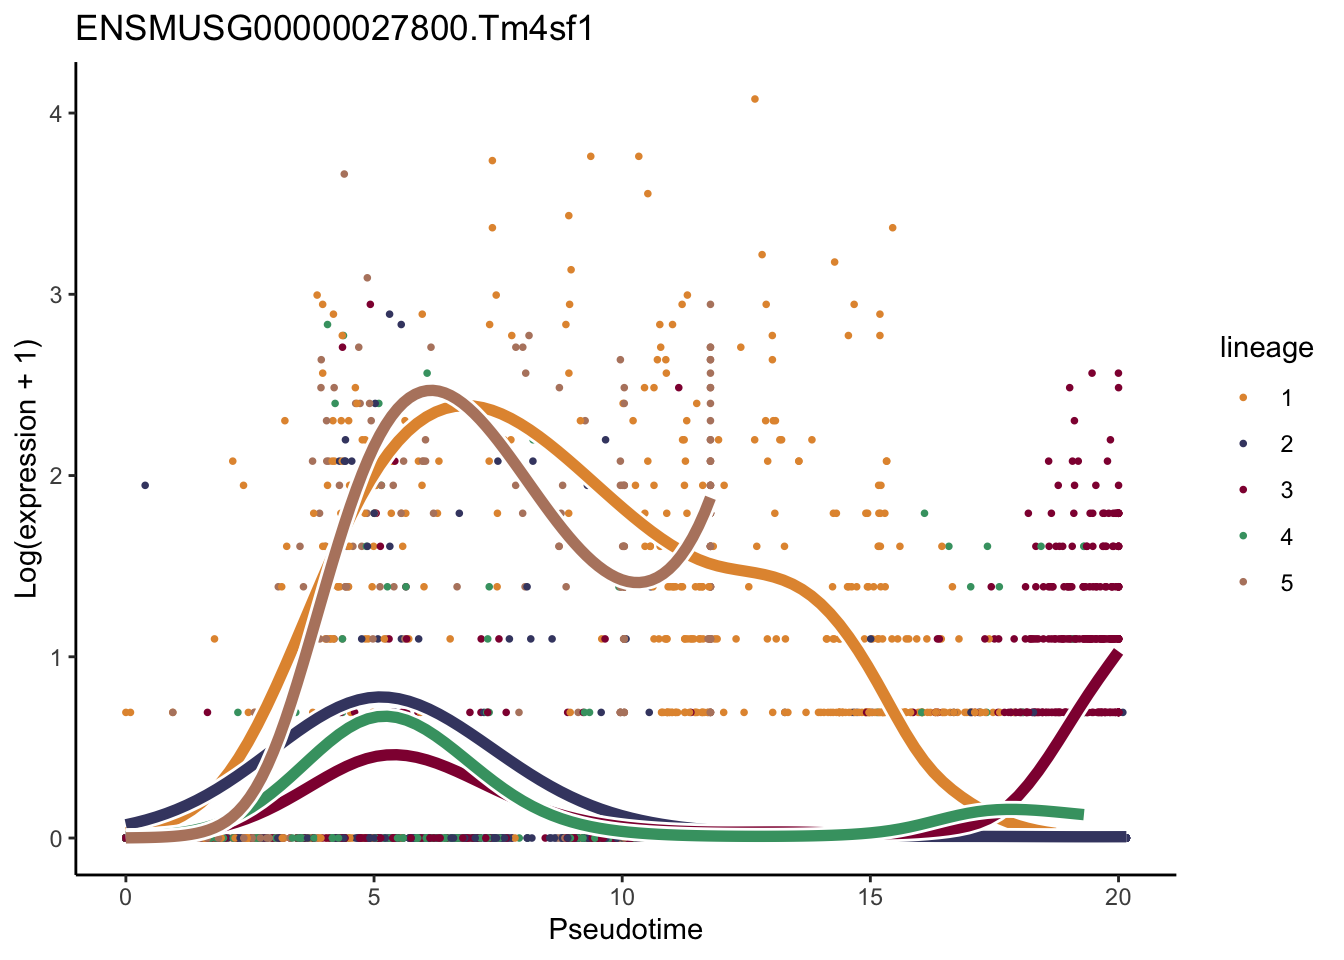
[[50]]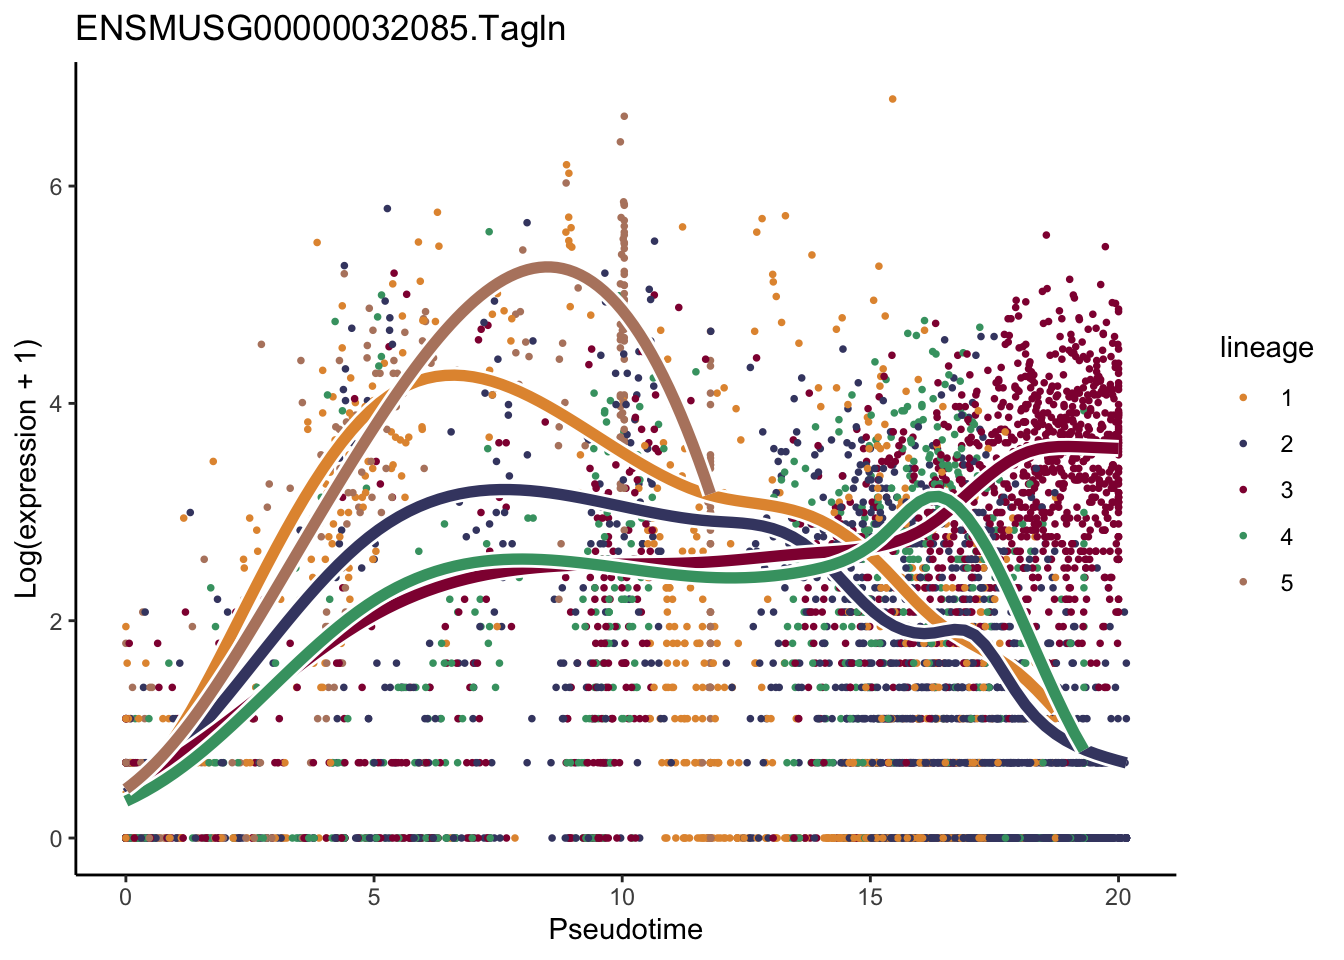
lapply(rankGene[1:50], function(selGene){
  plotGeneCount(SlingshotDataSet(sceSub), counts(sceSub), gene = selGene) +
    scale_color_gradientn( colours = c("#e7e7e7", "#c98599", "#8a062d"))
})
[[1]]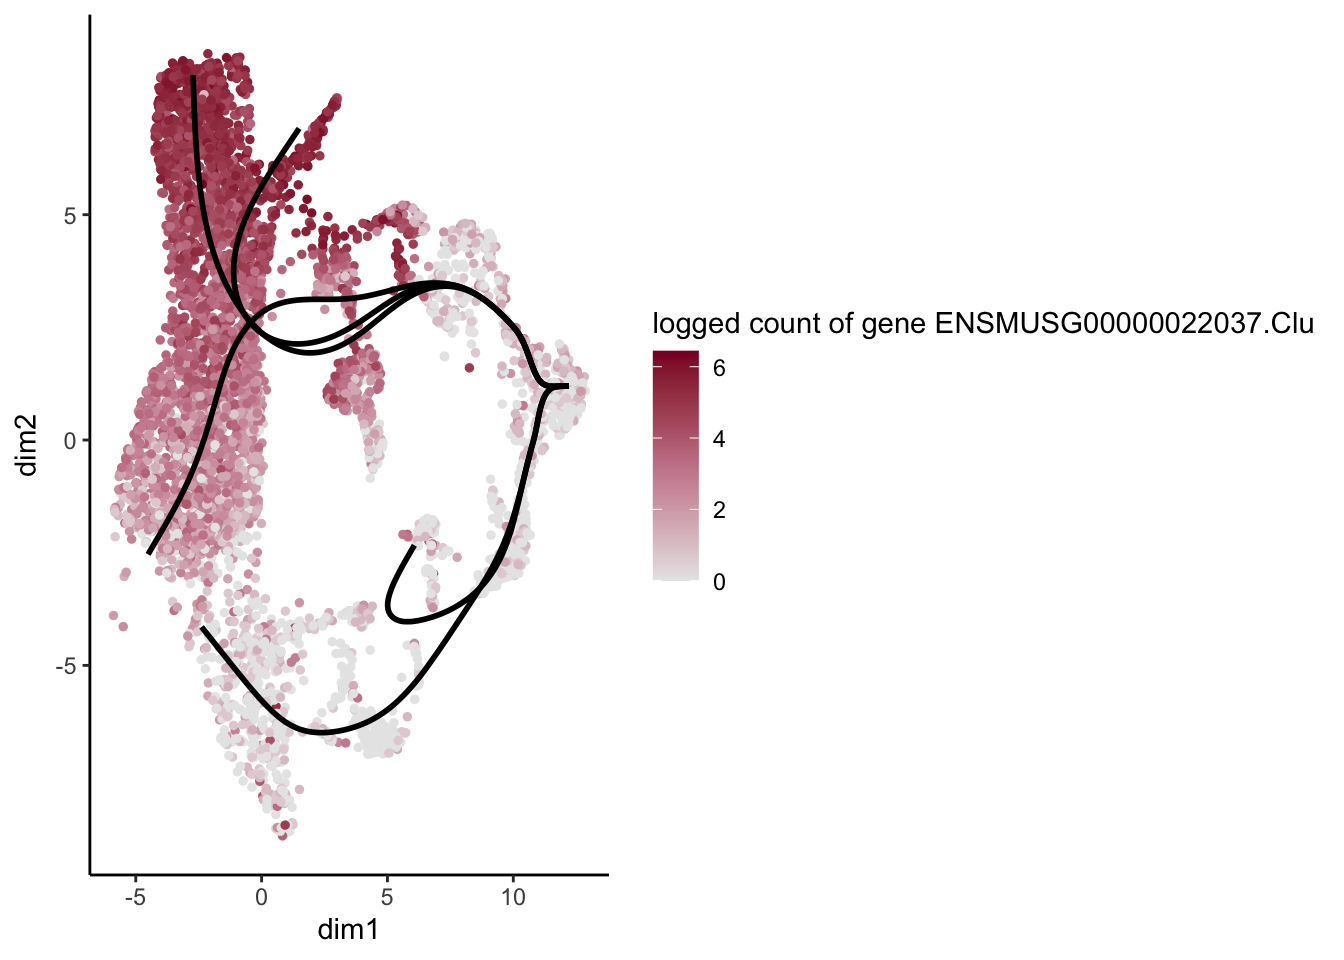
[[2]]
[[3]]
[[4]]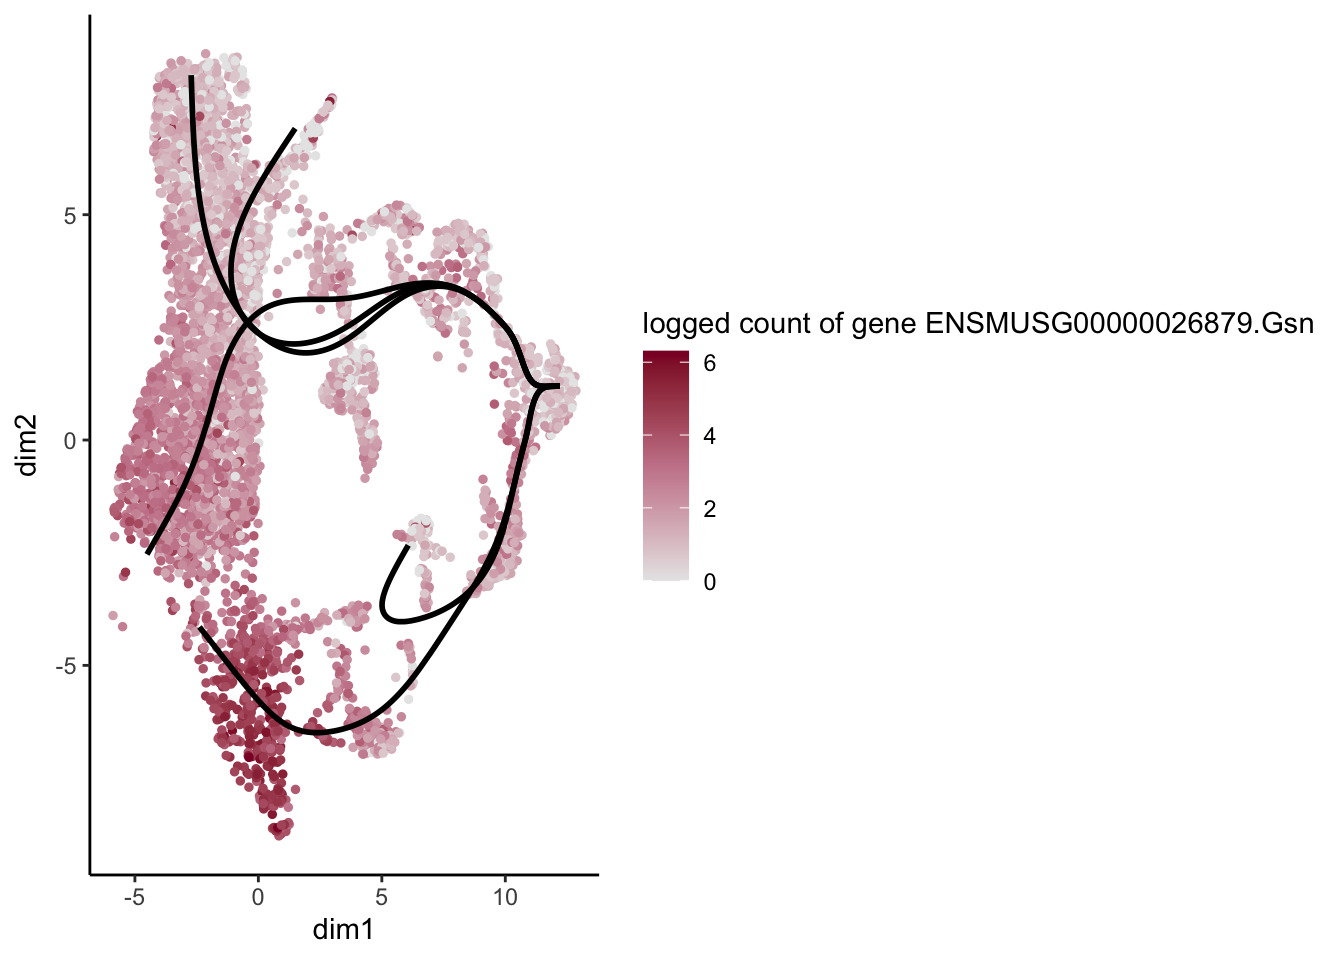
[[5]]
[[6]]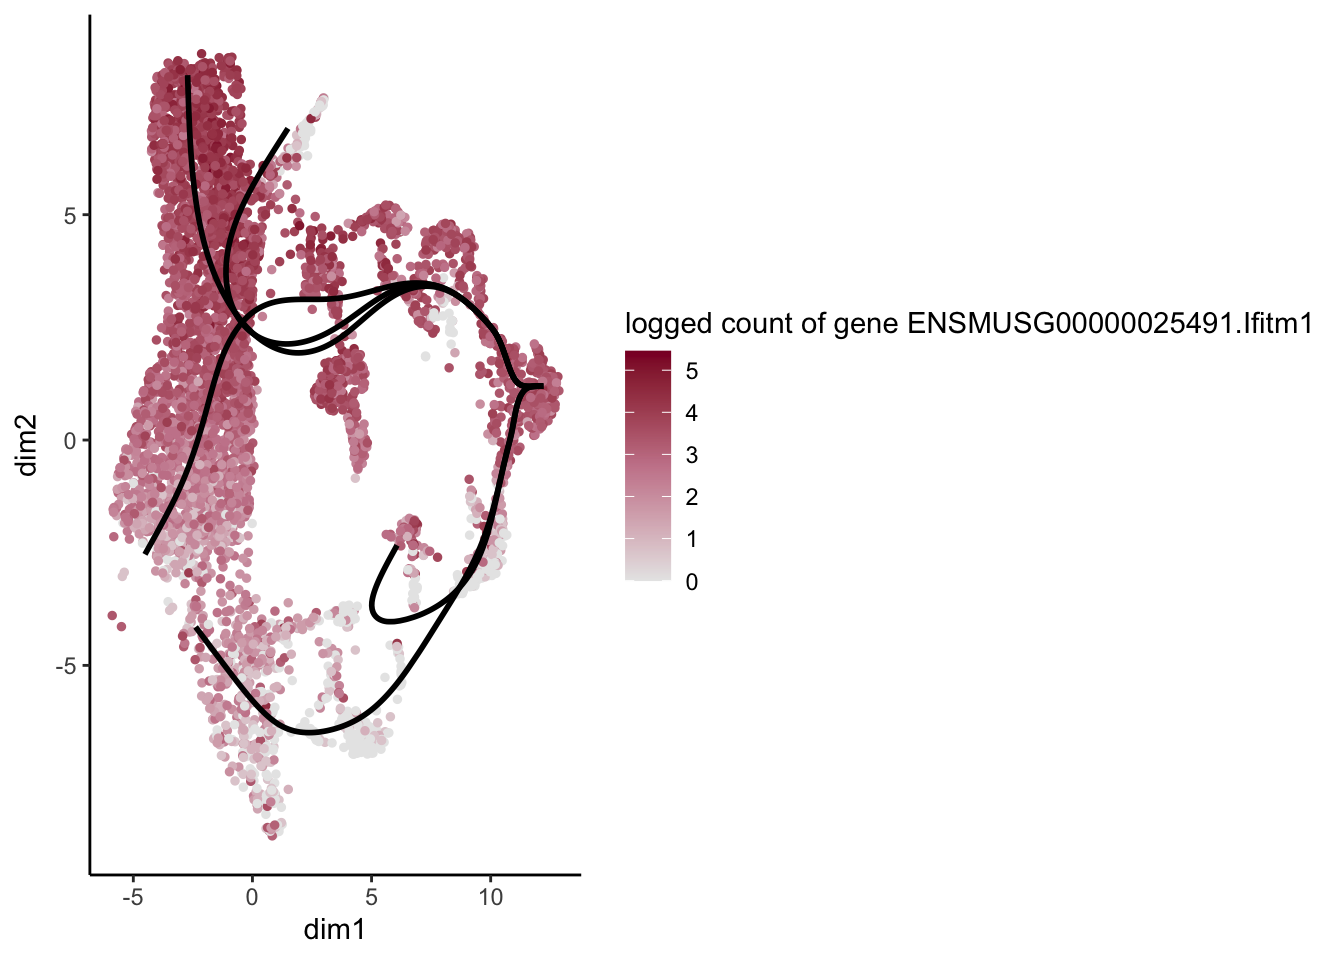
[[7]]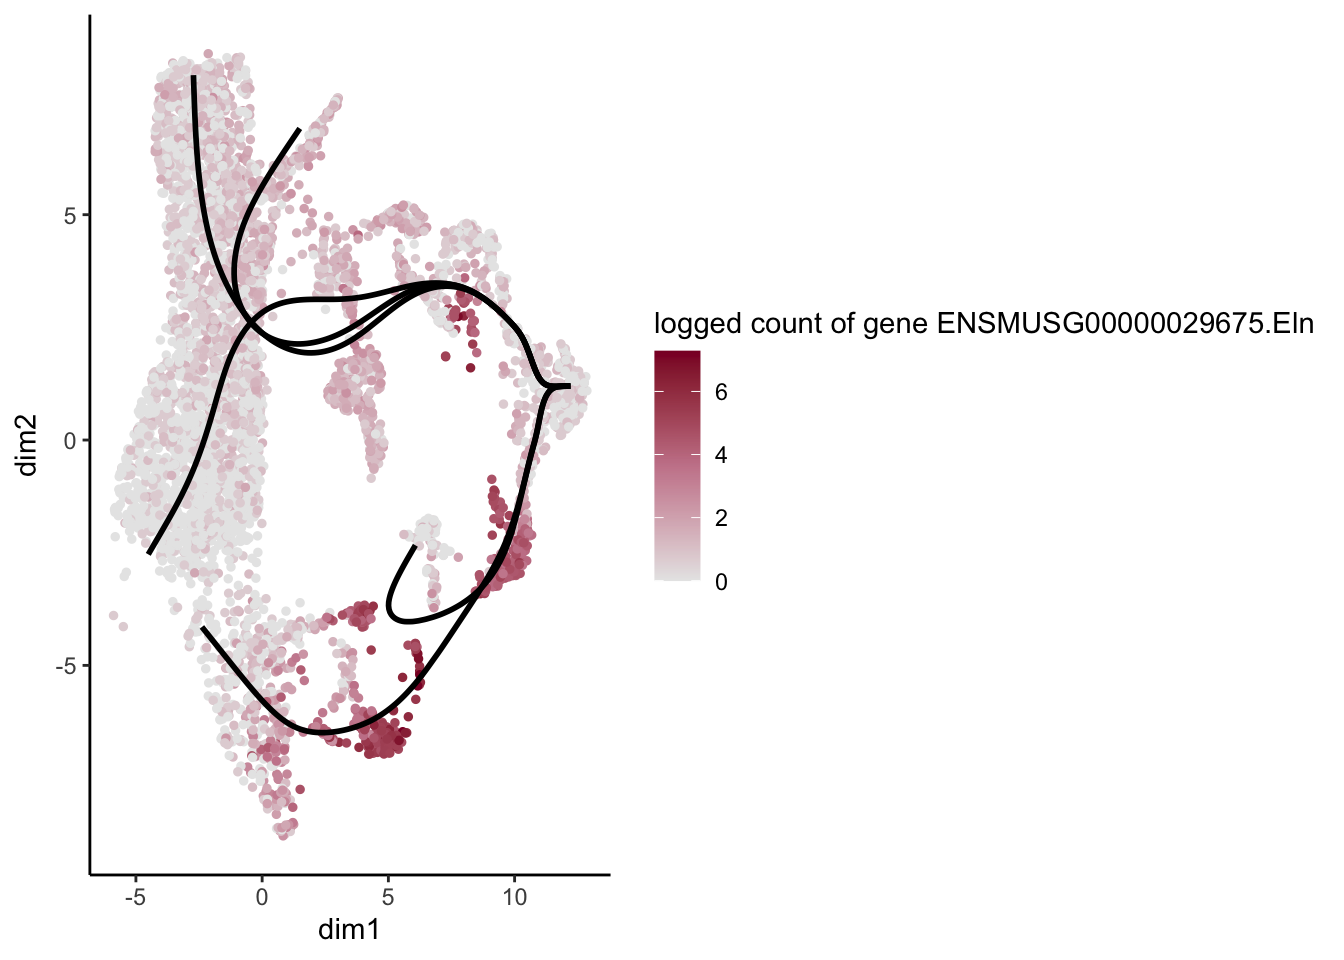
[[8]]
[[9]]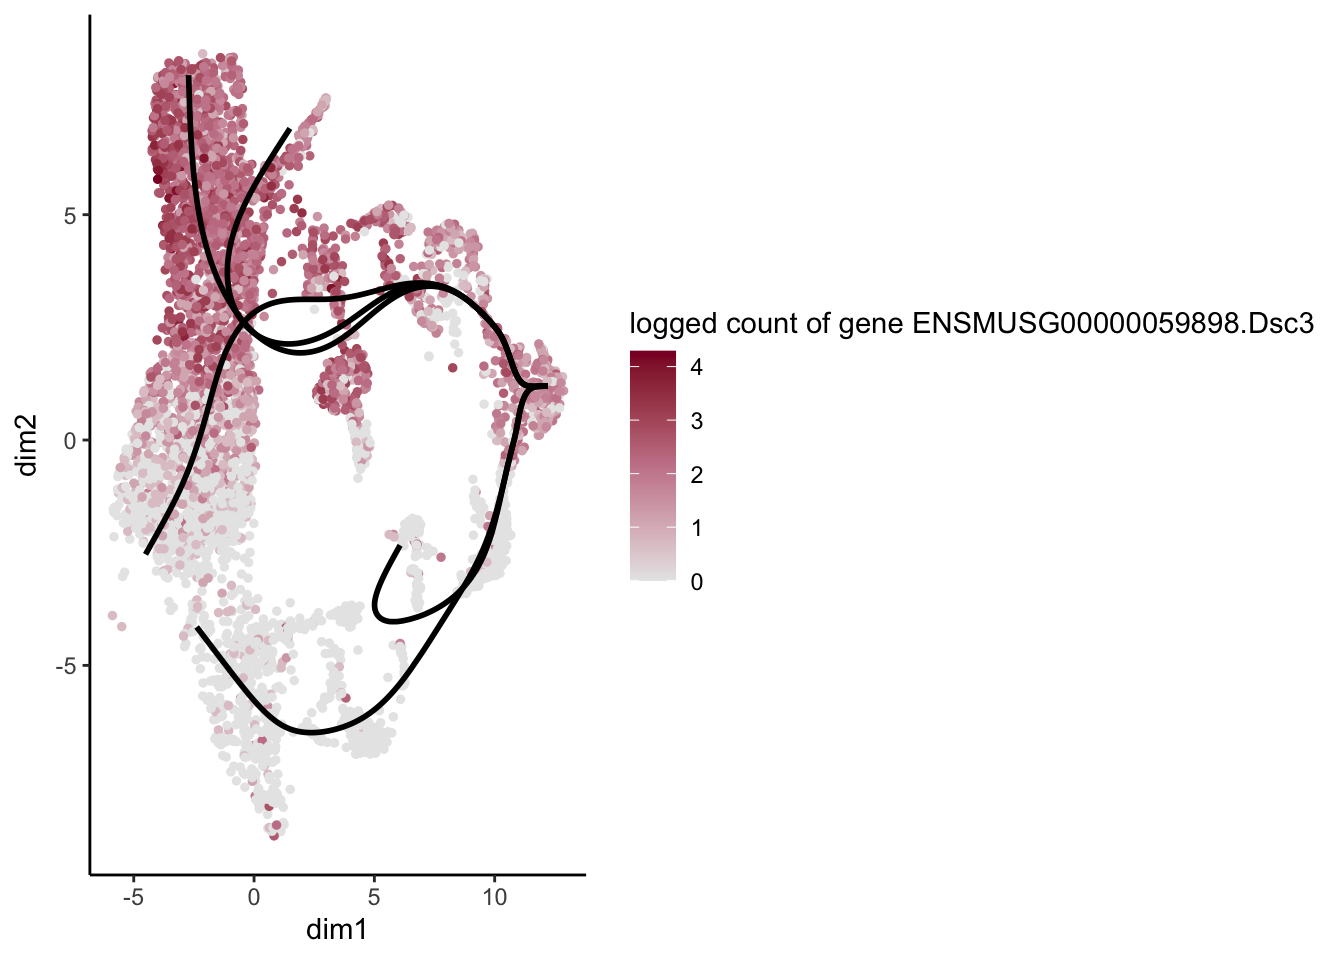
[[10]]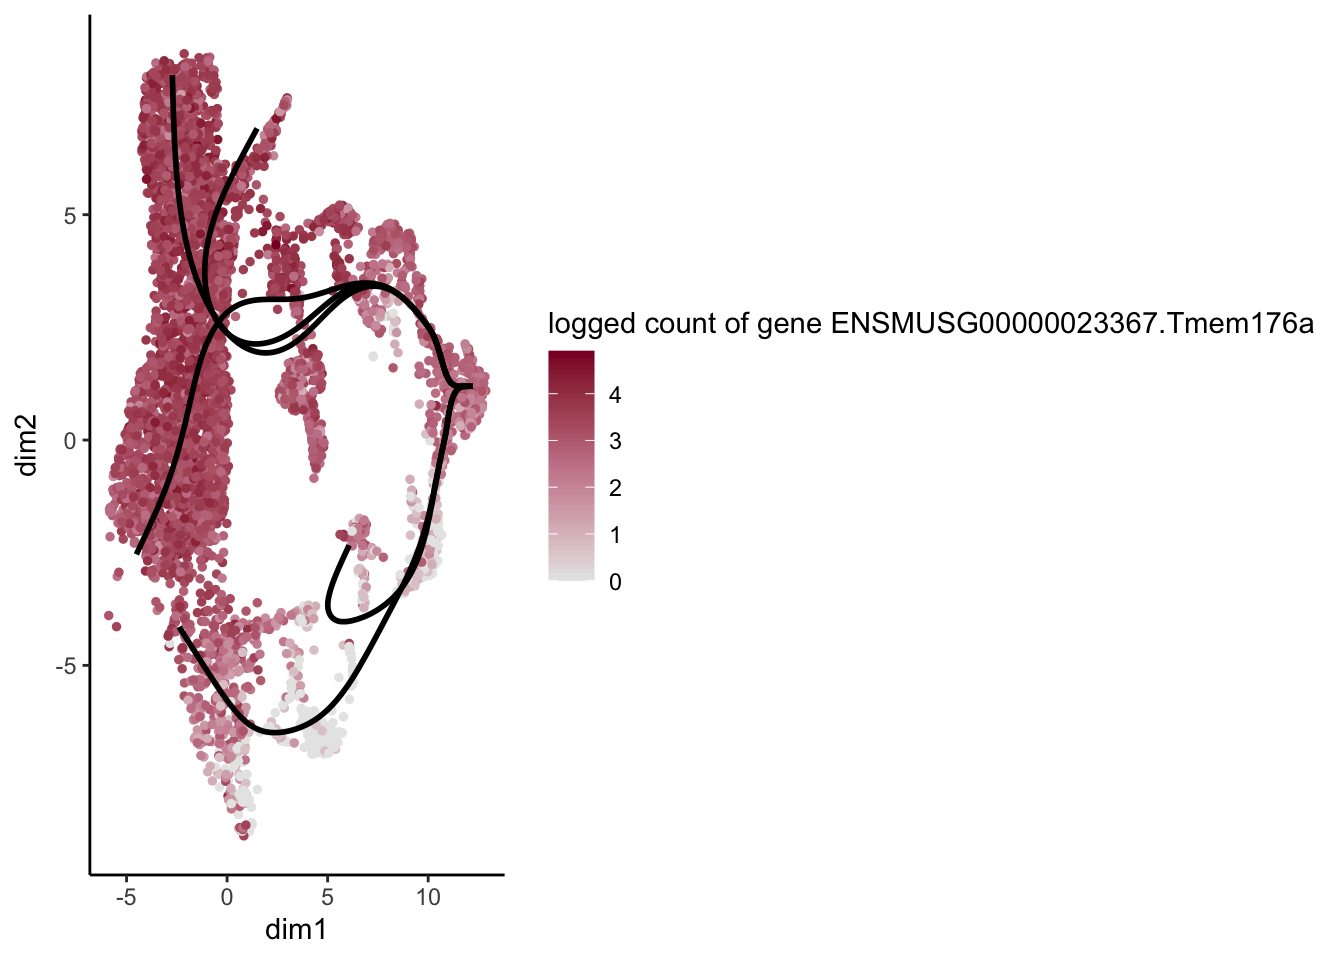
[[11]]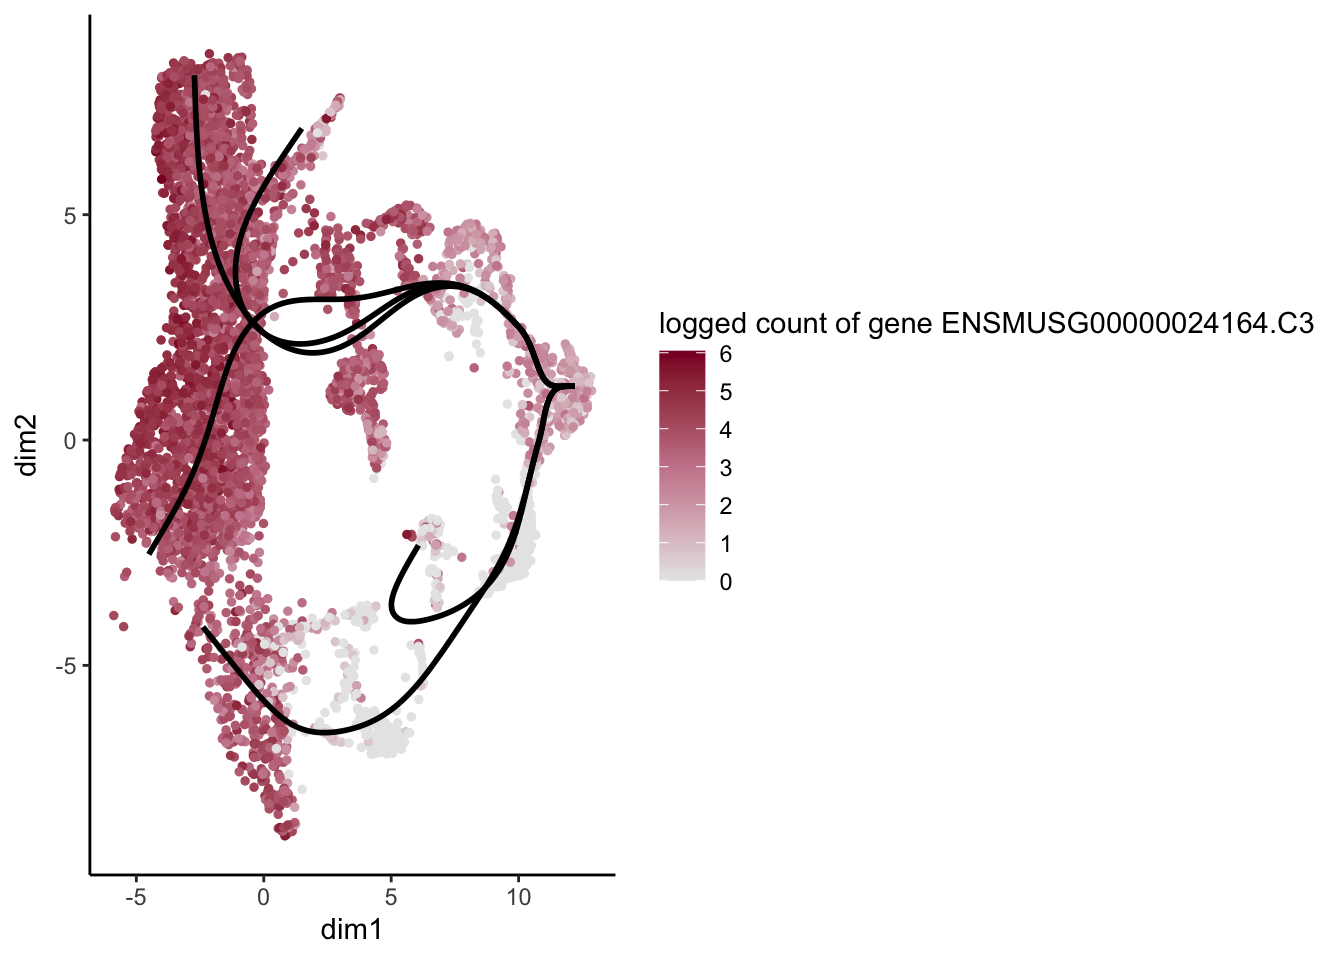
[[12]]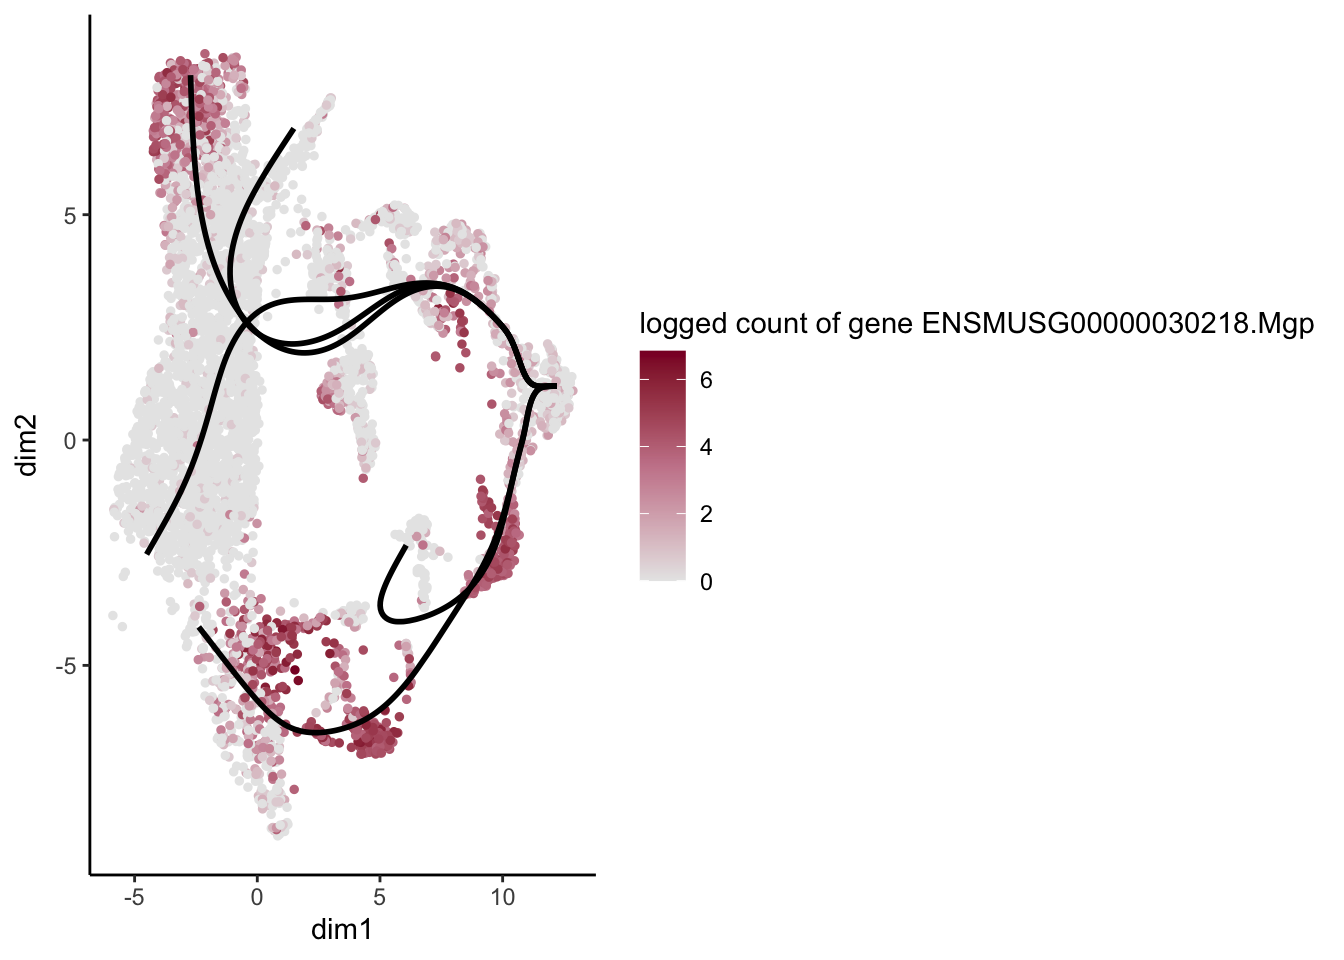
[[13]]
[[14]]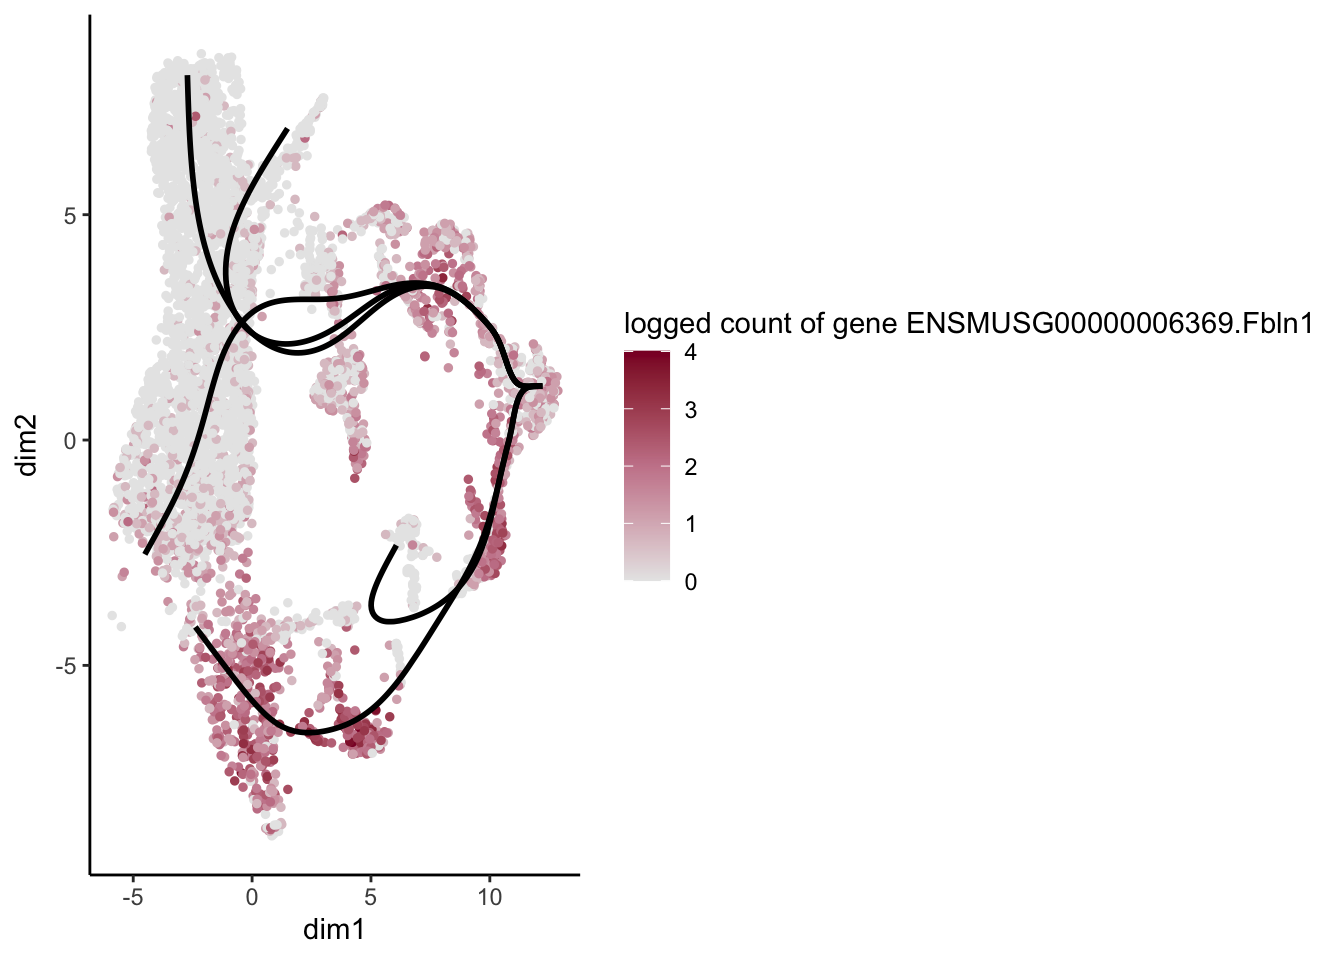
[[15]]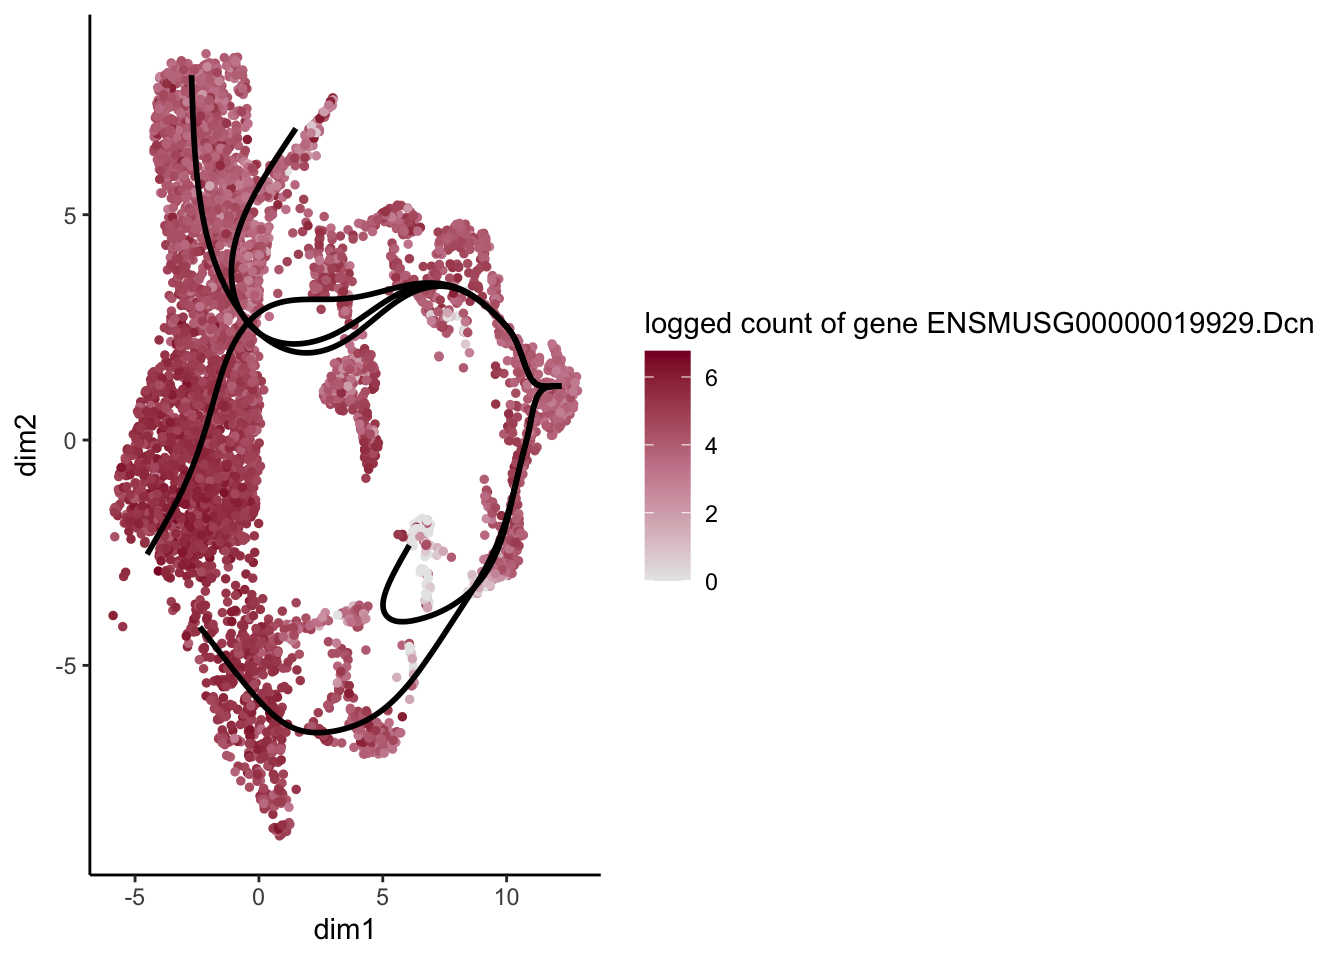
[[16]]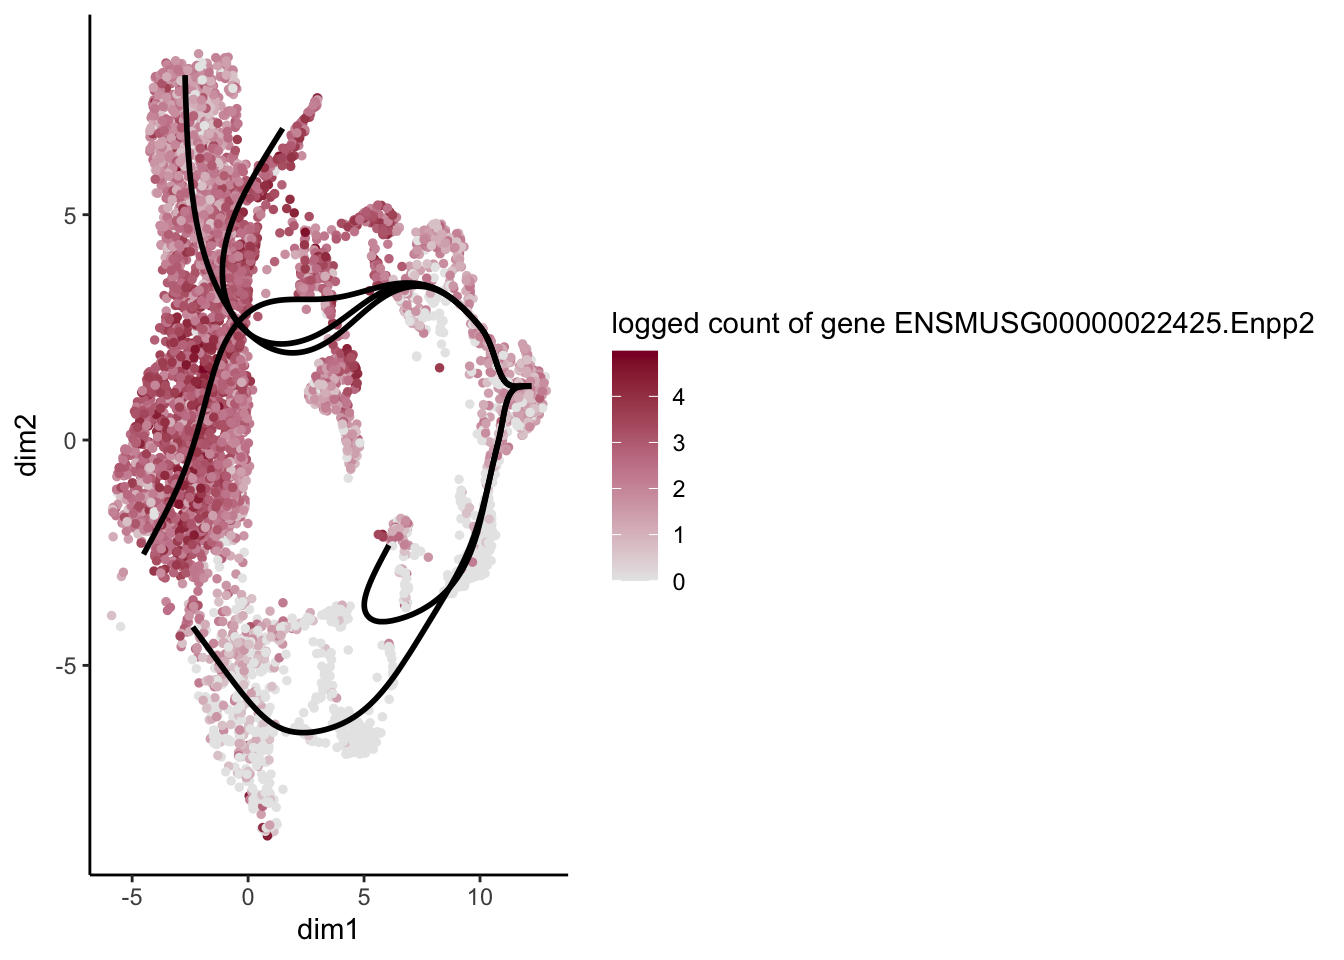
[[17]]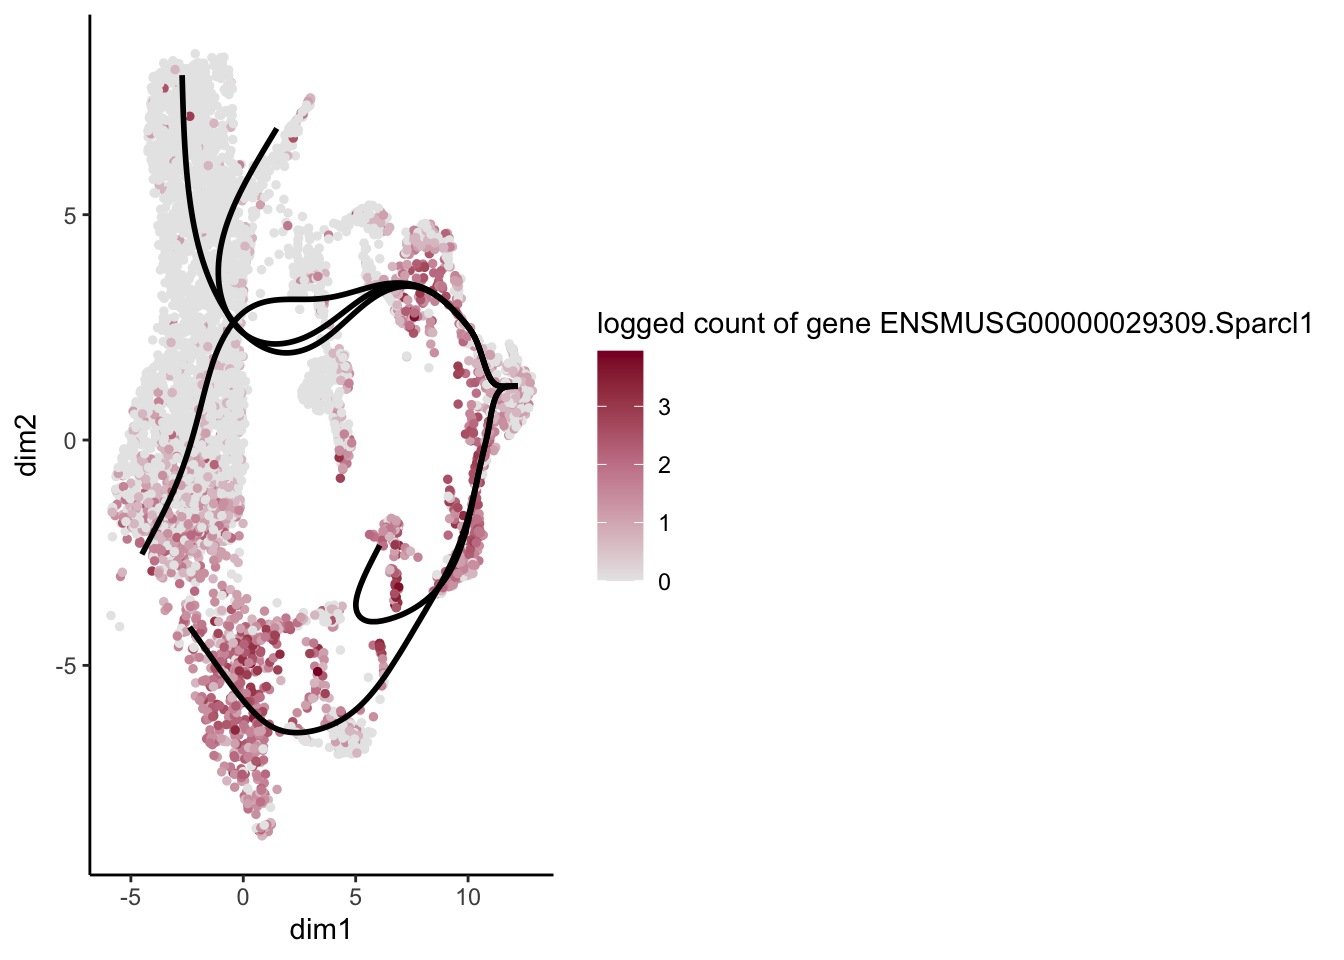
[[18]]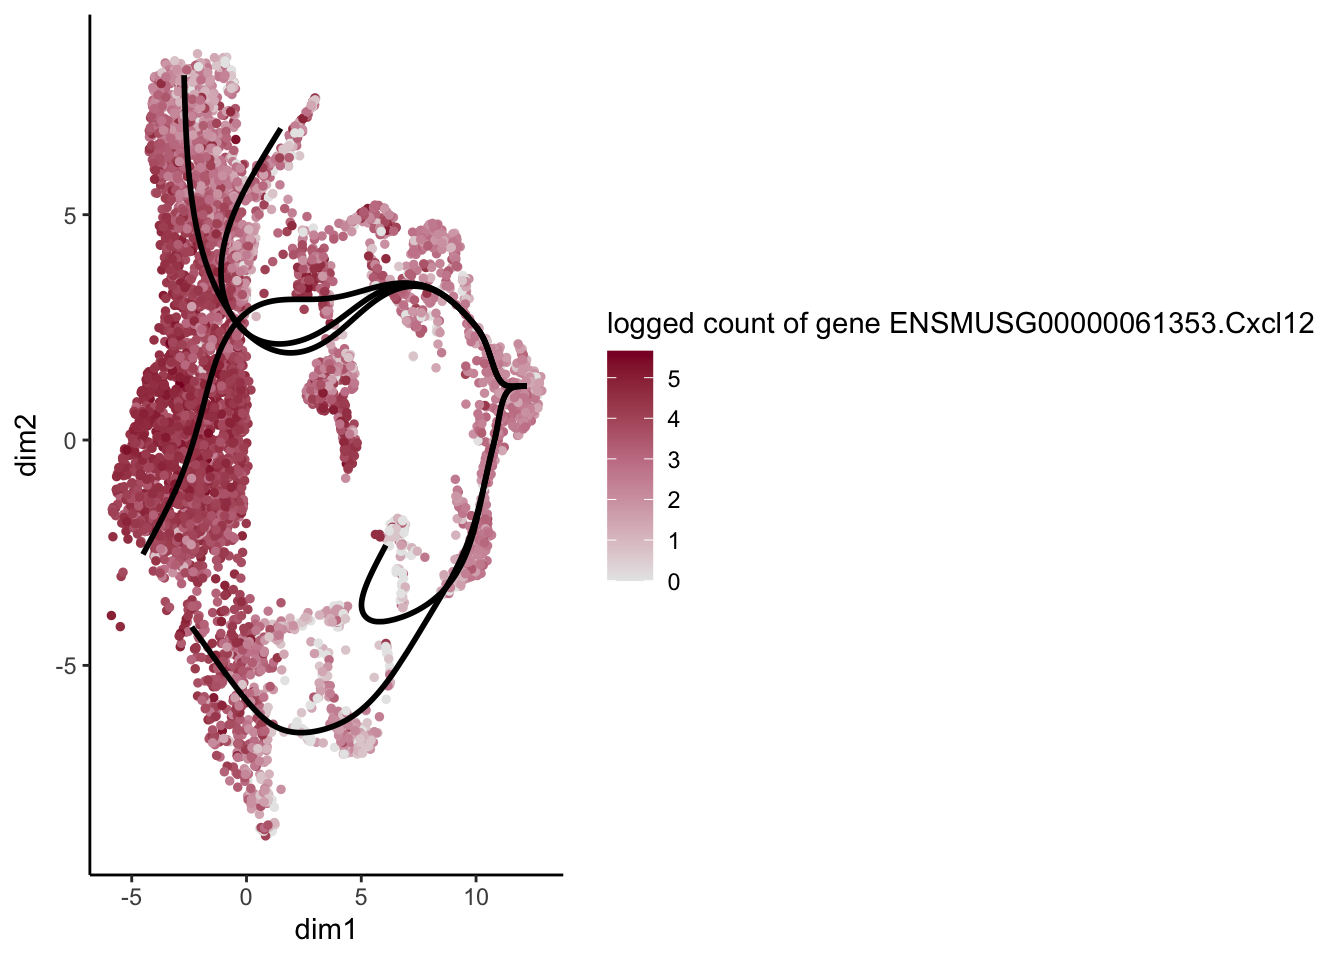
[[19]]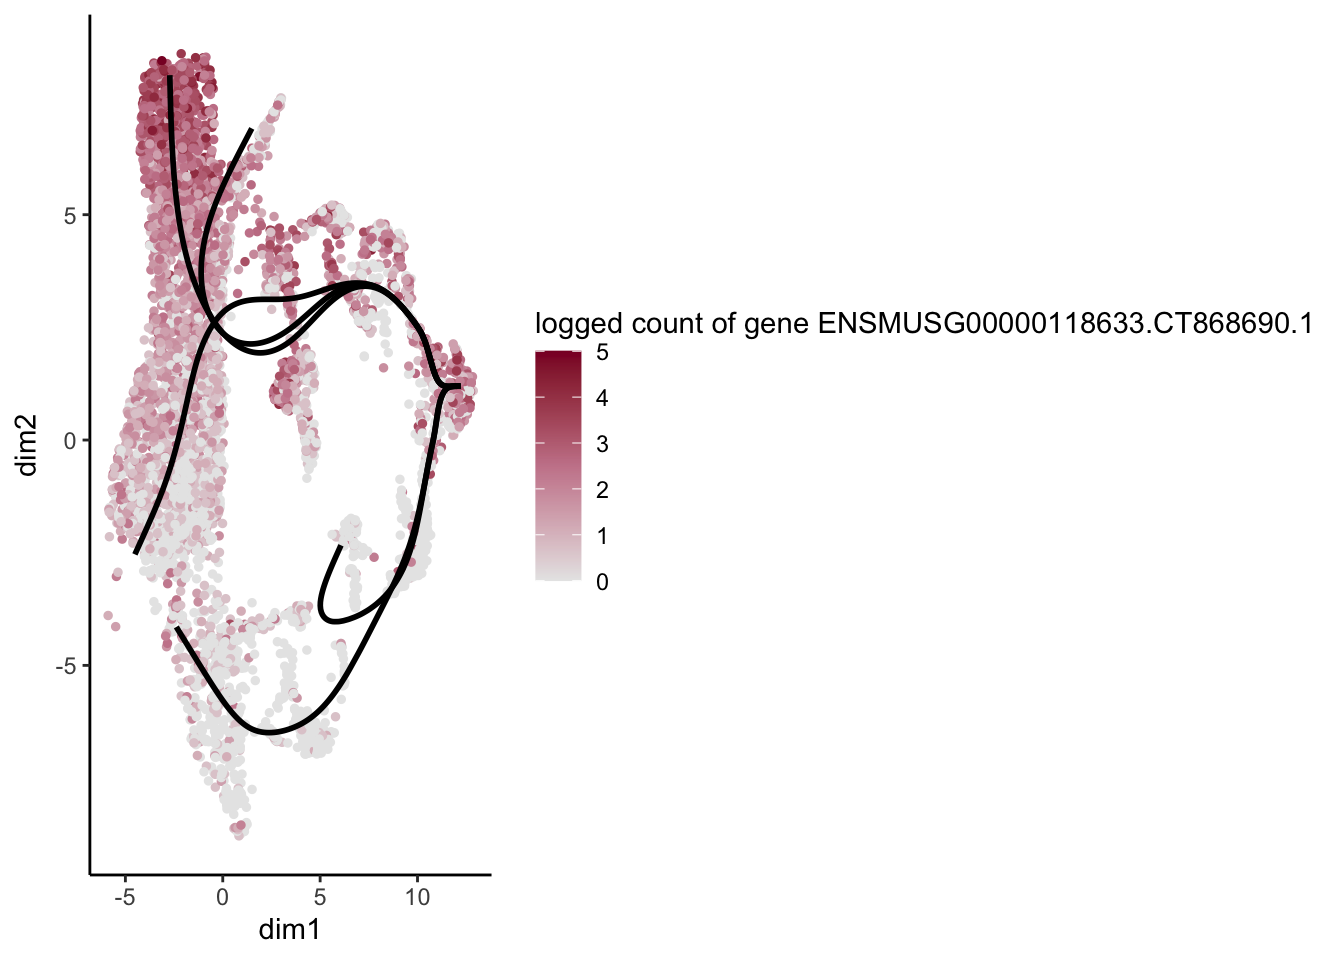
[[20]]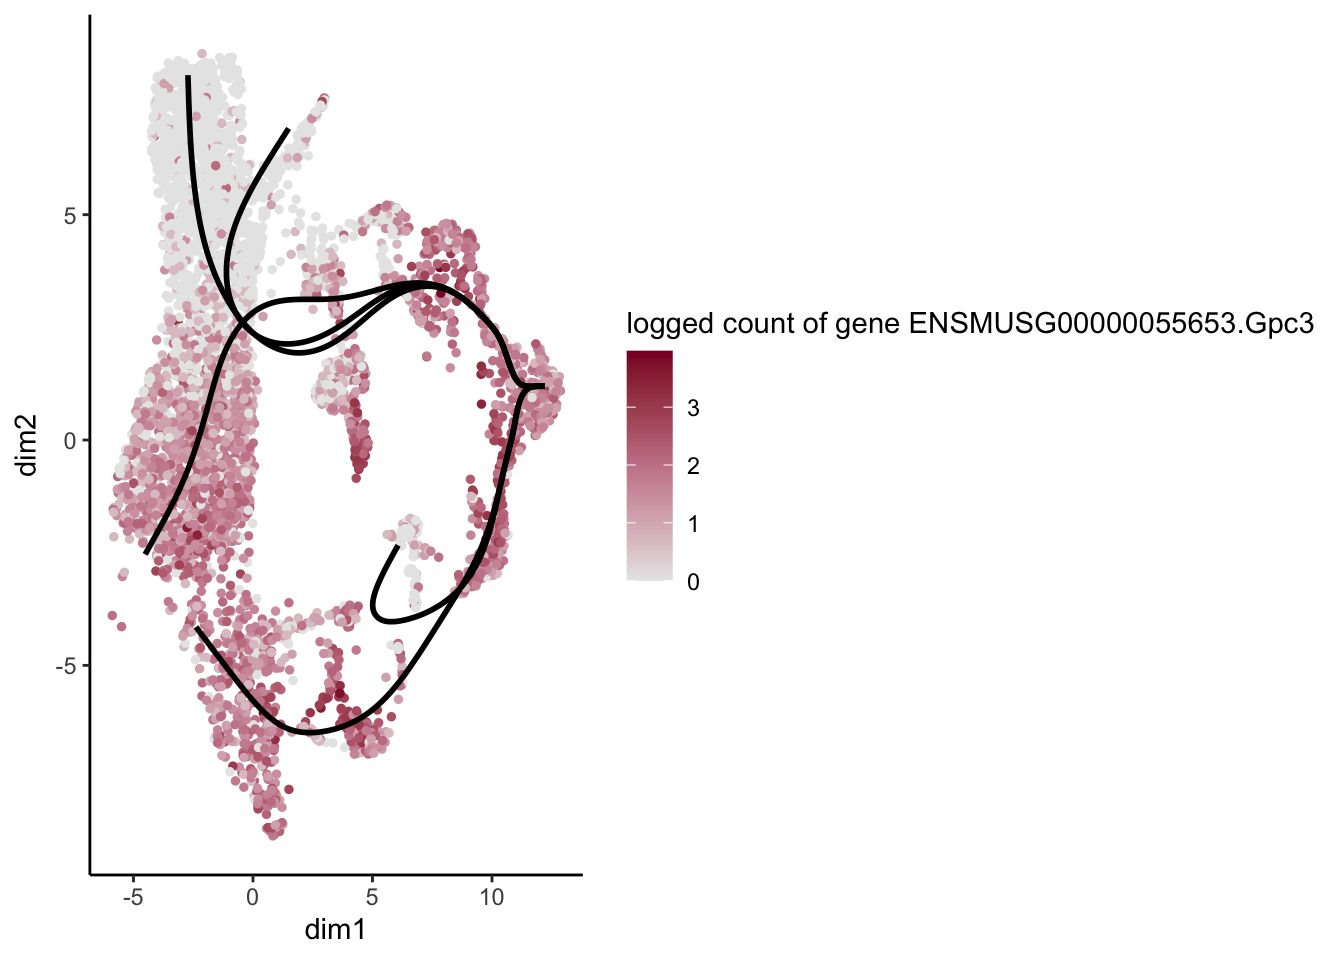
[[21]]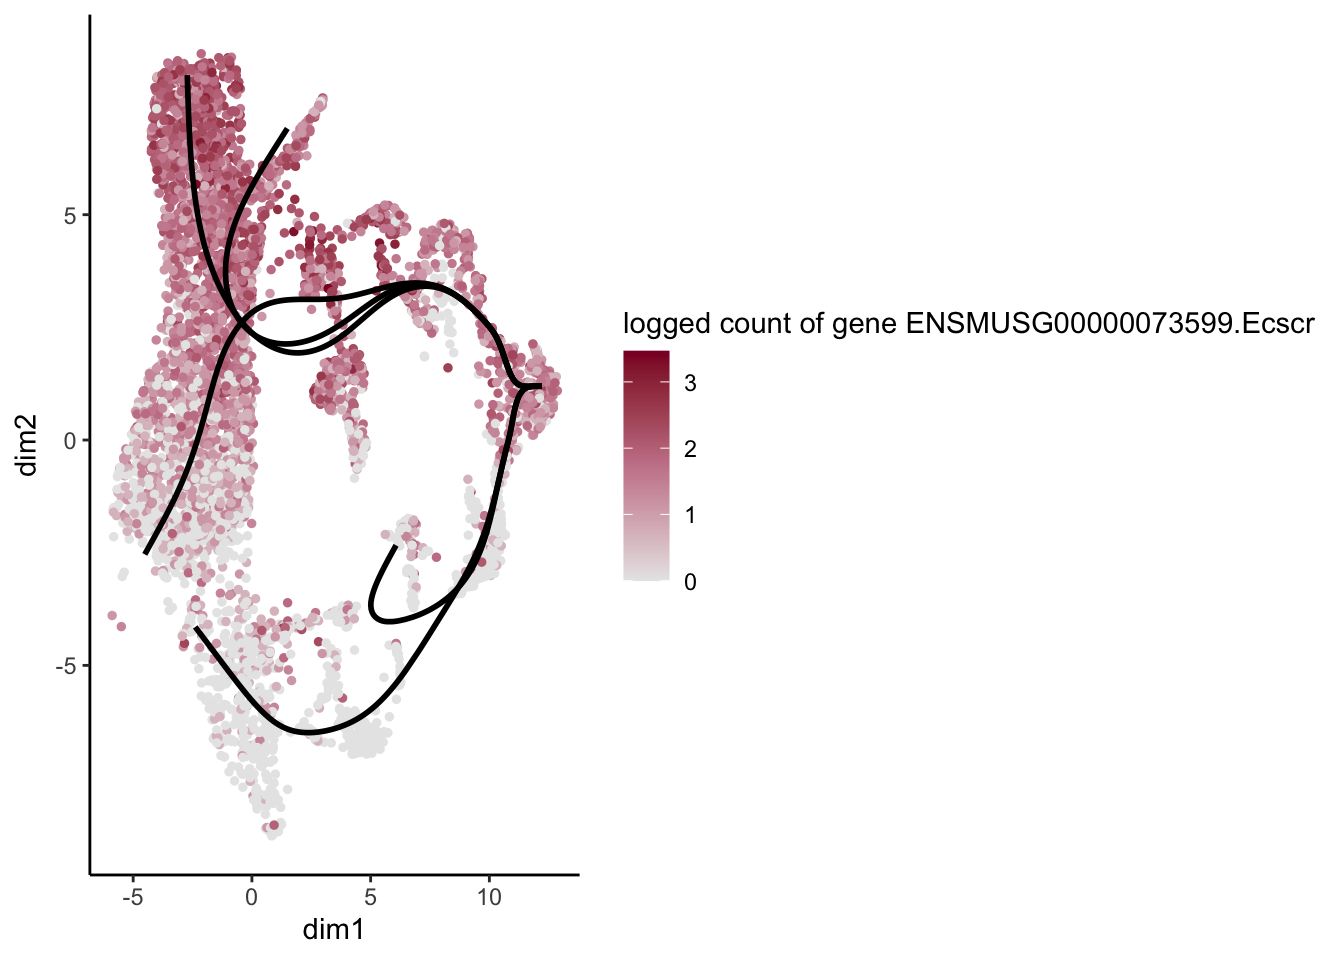
[[22]]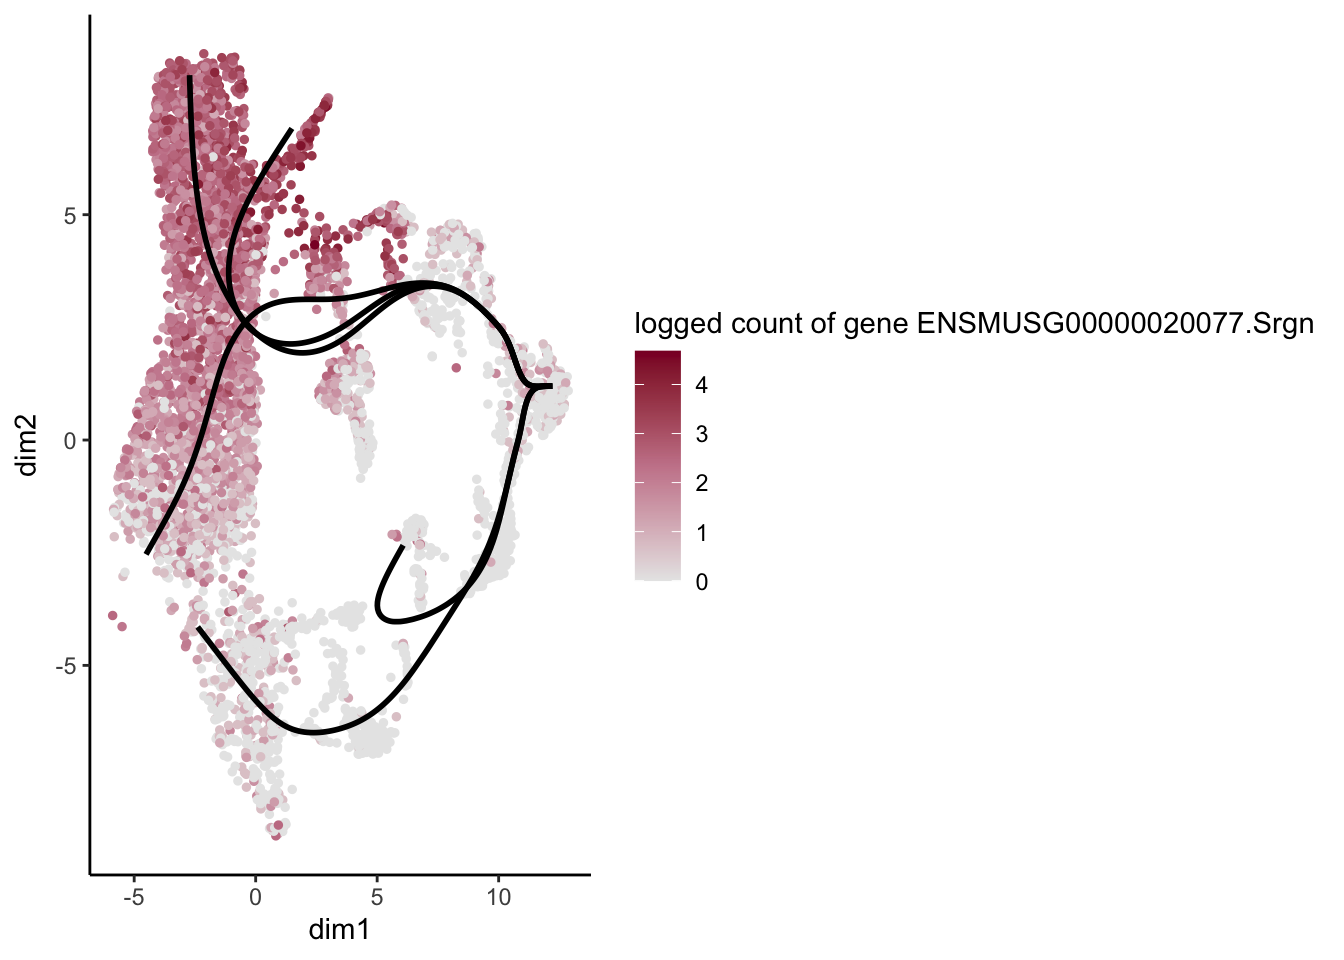
[[23]]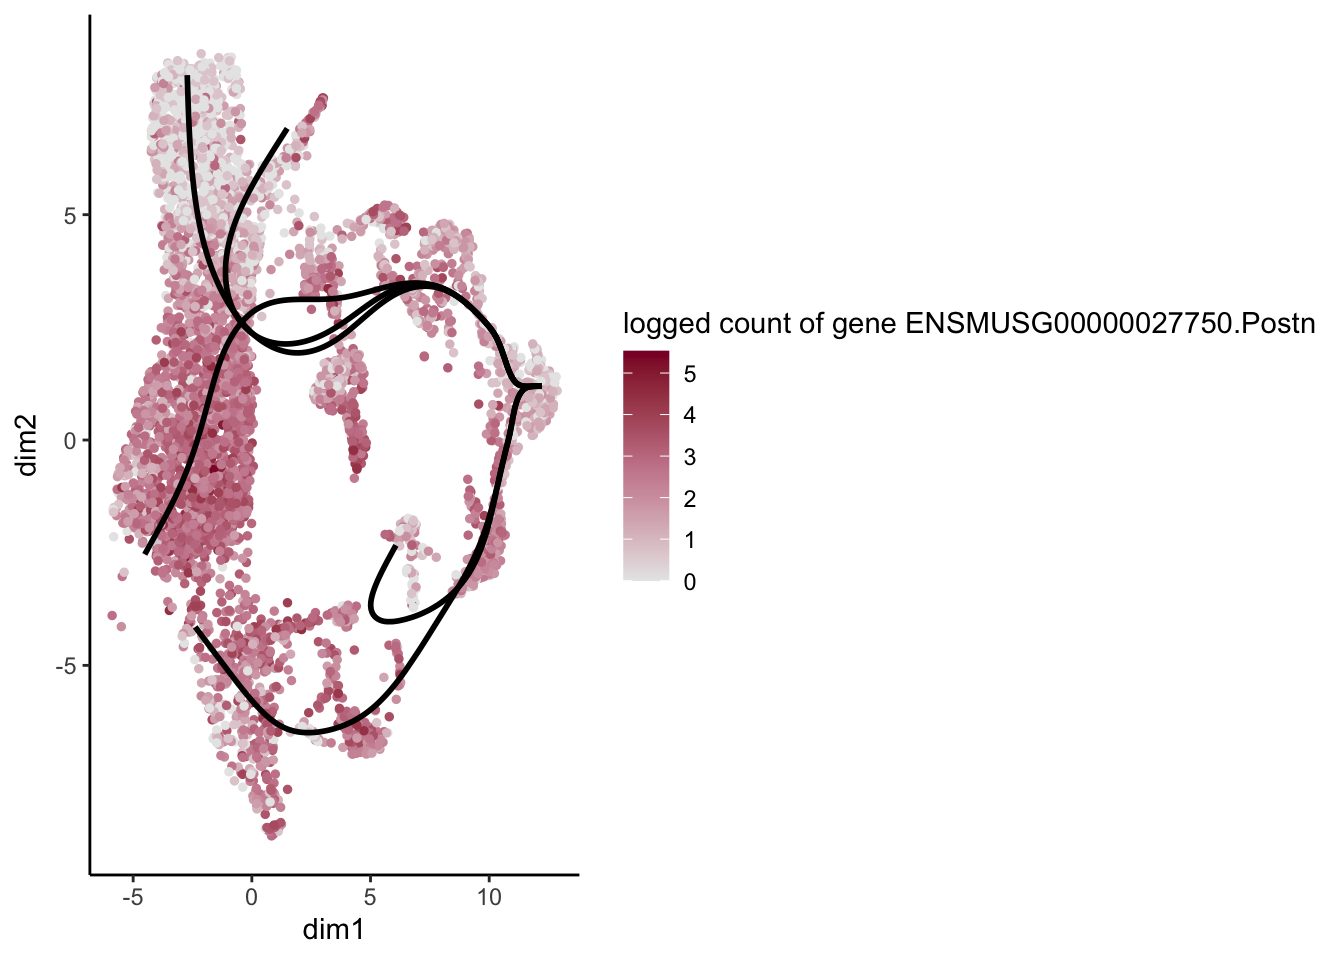
[[24]]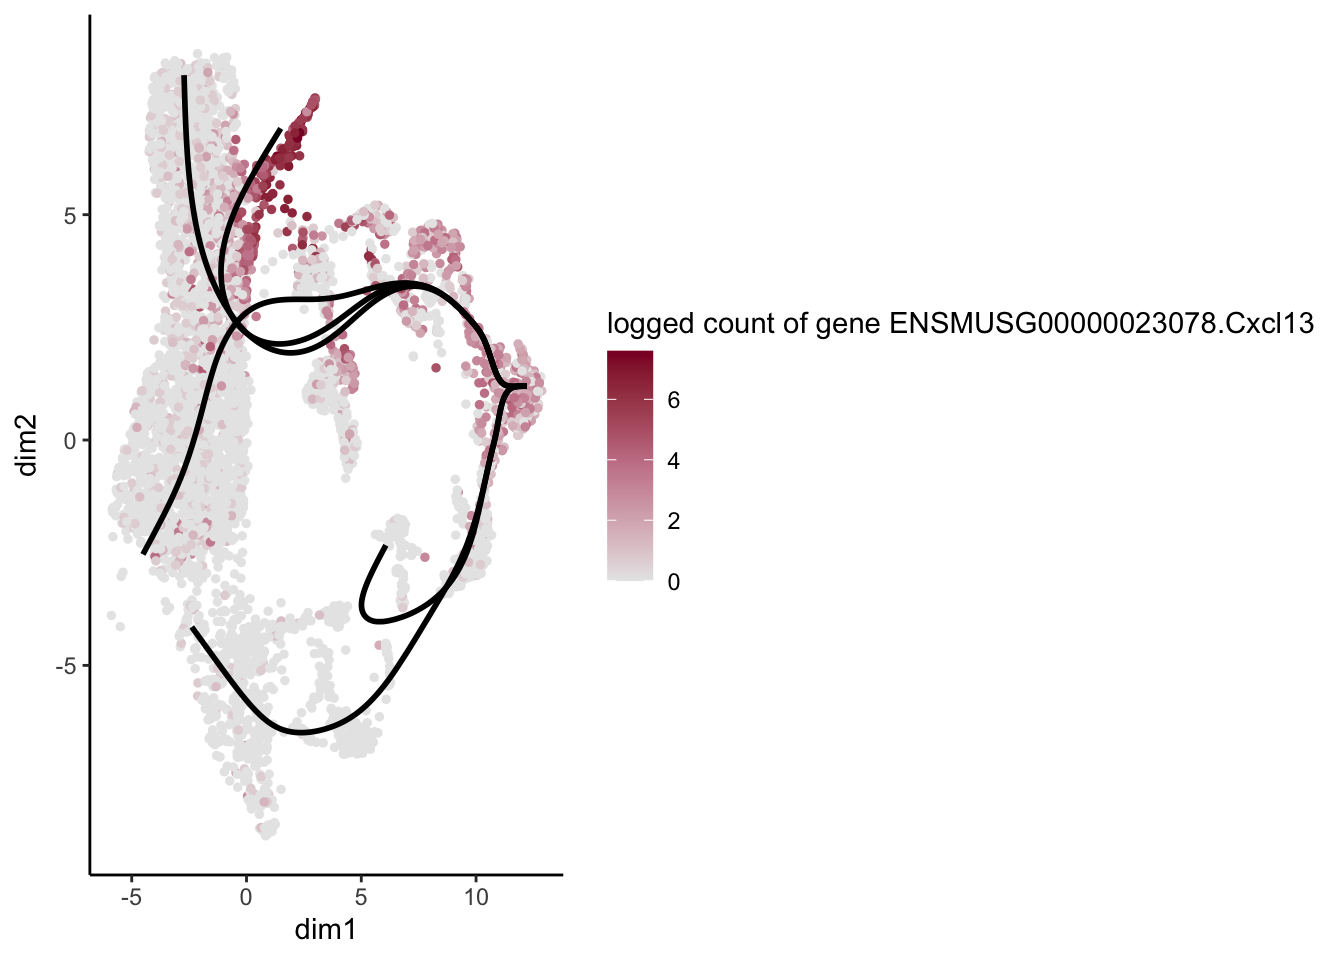
[[25]]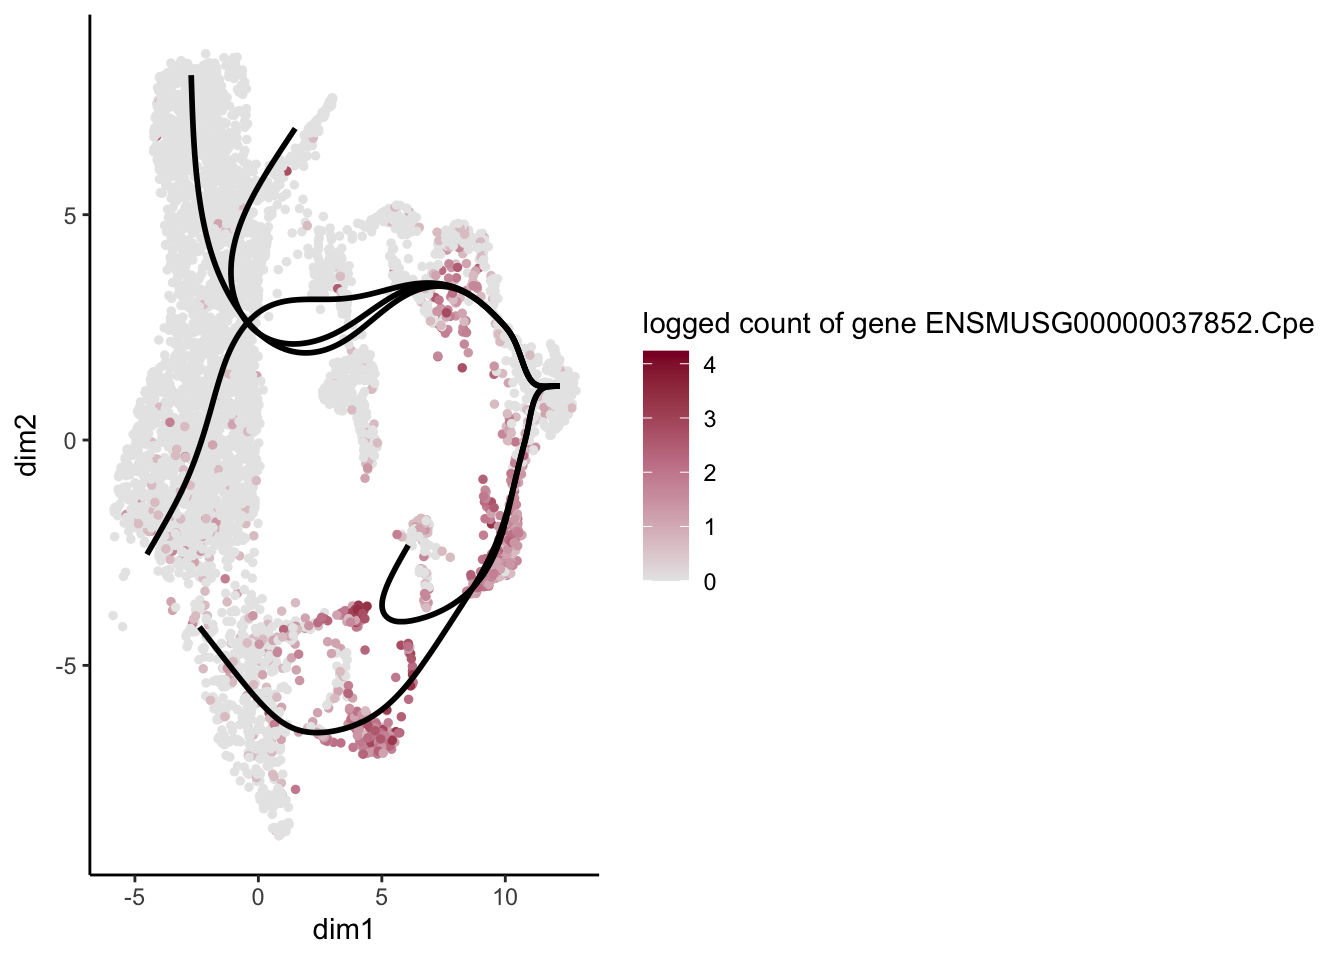
[[26]]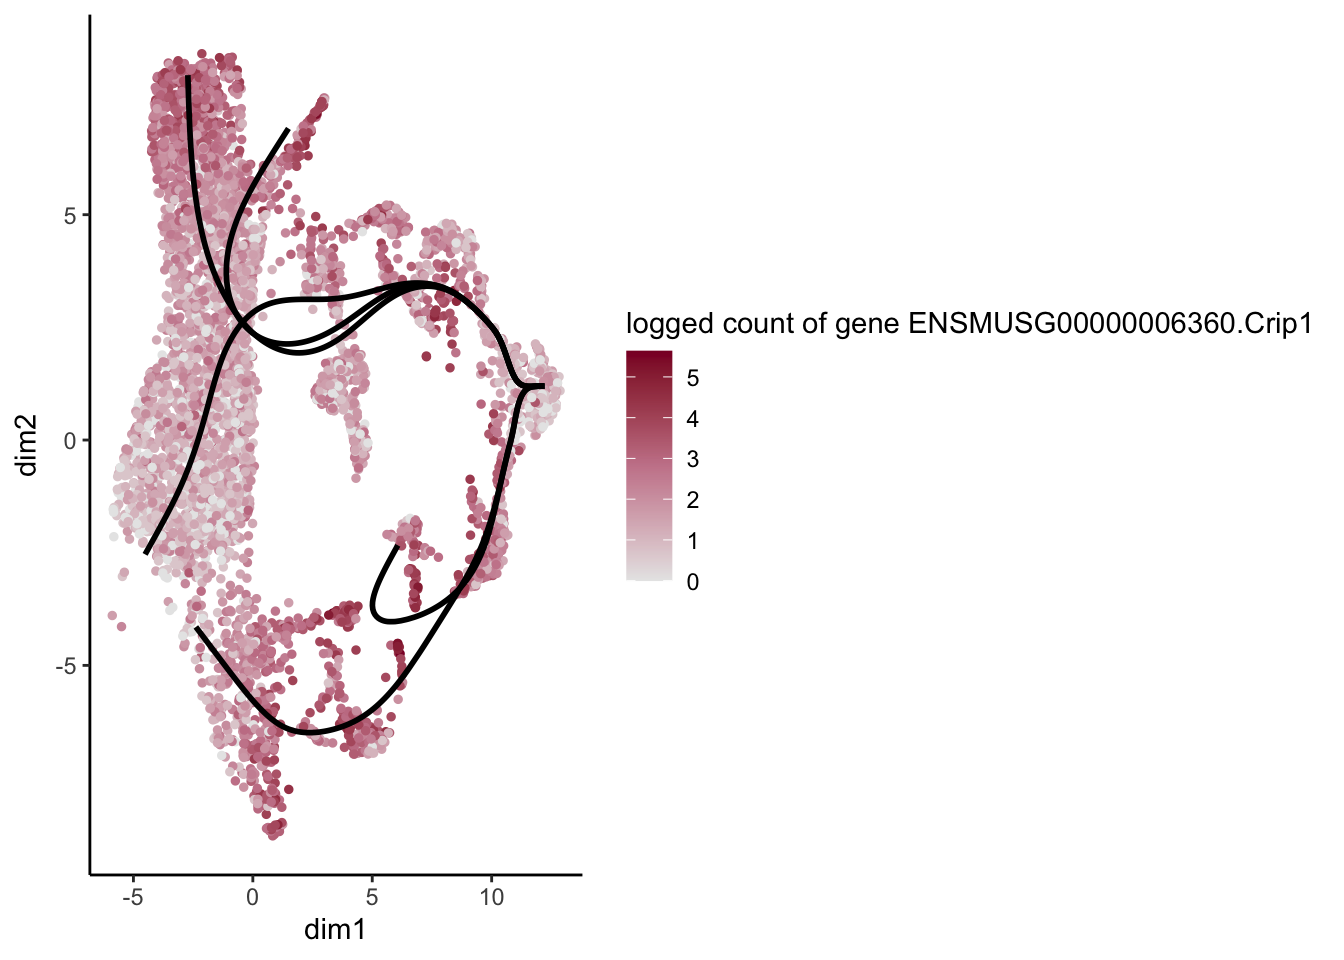
[[27]]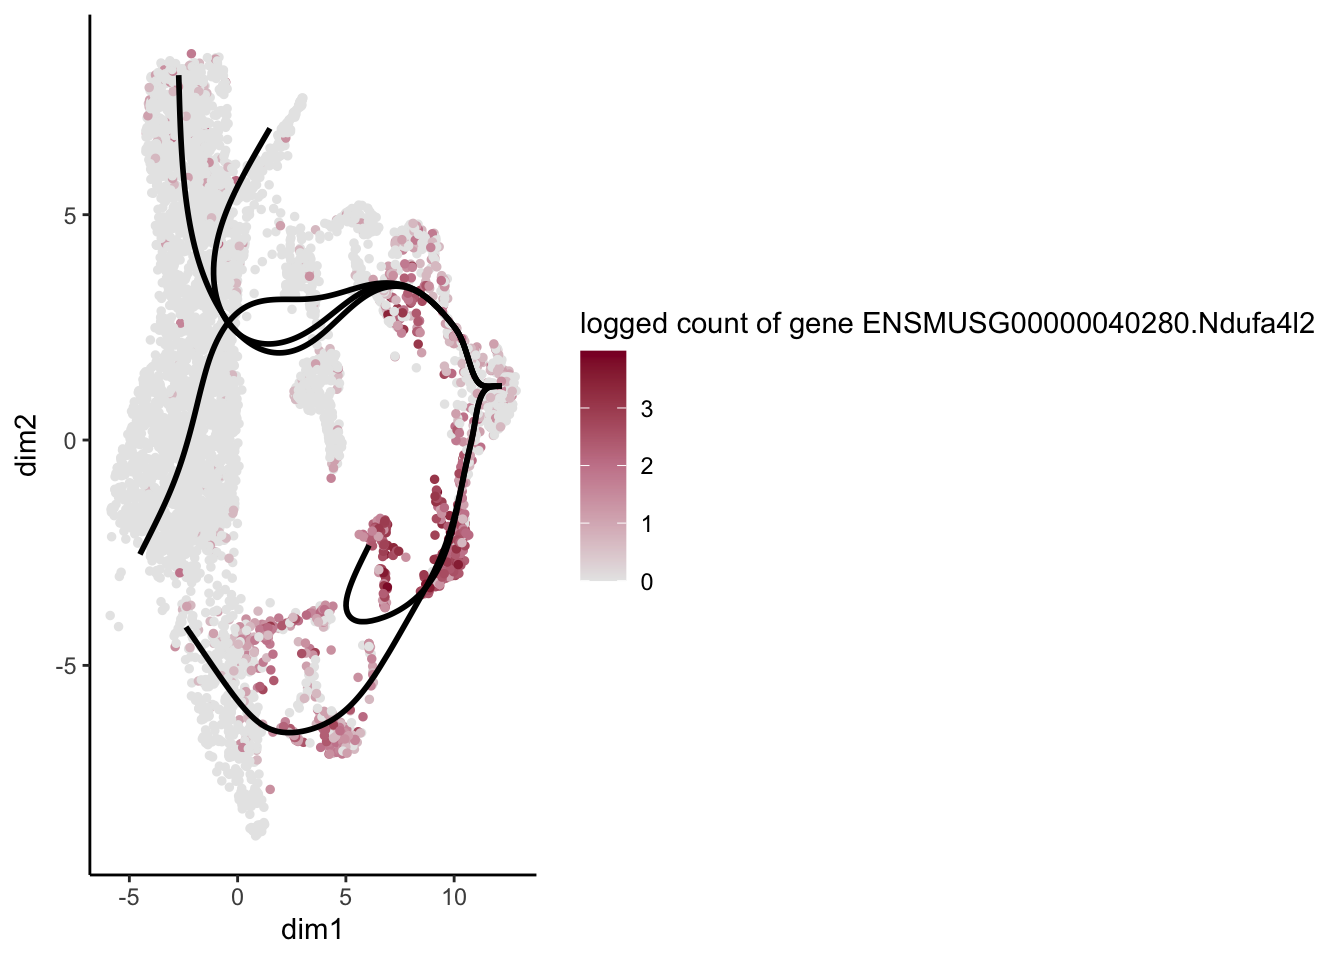
[[28]]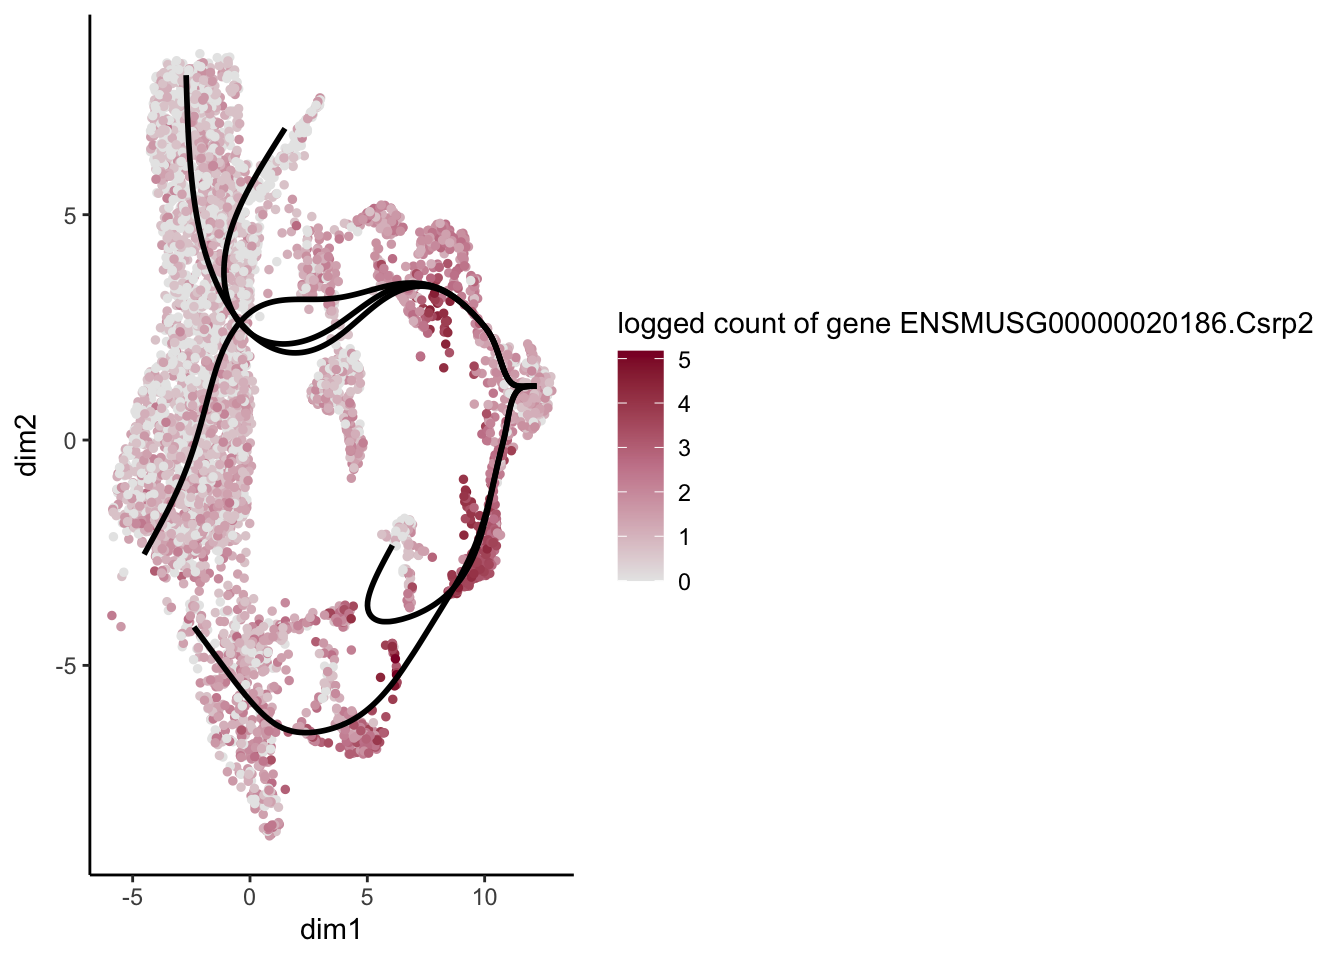
[[29]]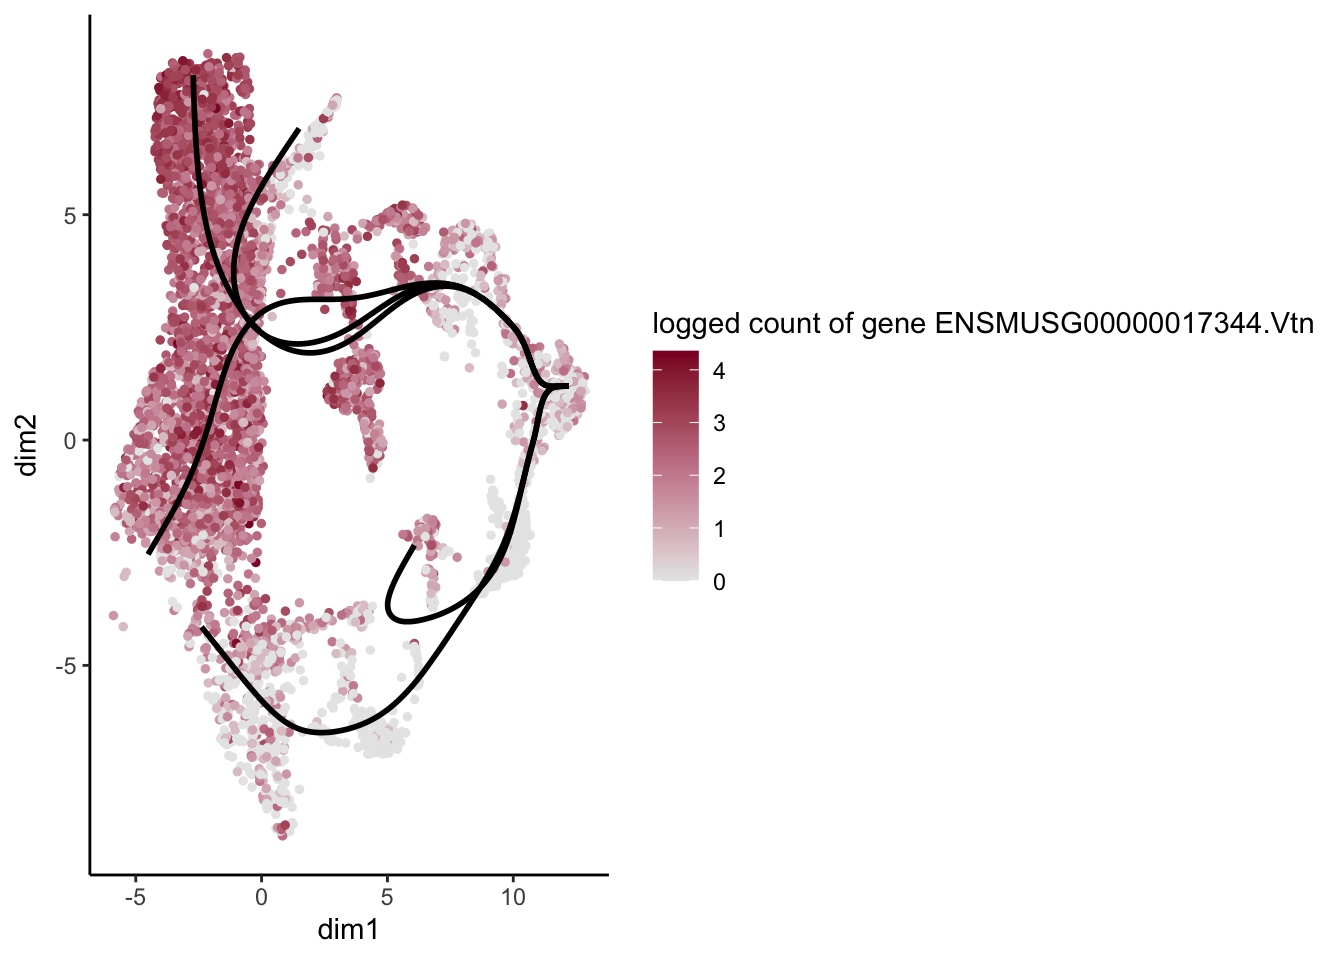
[[30]]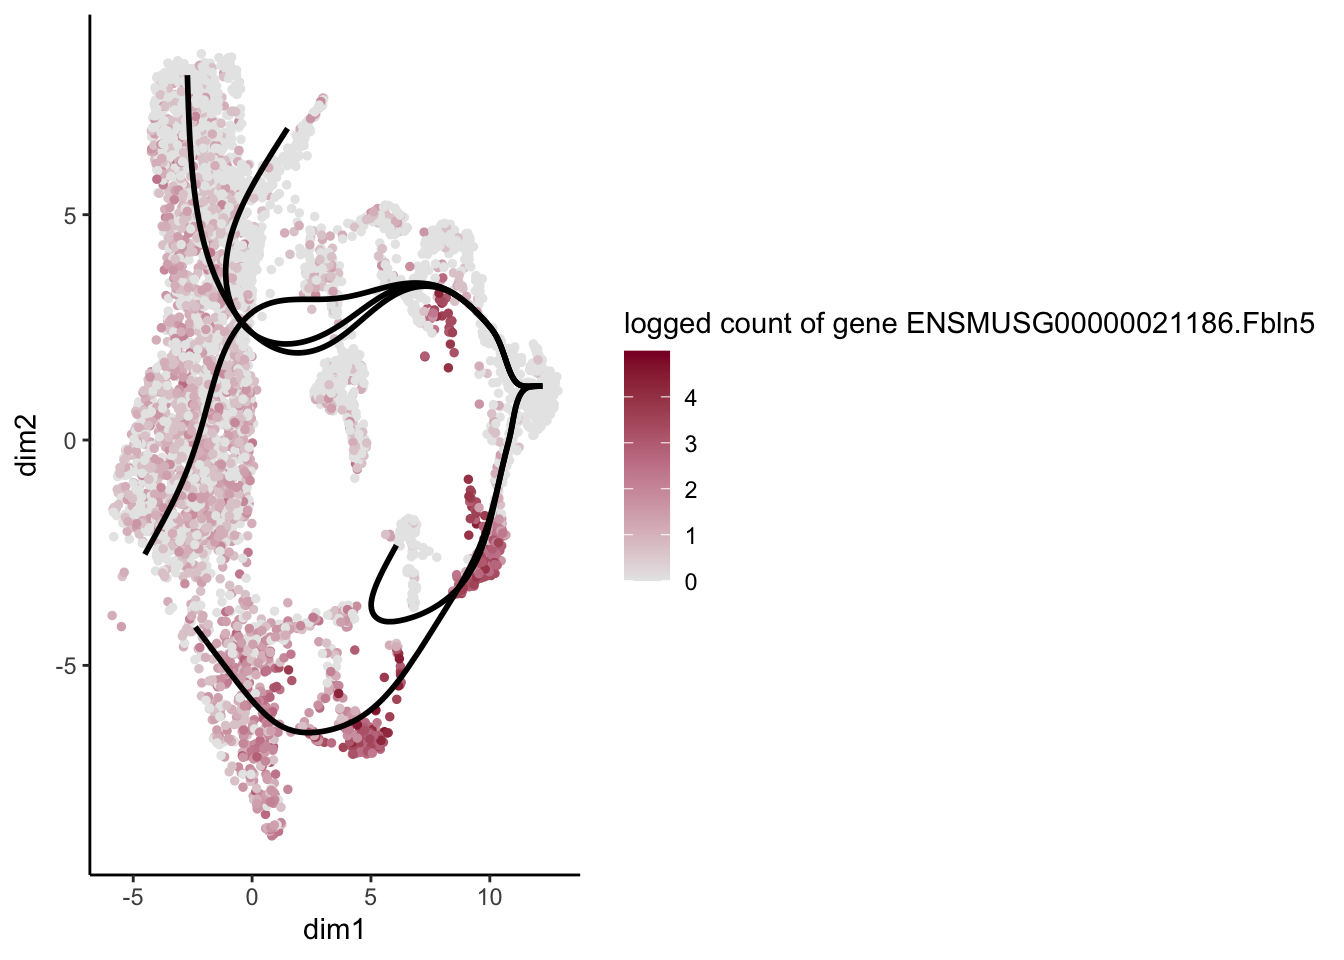
[[31]]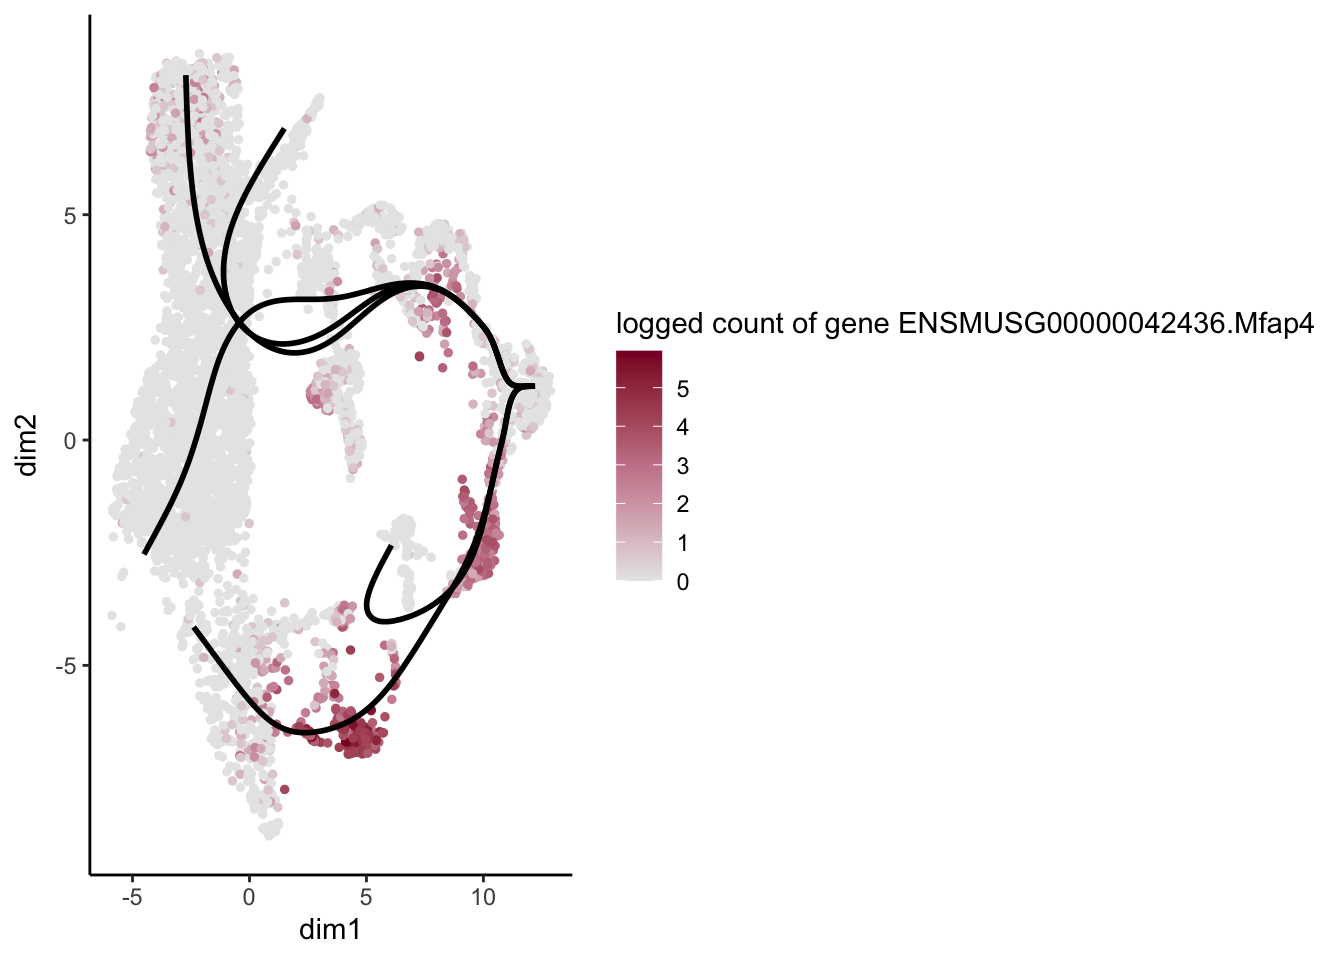
[[32]]
[[33]]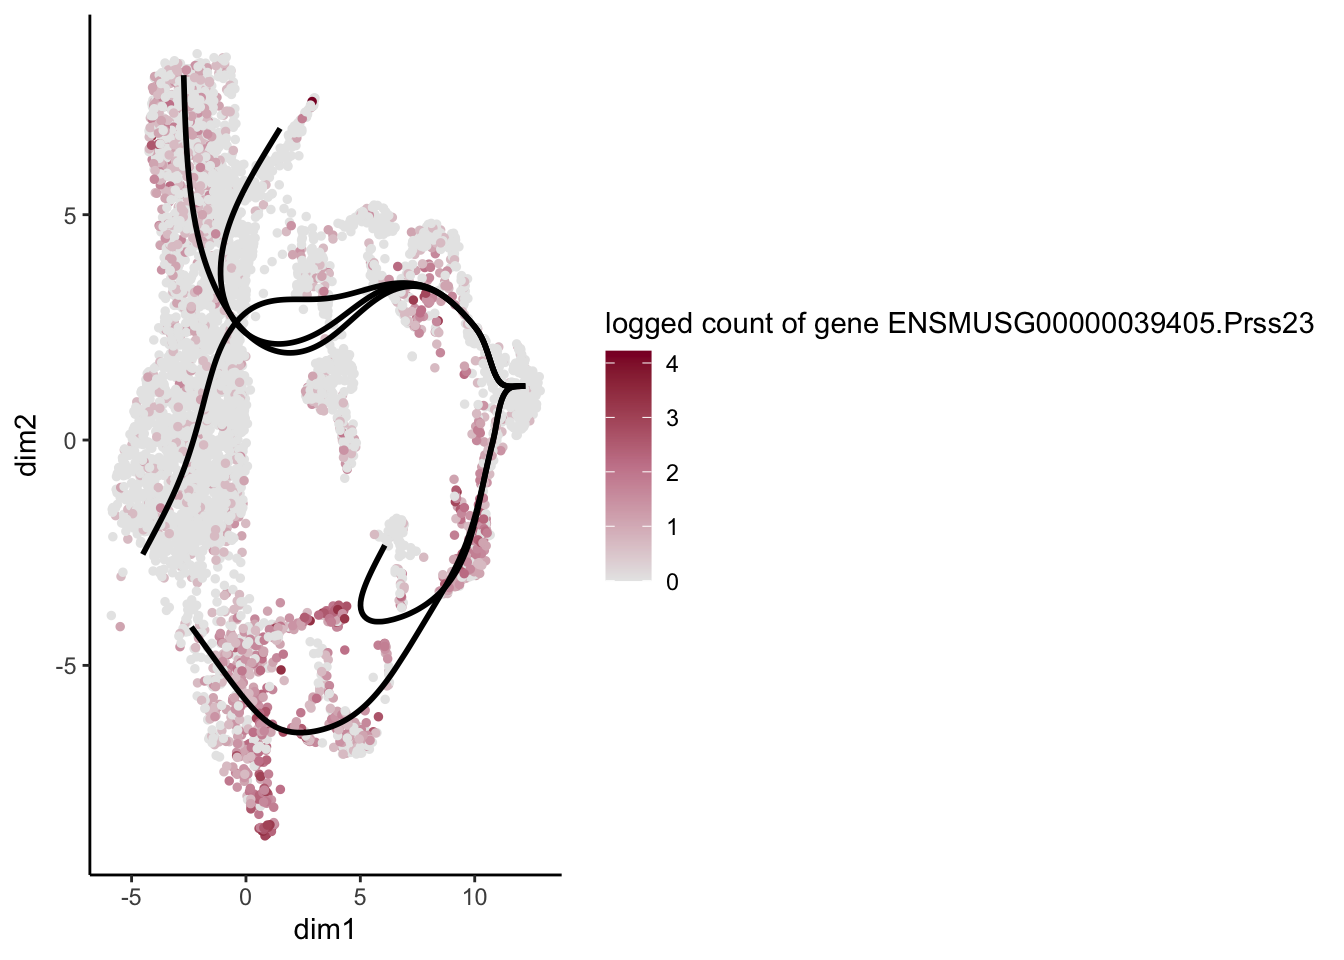
[[34]]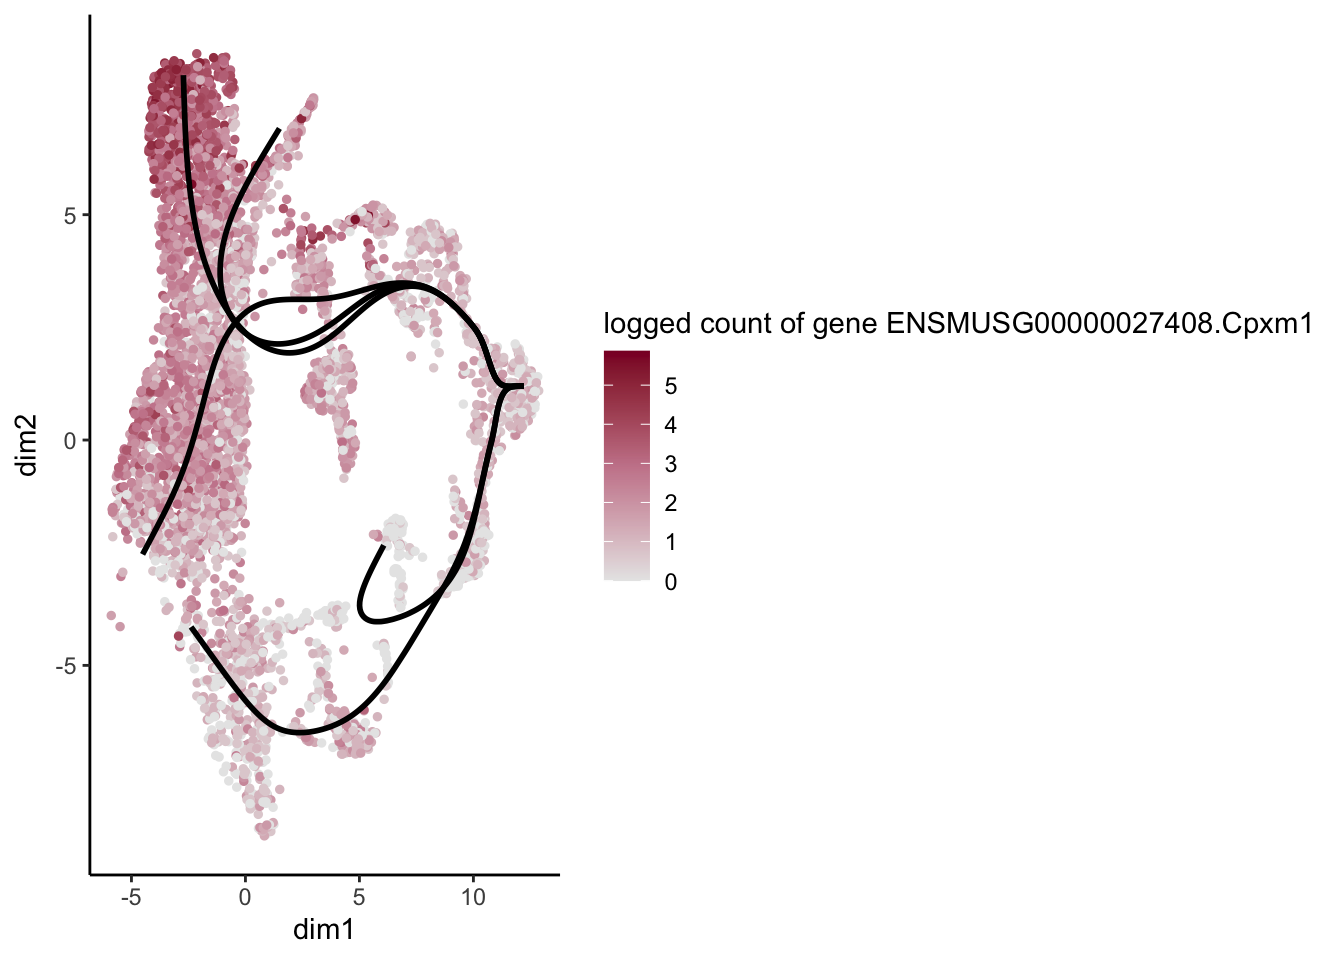
[[35]]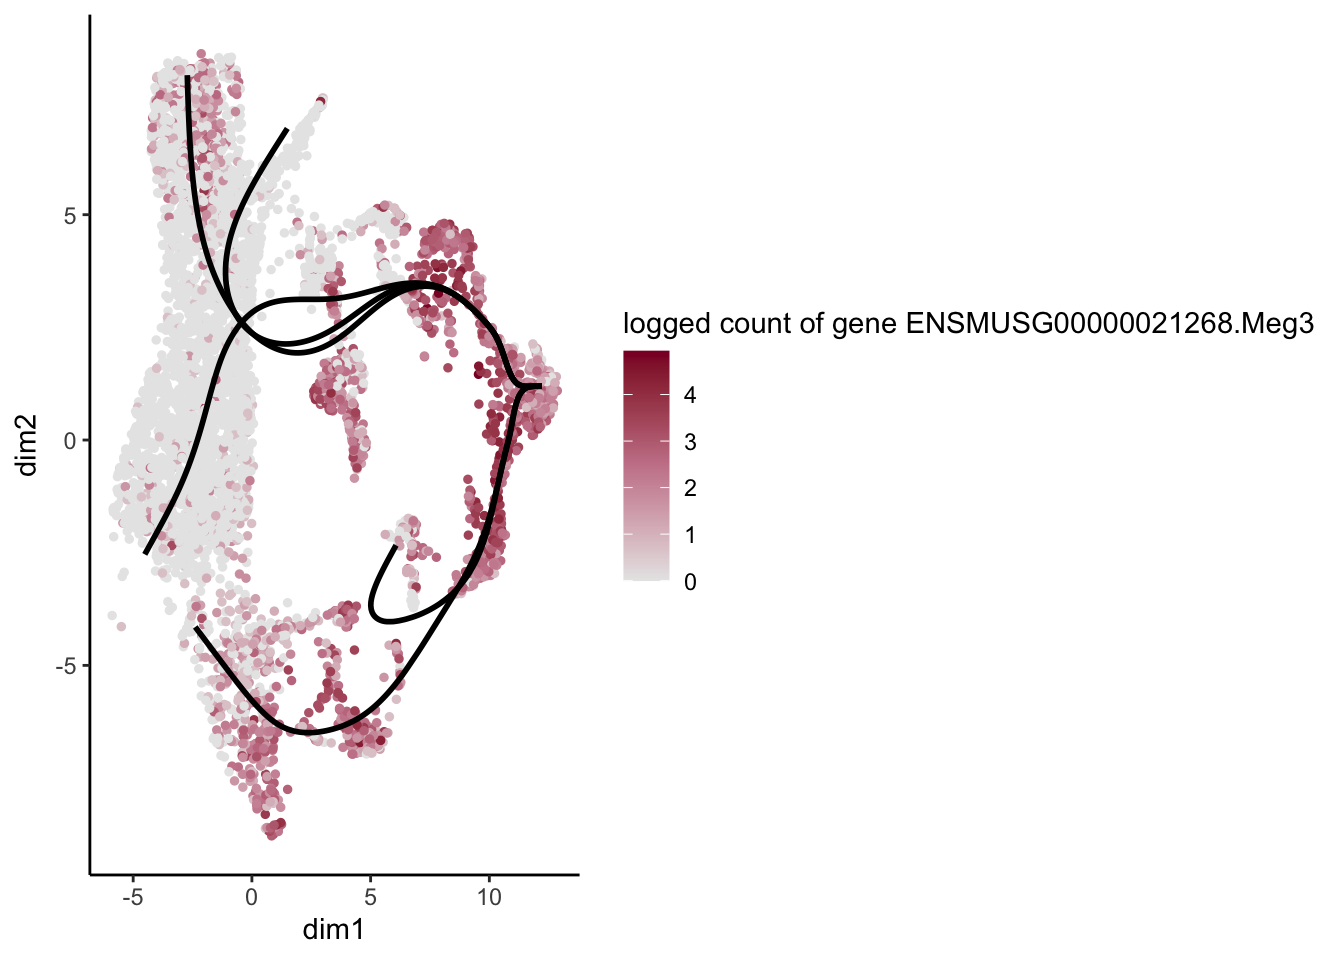
[[36]]
[[37]]
[[38]]
[[39]]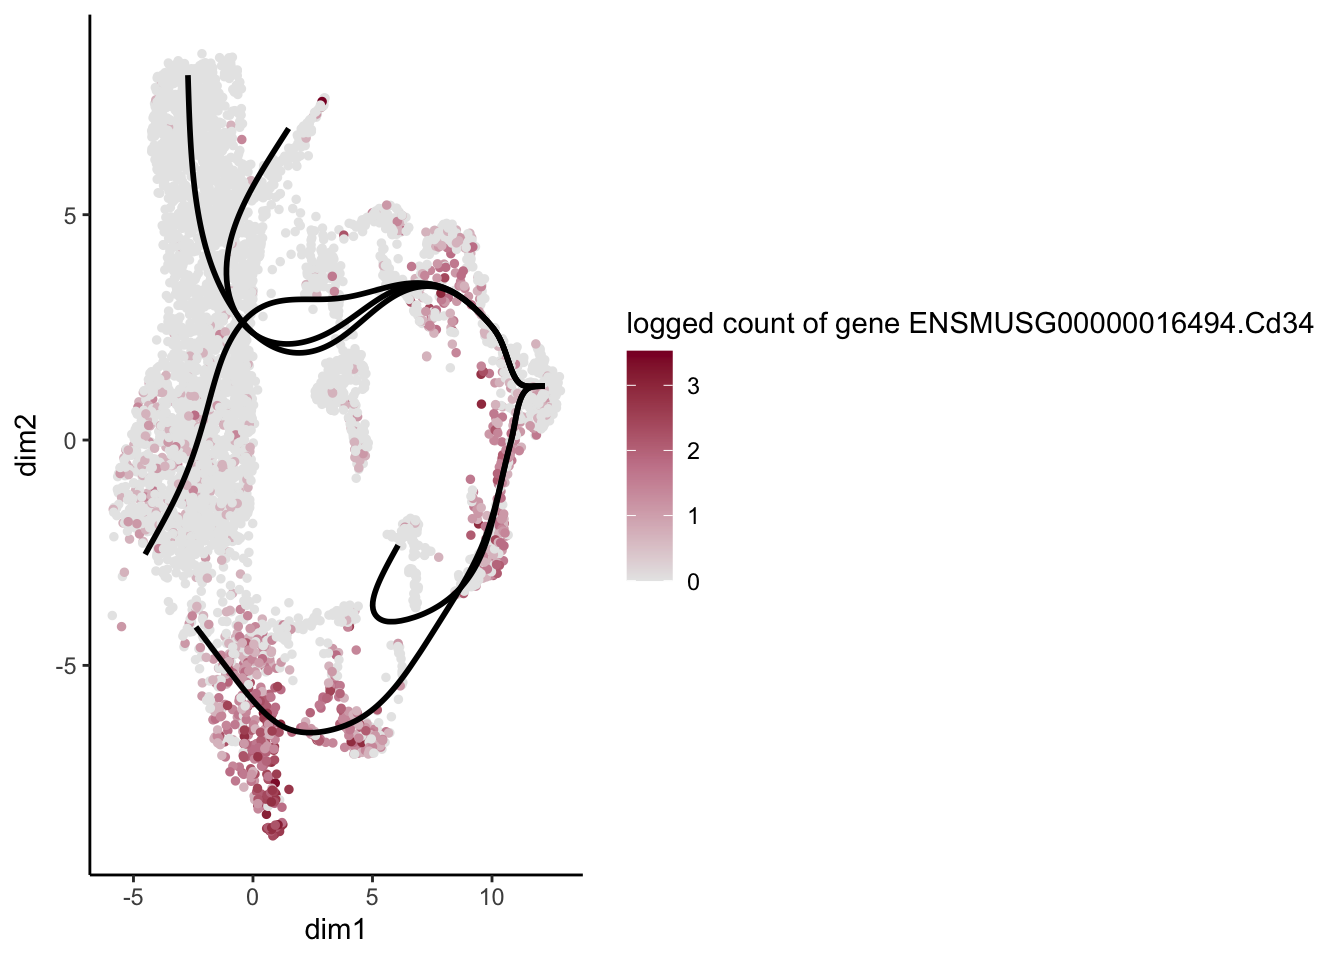
[[40]]
[[41]]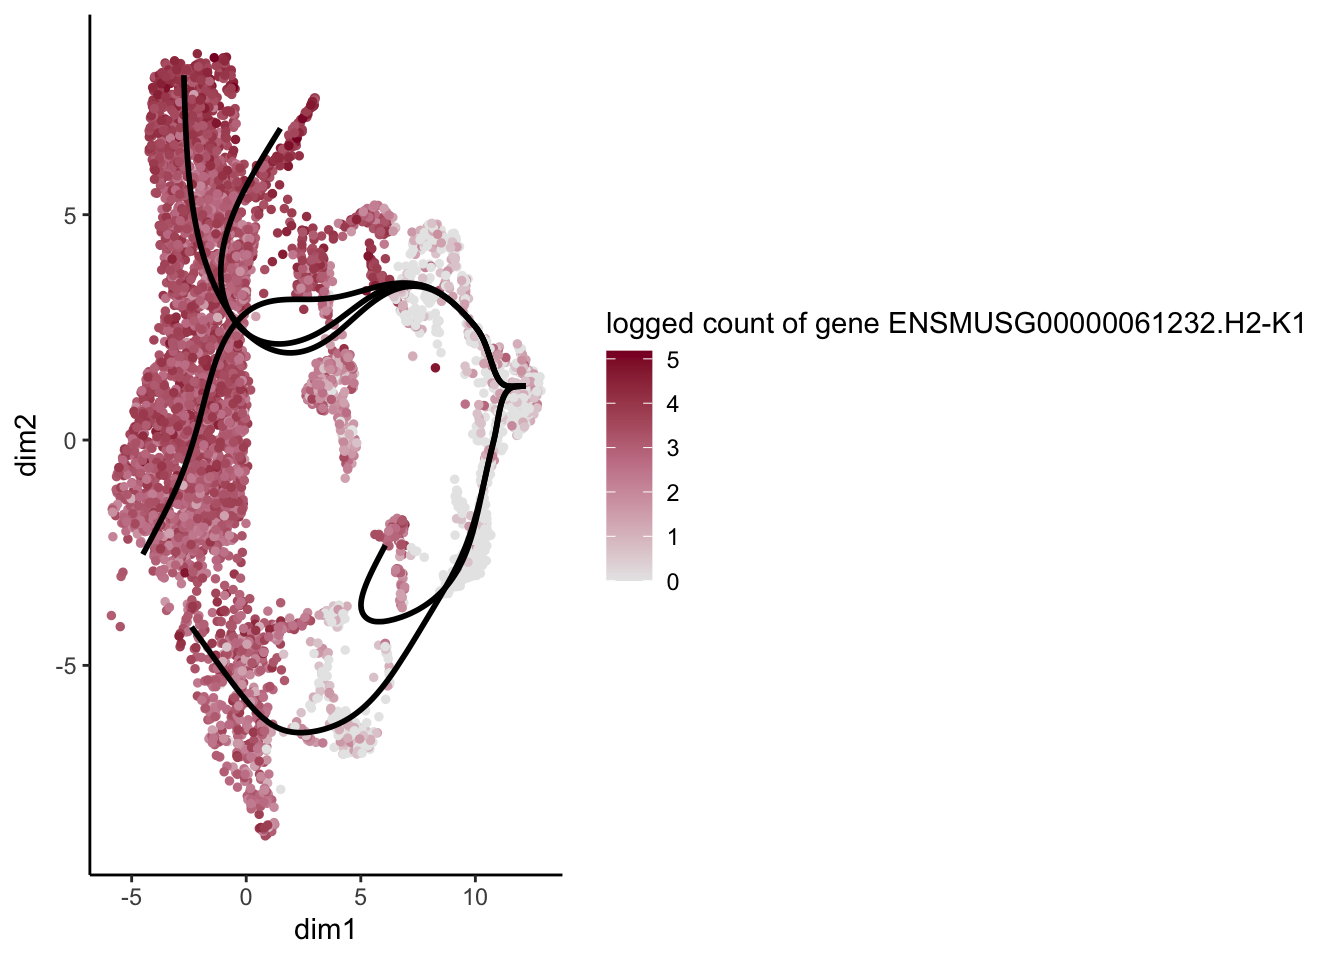
[[42]]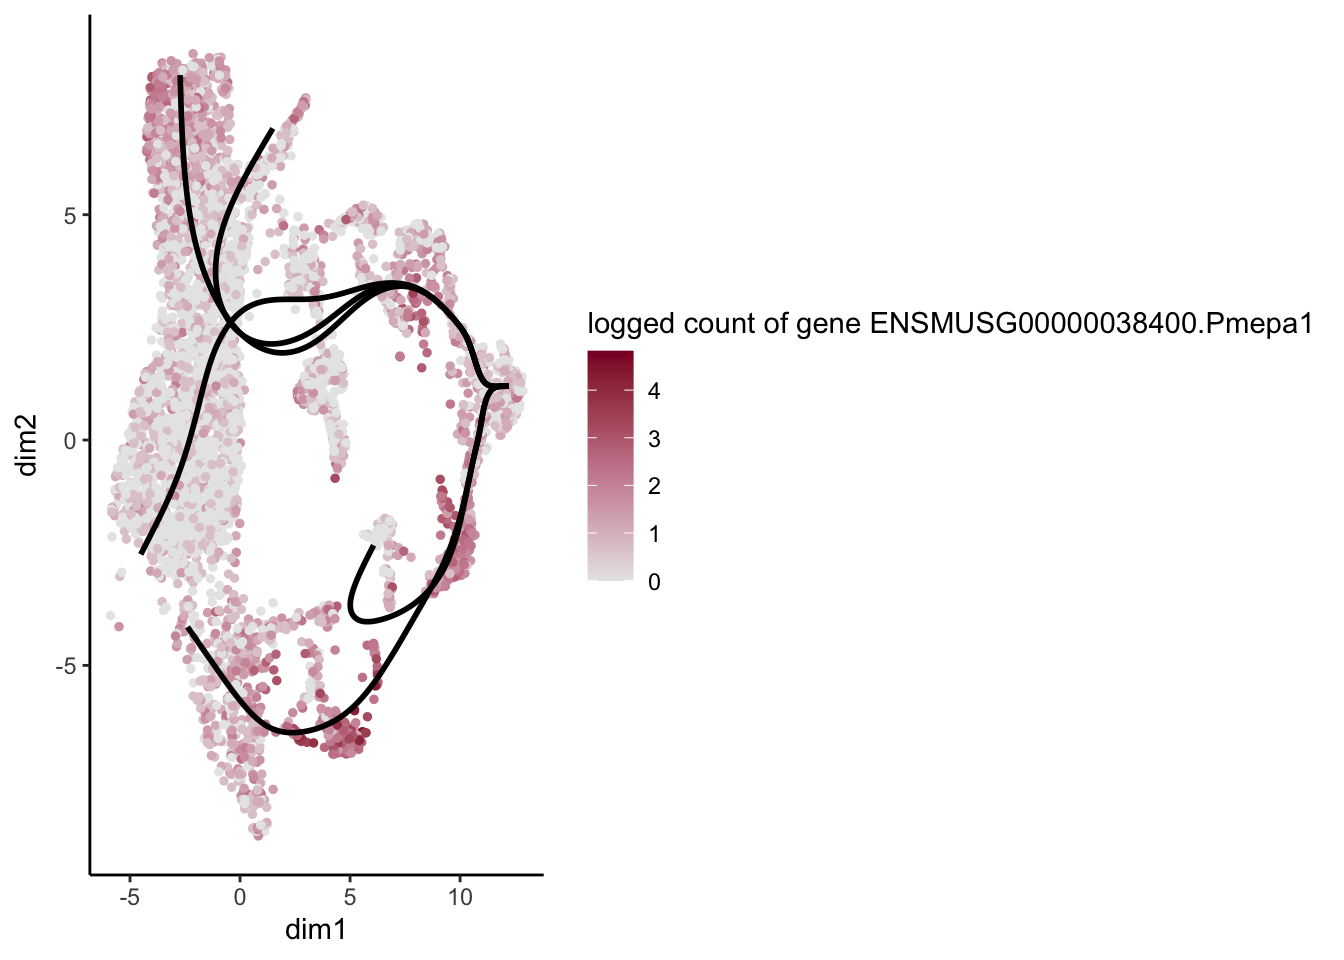
[[43]]
[[44]]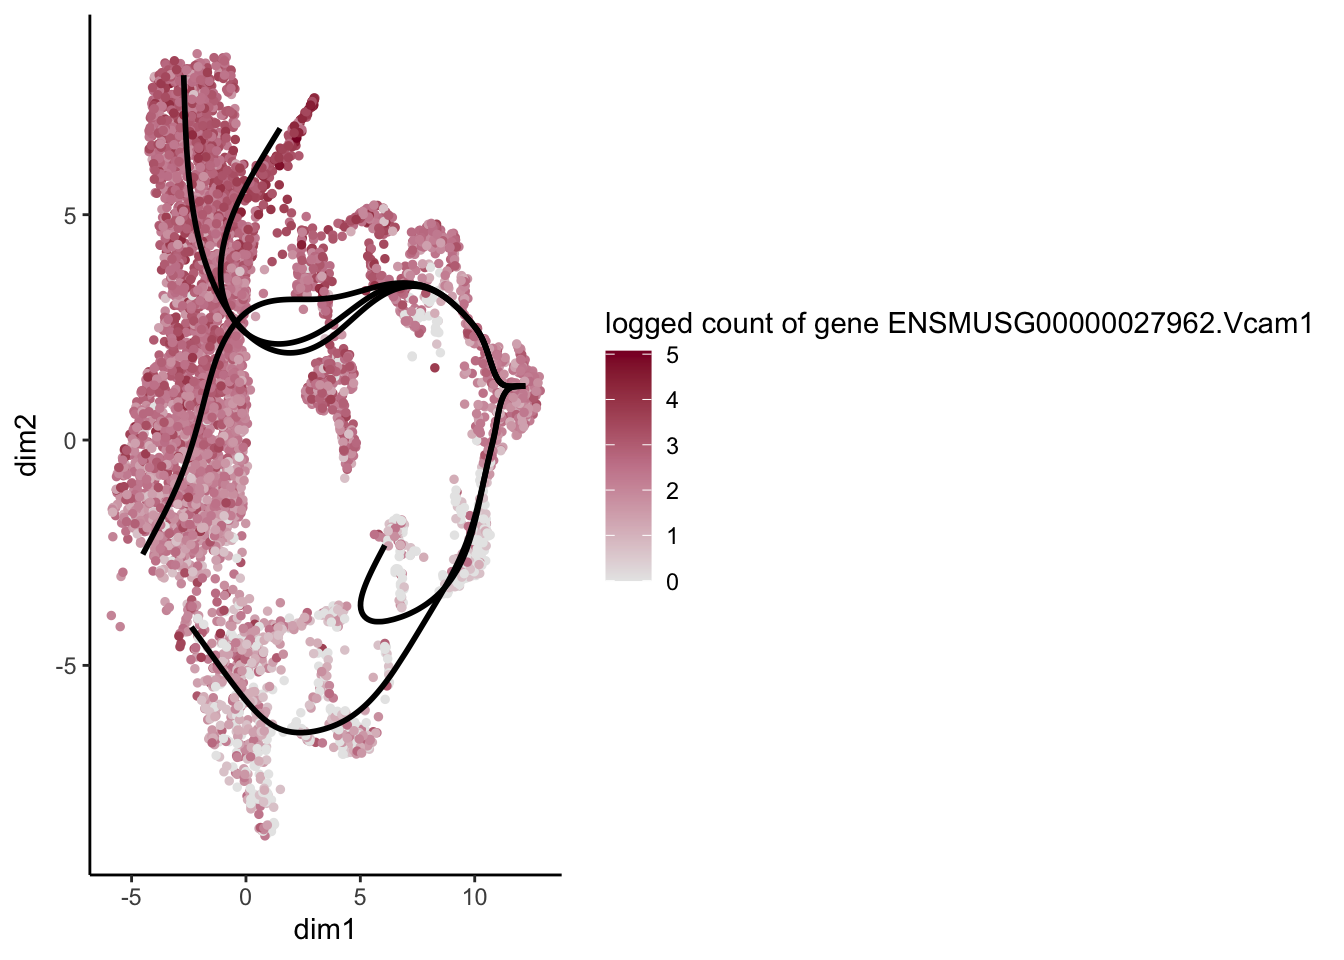
[[45]]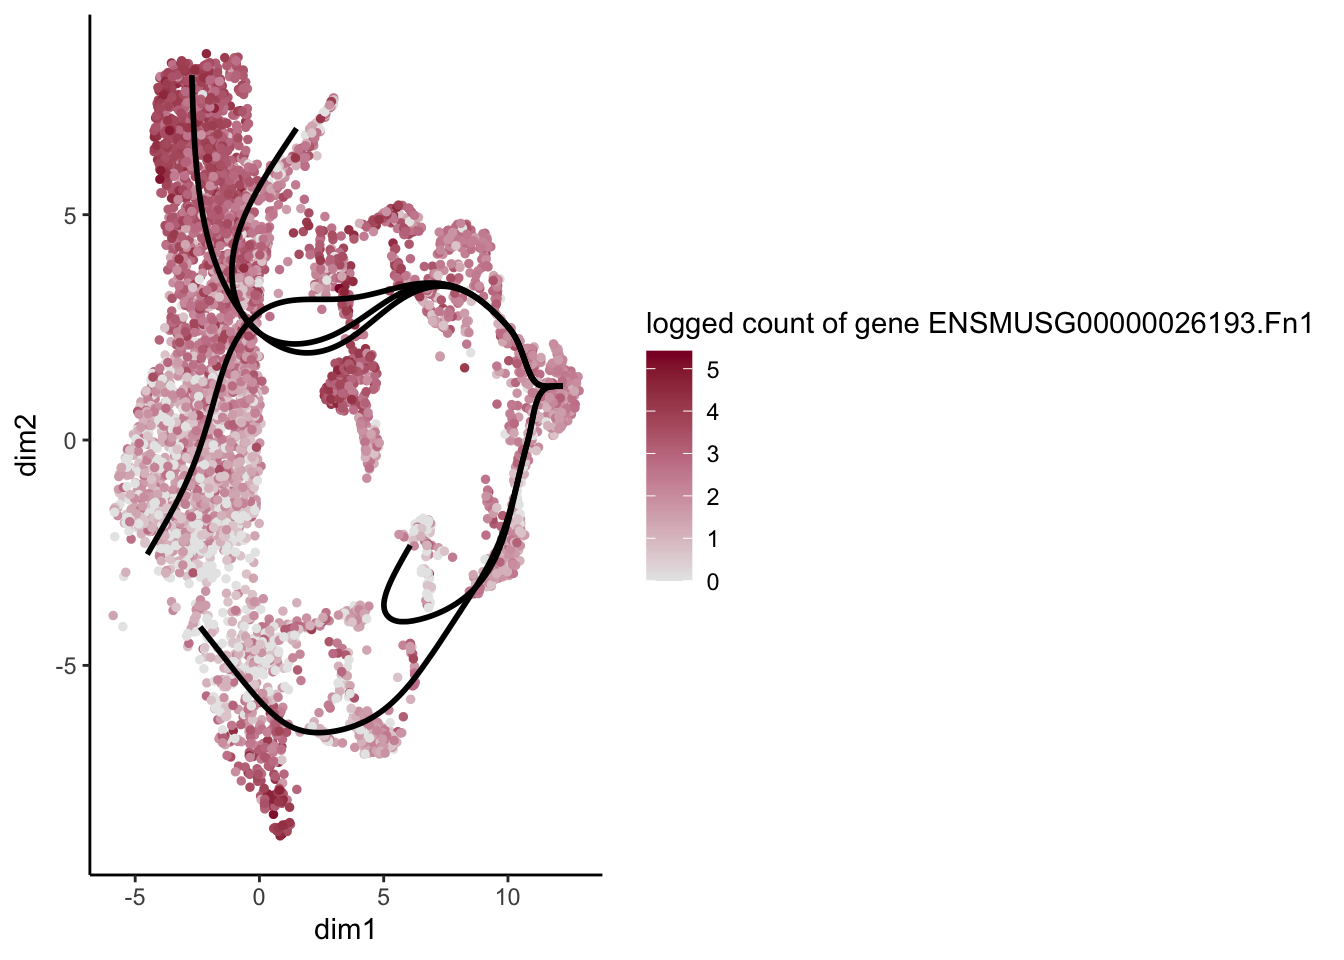
[[46]]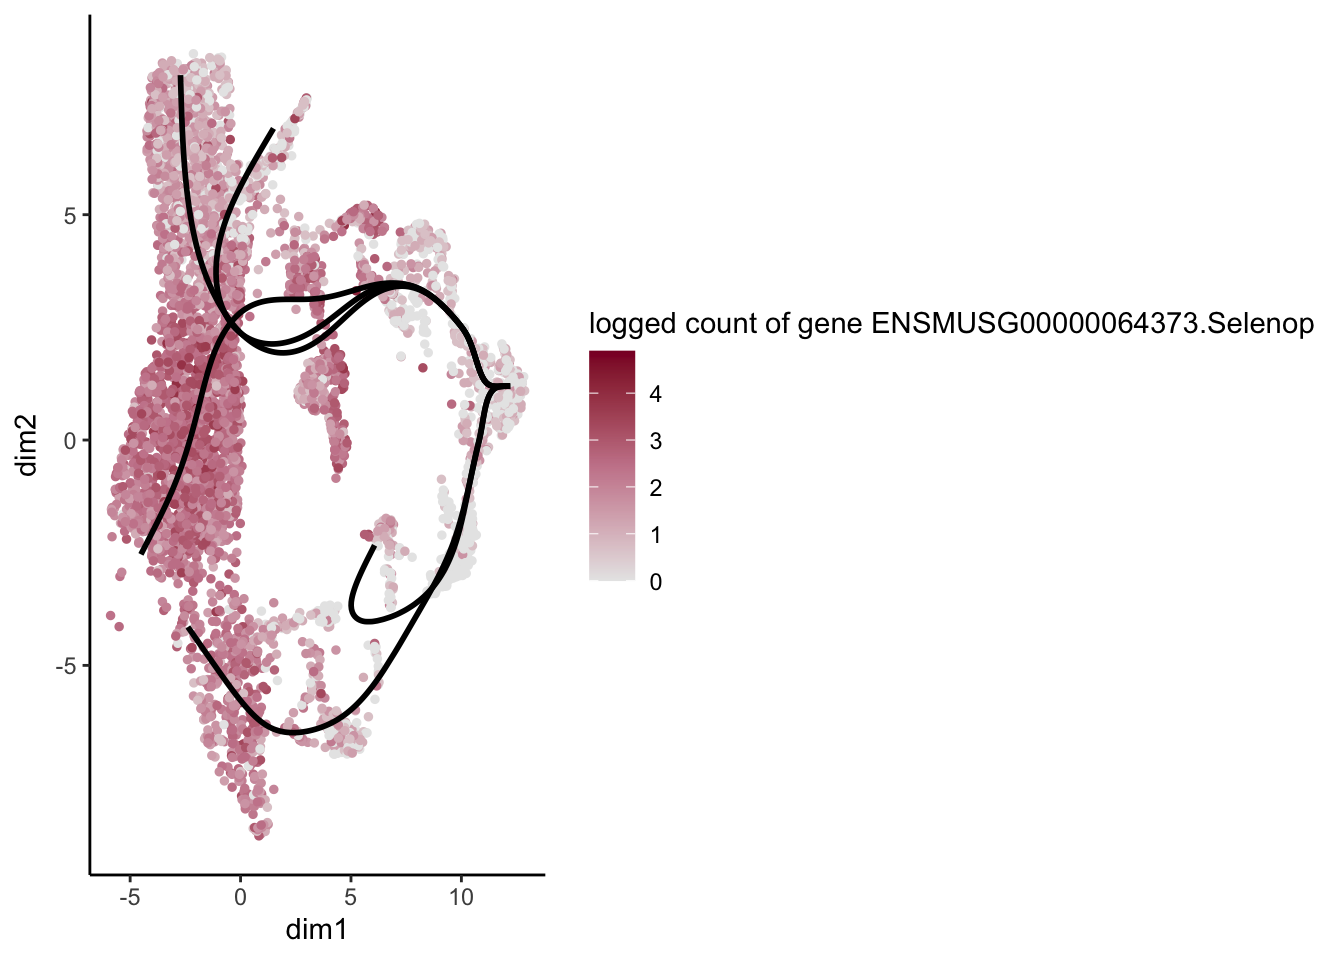
[[47]]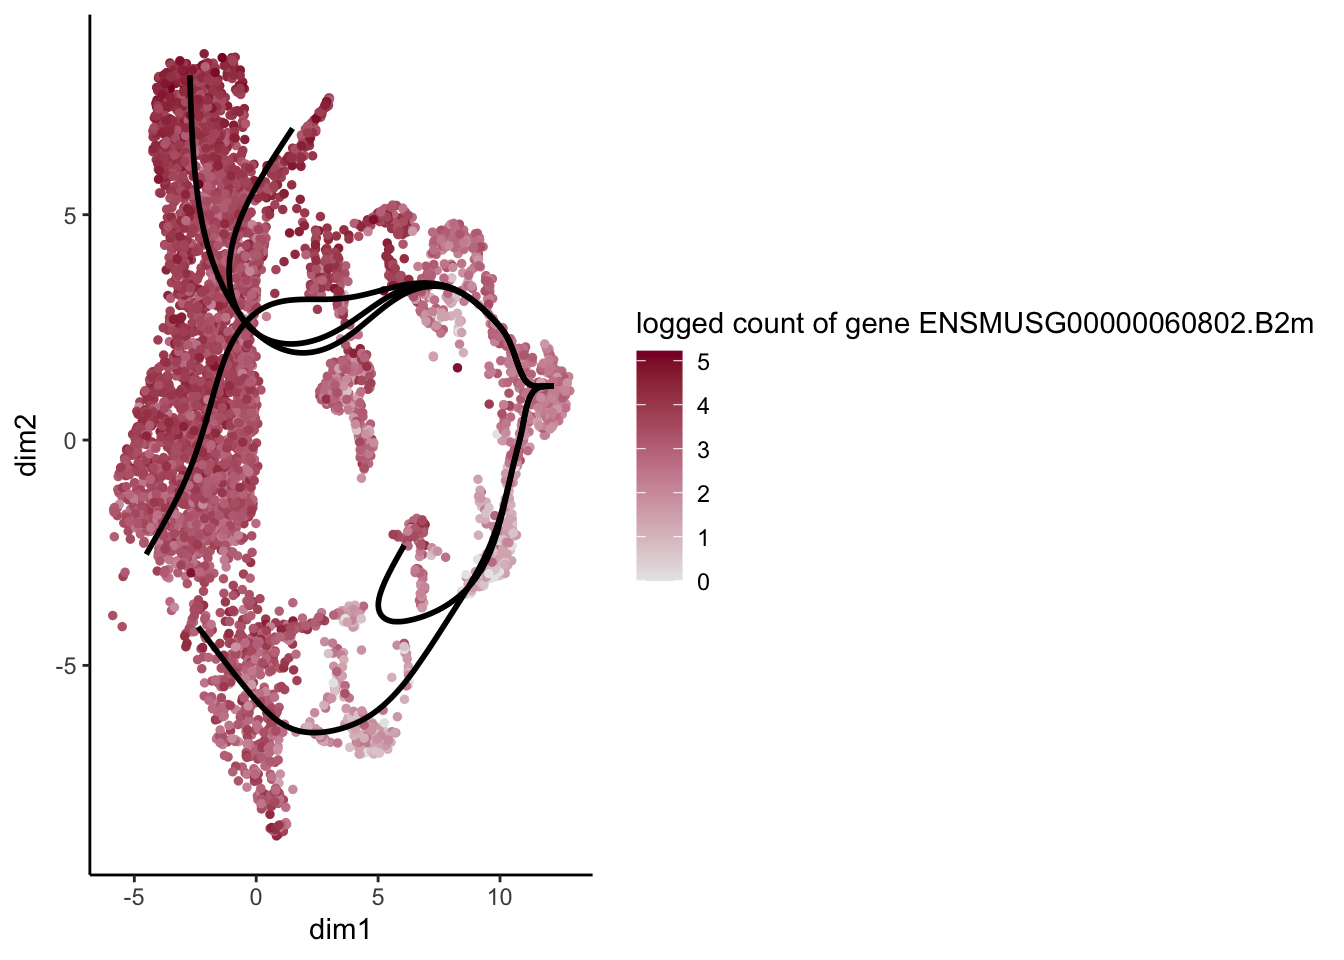
[[48]]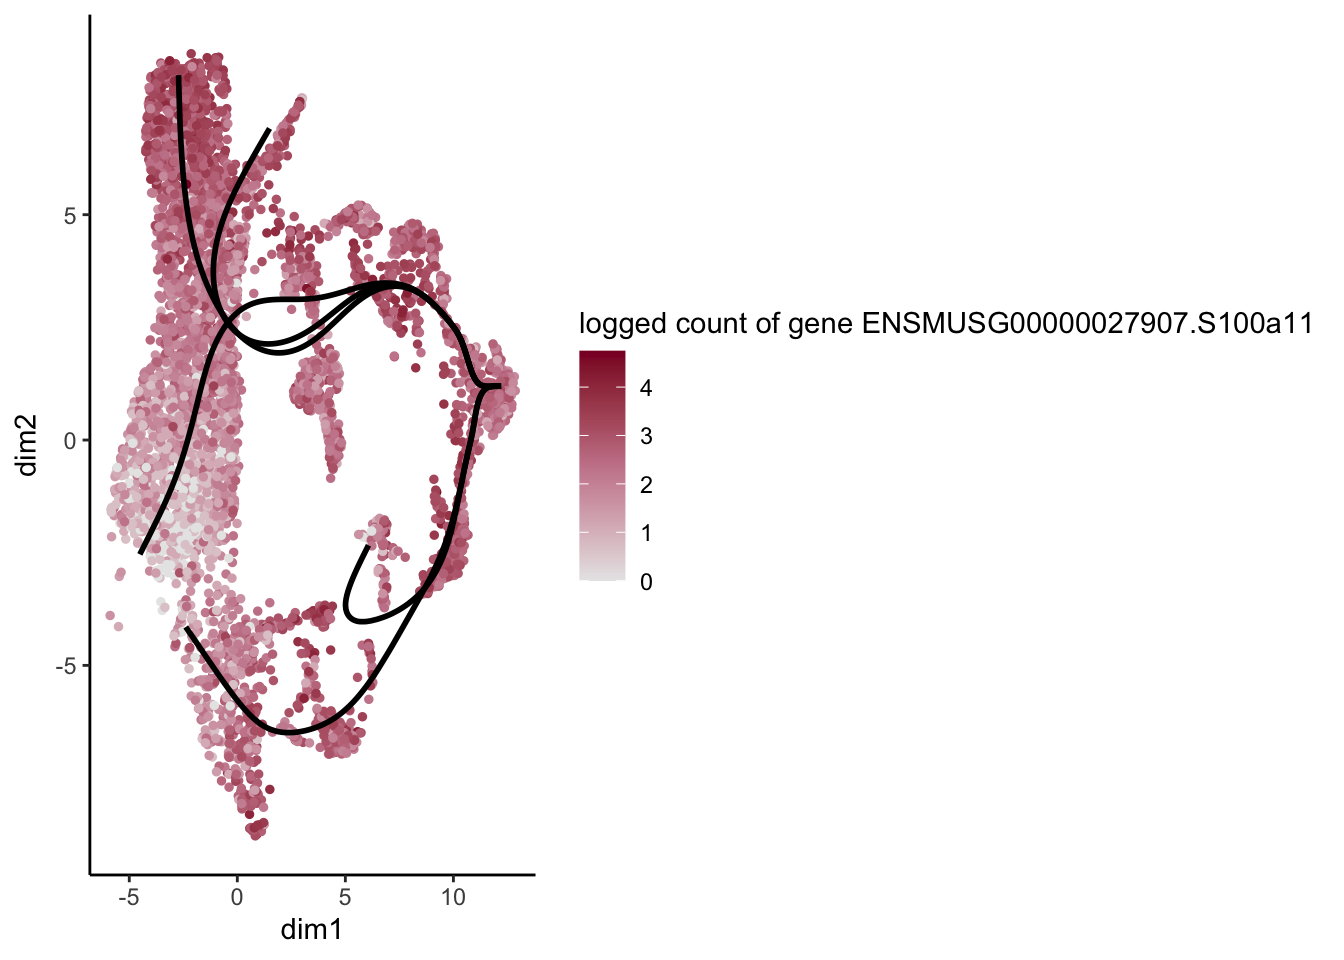
[[49]]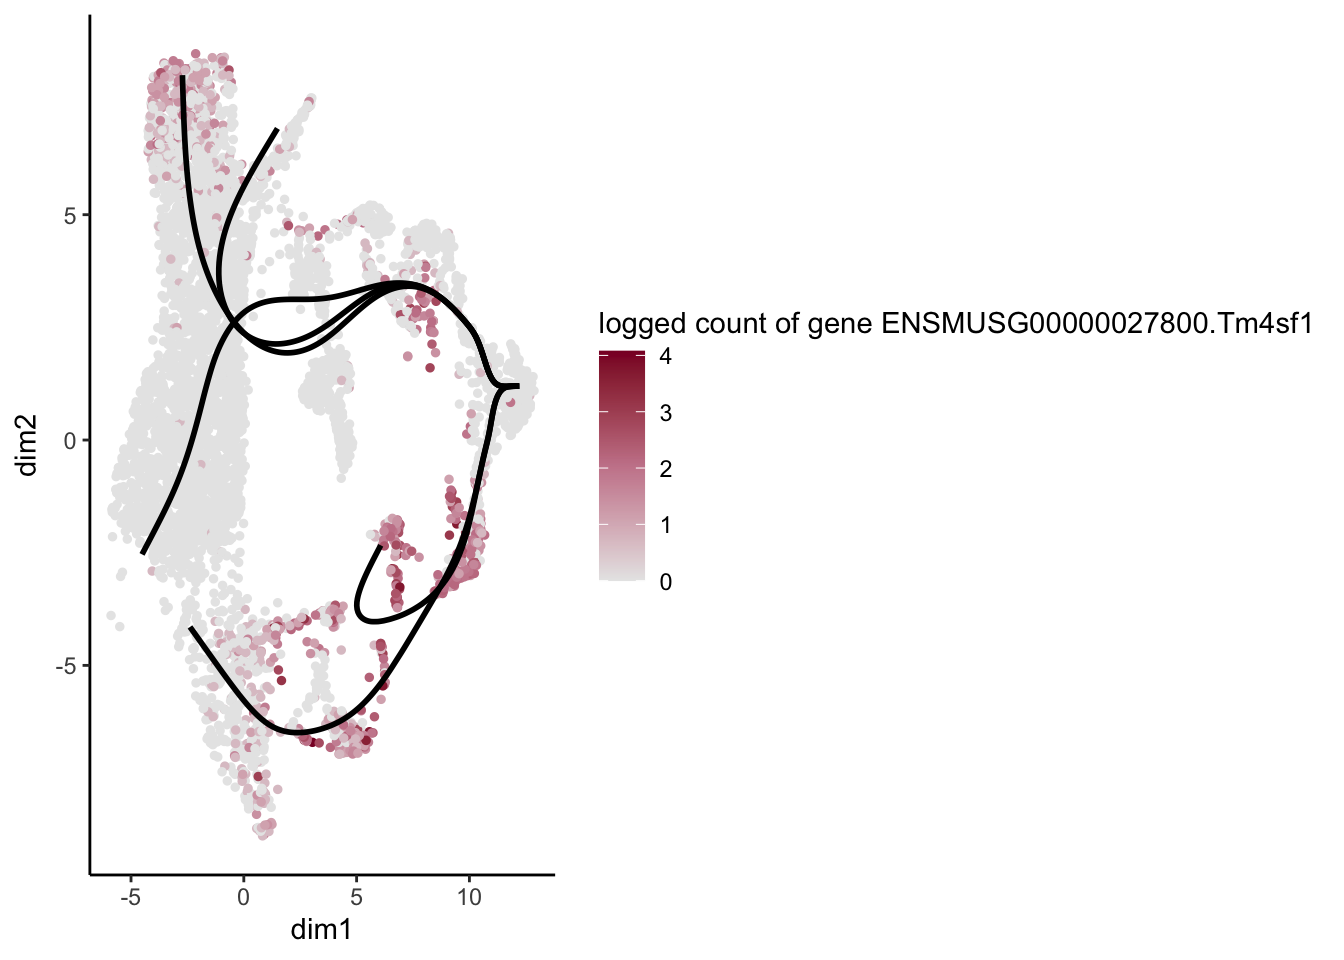
[[50]]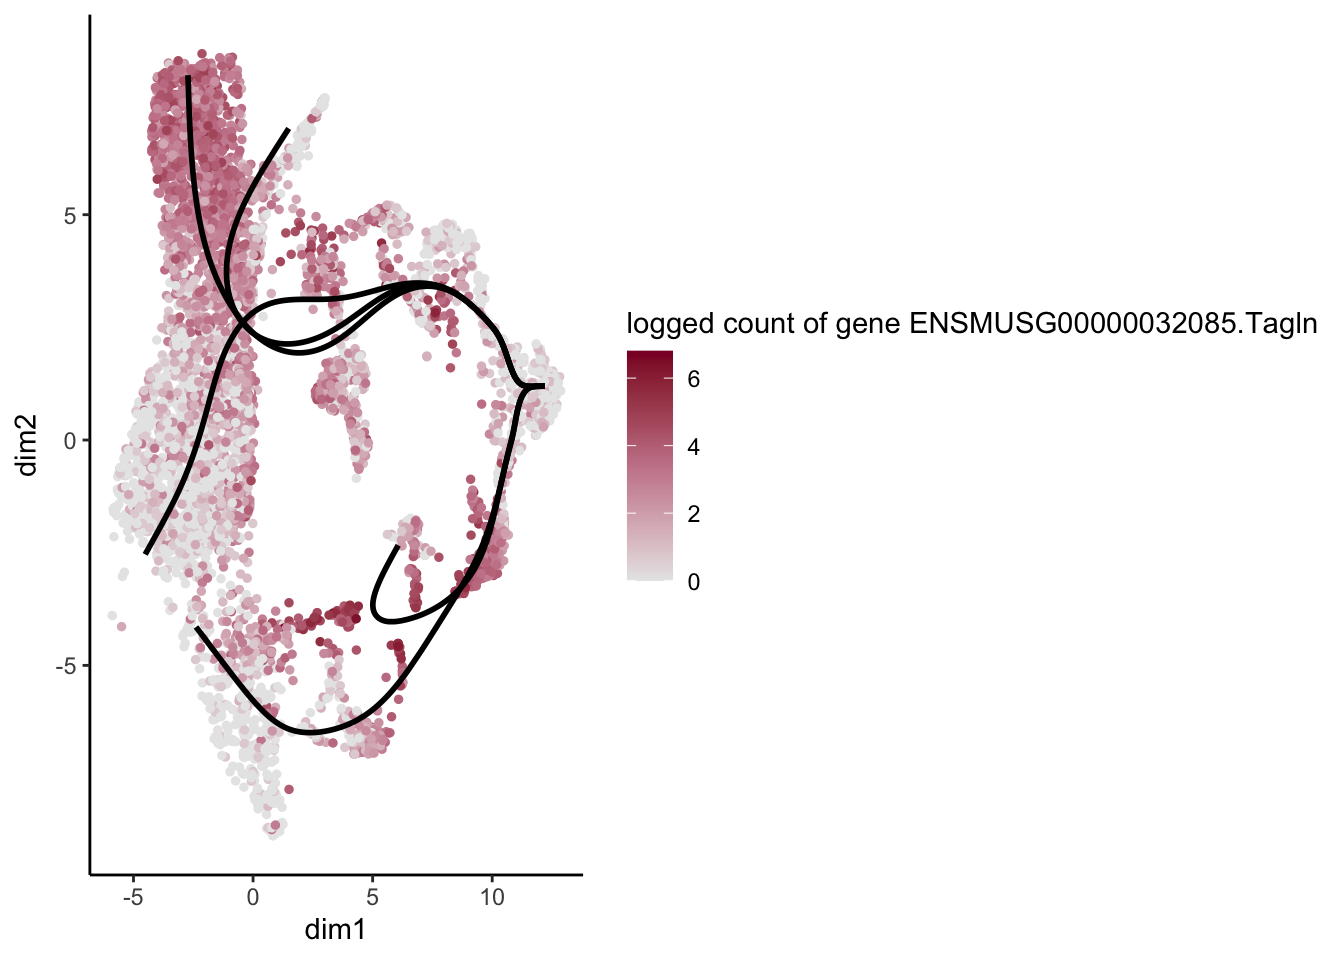
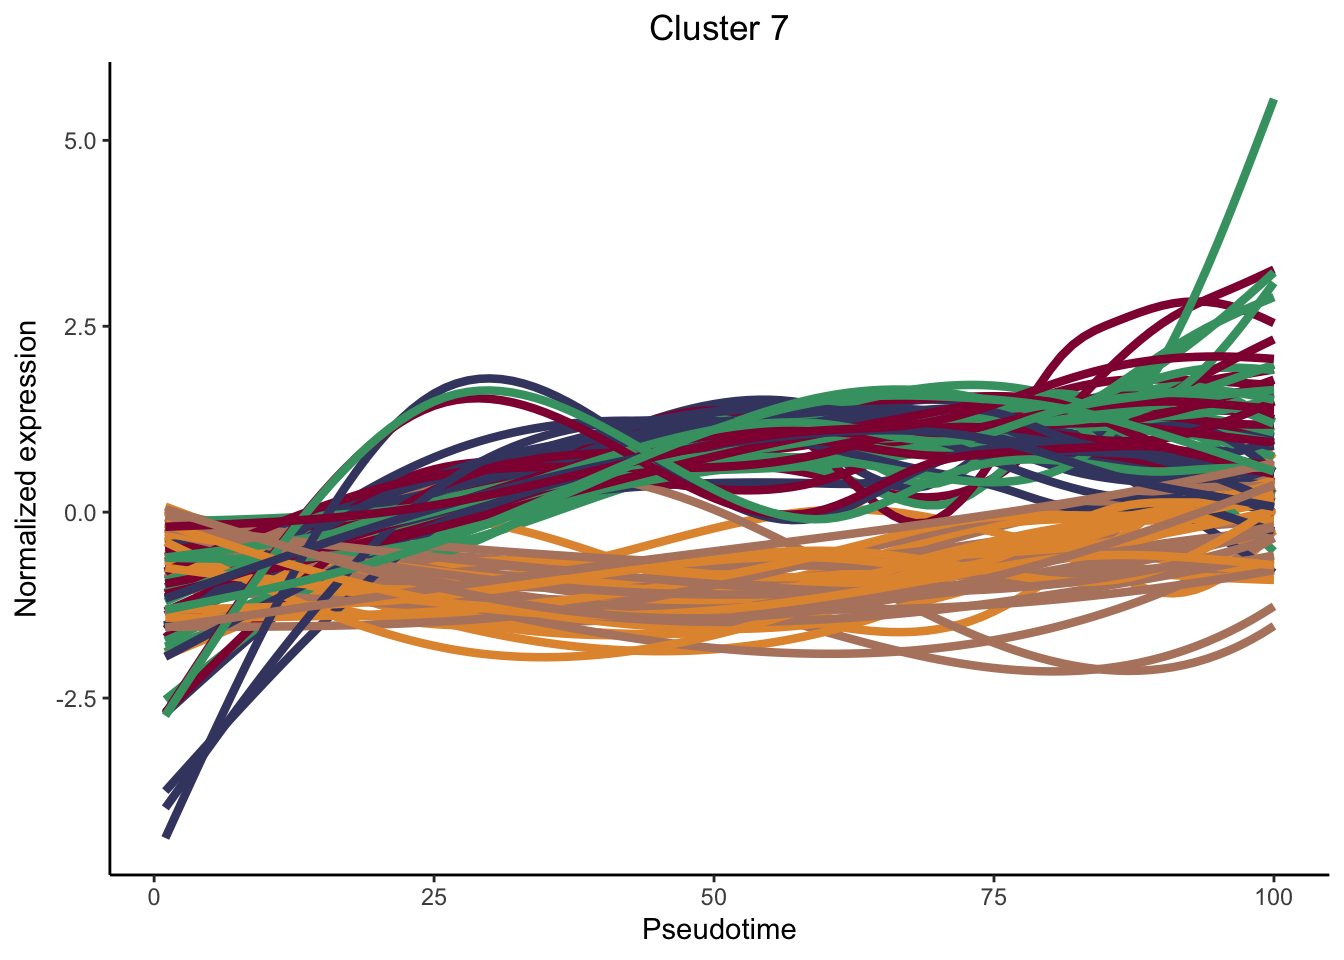
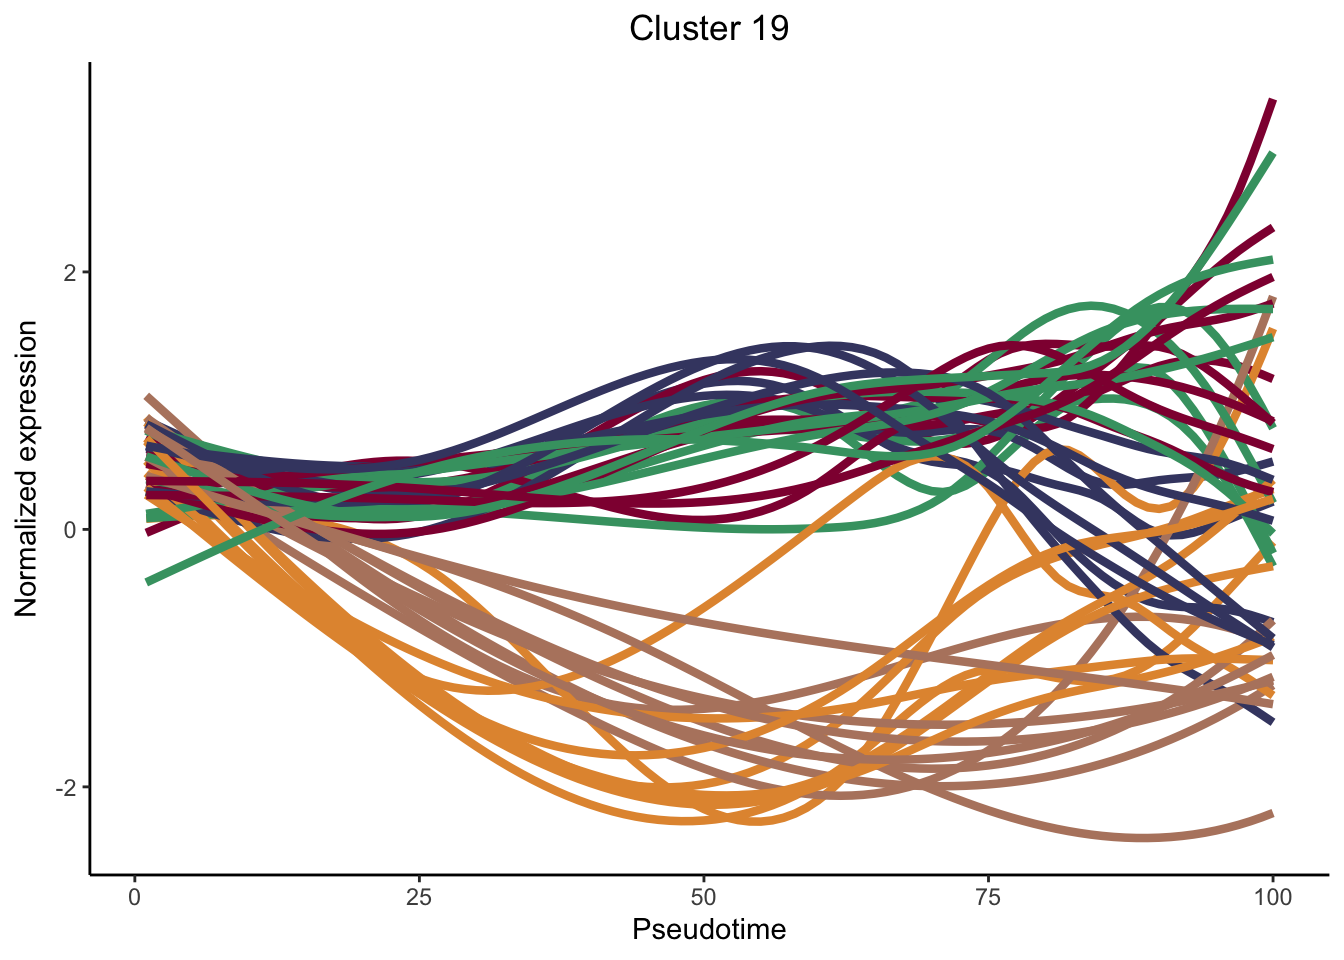
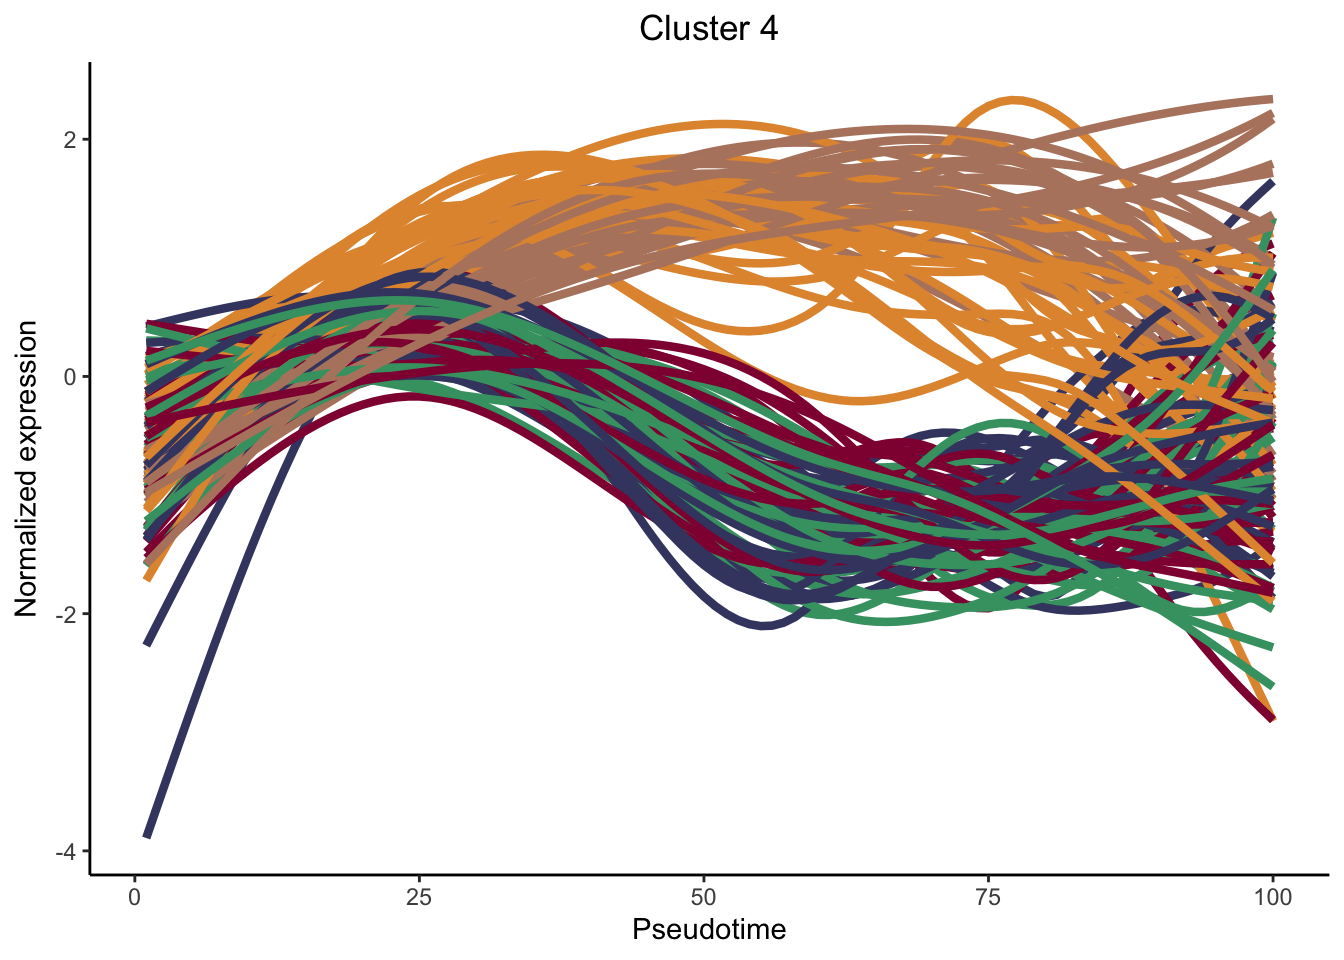
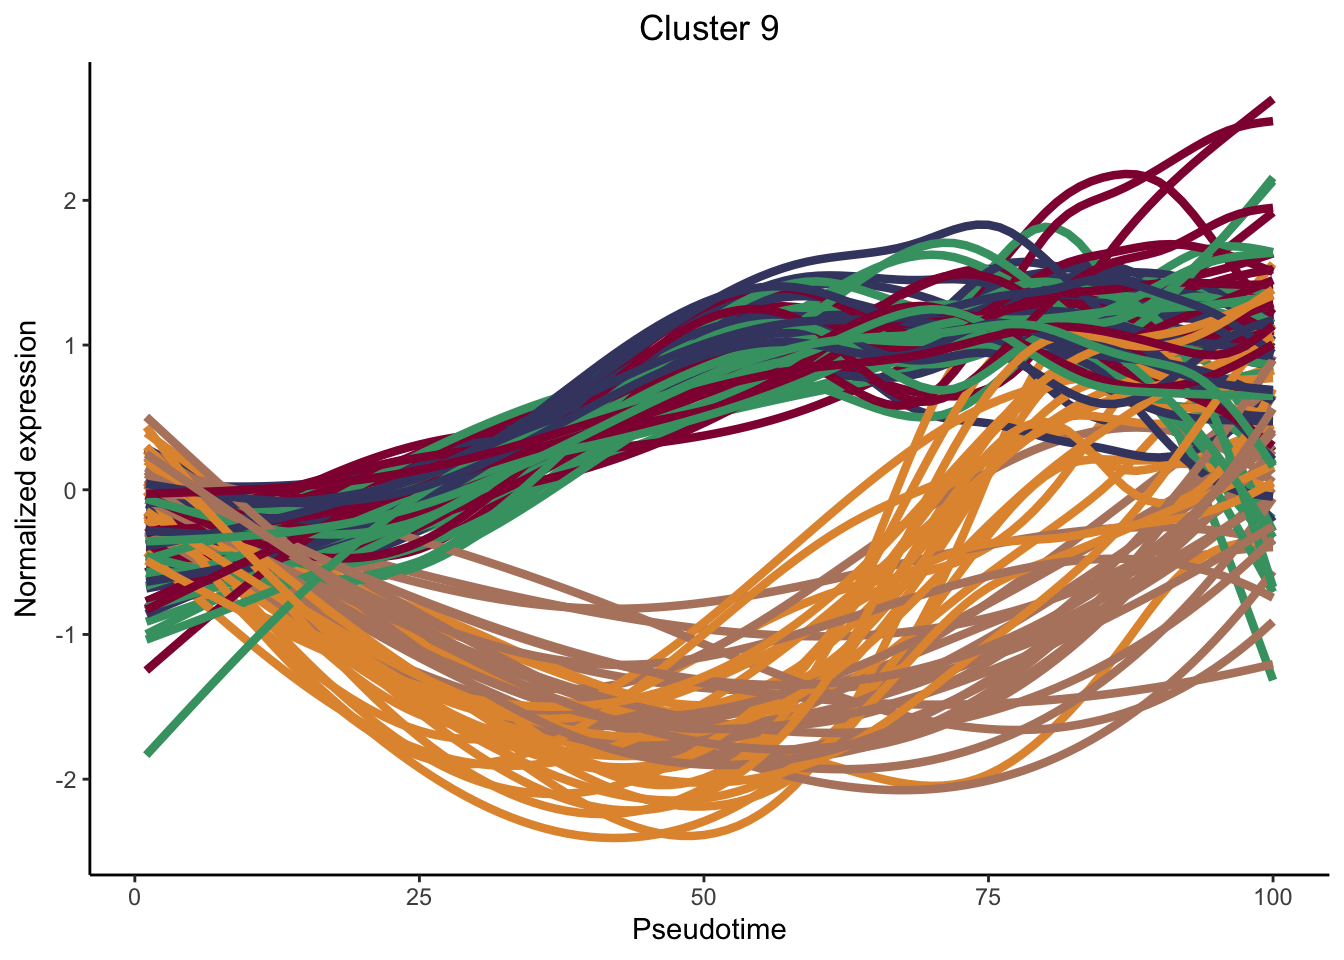
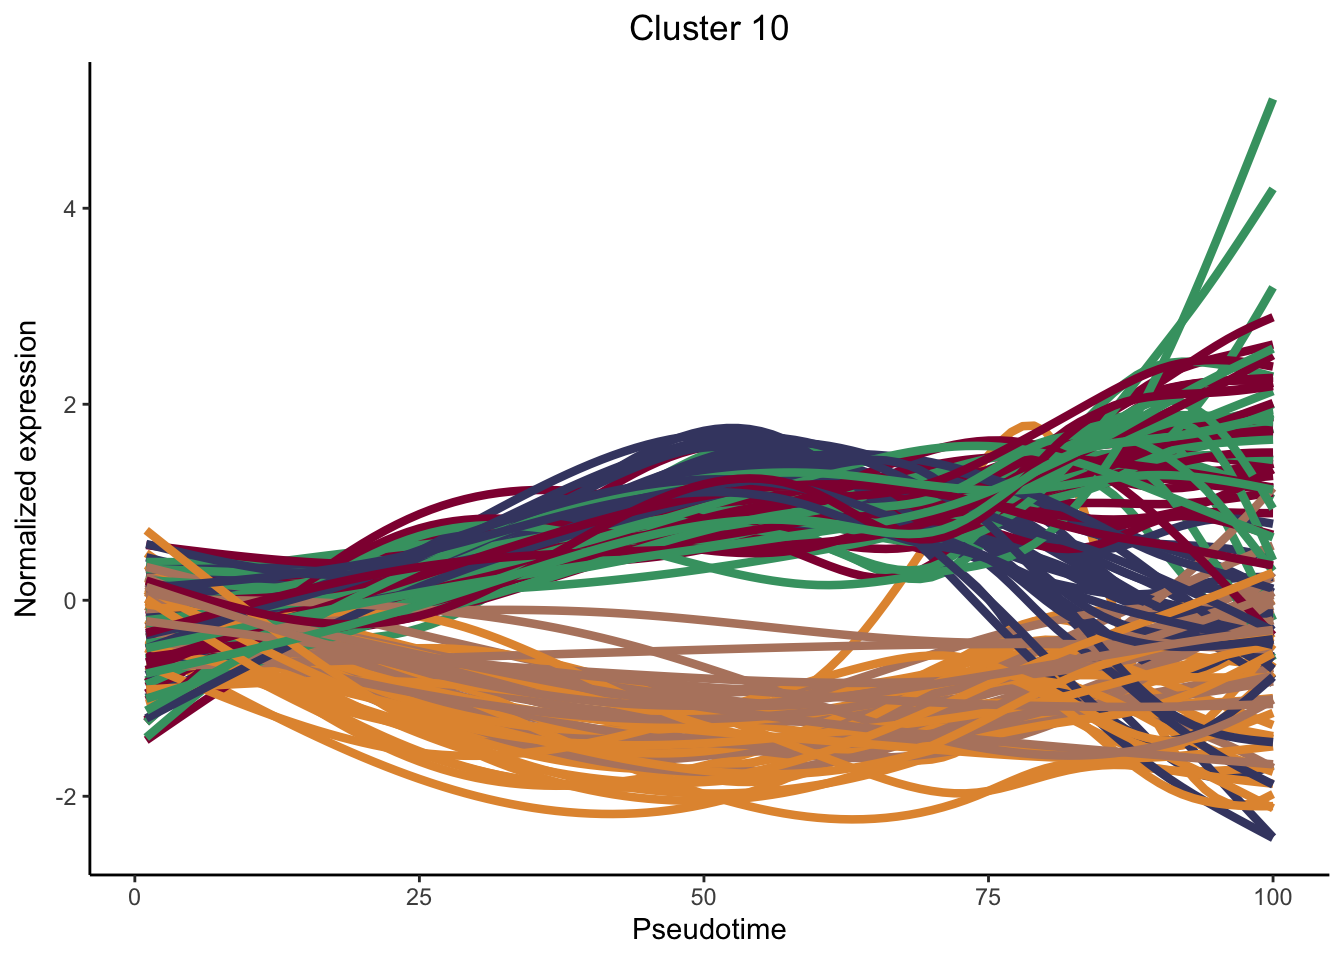
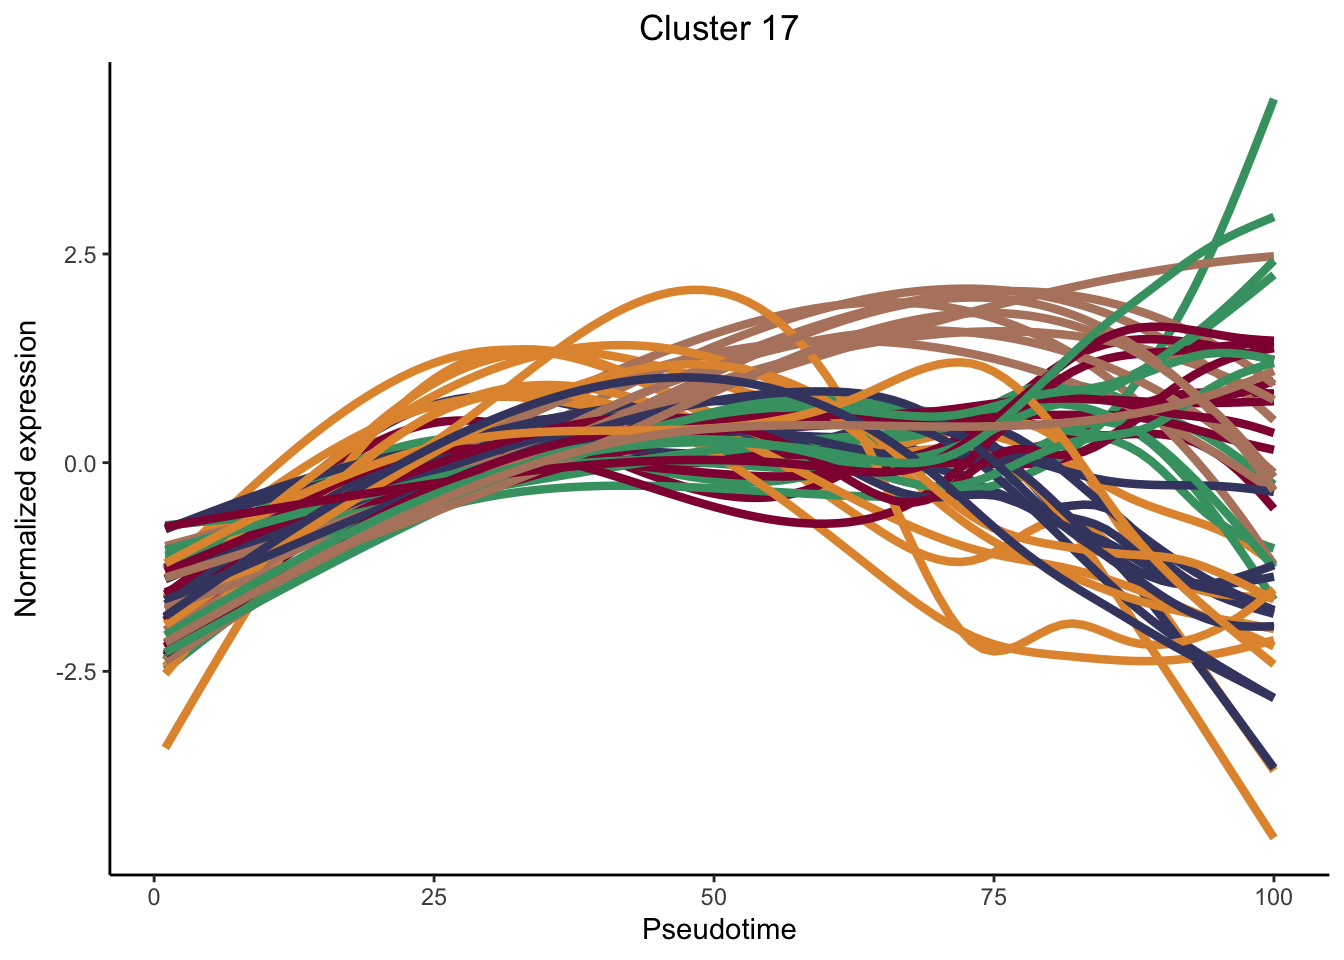
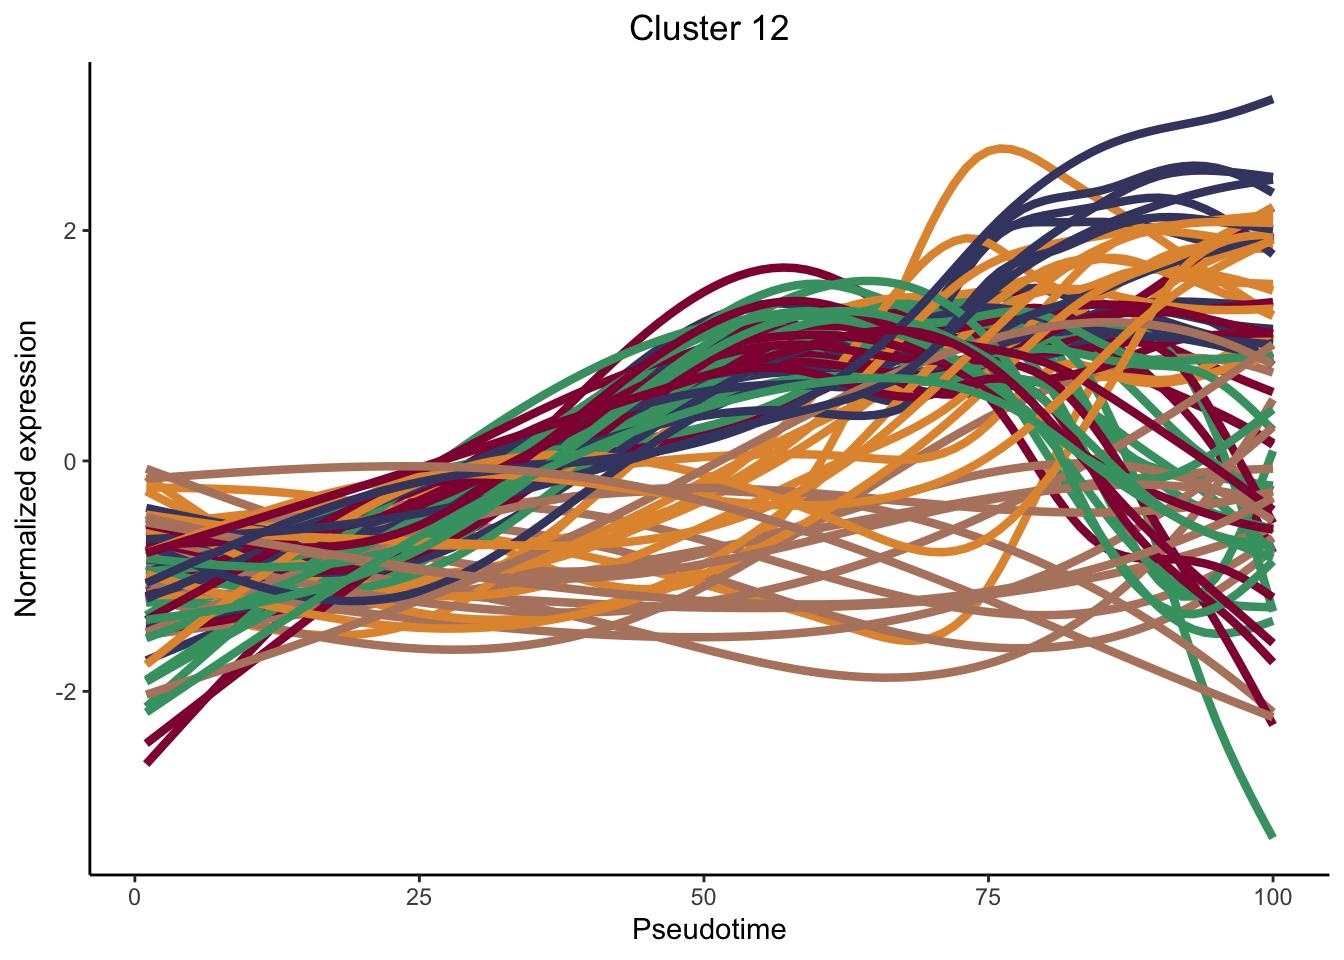
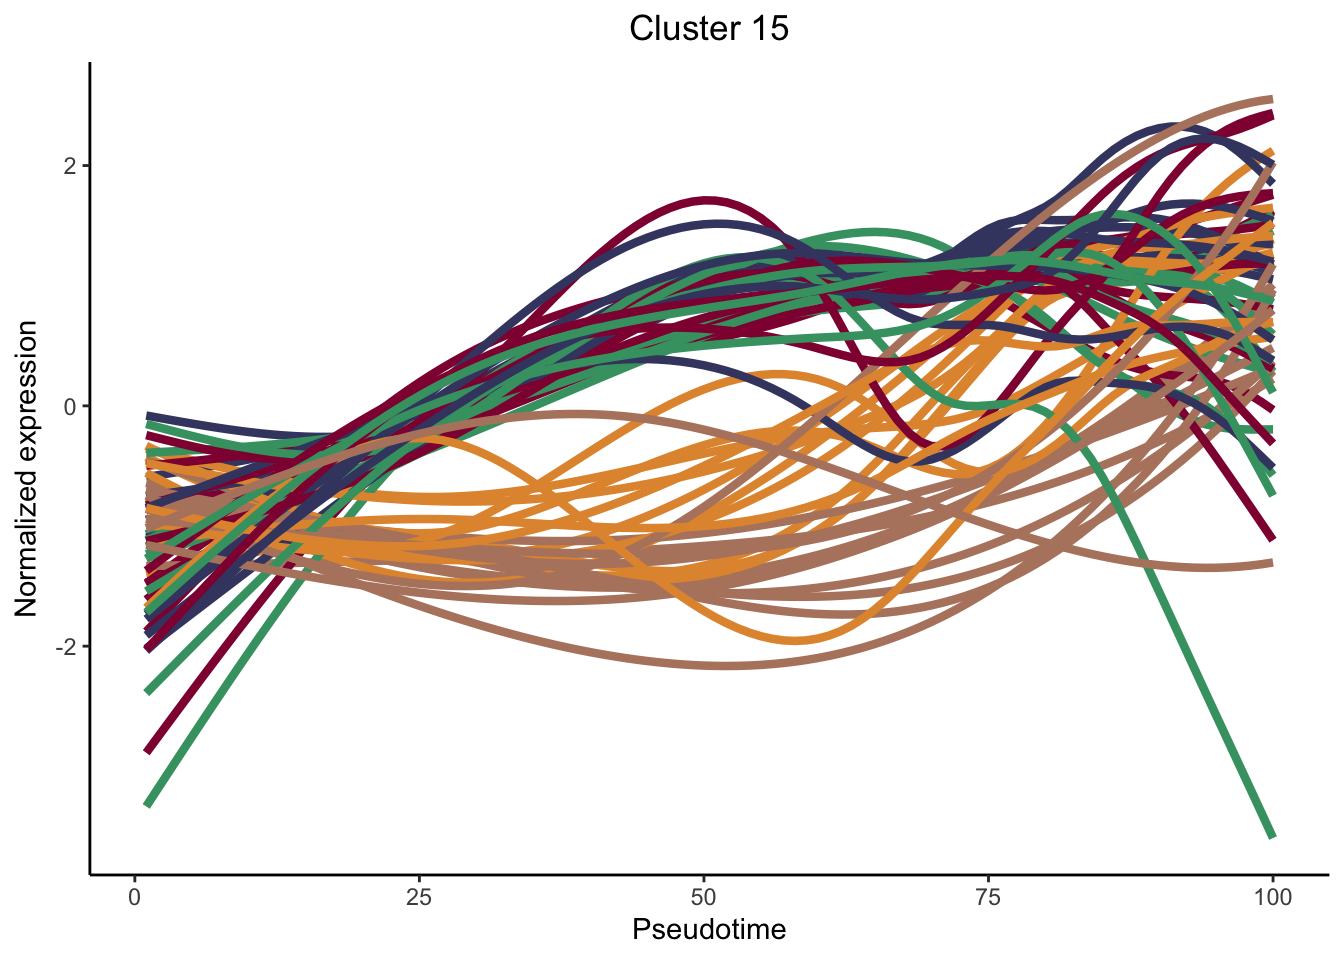
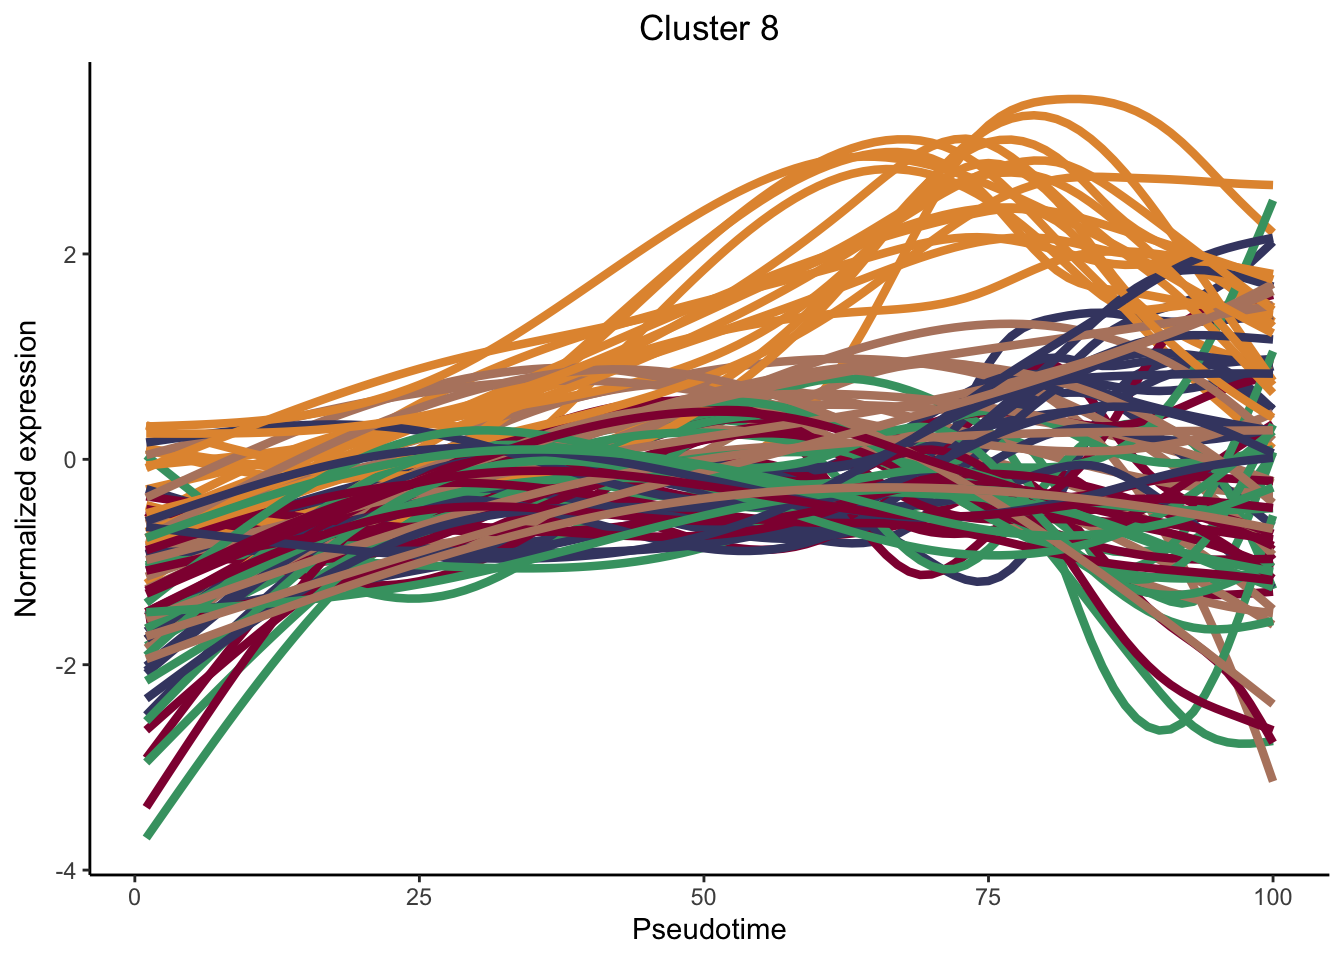
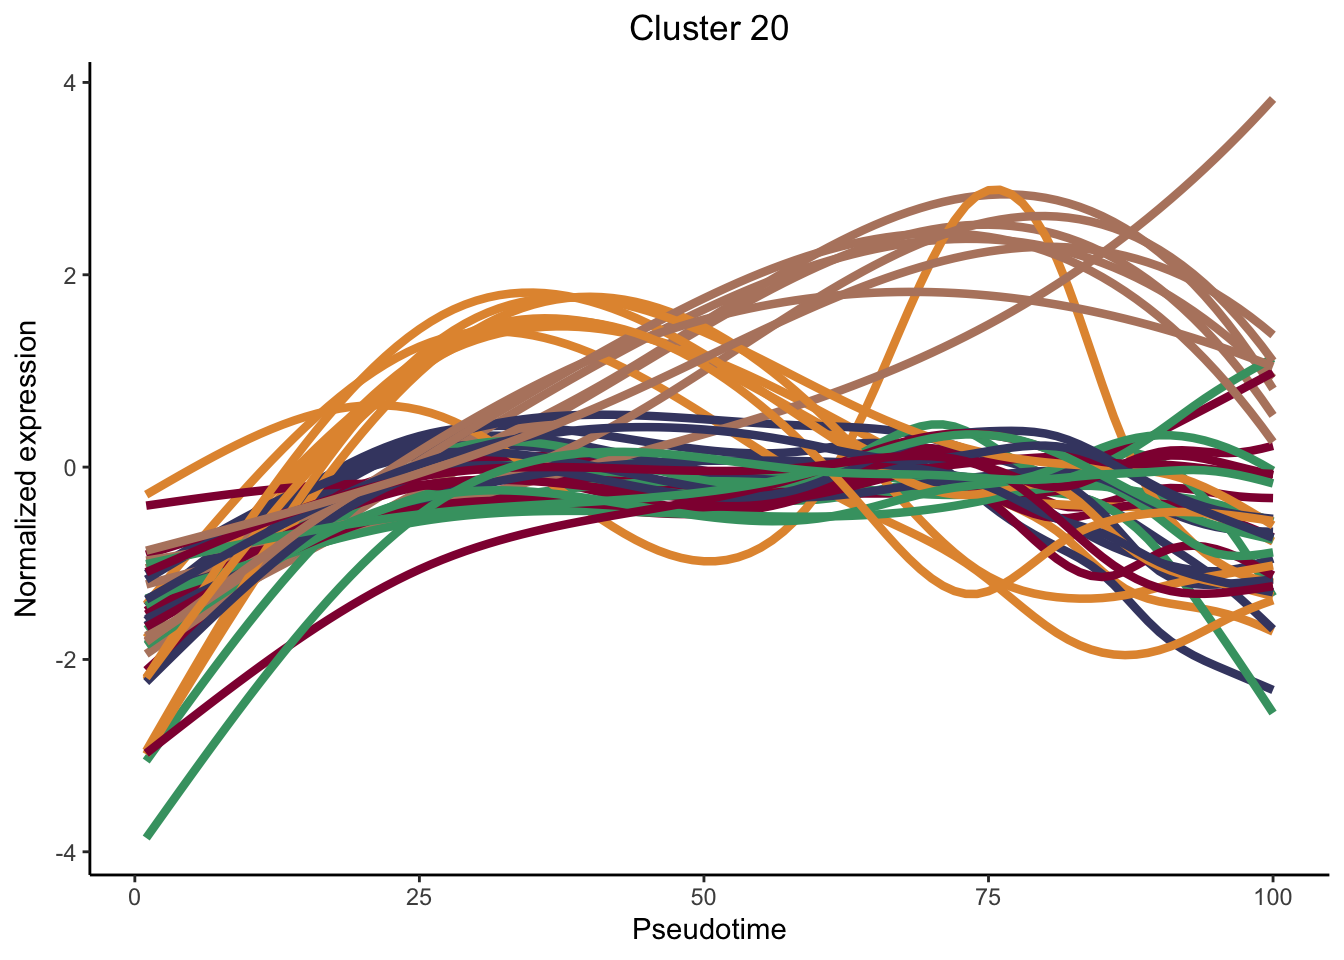
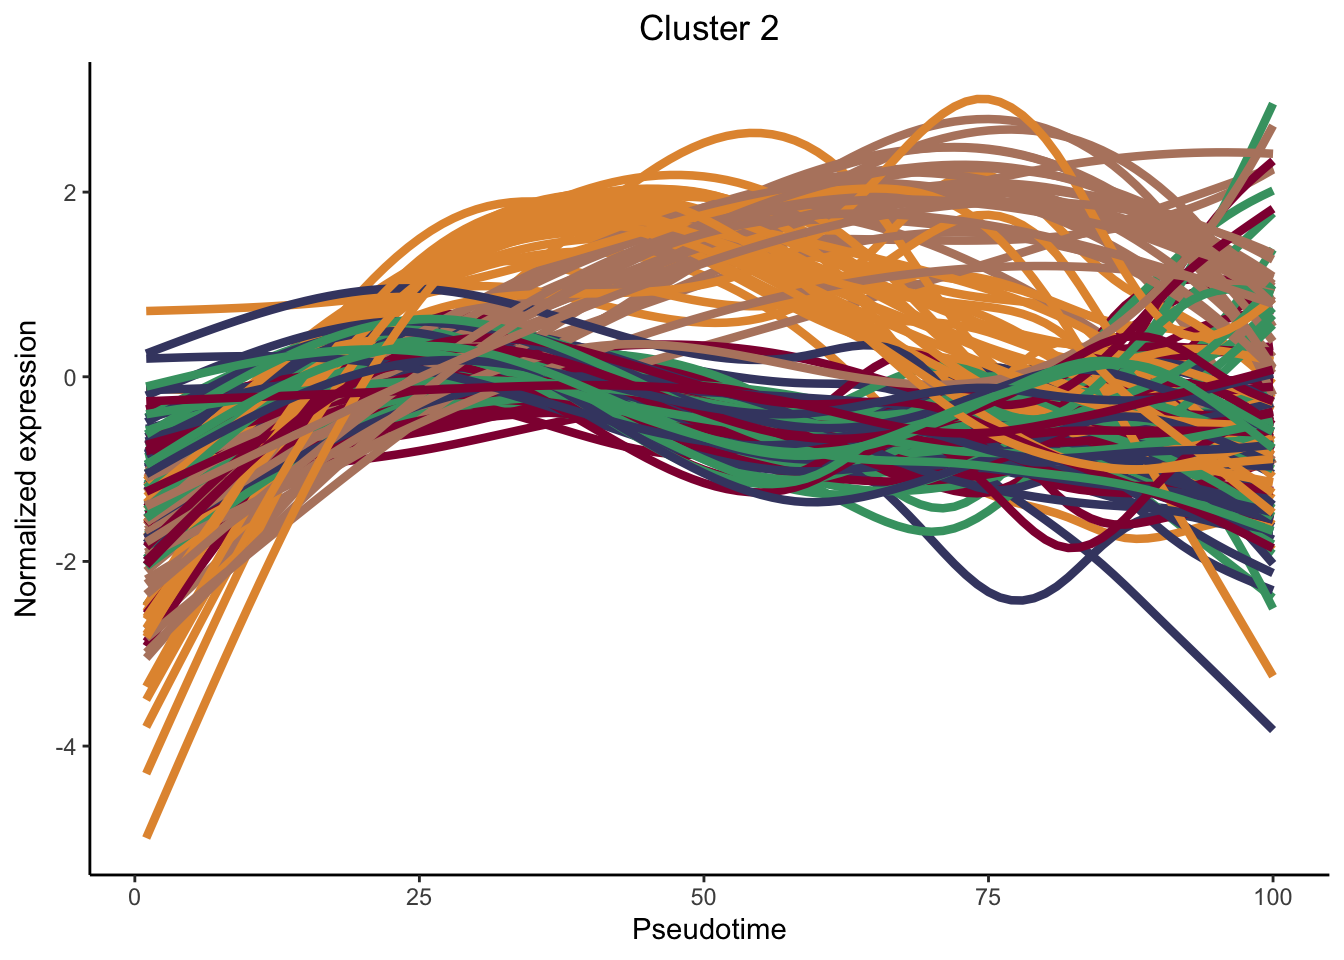
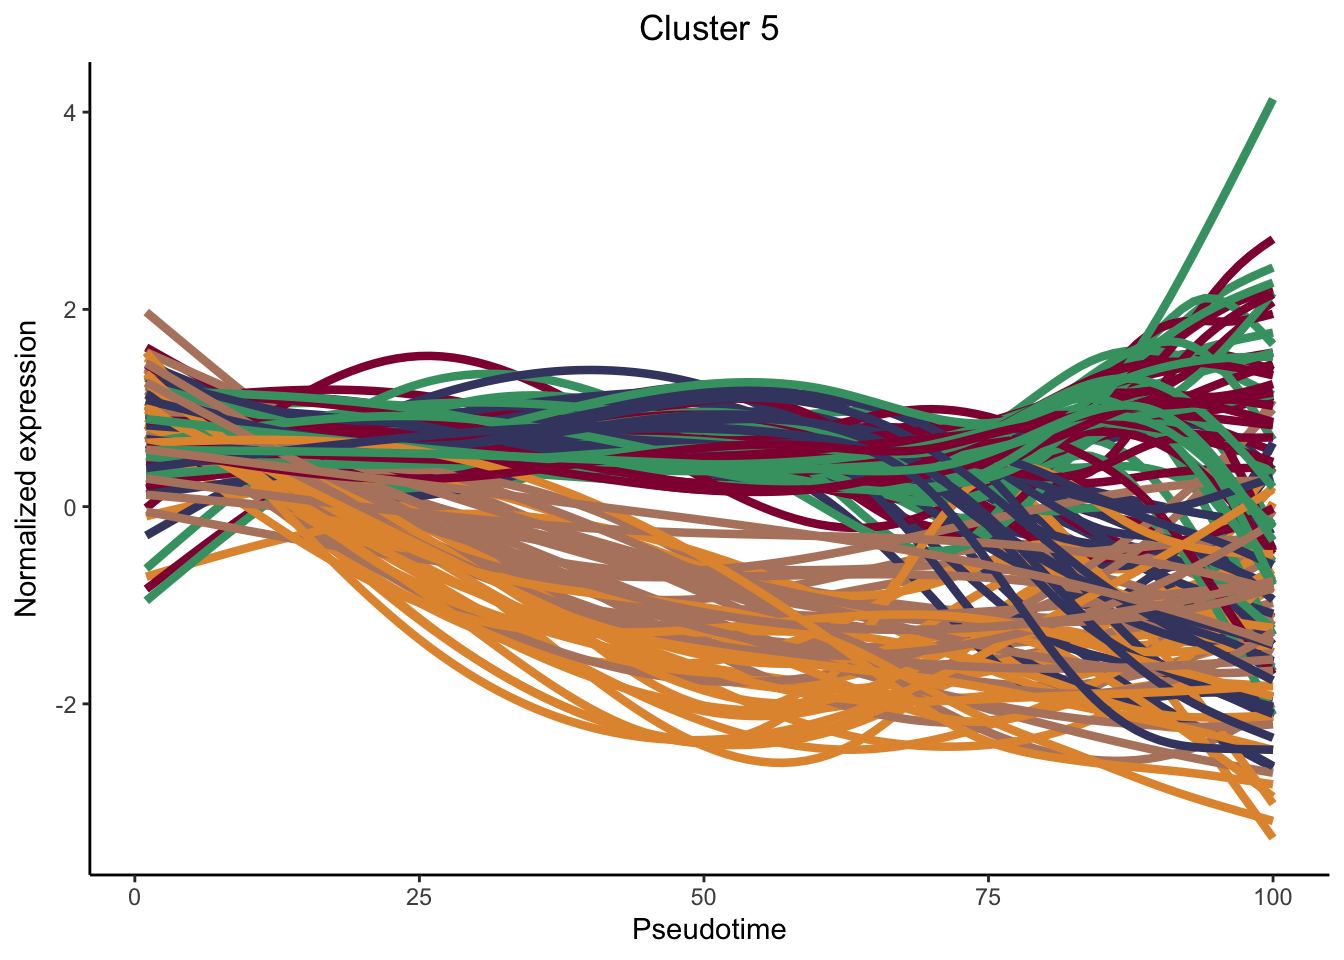
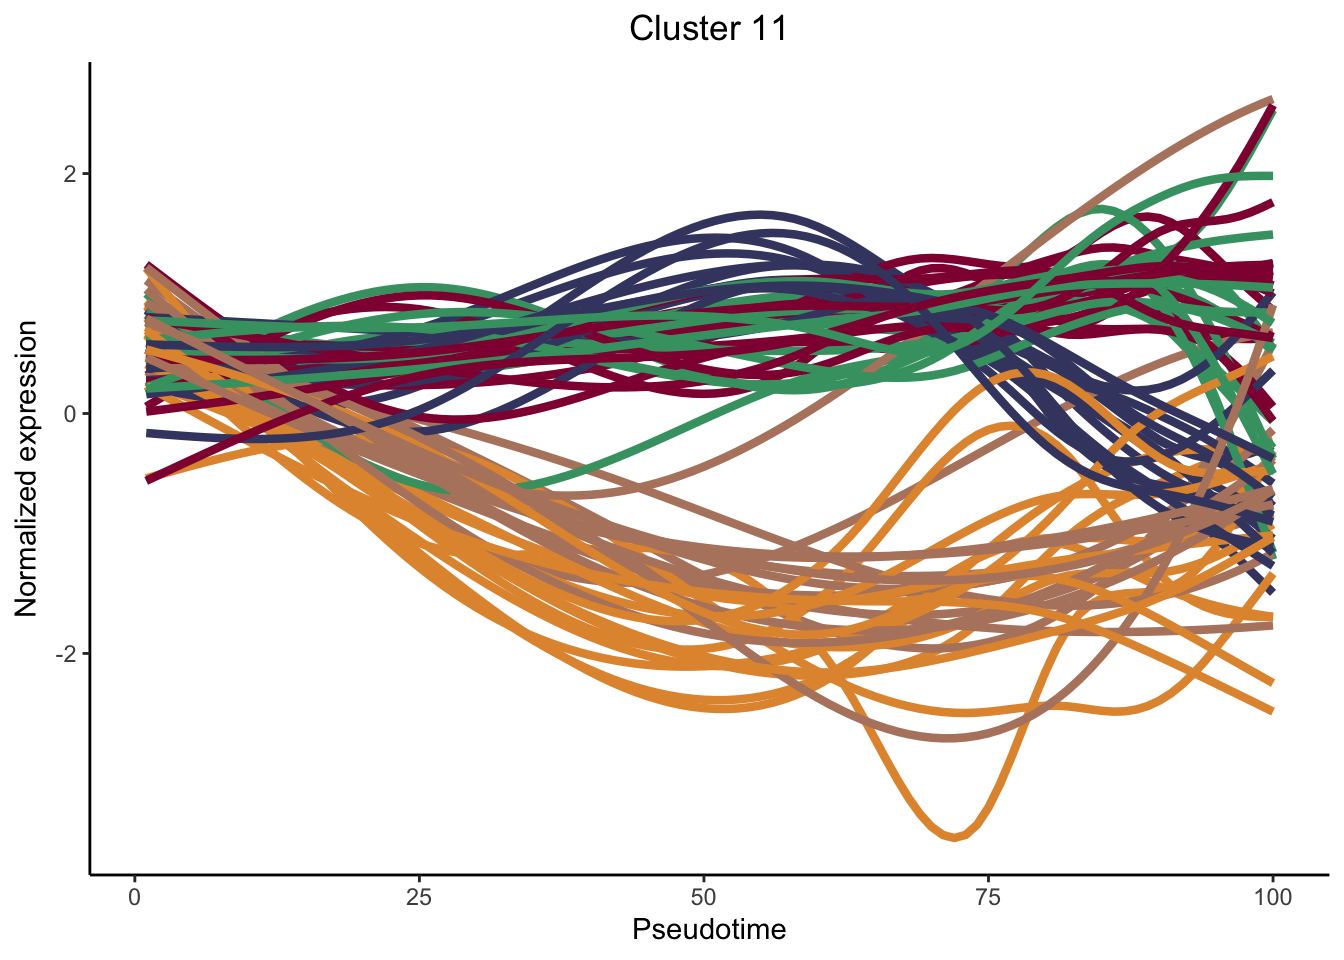
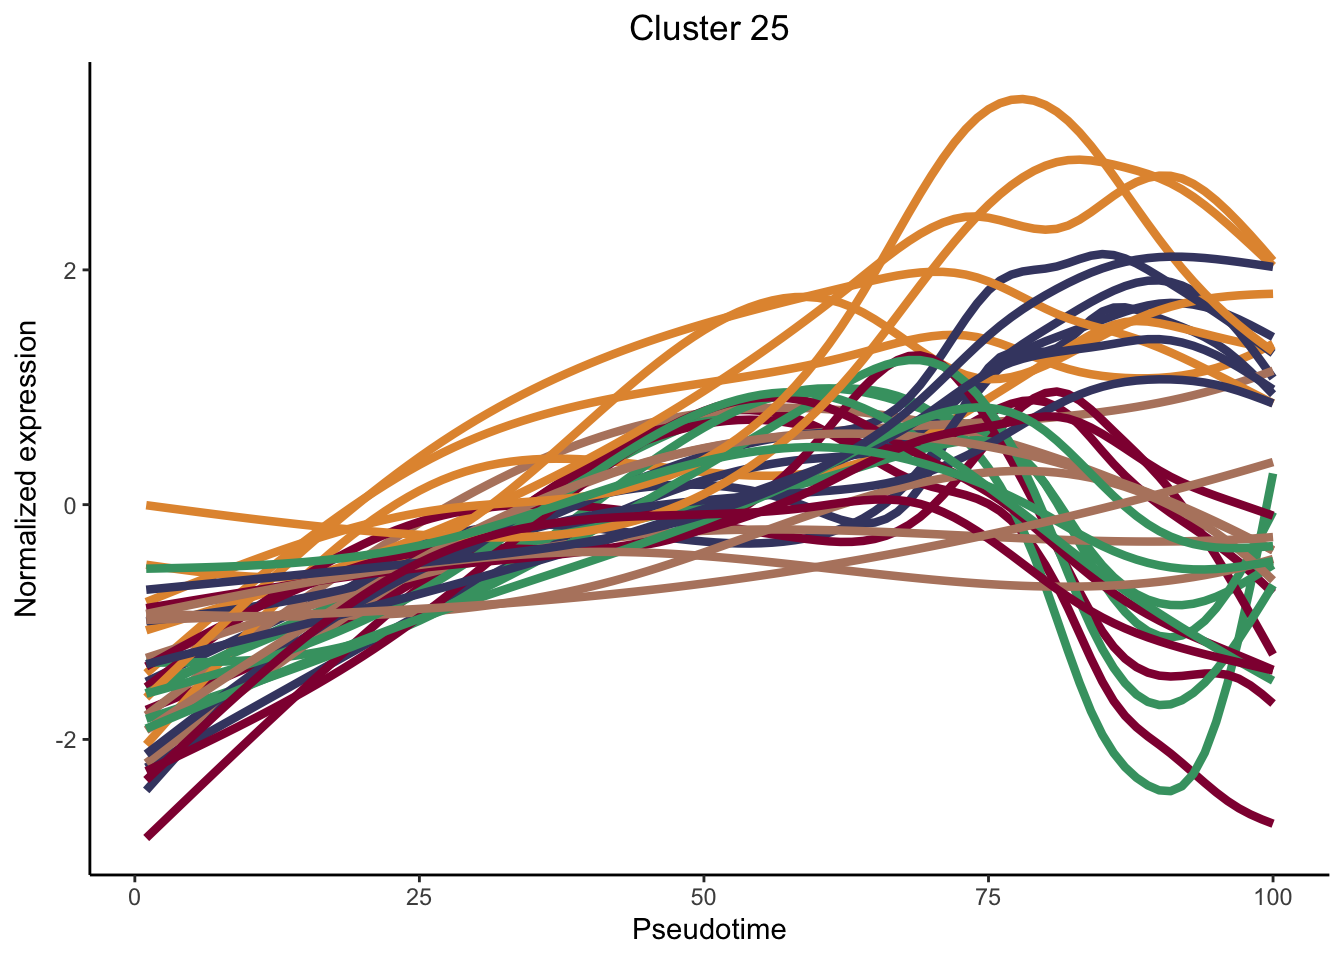
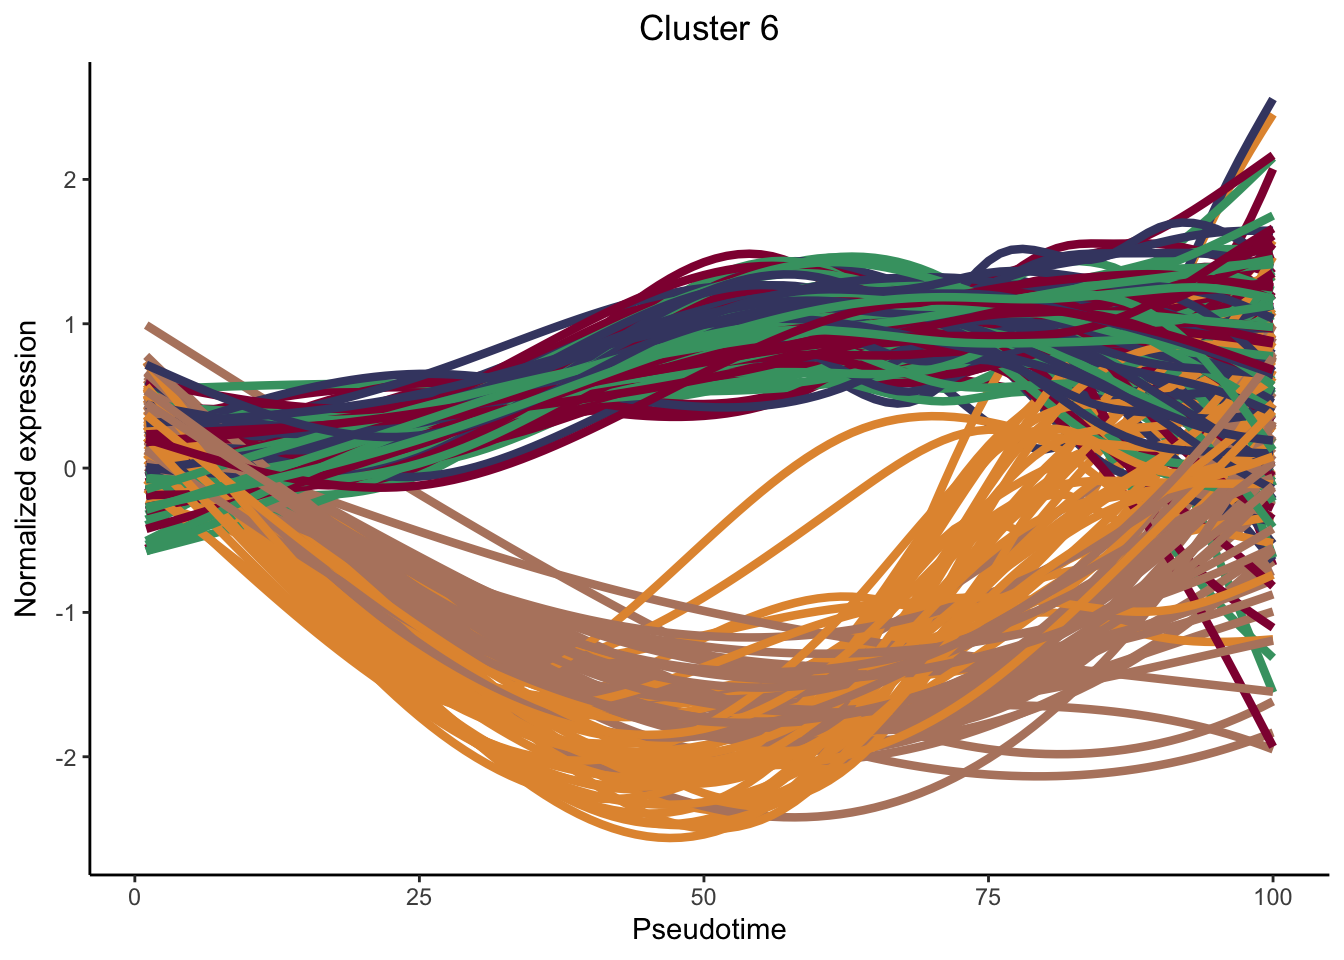
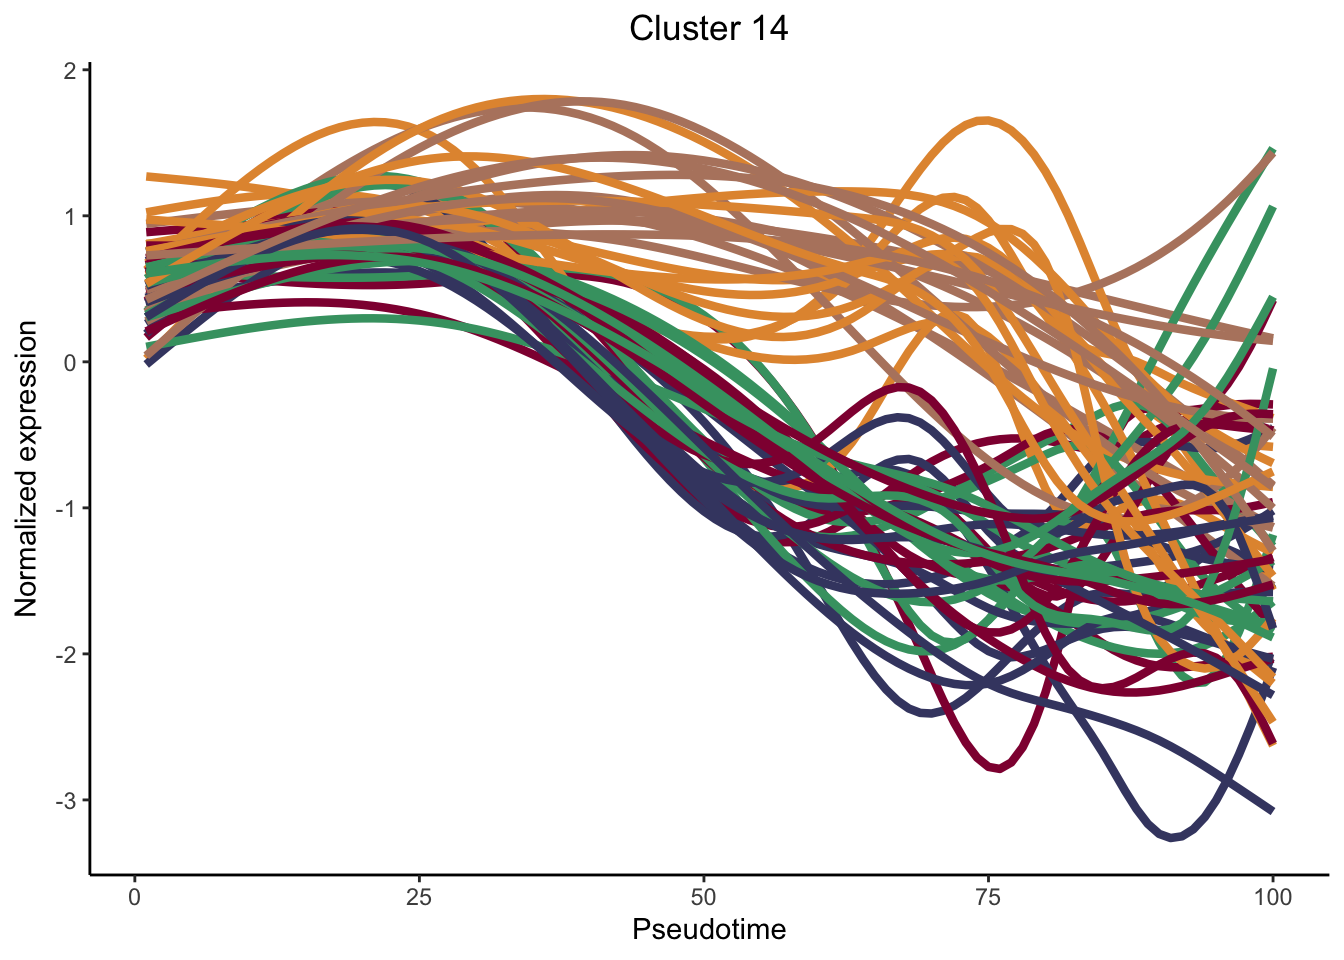
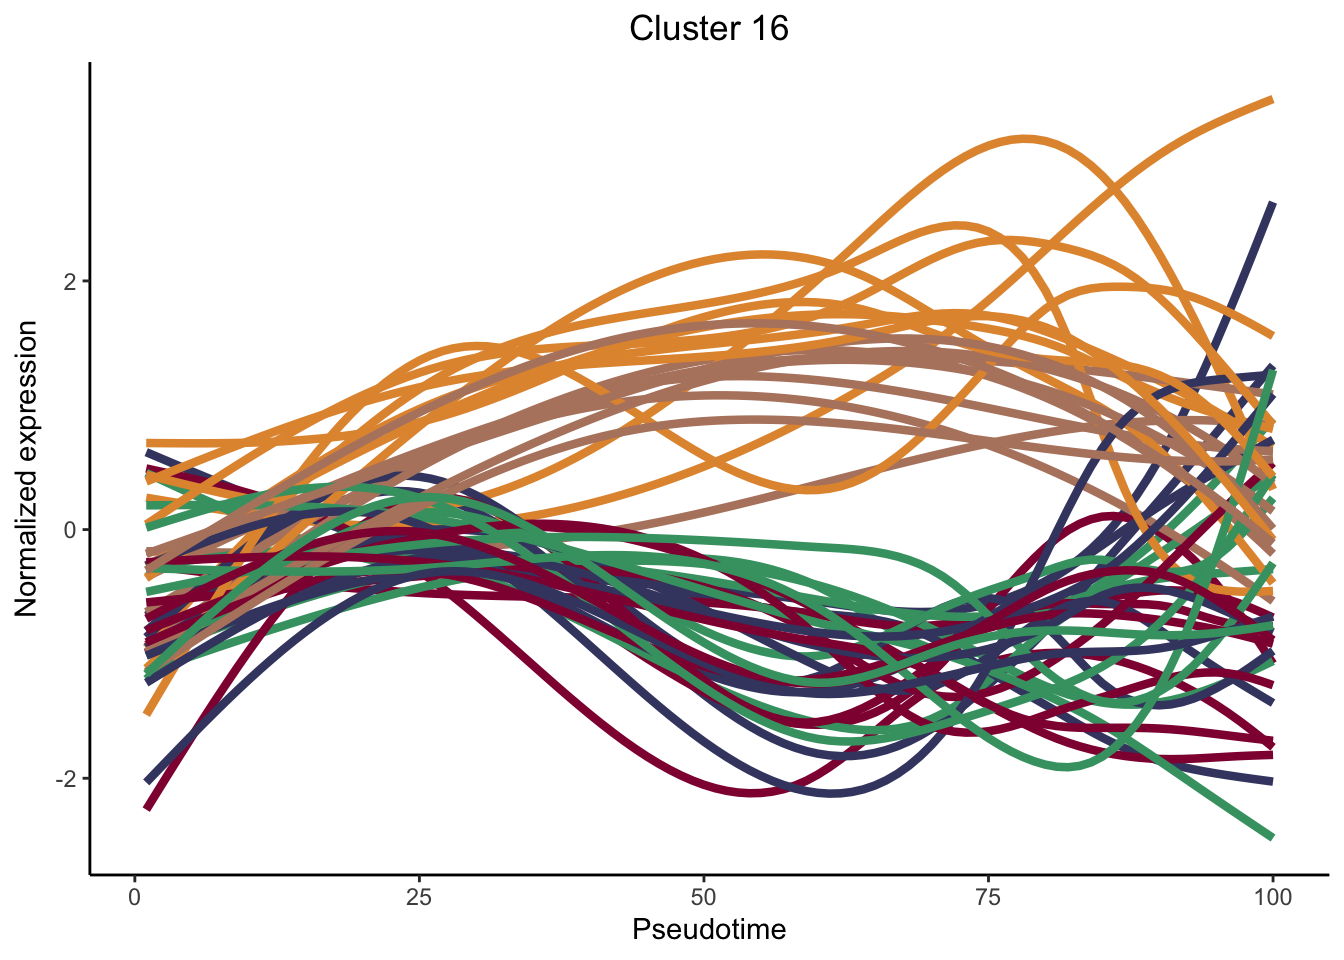
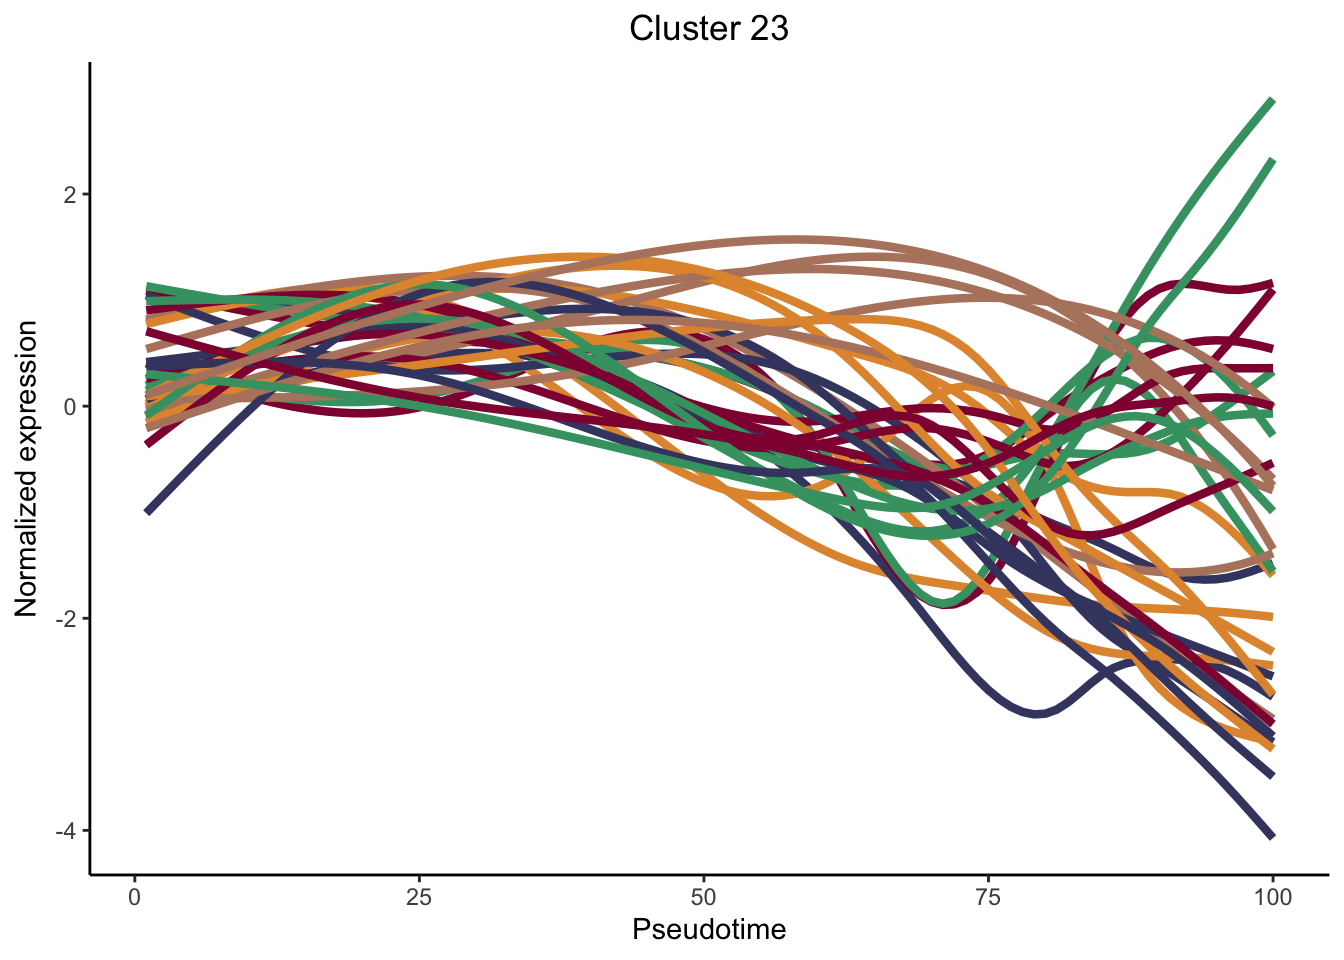
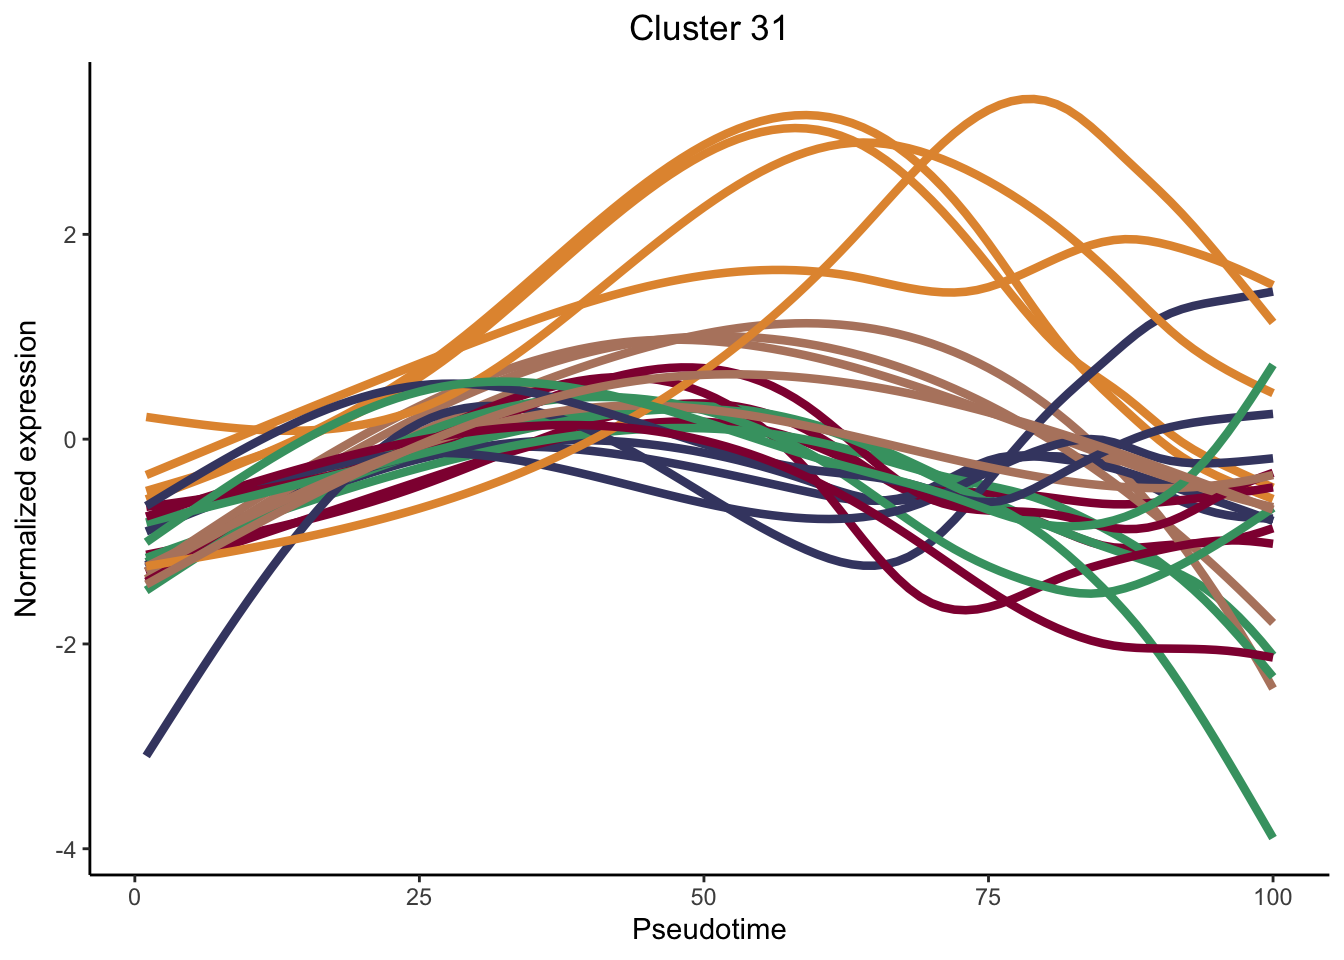
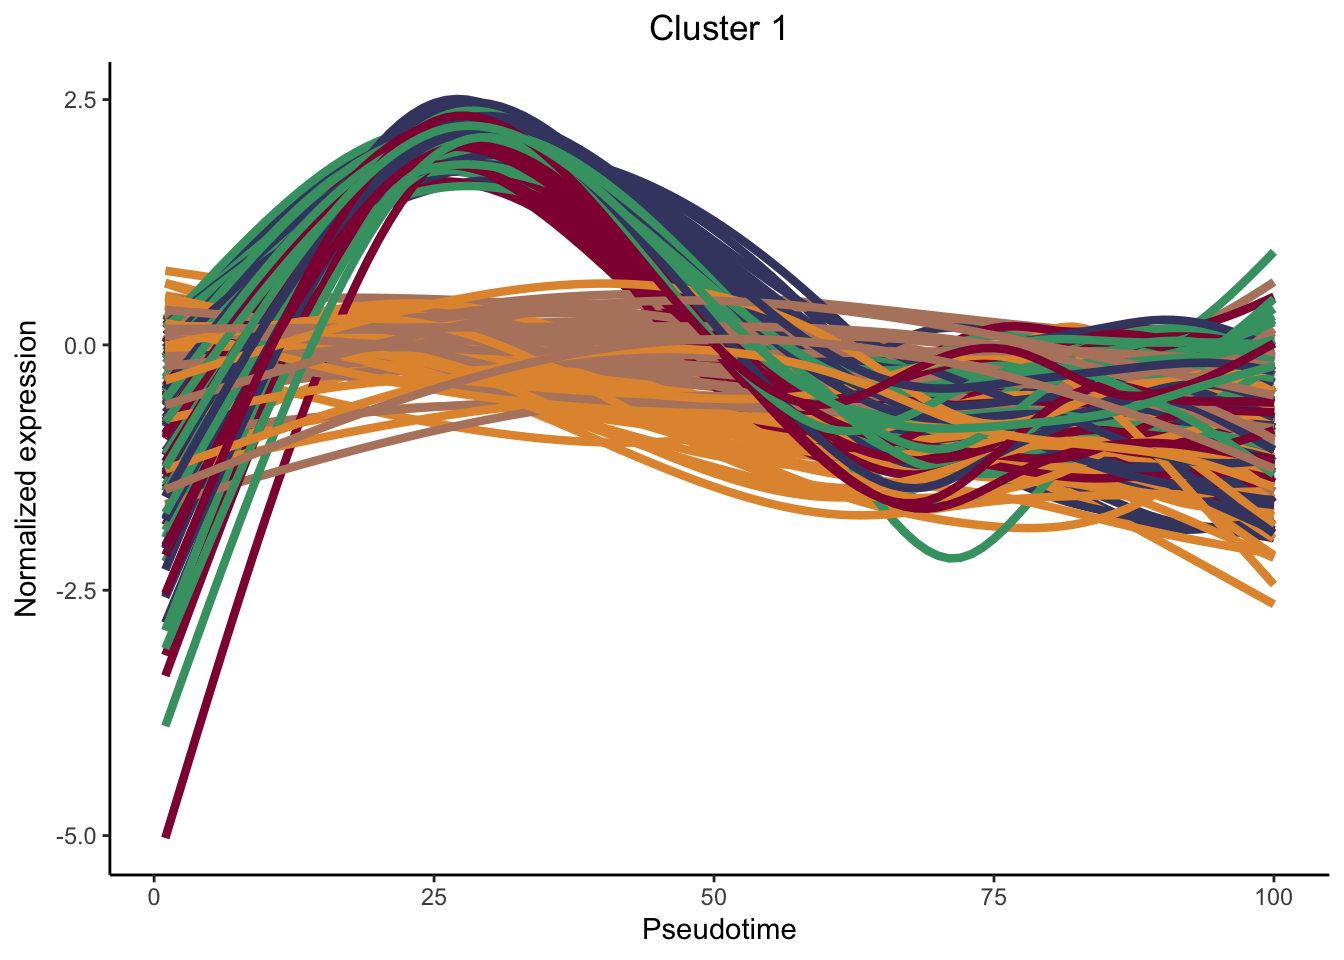
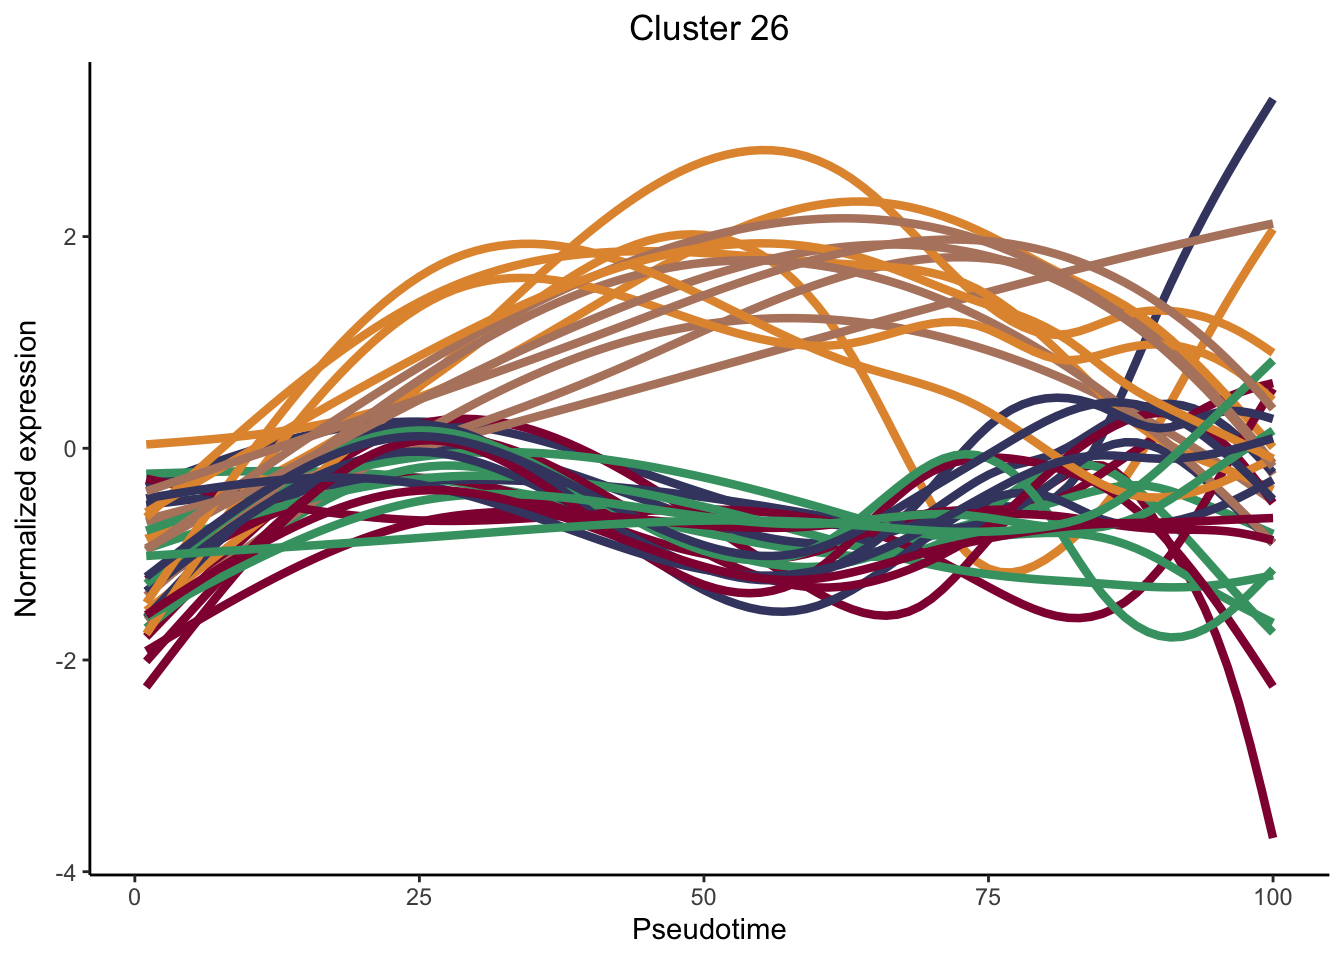
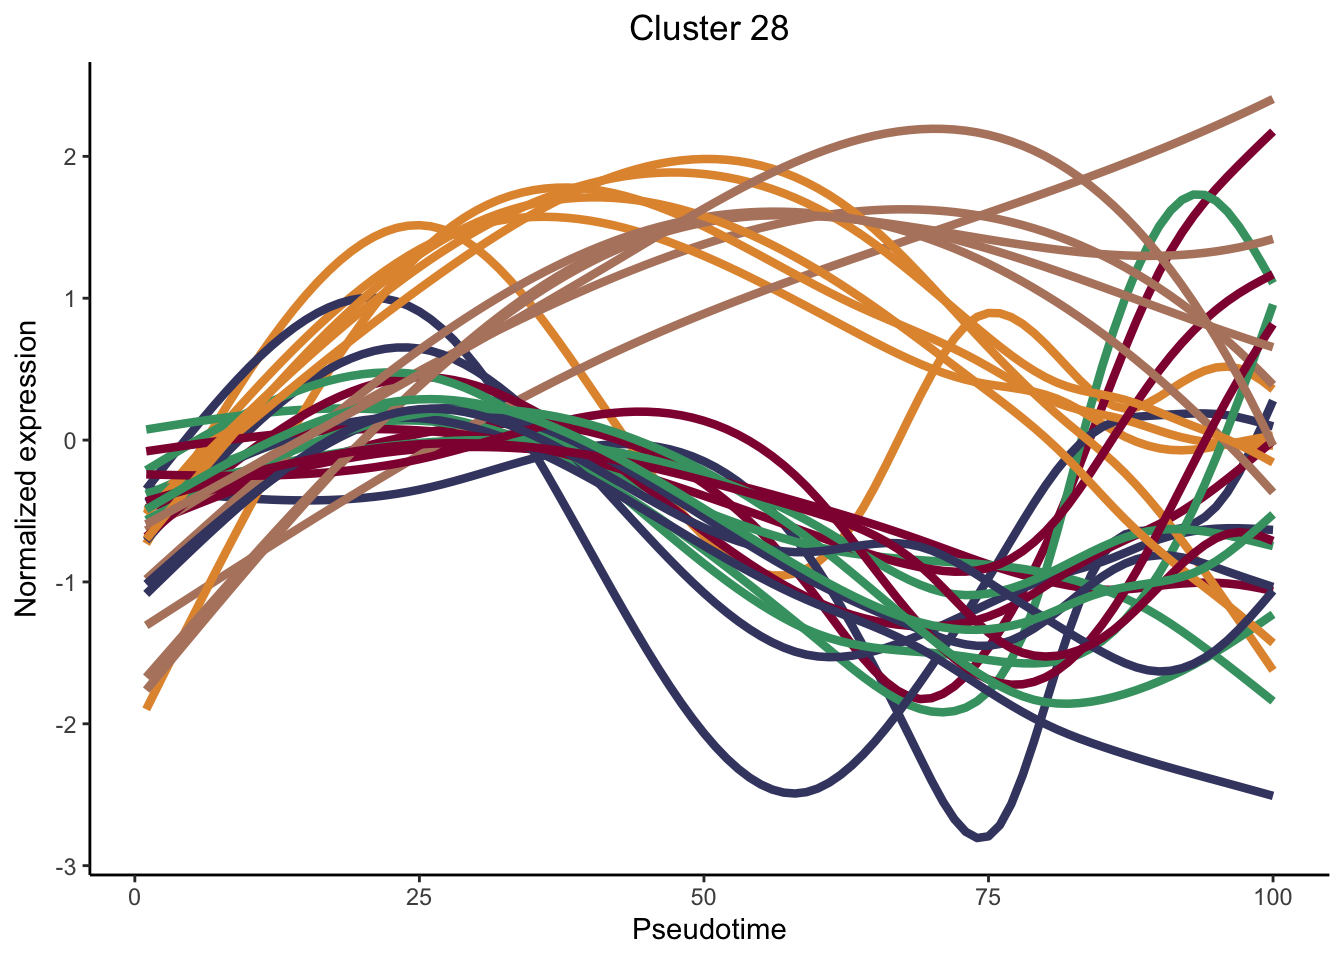
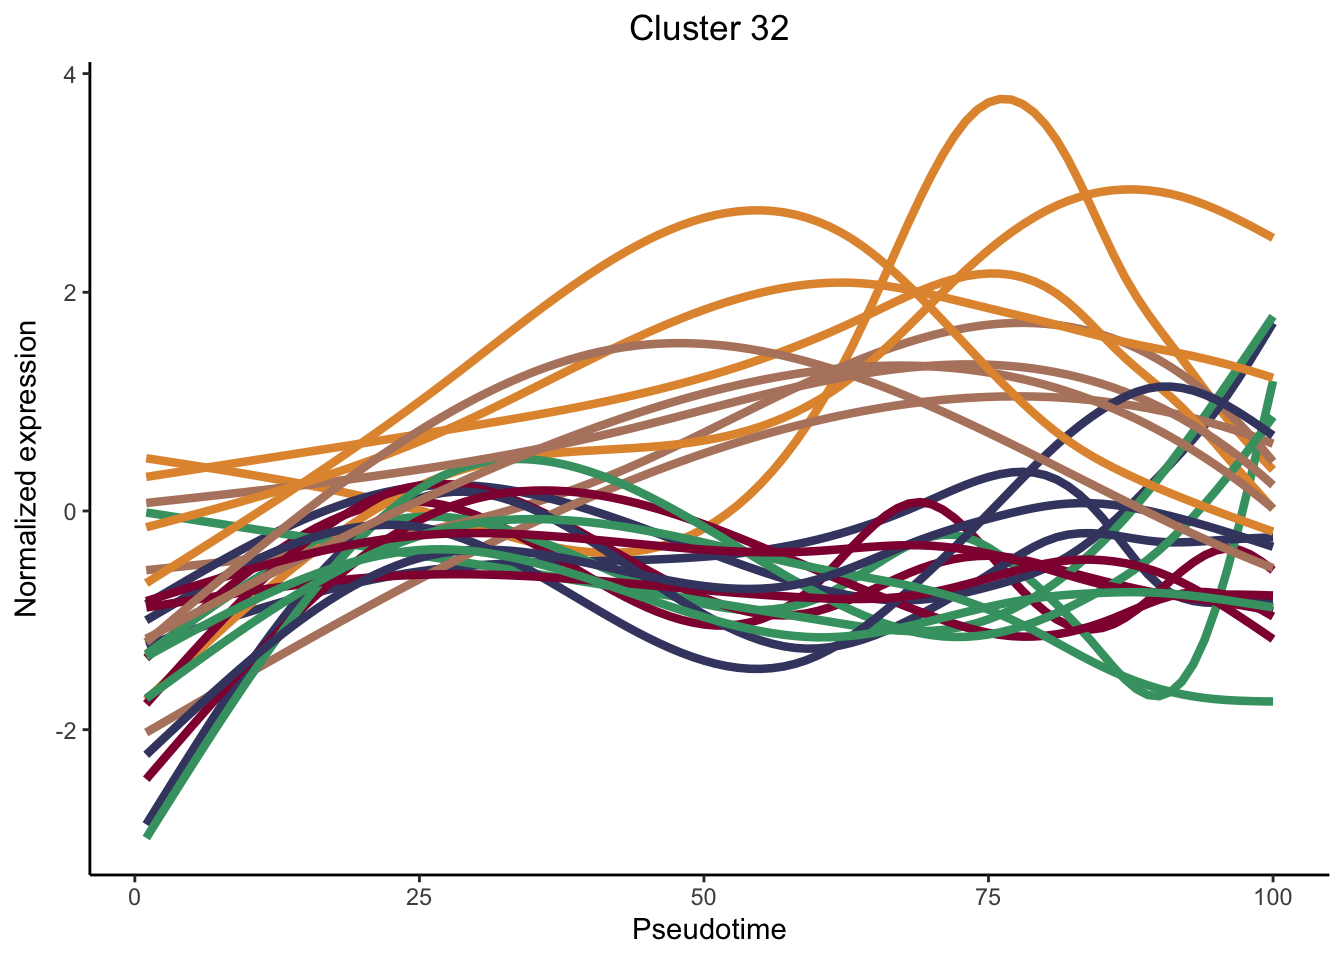
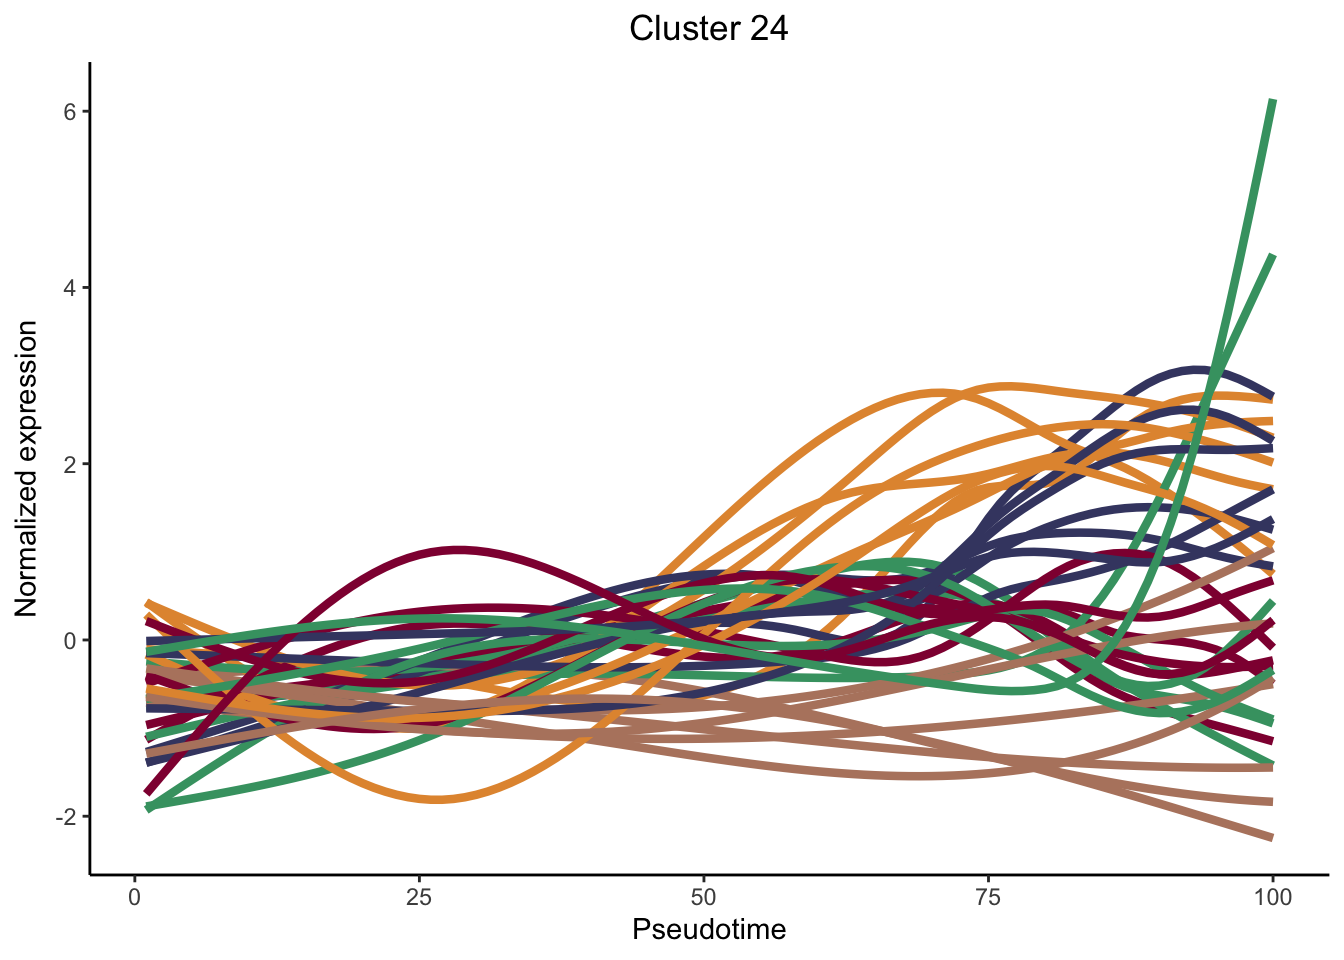
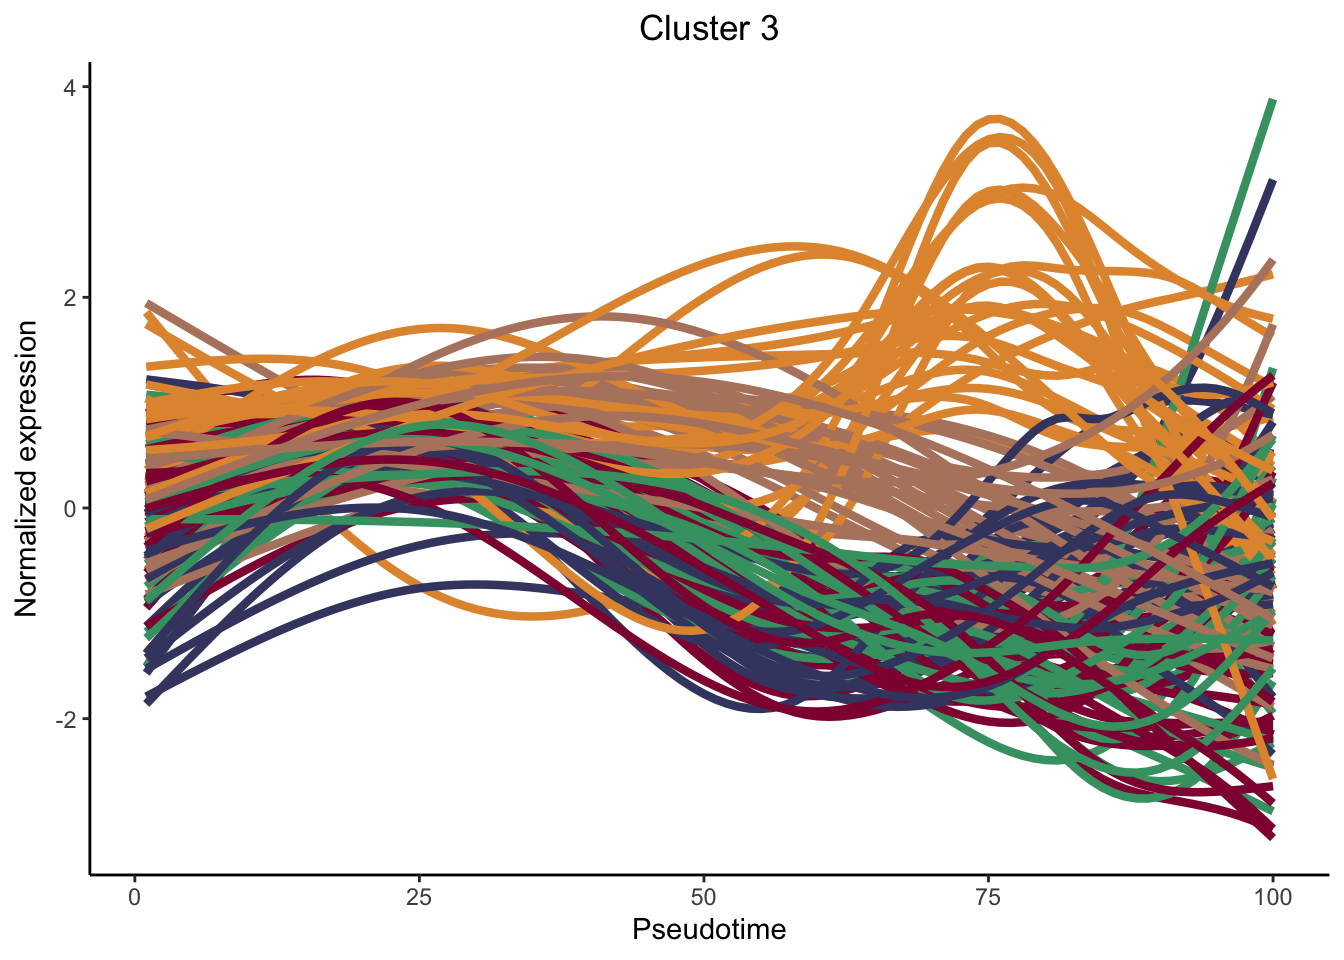
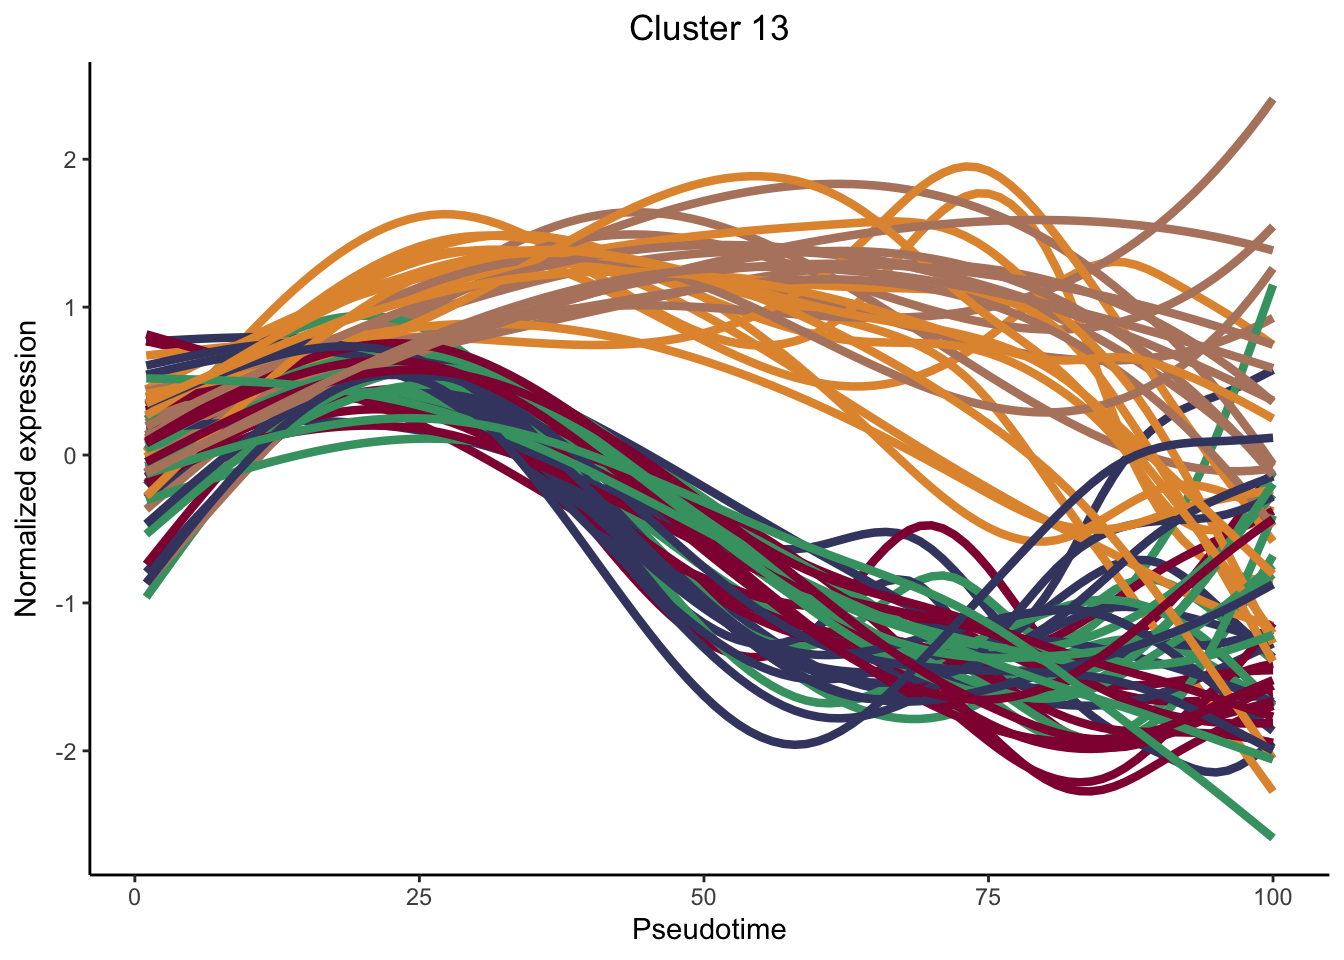
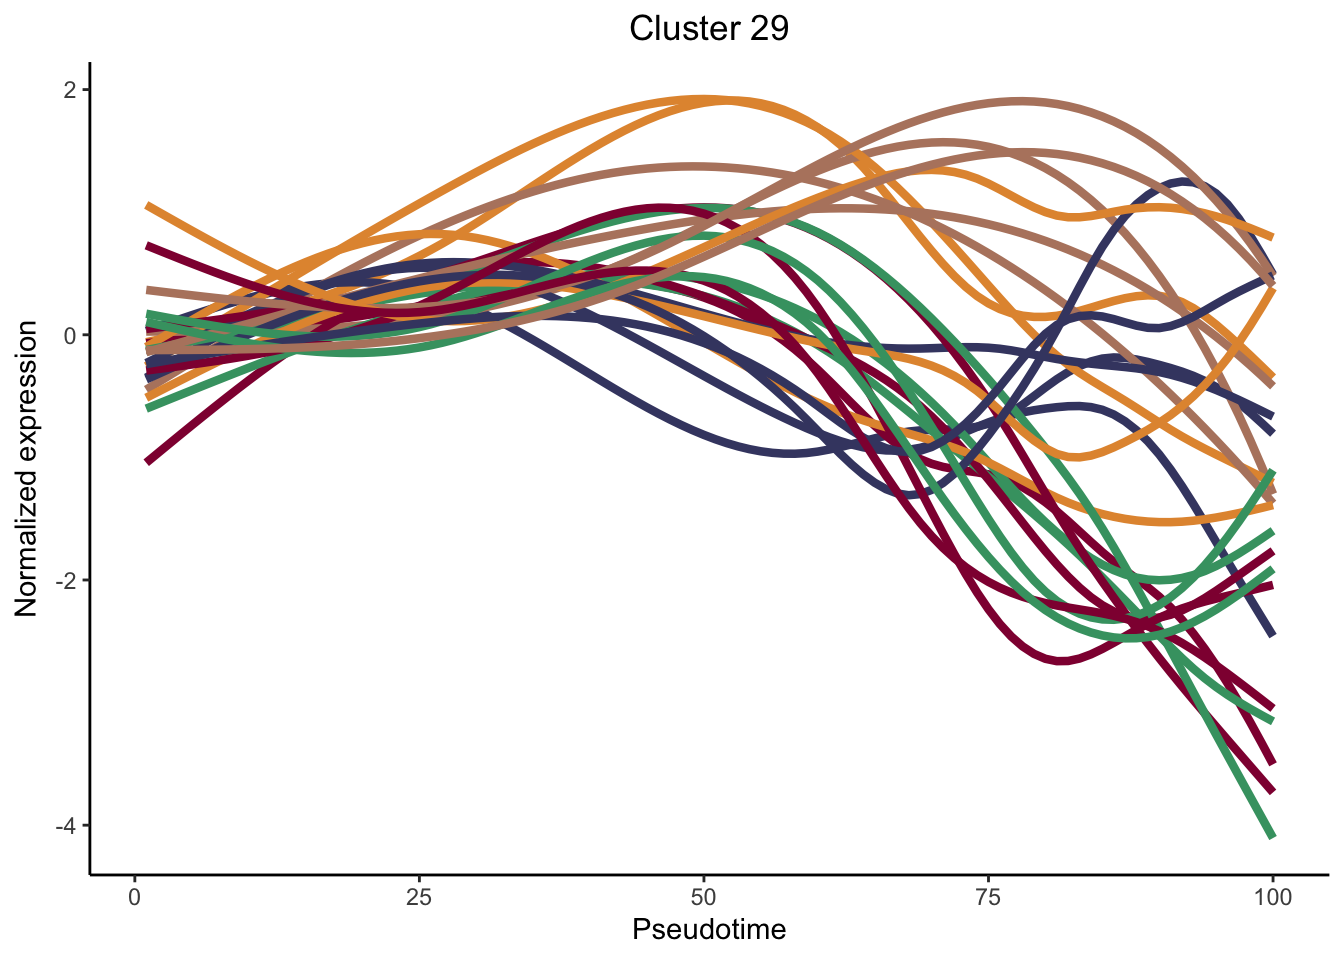
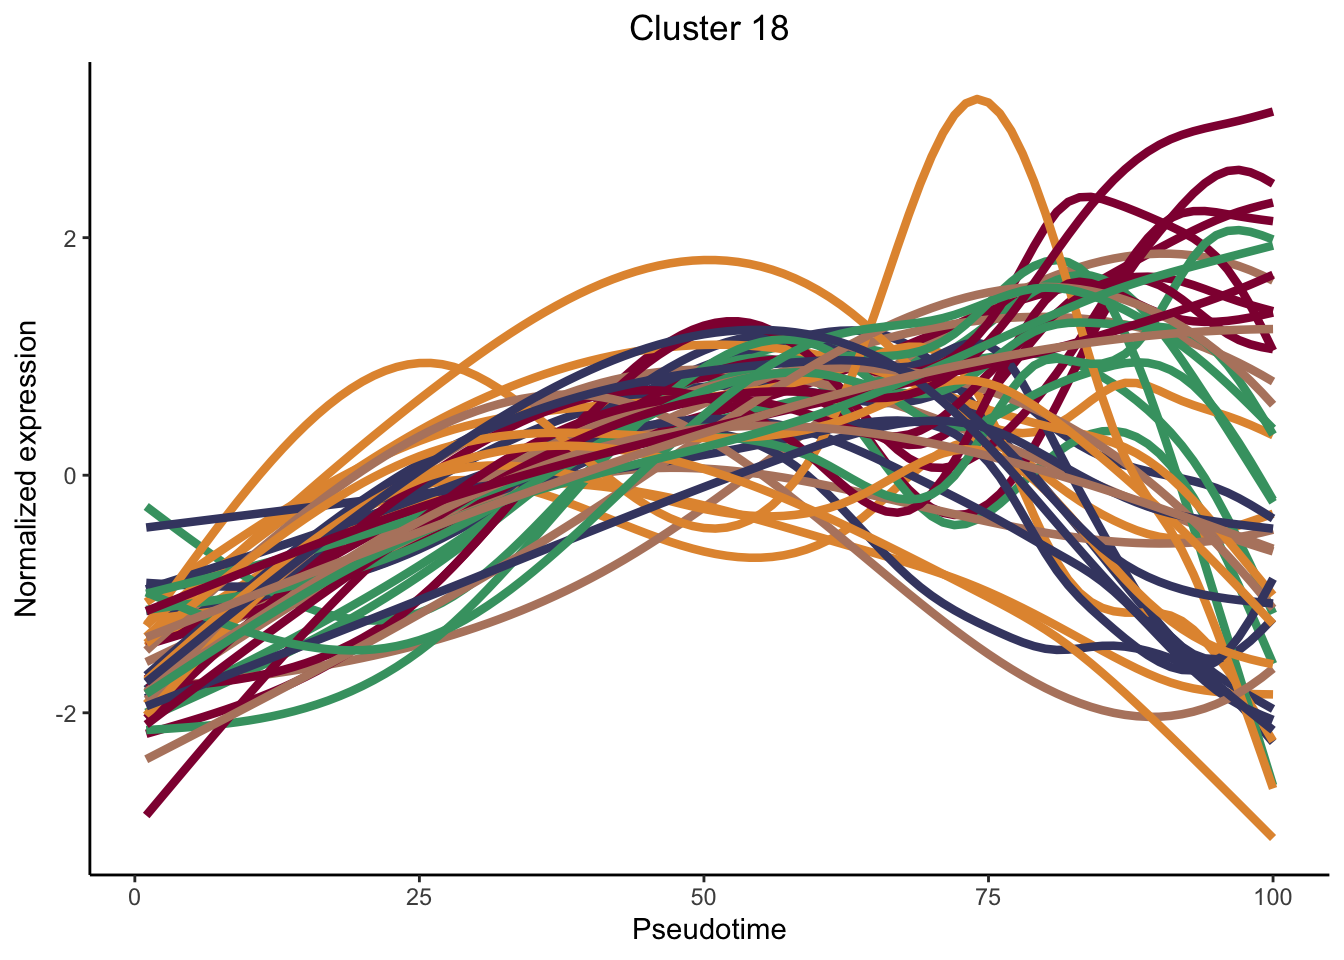
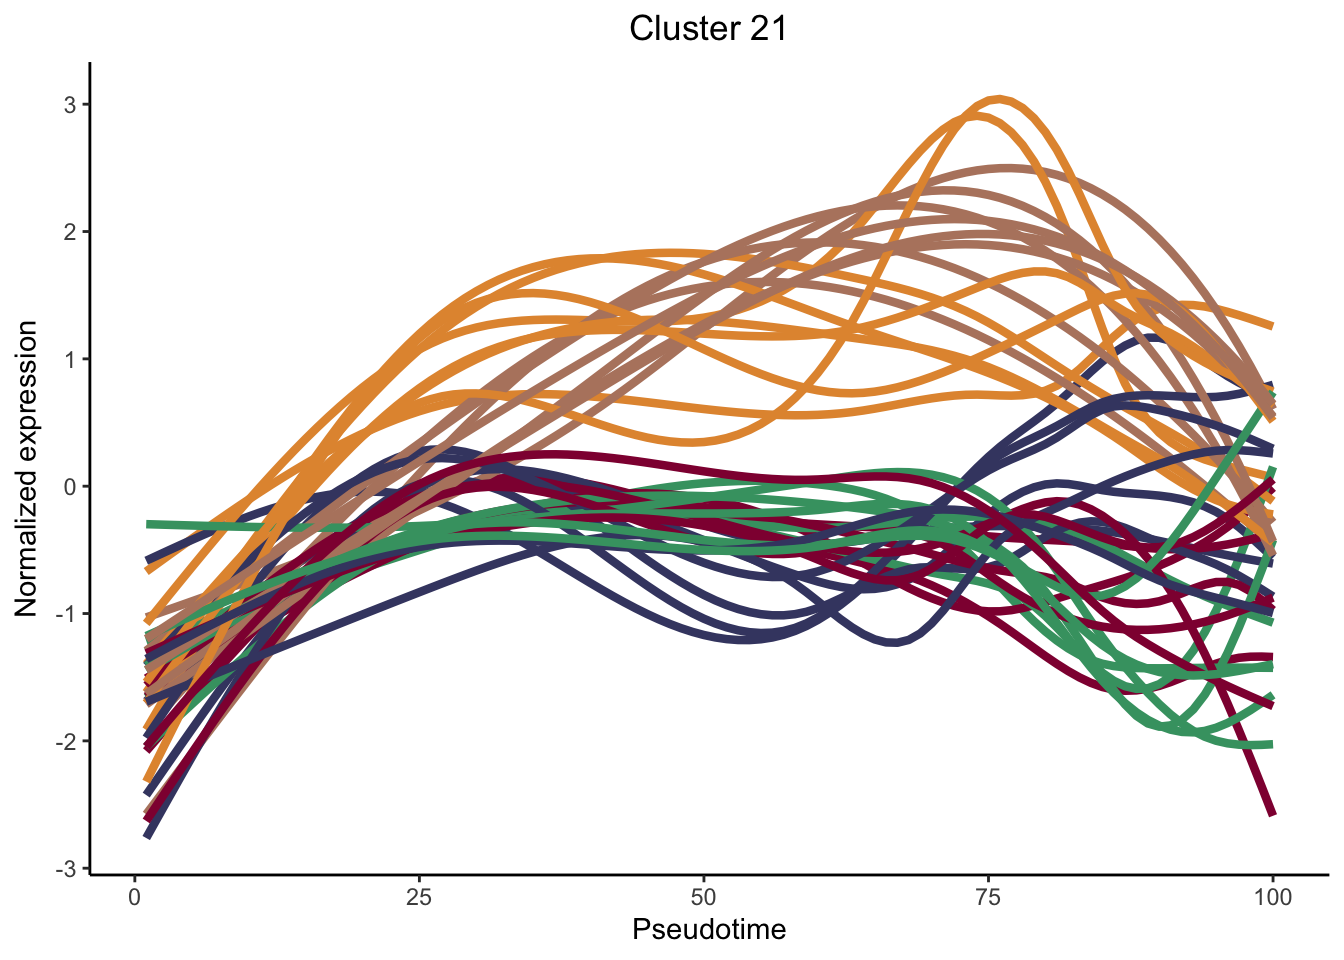
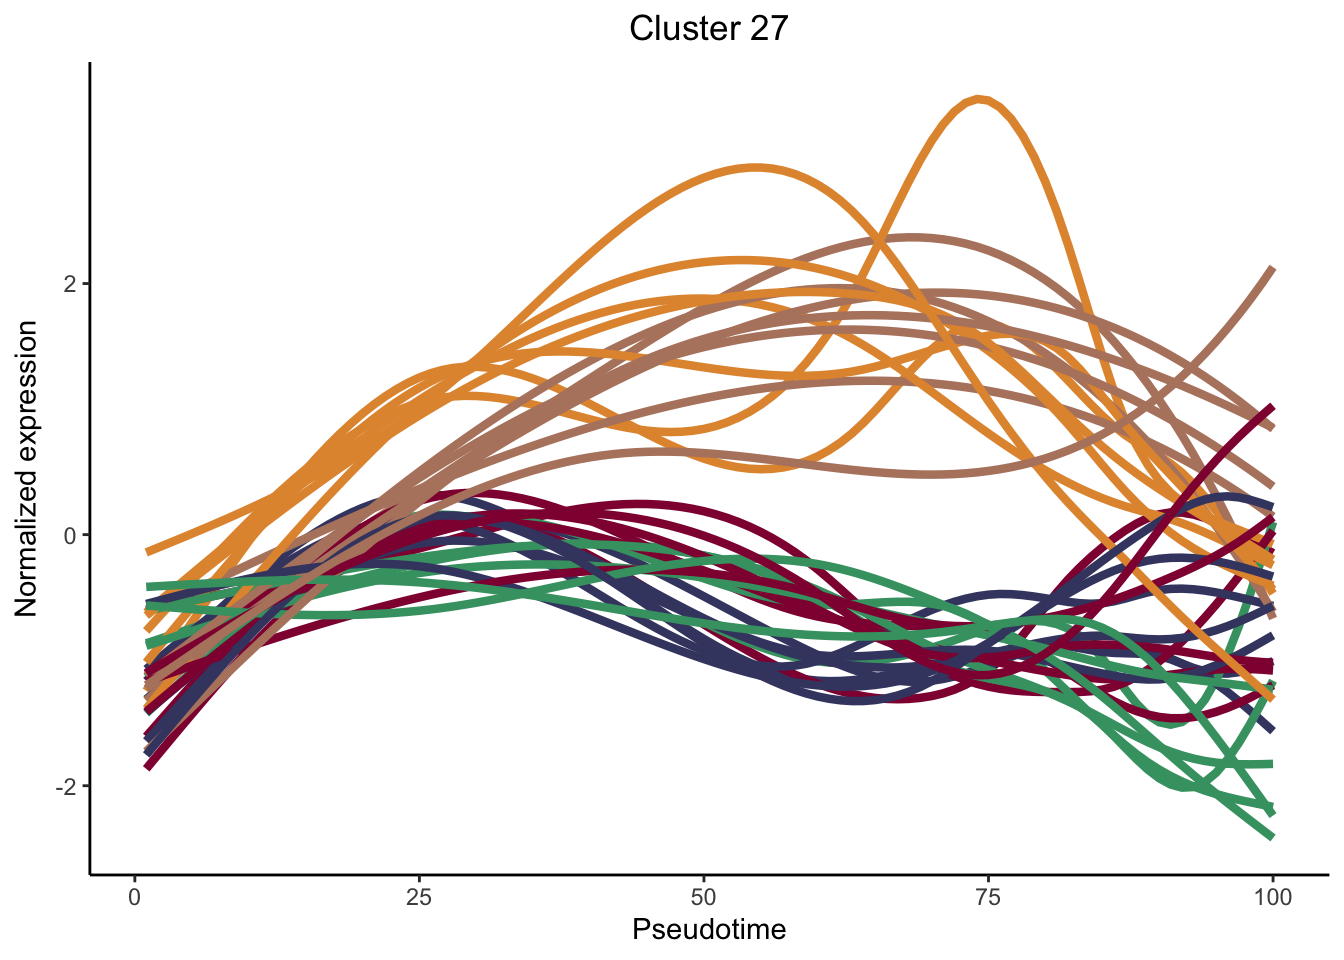
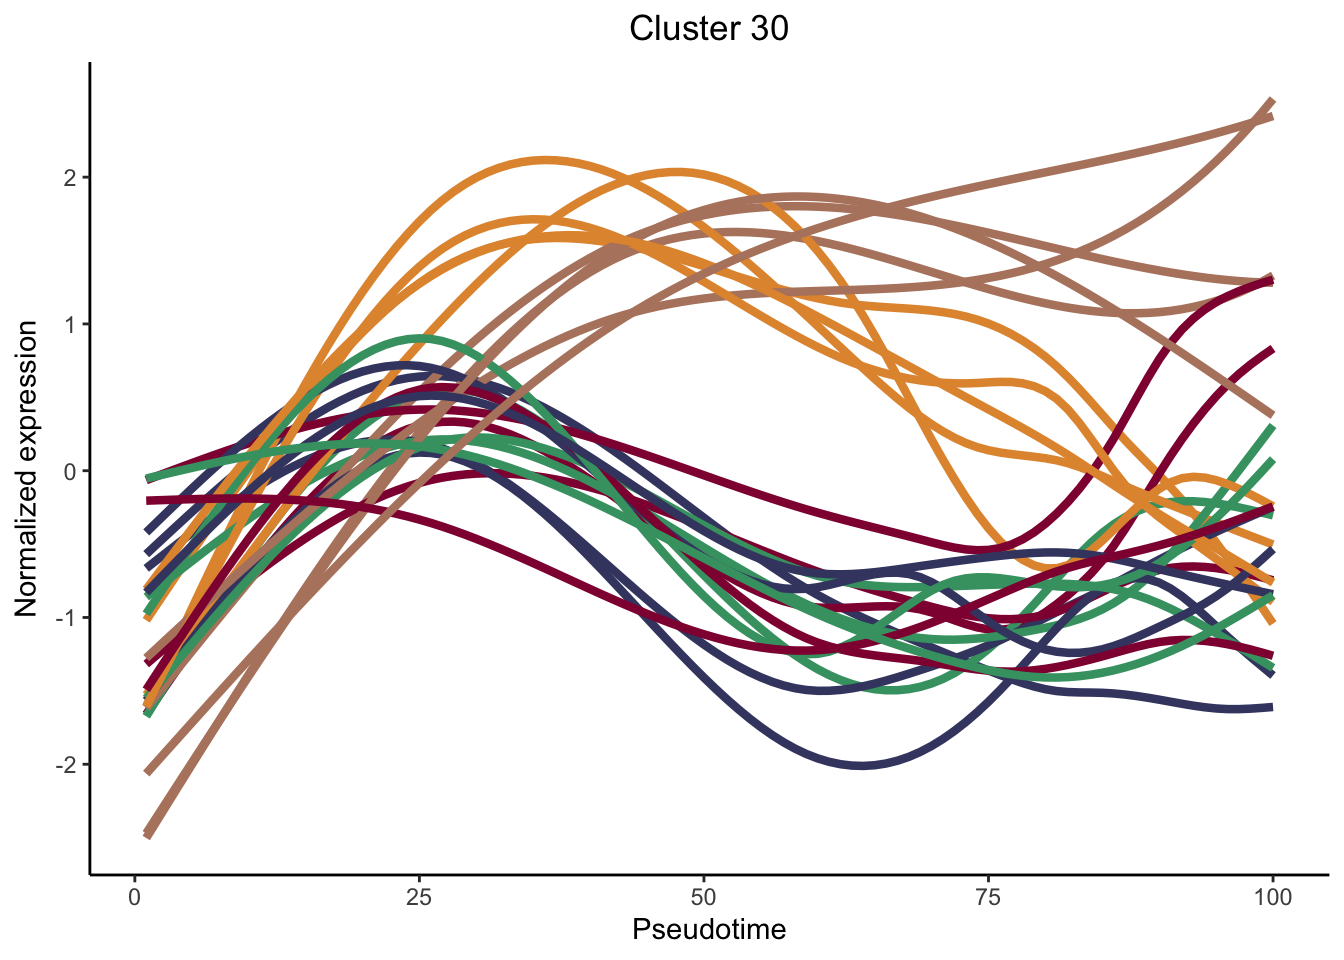
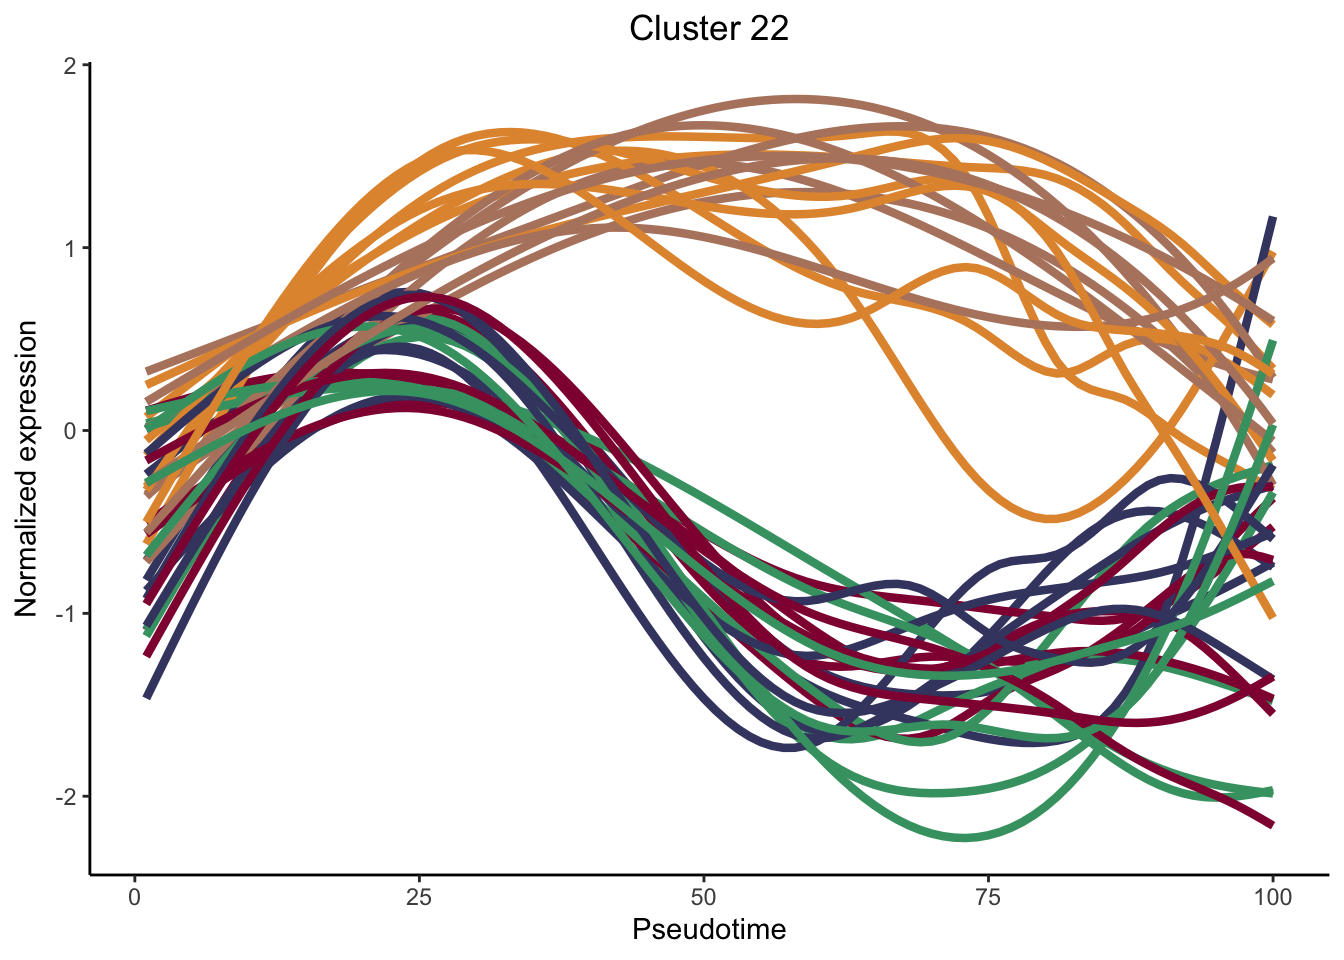
cluster genes between lineages
nPointsClus <- 100
clusPat <- clusterExpressionPatterns(sceGAM, nPoints = nPointsClus,
                                     genes = rankGene[1:500], nReducedDims=20)
36 parameter combinations, 36 use sequential method, 36 use subsampling method
Running Clustering on Parameter Combinations...
done.clusterLabels <- primaryCluster(clusPat$rsec)
cUniq <- unique(clusterLabels)
cUniq <- cUniq[!cUniq == -1] # remove unclustered genes
for (xx in cUniq) {
cId <- which(clusterLabels == xx)
p <- ggplot(data = data.frame(x = 1:nPointsClus,
y = rep(range(clusPat$yhatScaled[cId, ]),
nPointsClus / 2)),
aes(x = x, y = y)) +
geom_point(alpha = 0) +
labs(title = paste0("Cluster ", xx), x = "Pseudotime", y = "Normalized expression") +
theme_classic() +
theme(plot.title = element_text(hjust = 0.5))
for (ii in 1:length(cId)) {
geneId <- rownames(clusPat$yhatScaled)[cId[ii]]
p <- p +
geom_line(data = data.frame(x = rep(1:nPointsClus, 5),
y = clusPat$yhatScaled[geneId, ],
lineage = rep(1:5, each = nPointsClus)),
aes(col = as.character(lineage), group = lineage), lwd = 1.5)
}
p <- p + guides(color = FALSE) +
scale_color_manual(values = colLin,
breaks = c("1", "2", "3", "4", "5"))
print(p)
}
clustList <- lapply(cUniq, function(cl){
  cId <- which(clusterLabels == cl)
  genes <- rownames(clusPat$yhatScaled)[cId]
})

names(clustList) <- cUniq

saveRDS(clustList, file=paste0(basedir, "/data/slingshot/tradeSEQ/diffLinGeneCluster.rds"))
Early DE test
earlyDERes <- earlyDETest(sceGAM, knots = c(1, 2), l2fc = log2(1.5))
oEarly <- order(earlyDERes$waldStat, decreasing = TRUE)
head(rownames(earlyDERes)[oEarly])
[1] "ENSMUSG00000054717.Hmgb2" "ENSMUSG00000037894.H2az1"
[3] "ENSMUSG00000023367.Tmem176a" "ENSMUSG00000062248.Cks2"
[5] "ENSMUSG00000017716.Birc5" "ENSMUSG00000049932.H2ax" rankGene <- rownames(earlyDERes)[oEarly]
lapply(rankGene[1:50], function(selGene){
plotSmoothers(sceGAM, counts(sceGAM), gene = selGene, curvesCols=colLin) +
ggtitle(selGene) +
scale_color_manual(values=colLin)
})[[1]]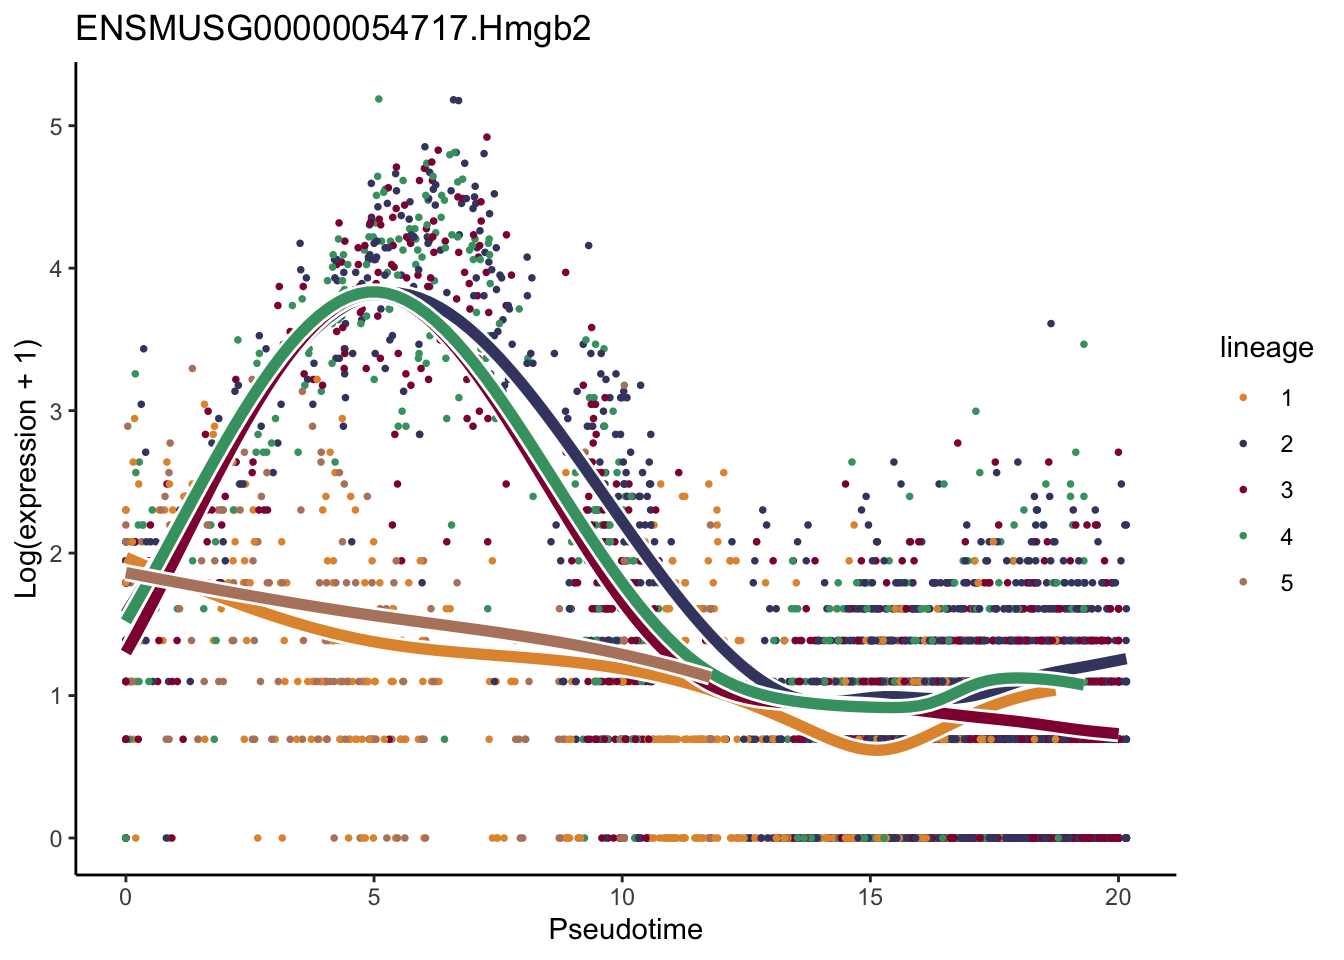
[[2]]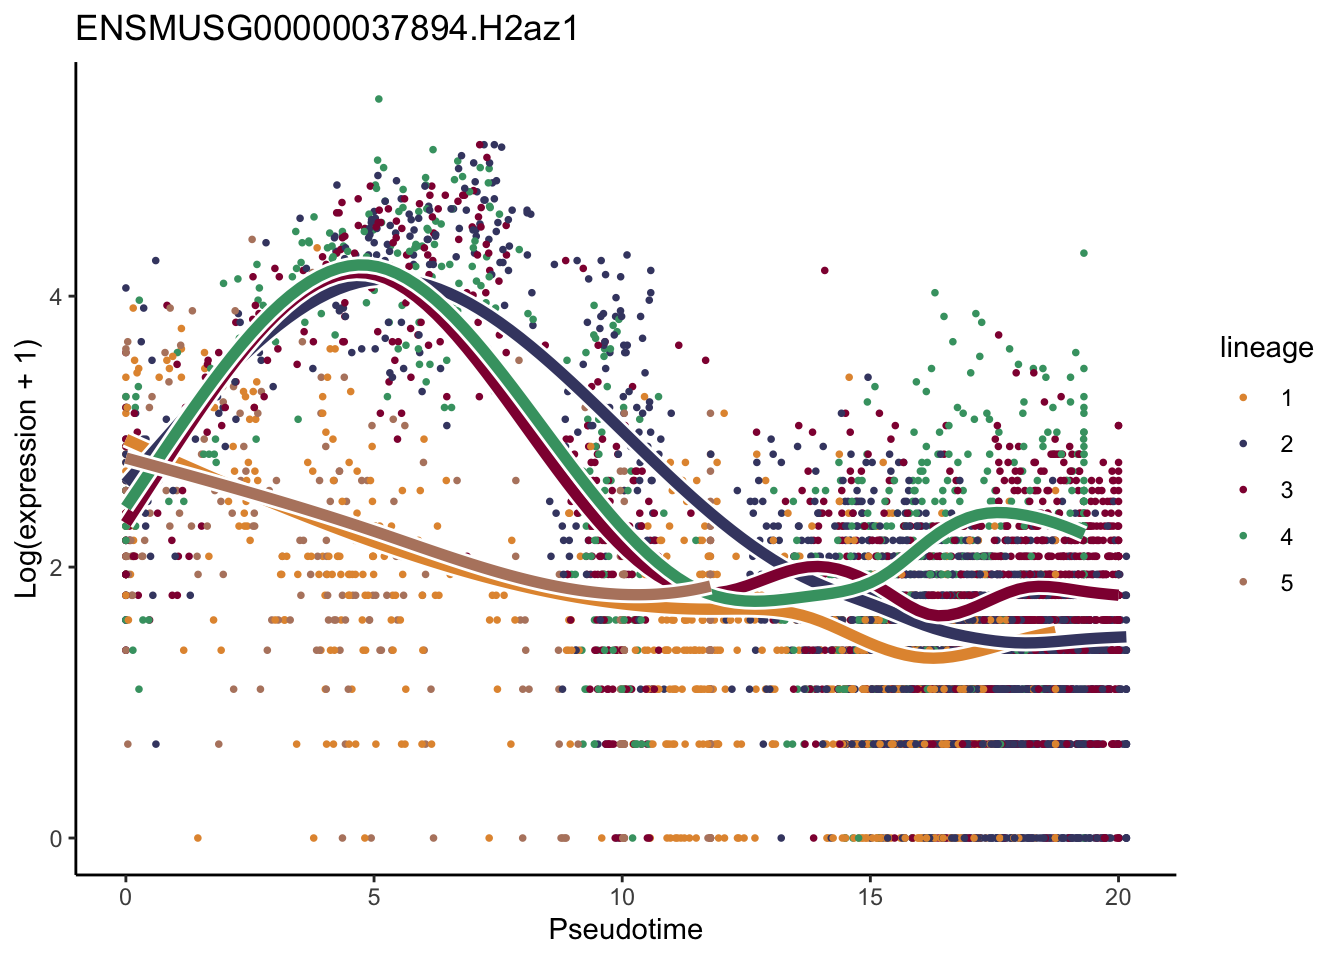
[[3]]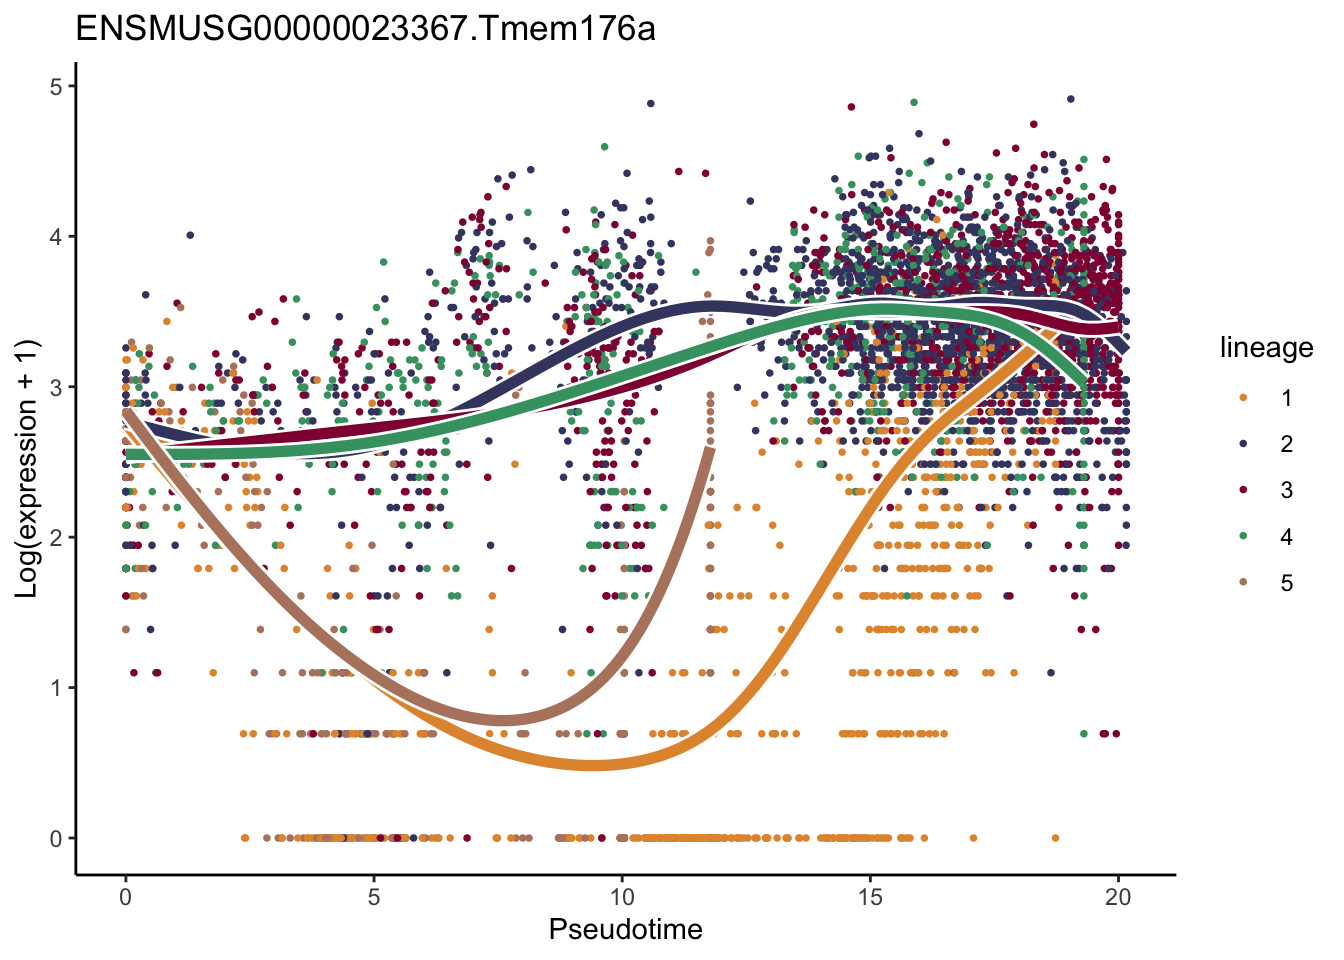
[[4]]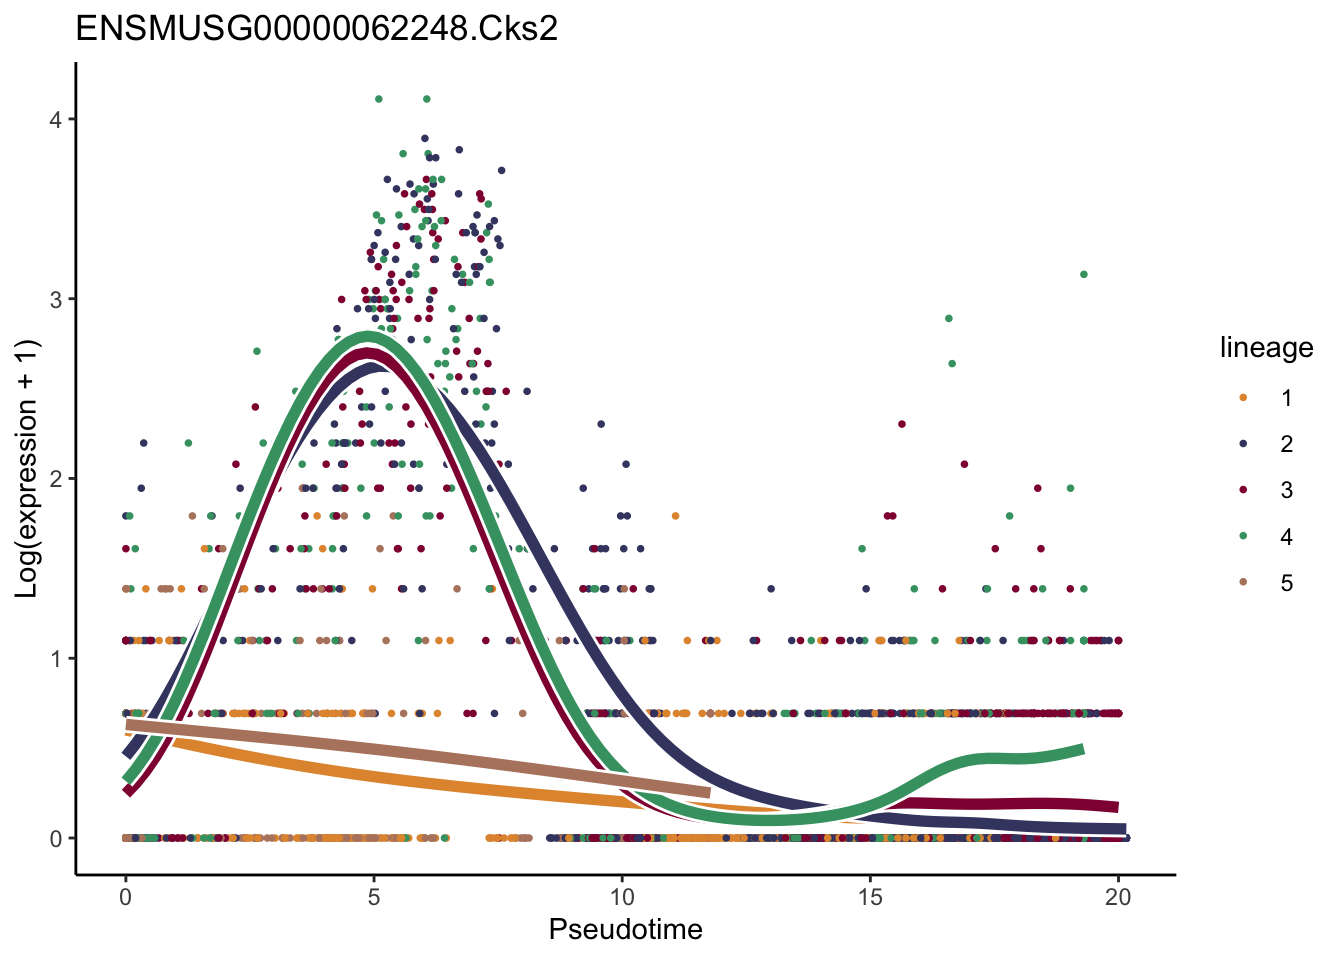
[[5]]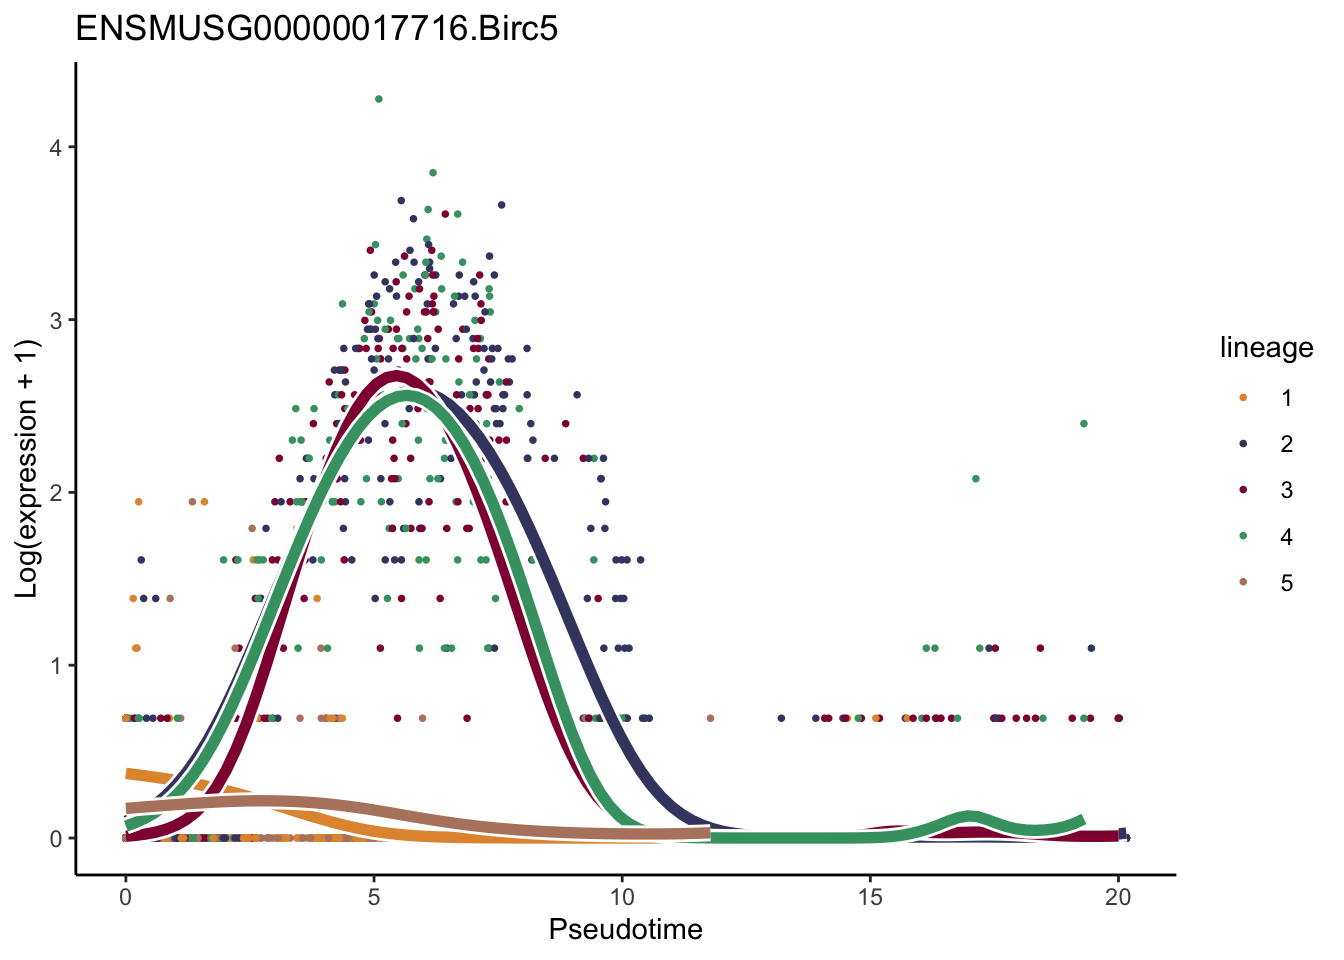
[[6]]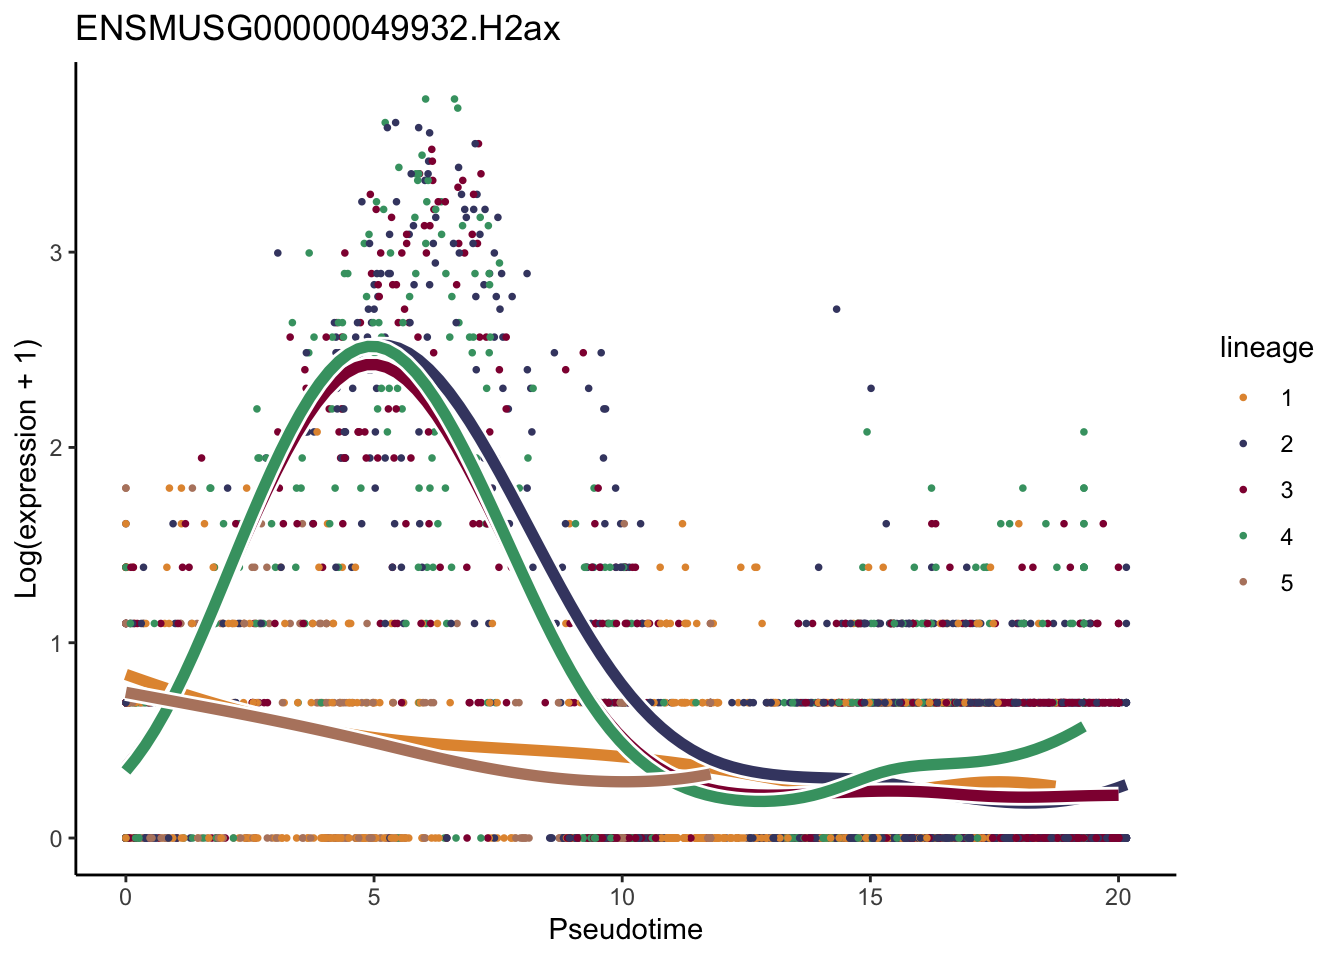
[[7]]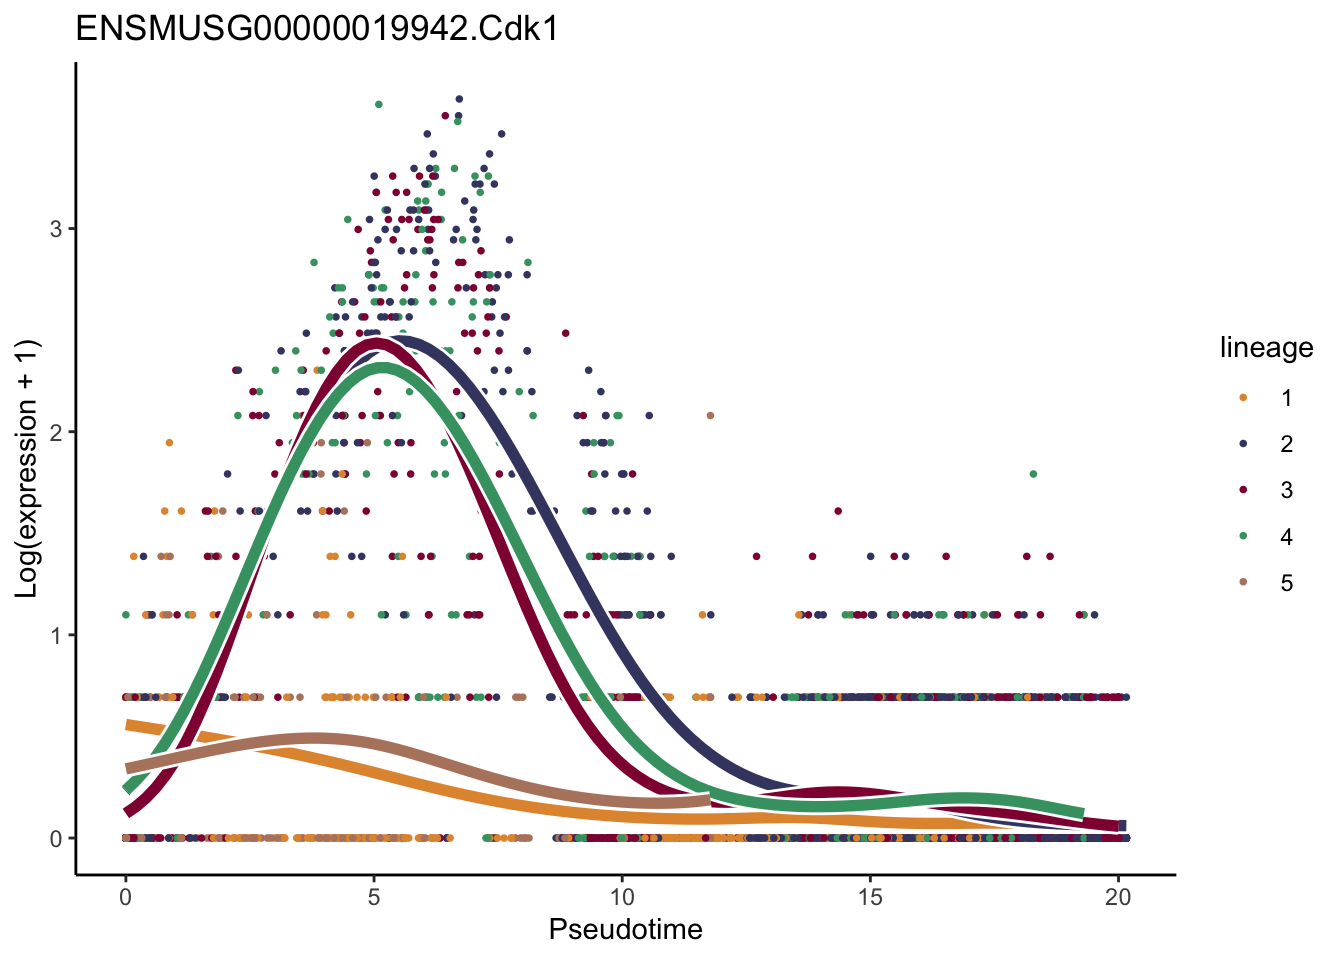
[[8]]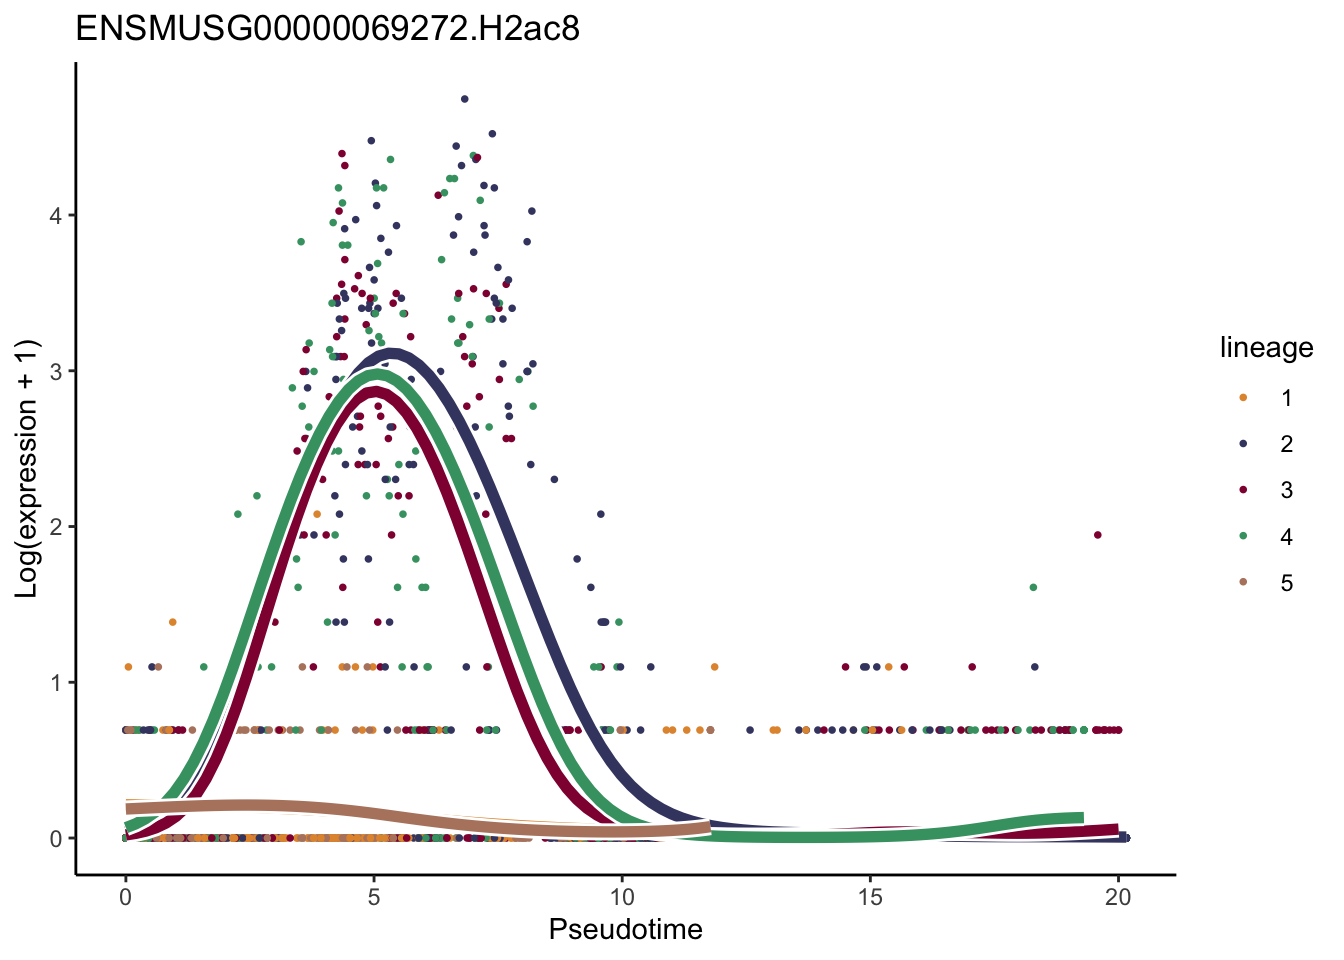
[[9]]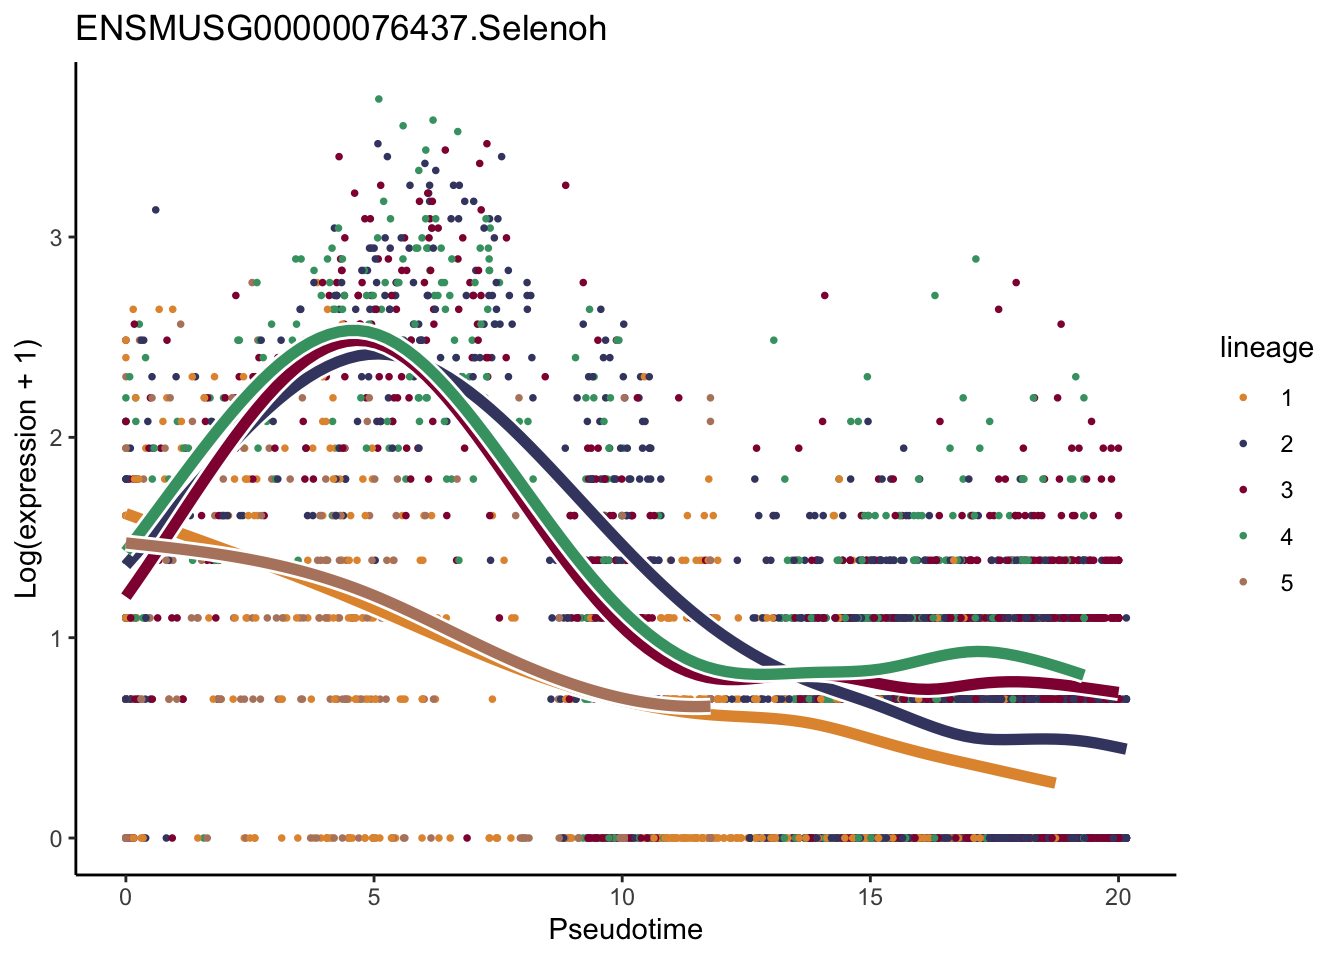
[[10]]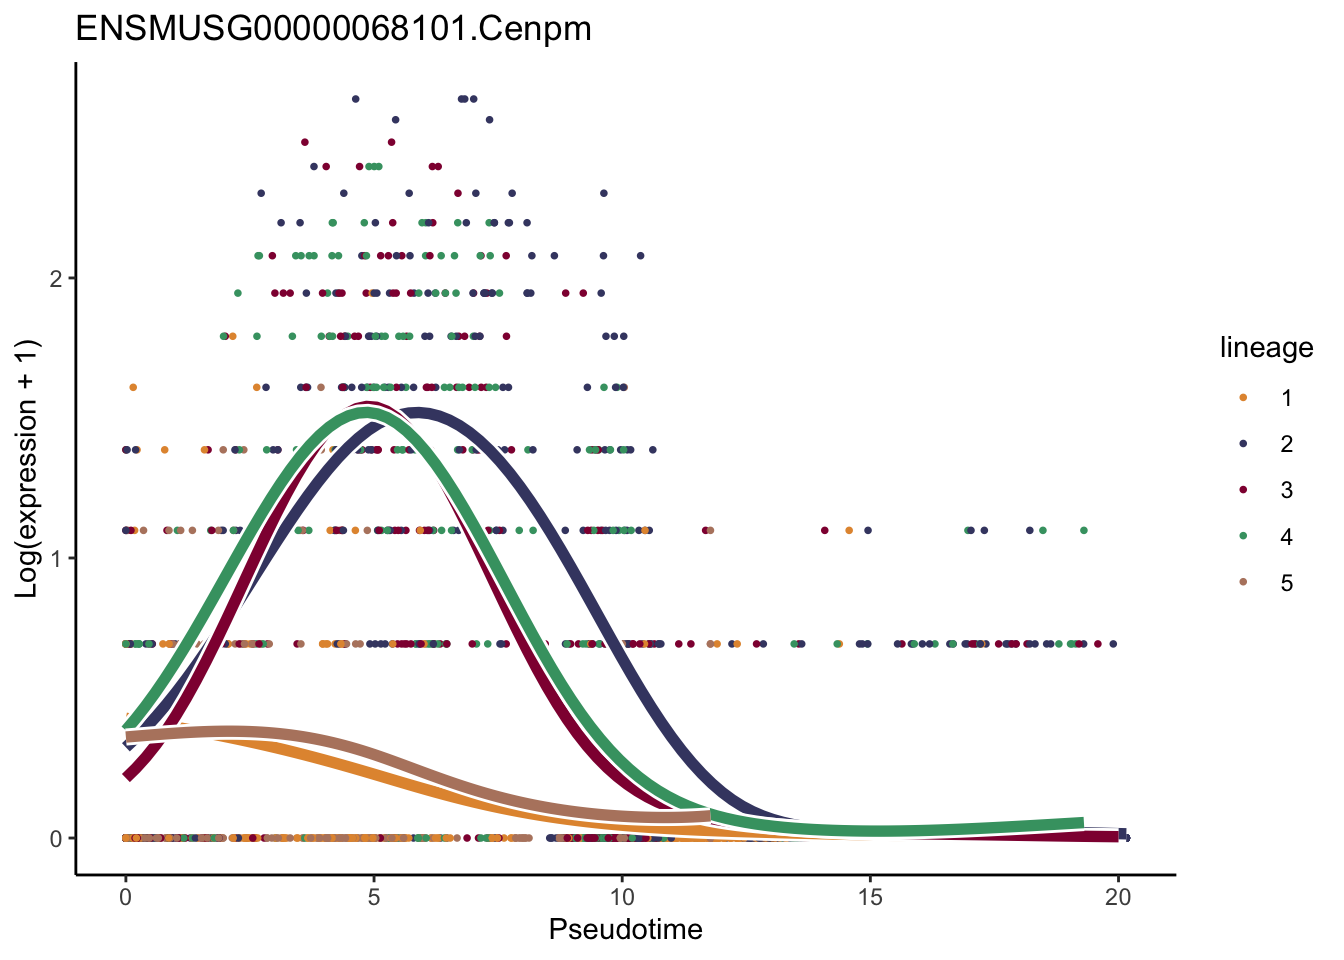
[[11]]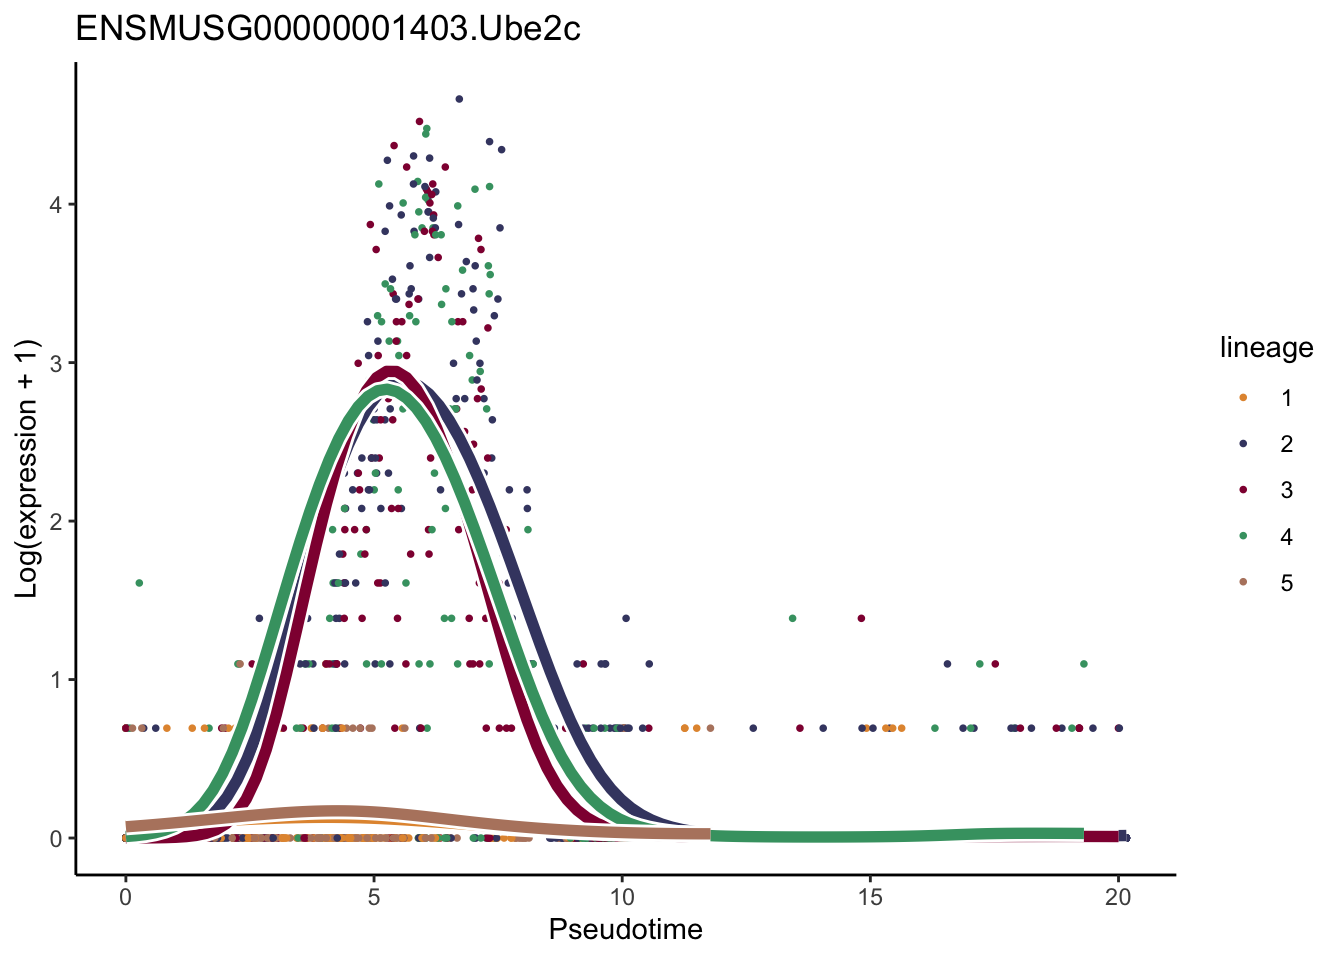
[[12]]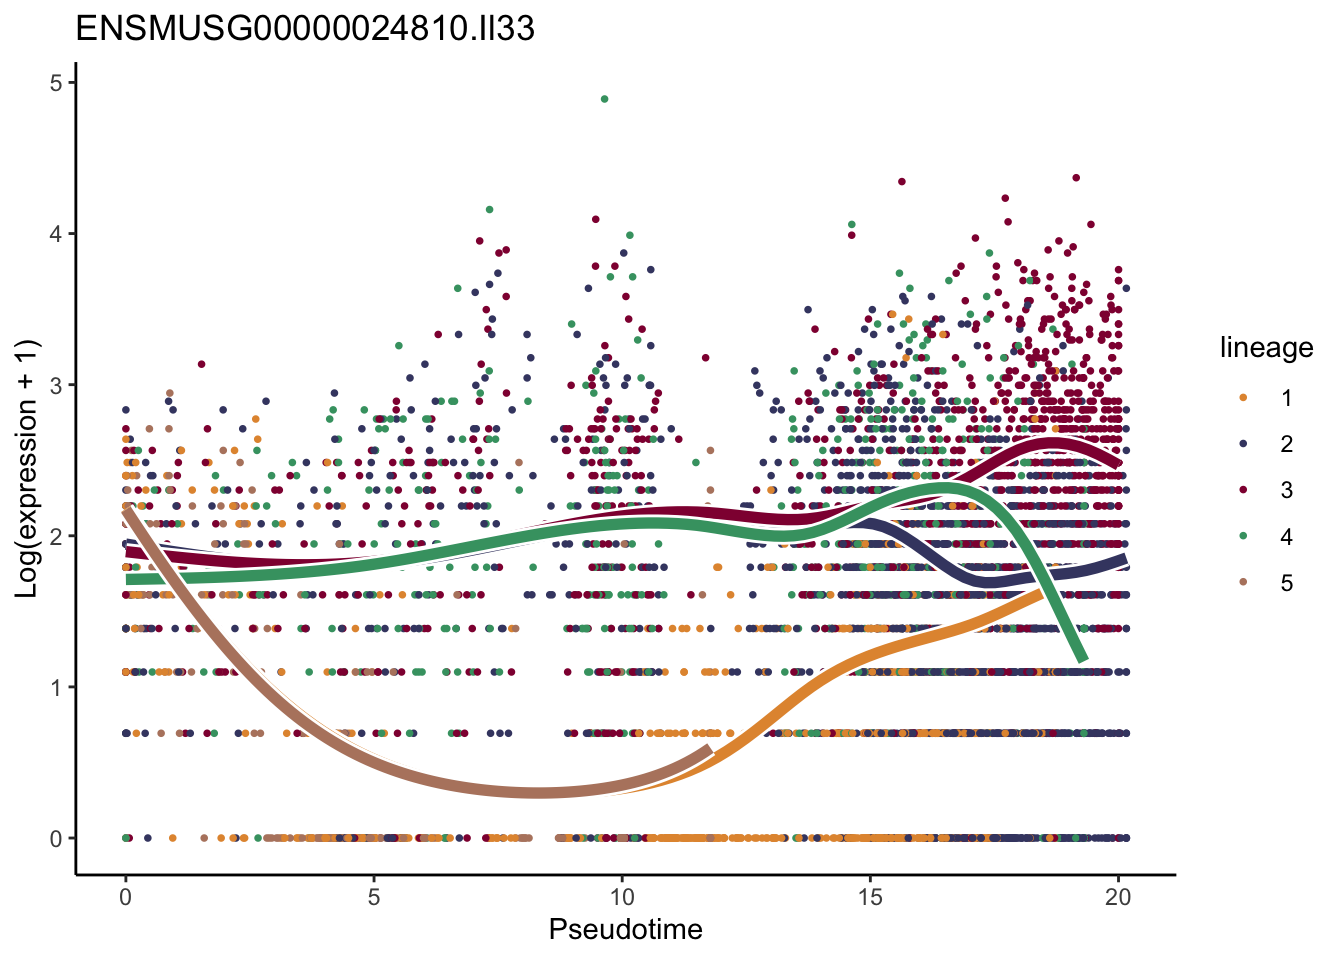
[[13]]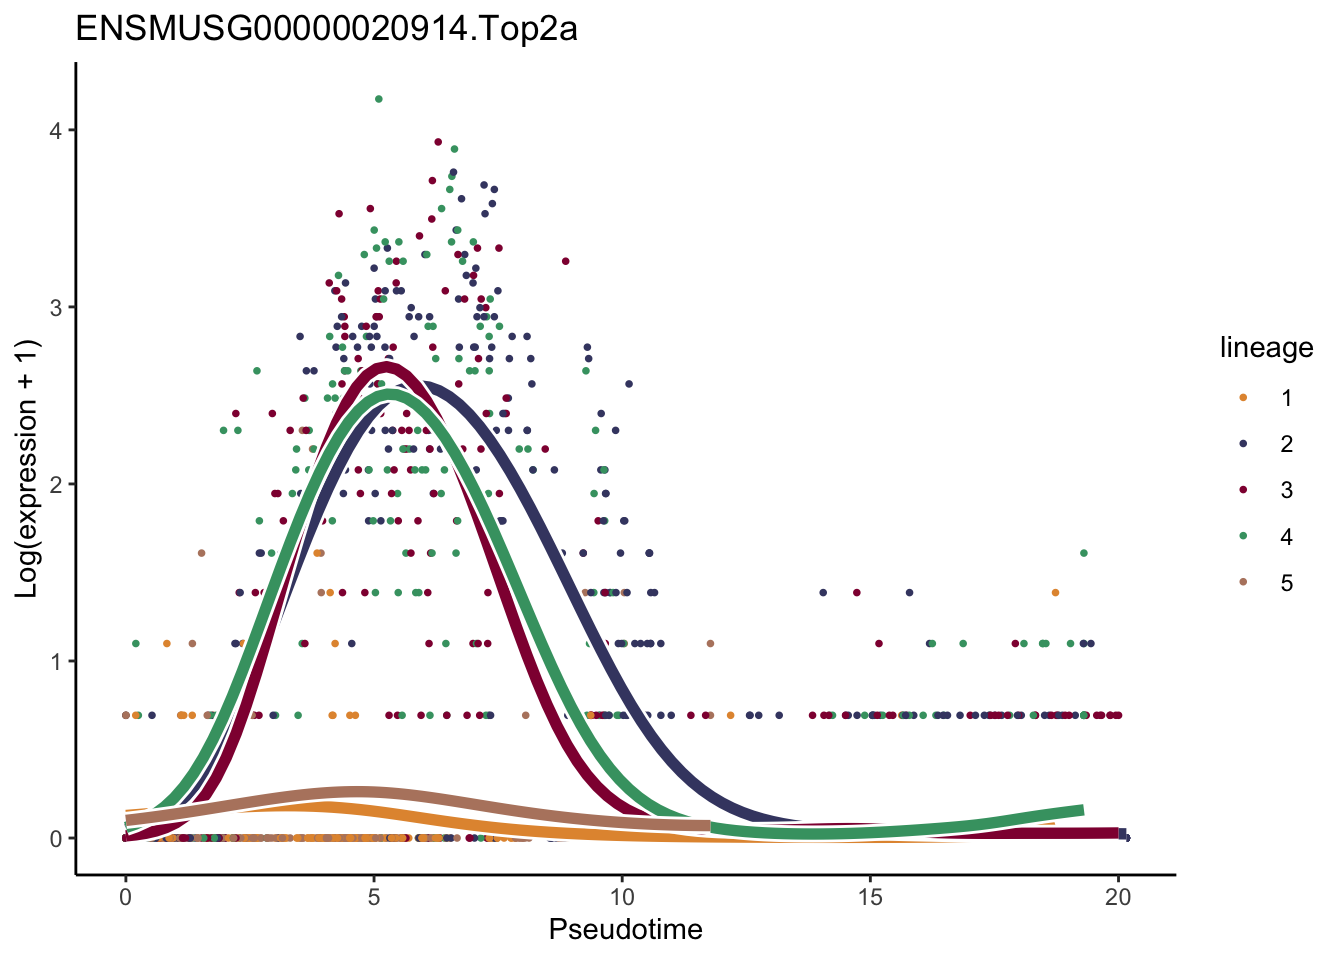
[[14]]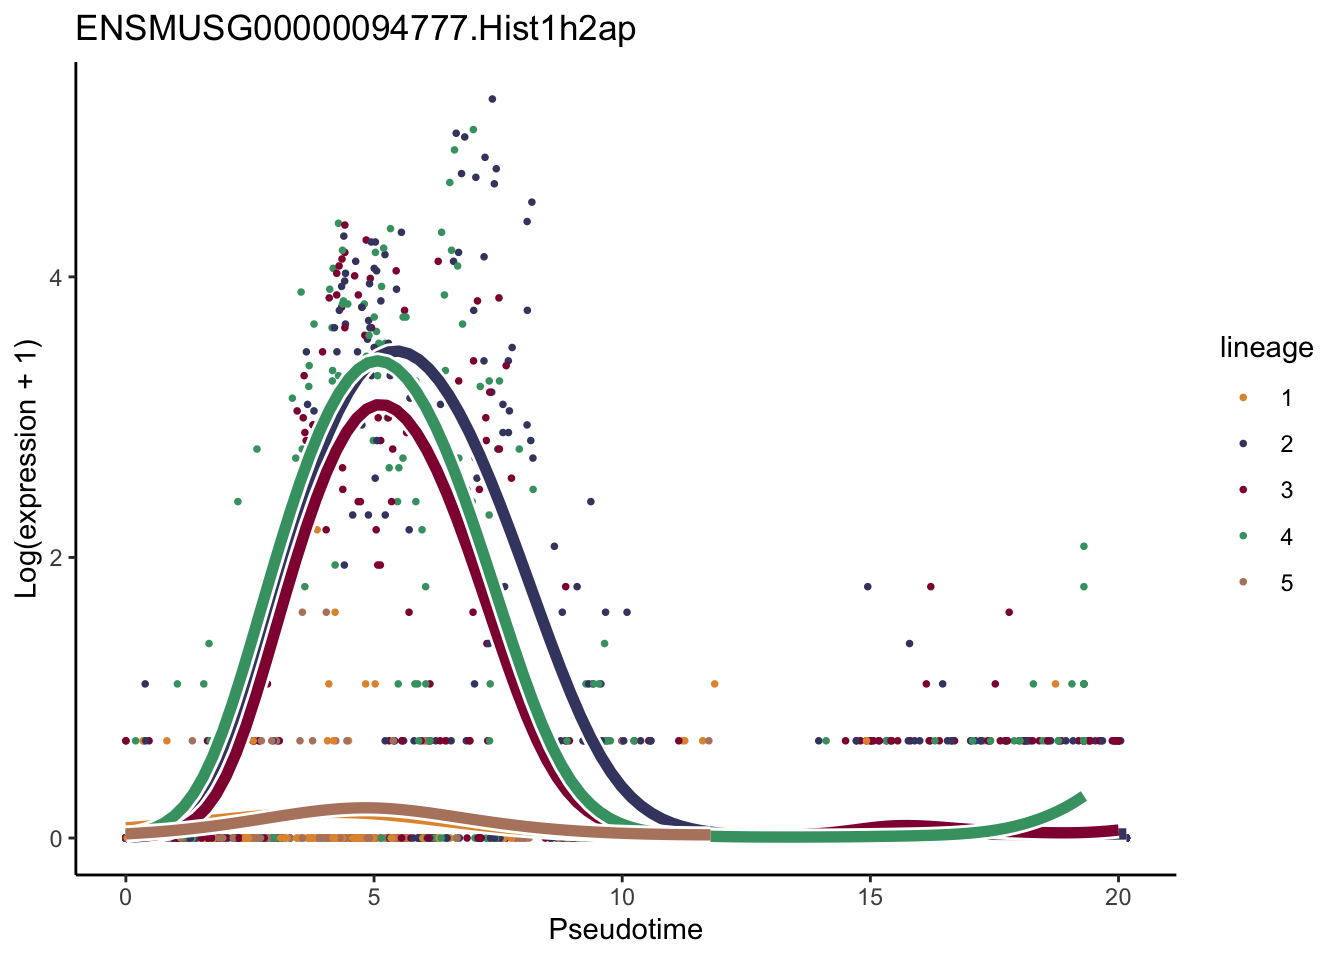
[[15]]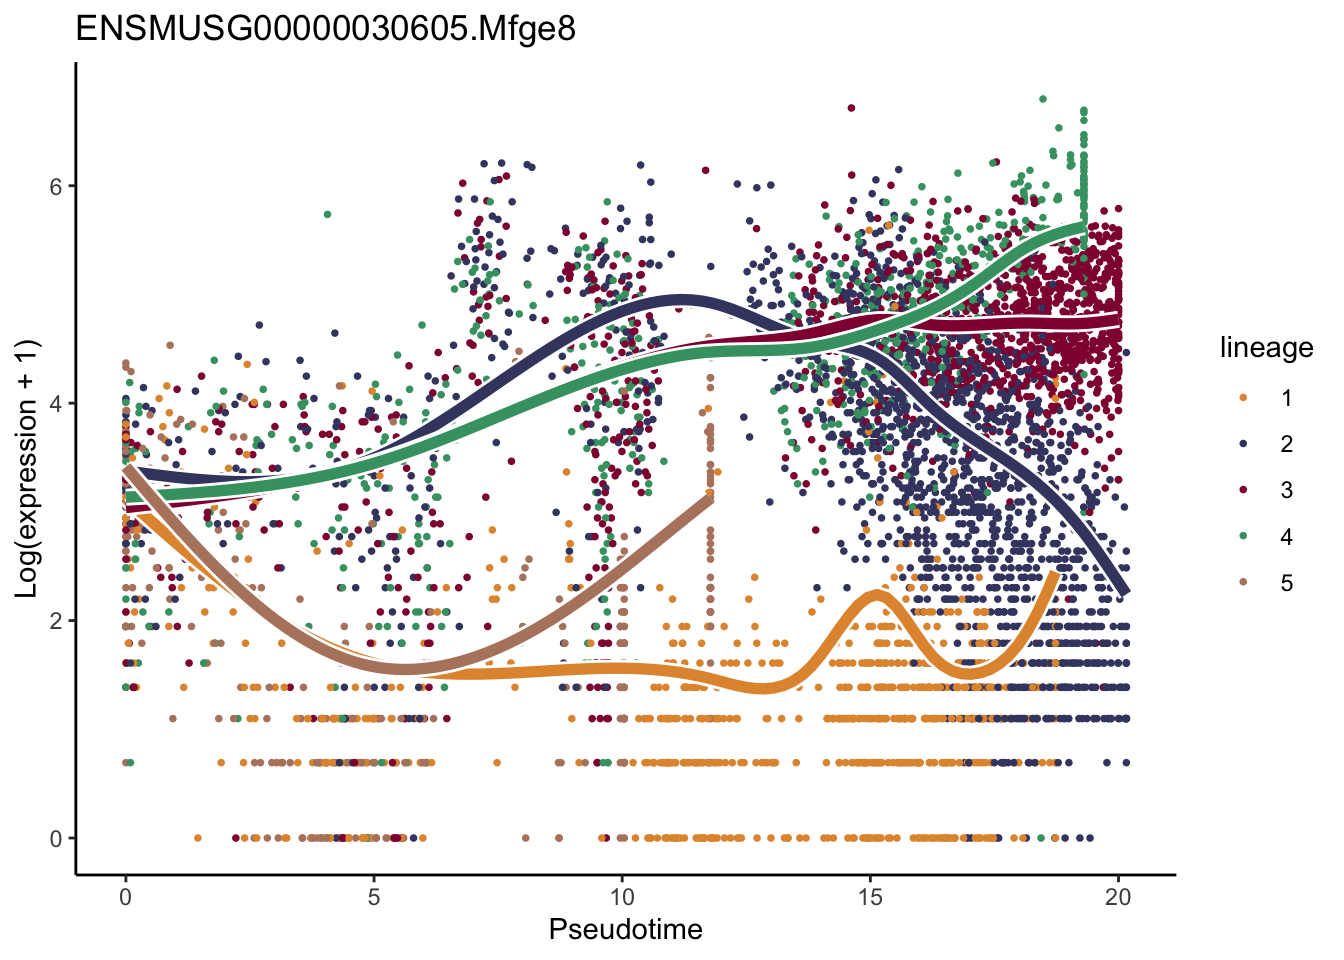
[[16]]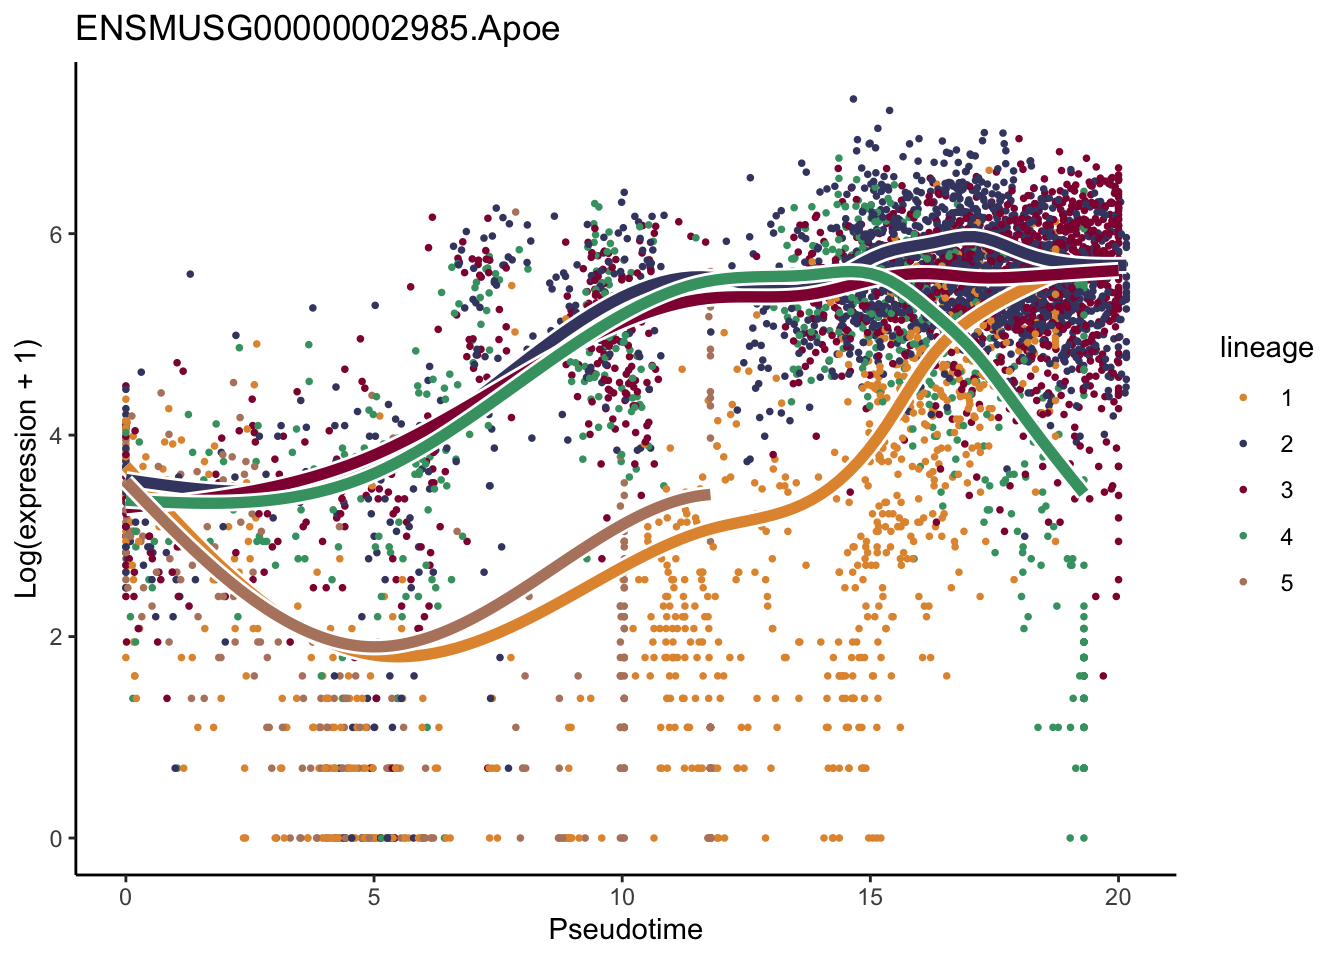
[[17]]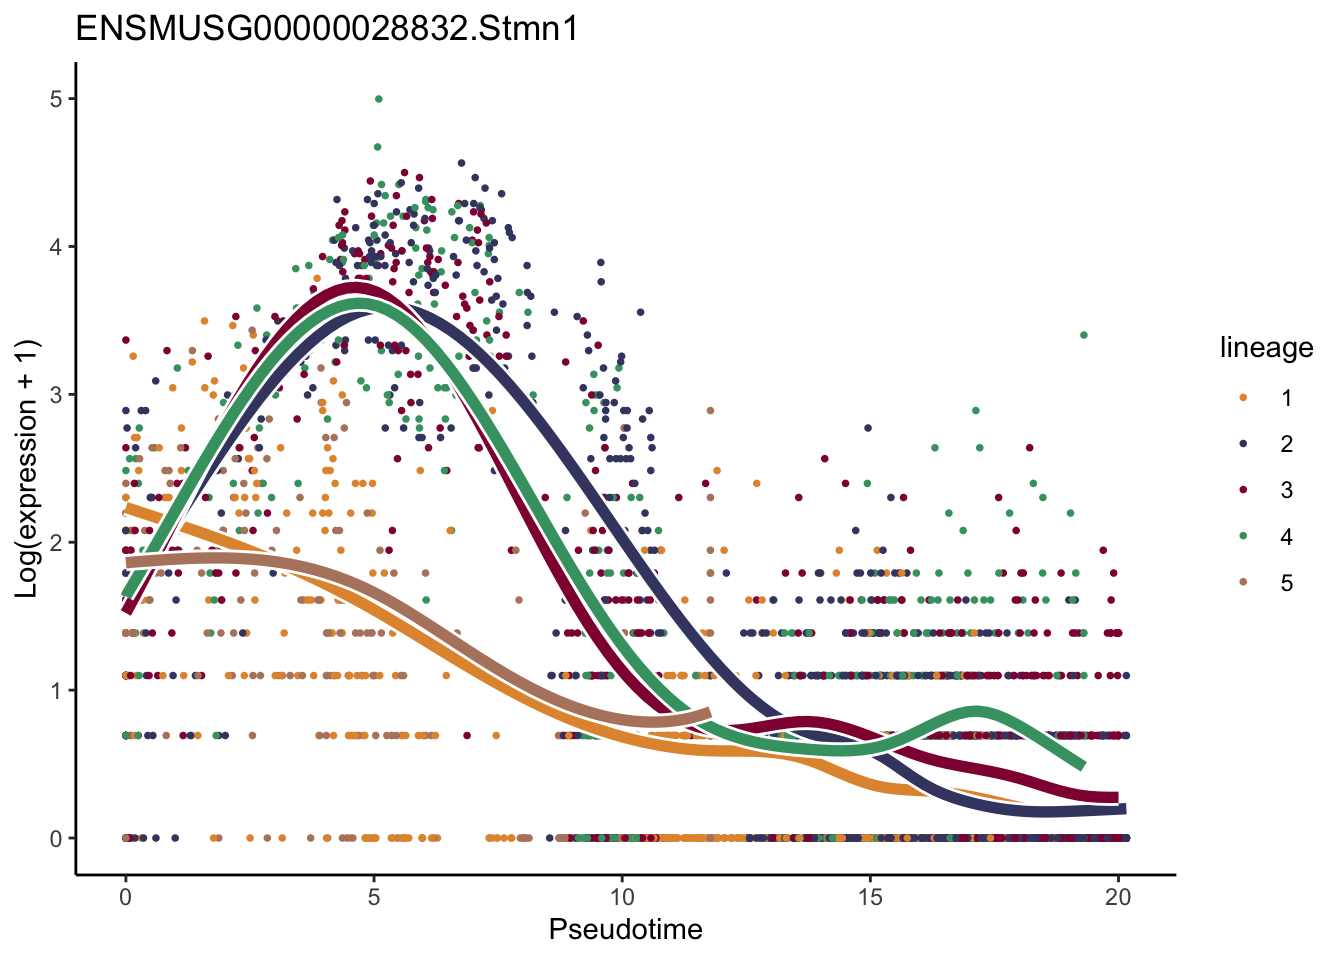
[[18]]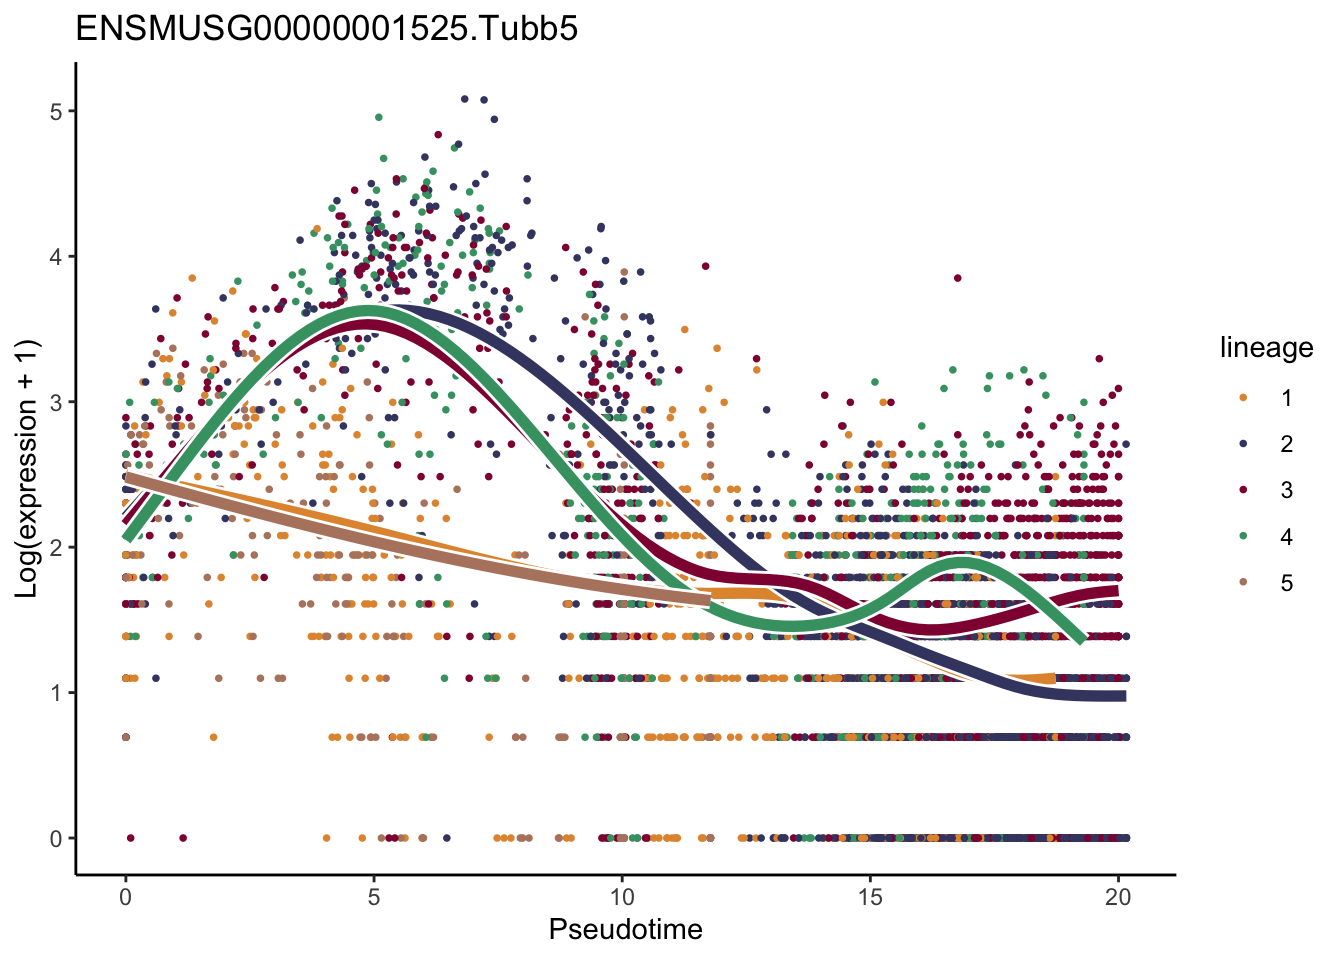
[[19]]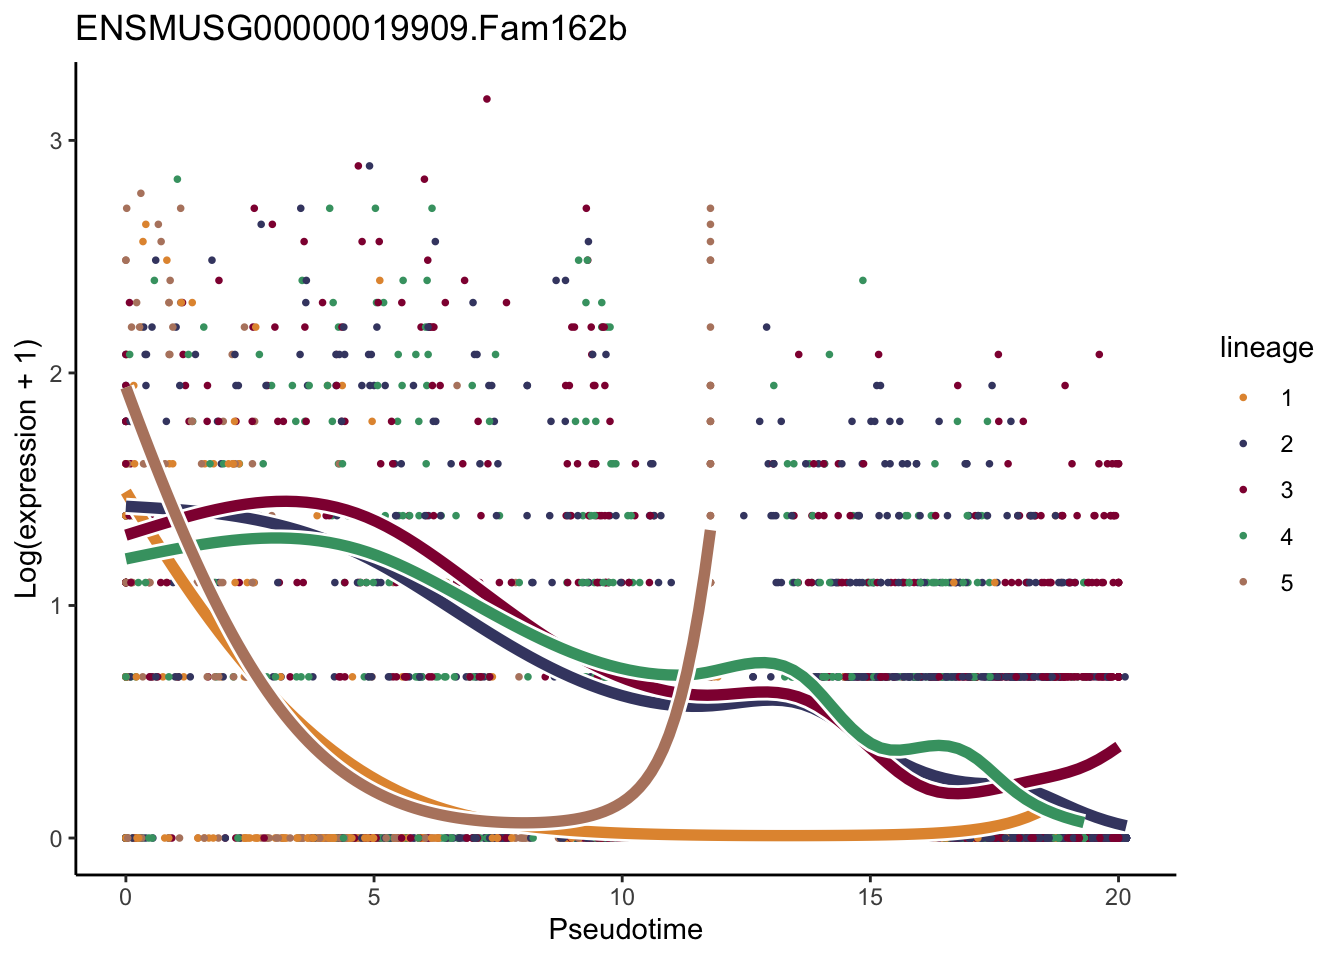
[[20]]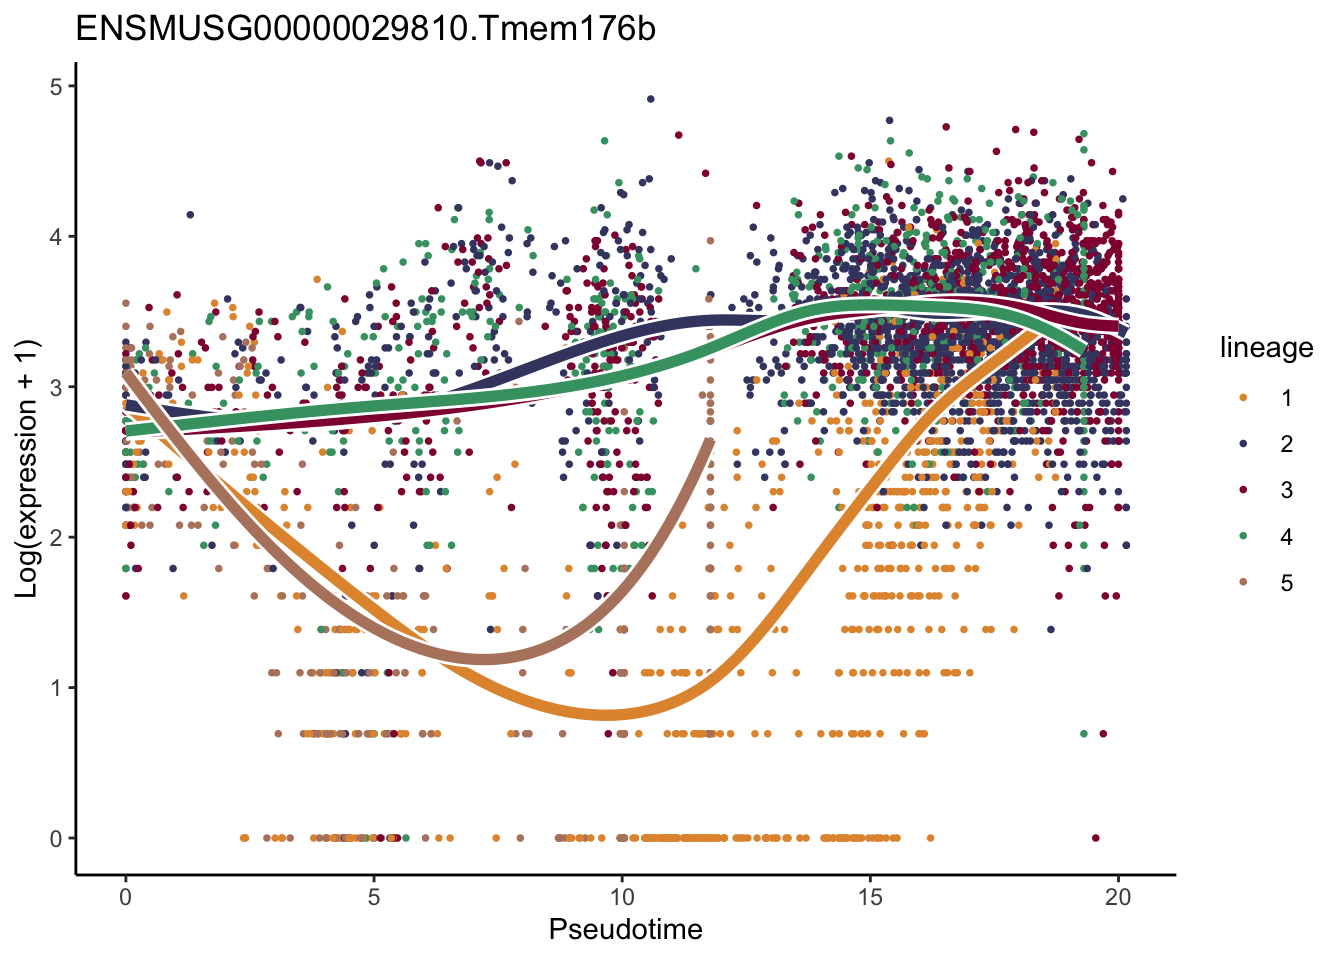
[[21]]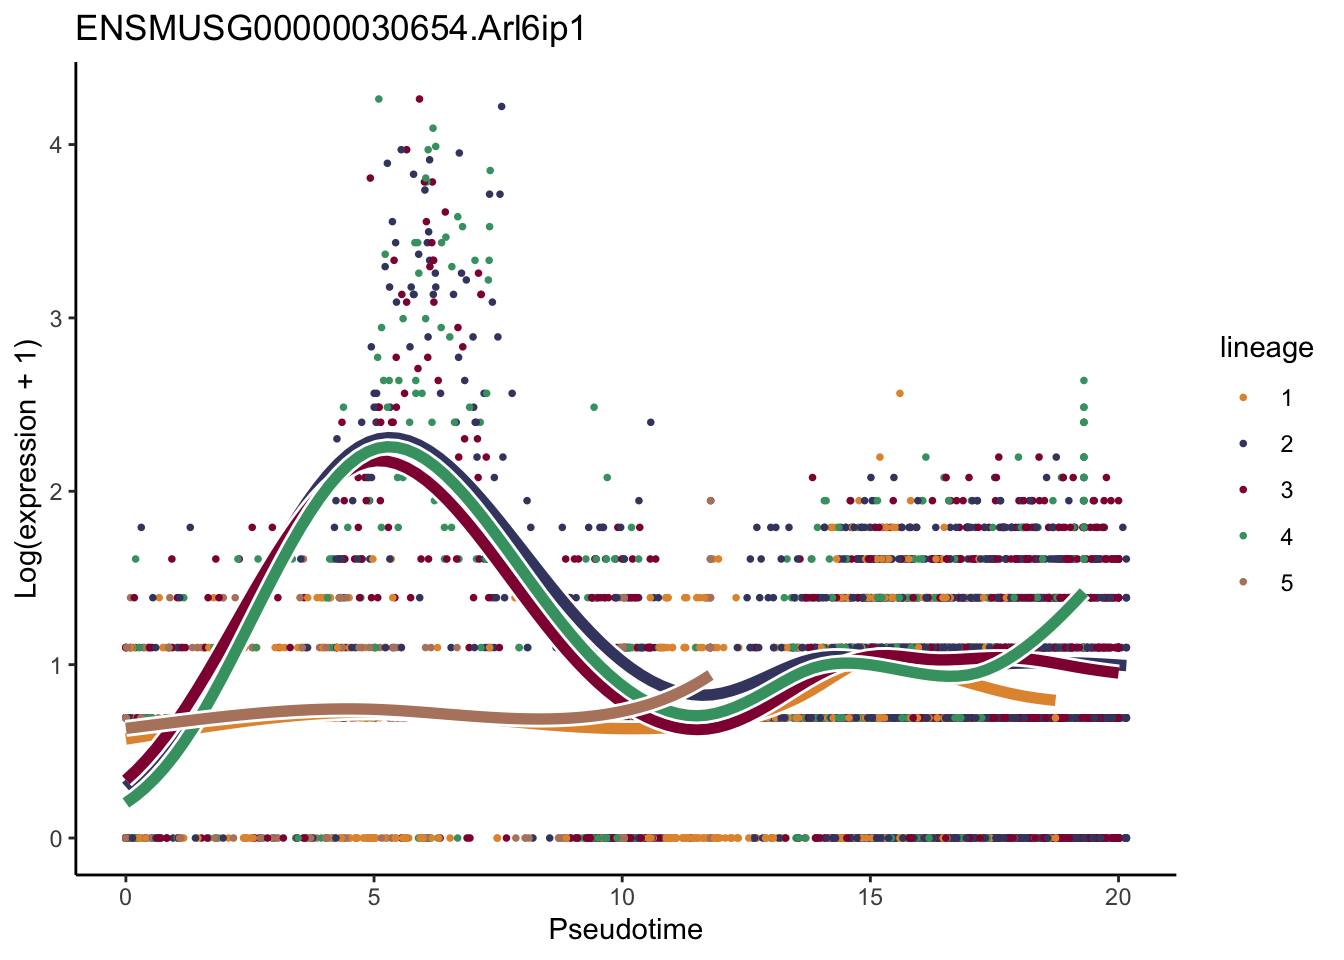
[[22]]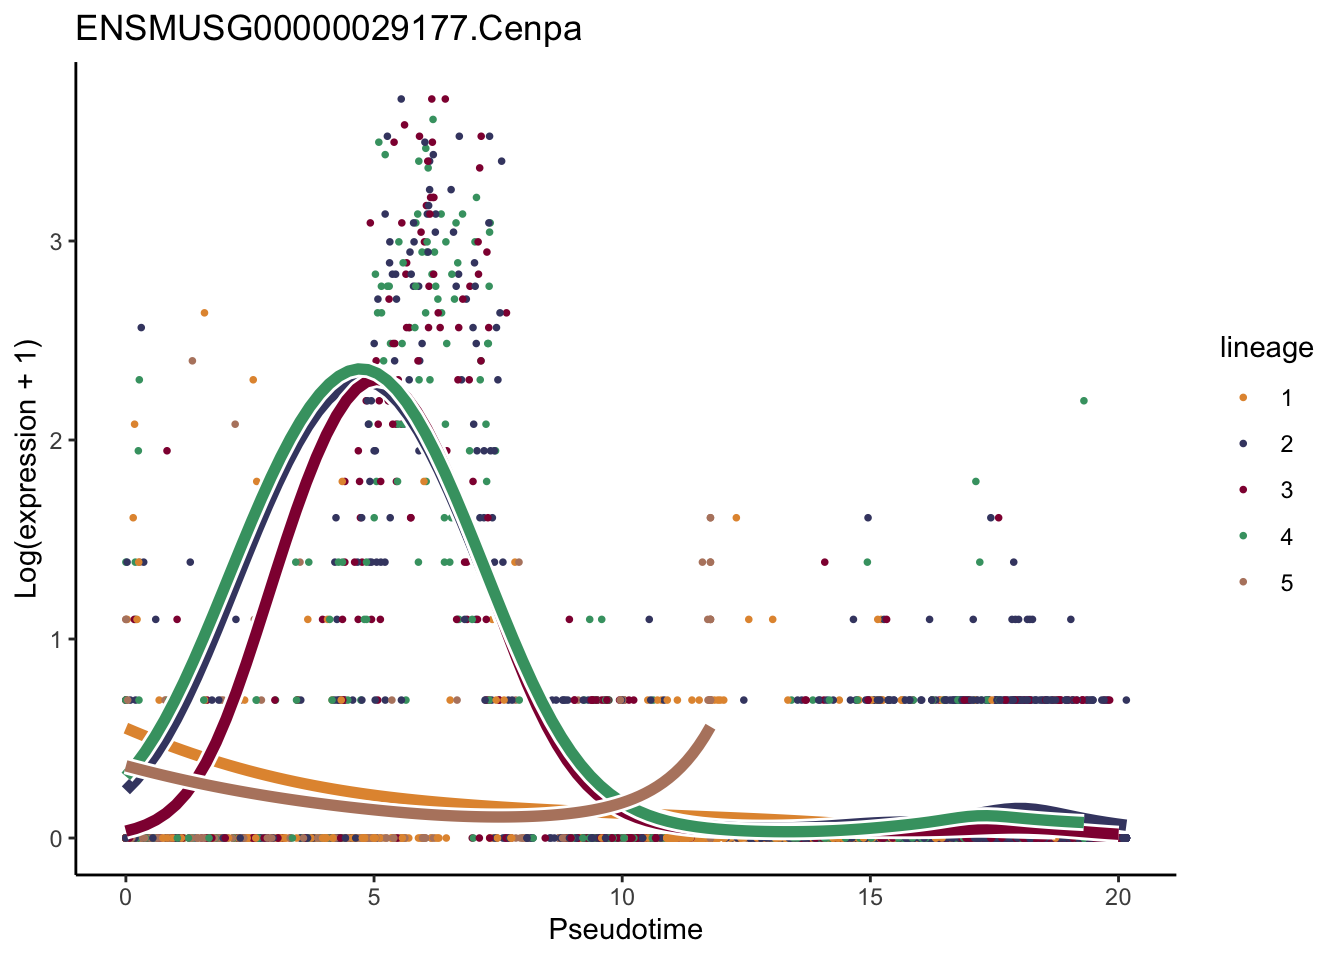
[[23]]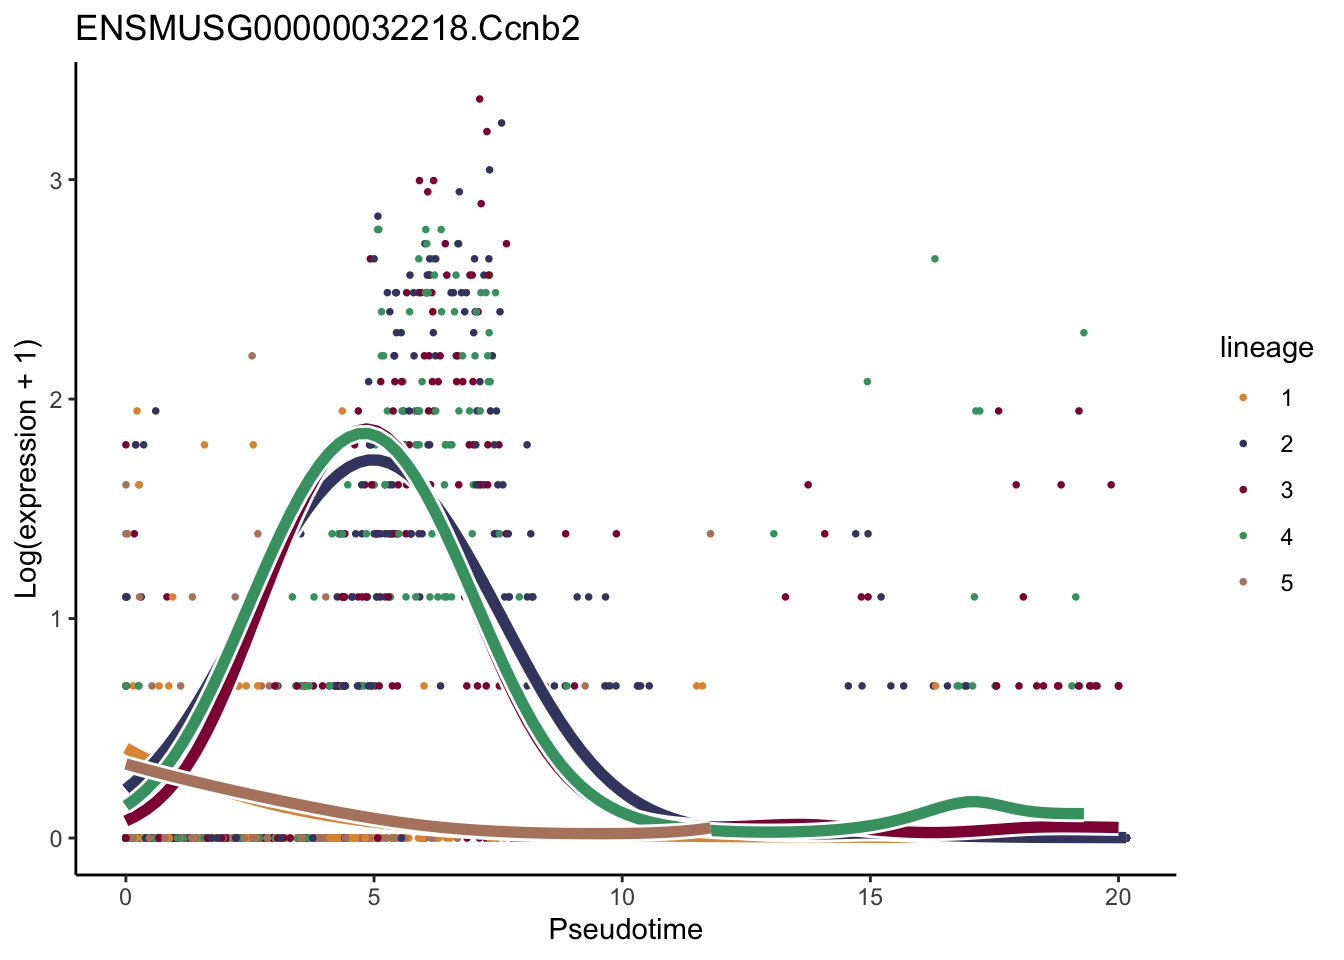
[[24]]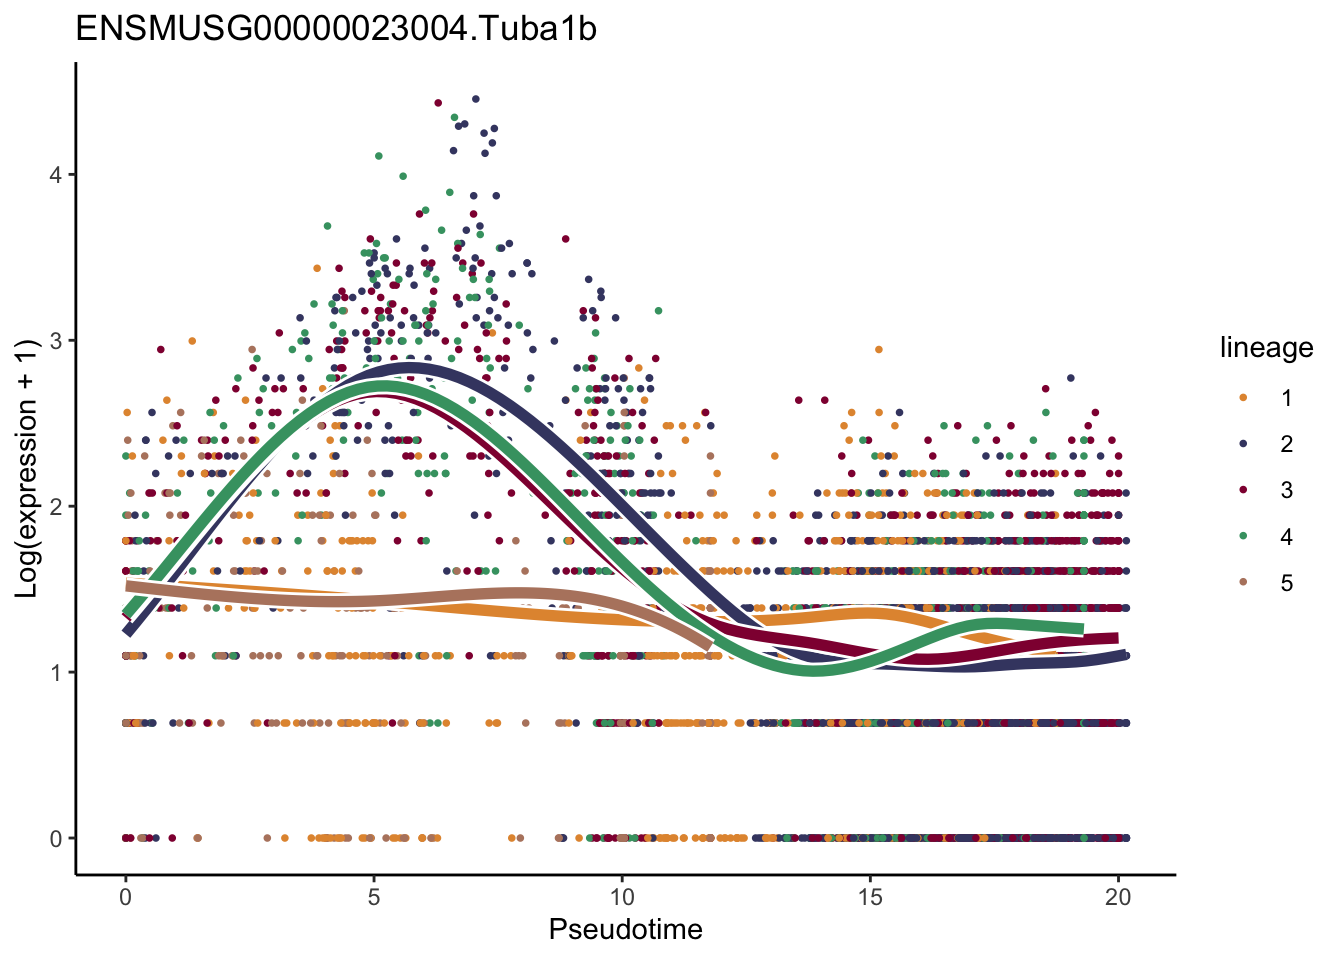
[[25]]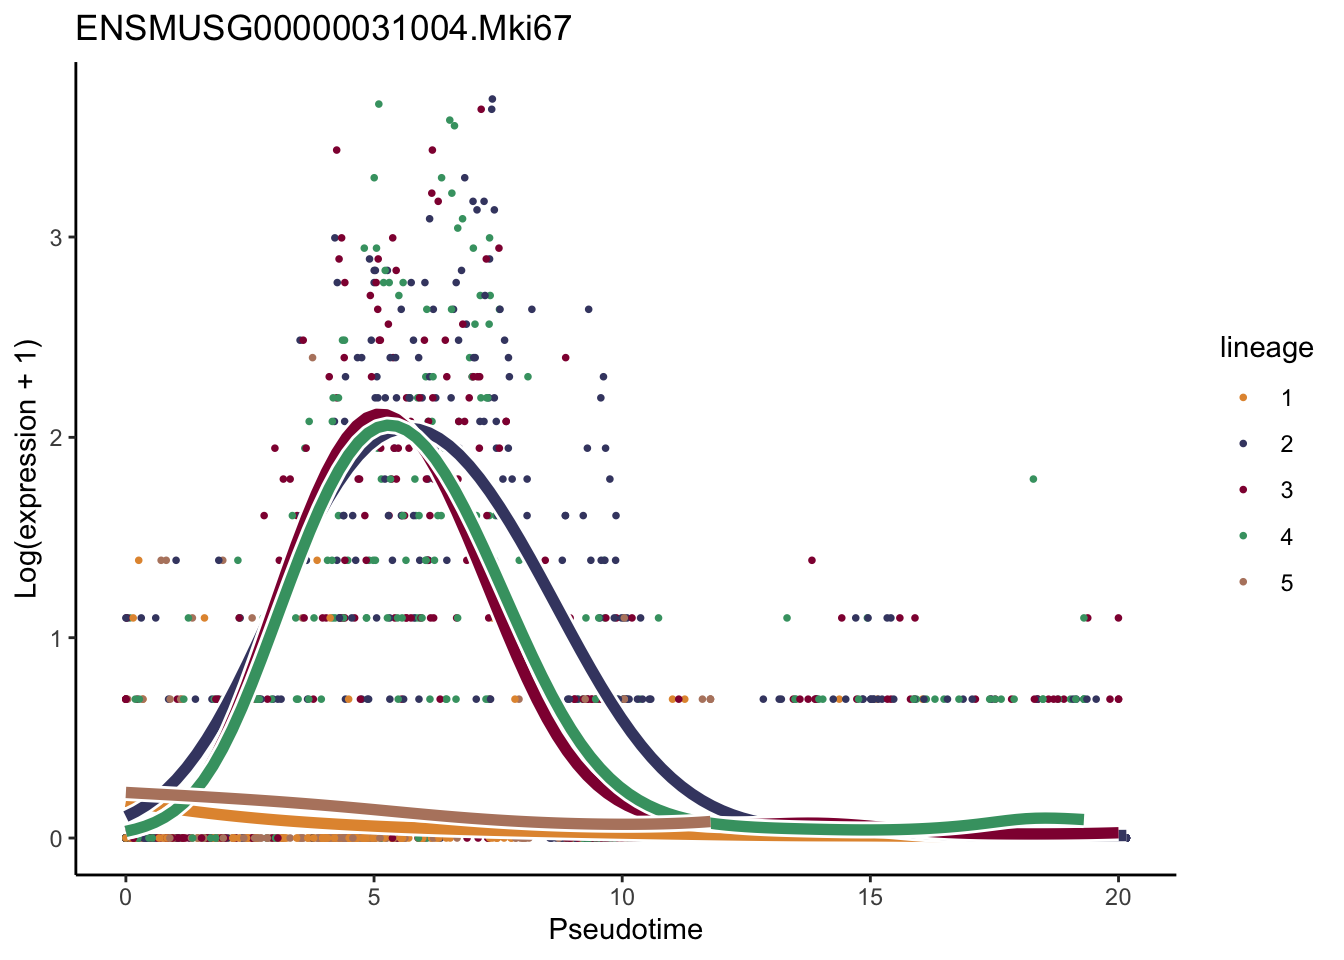
[[26]]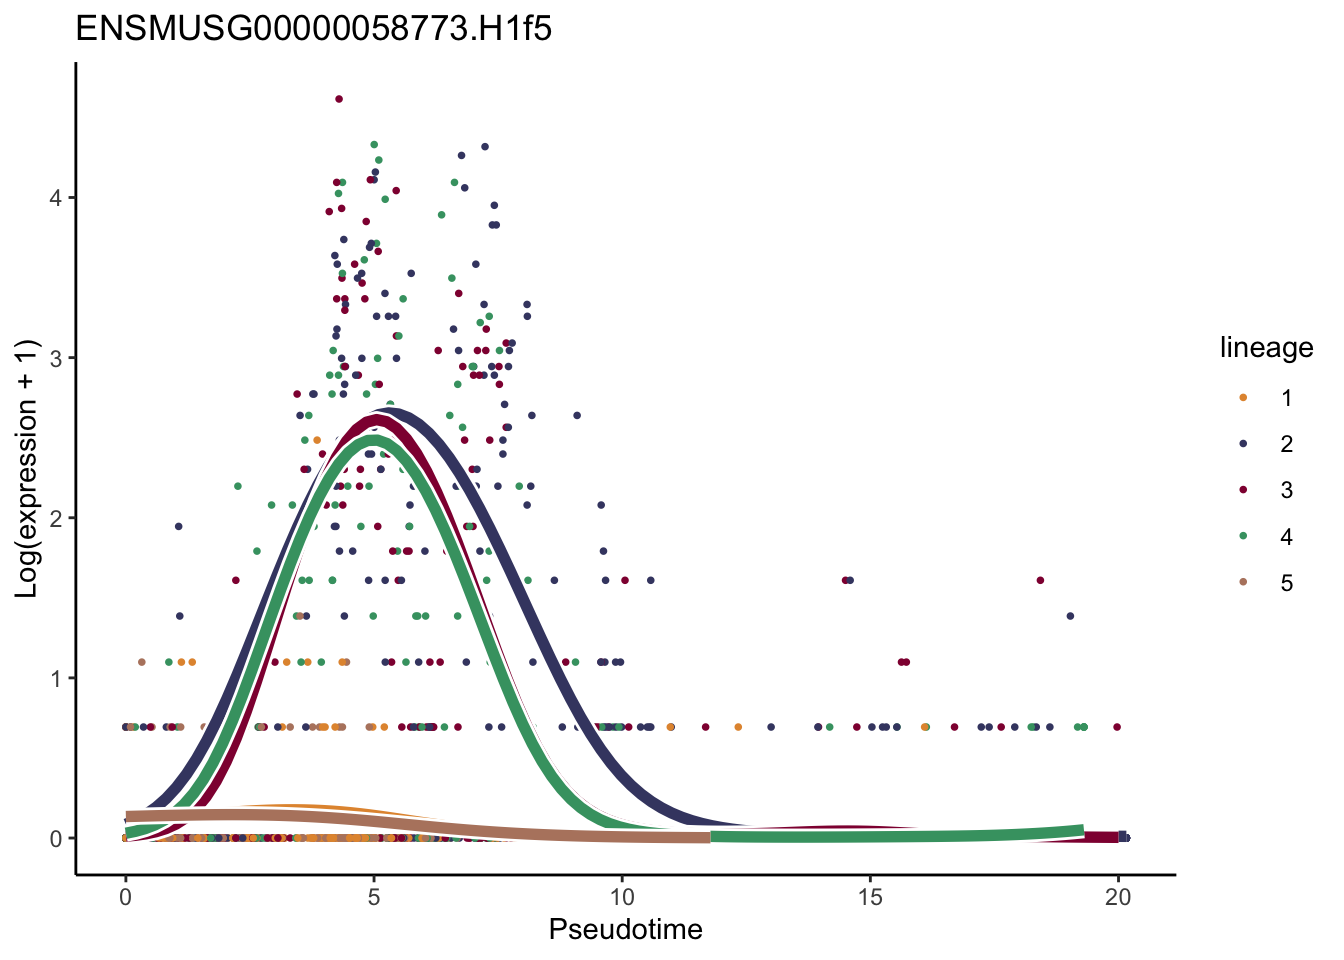
[[27]]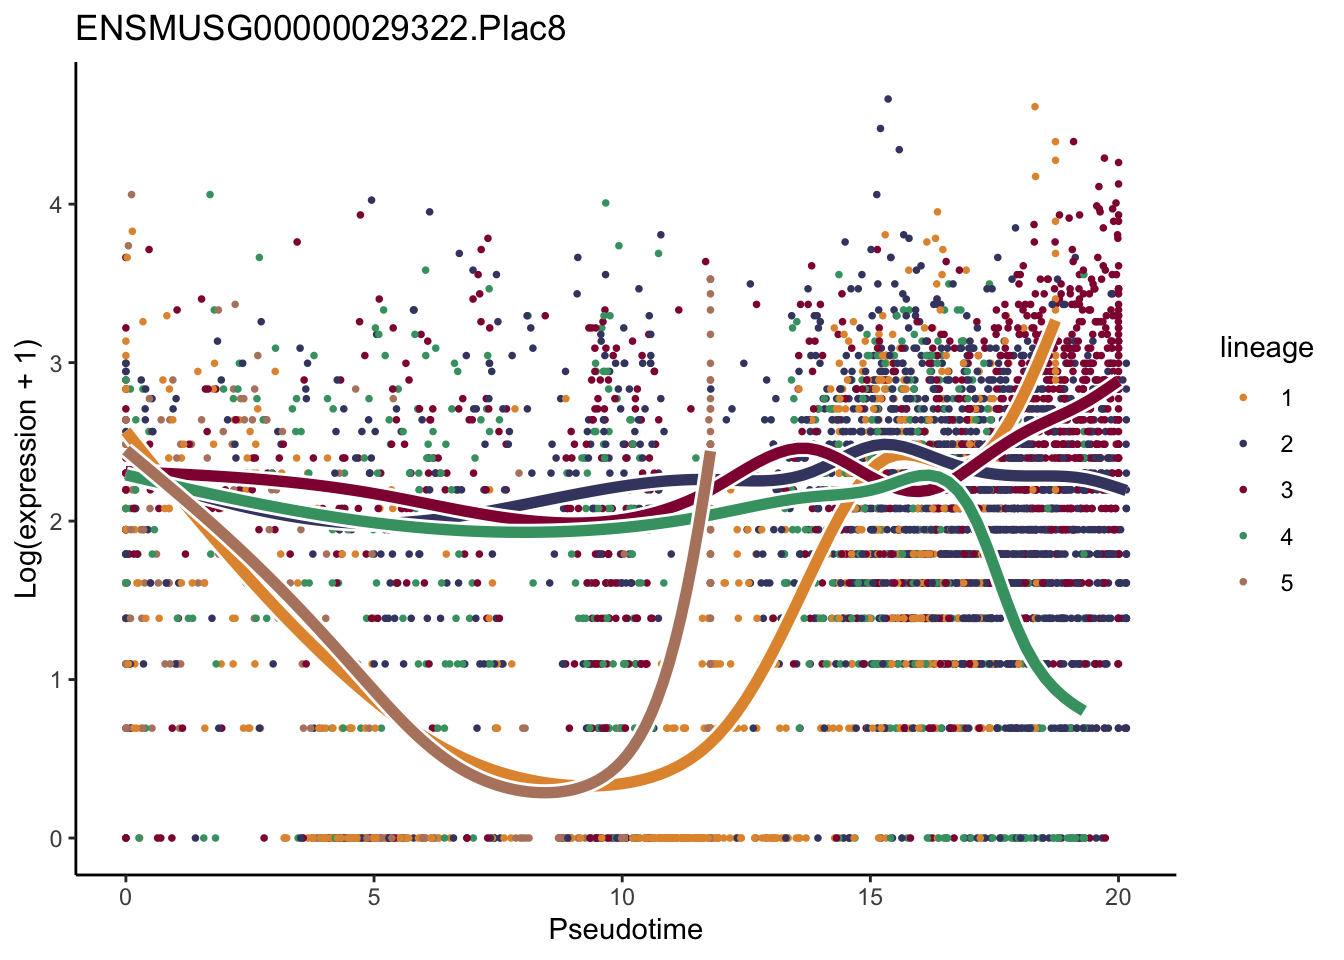
[[28]]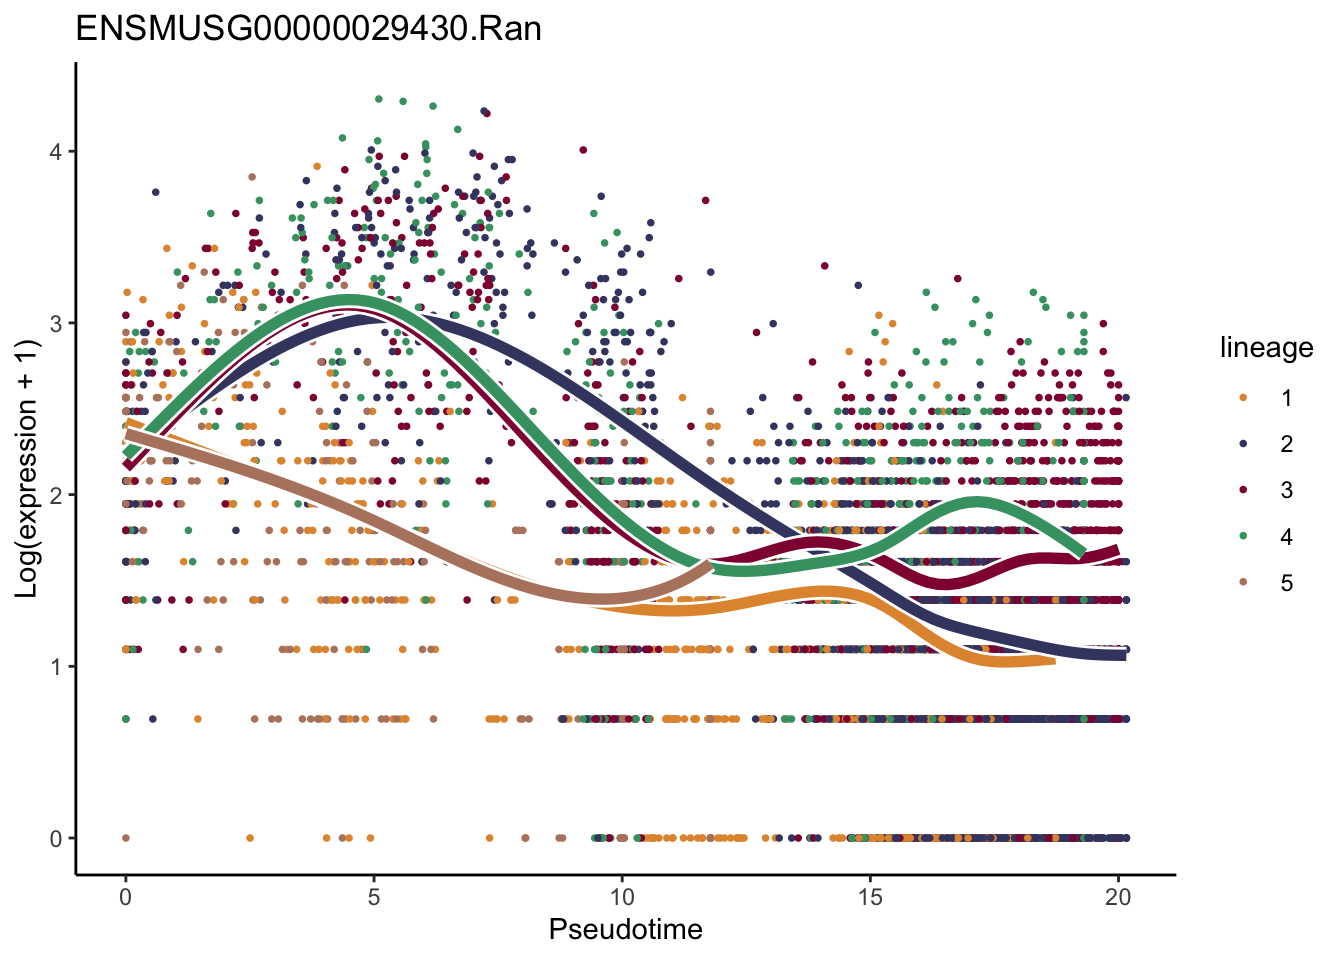
[[29]]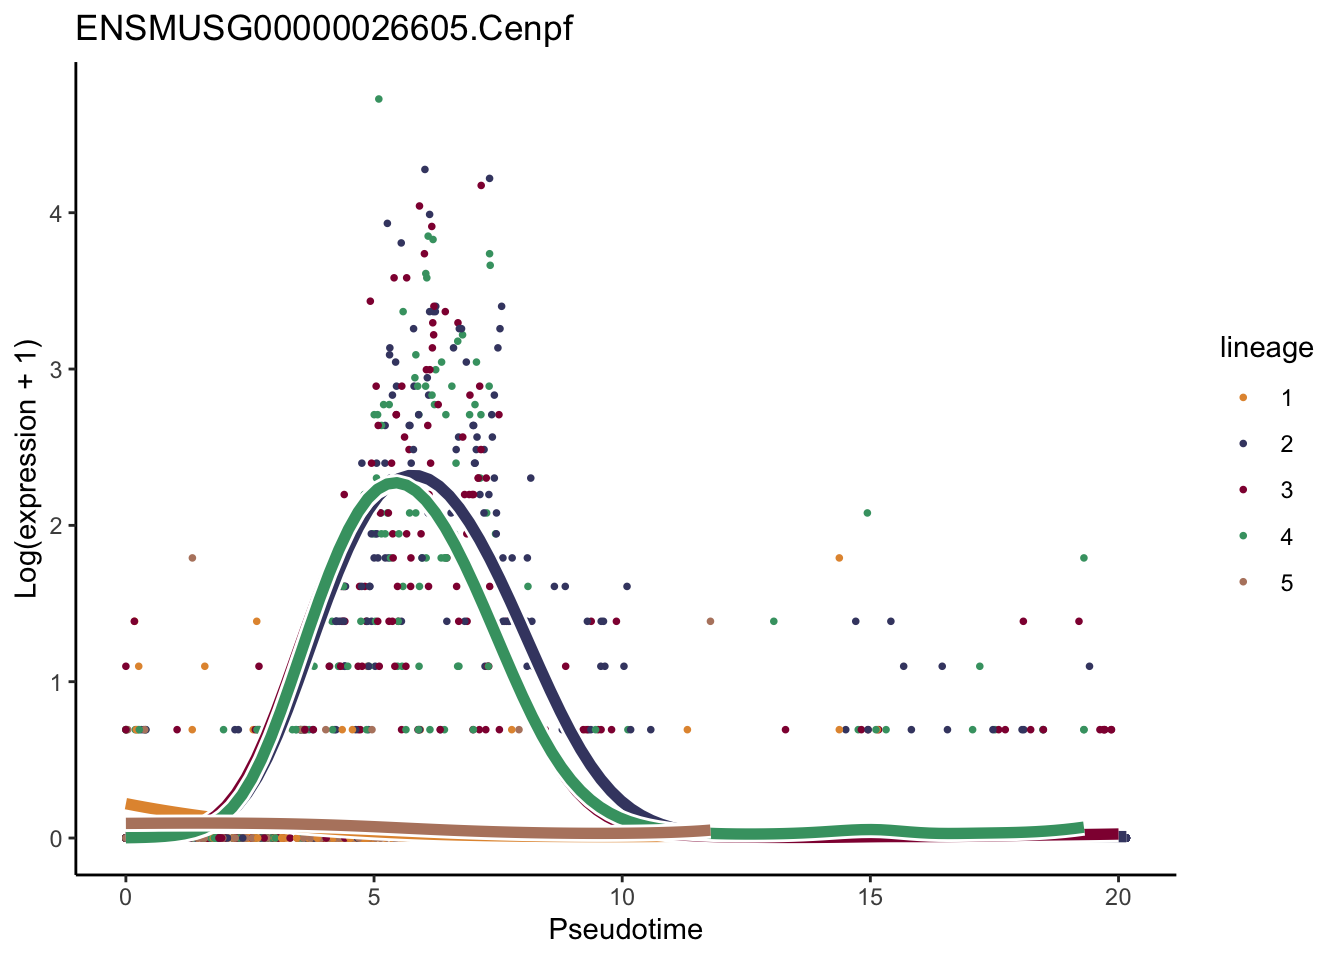
[[30]]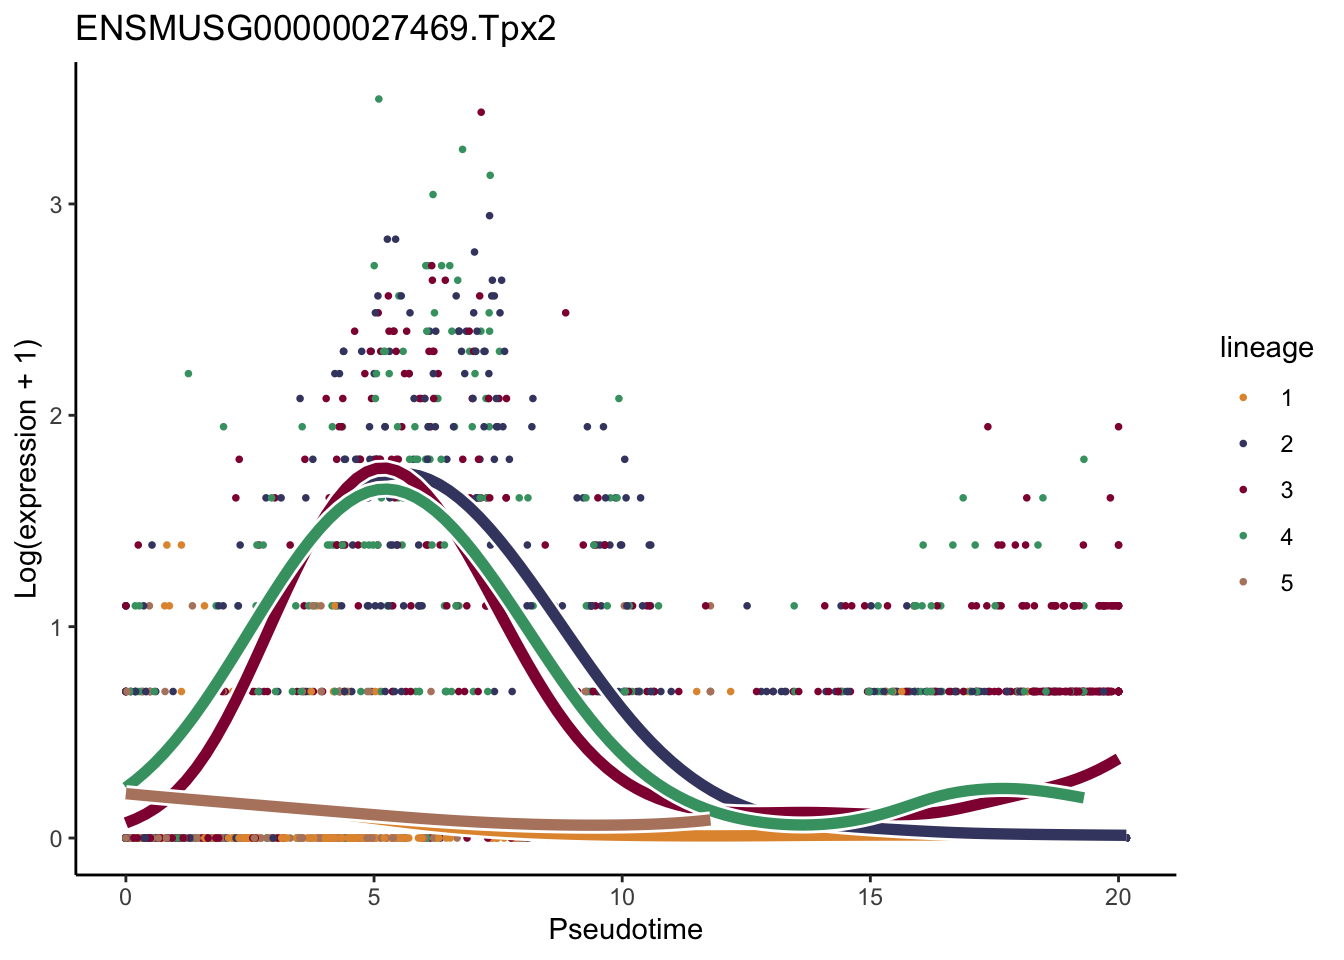
[[31]]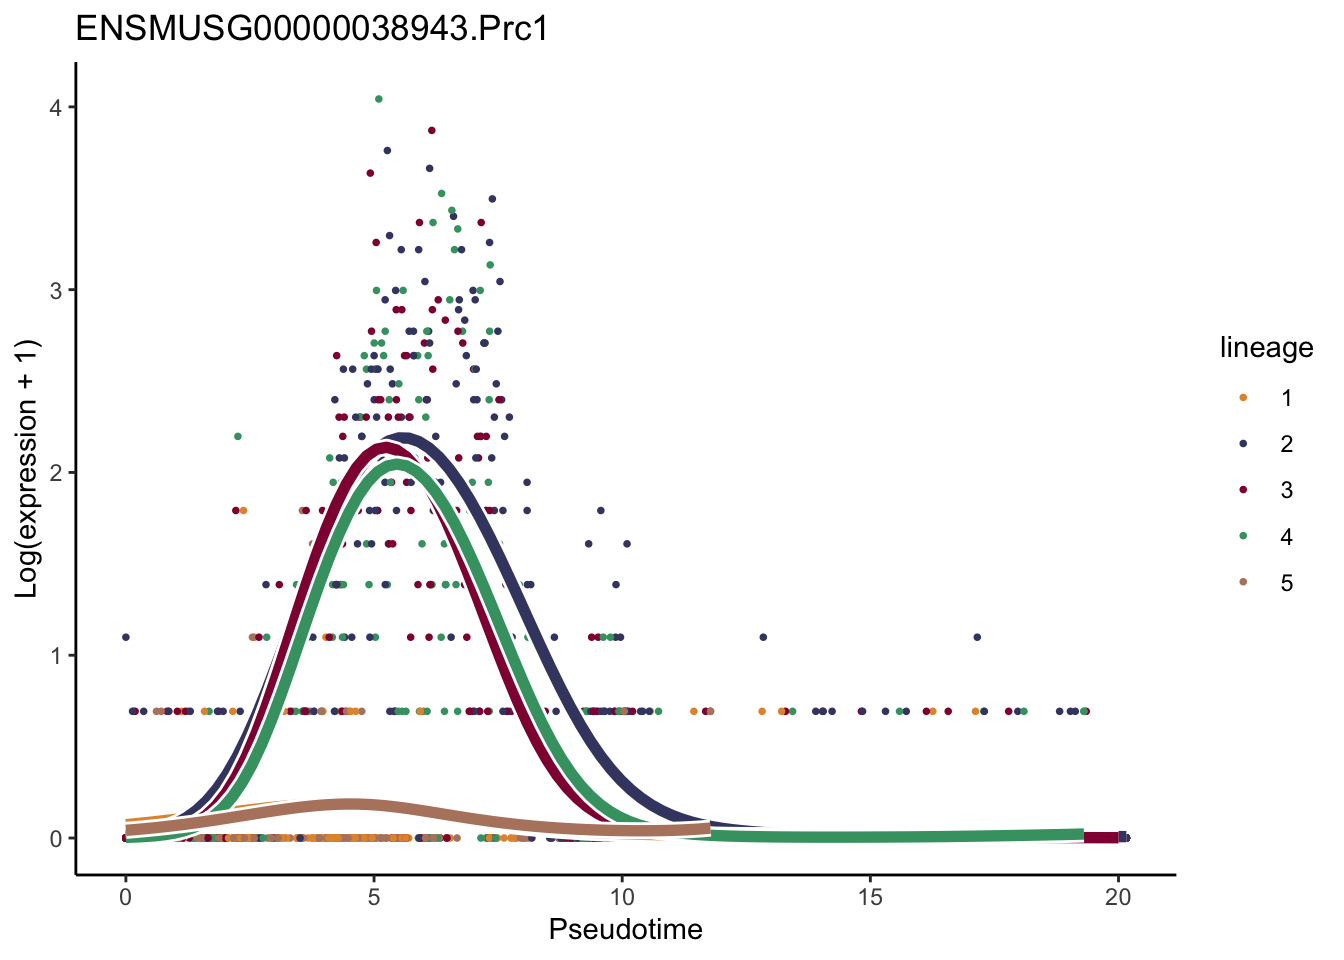
[[32]]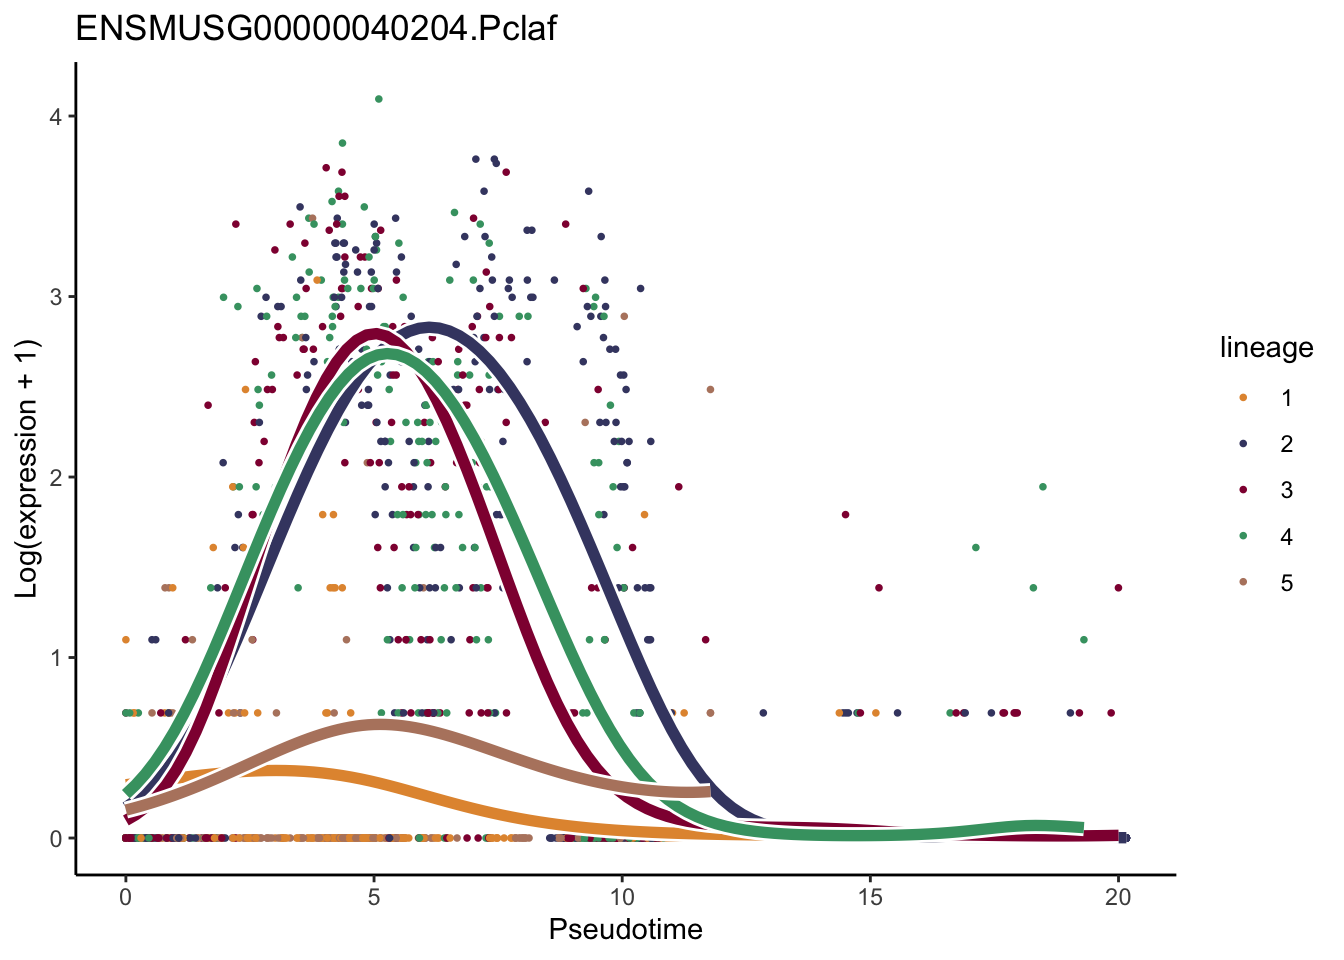
[[33]]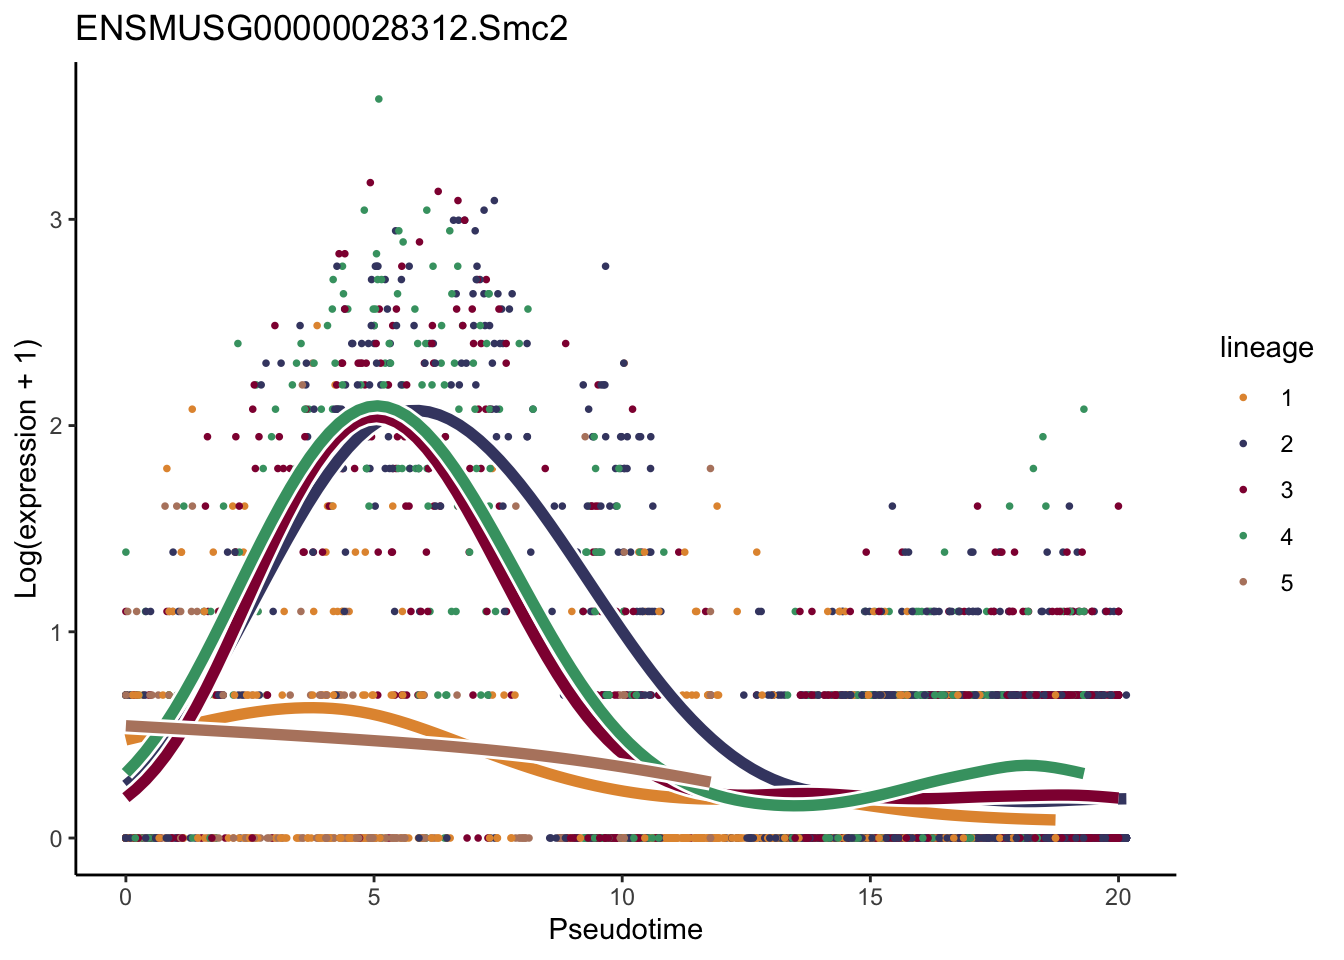
[[34]]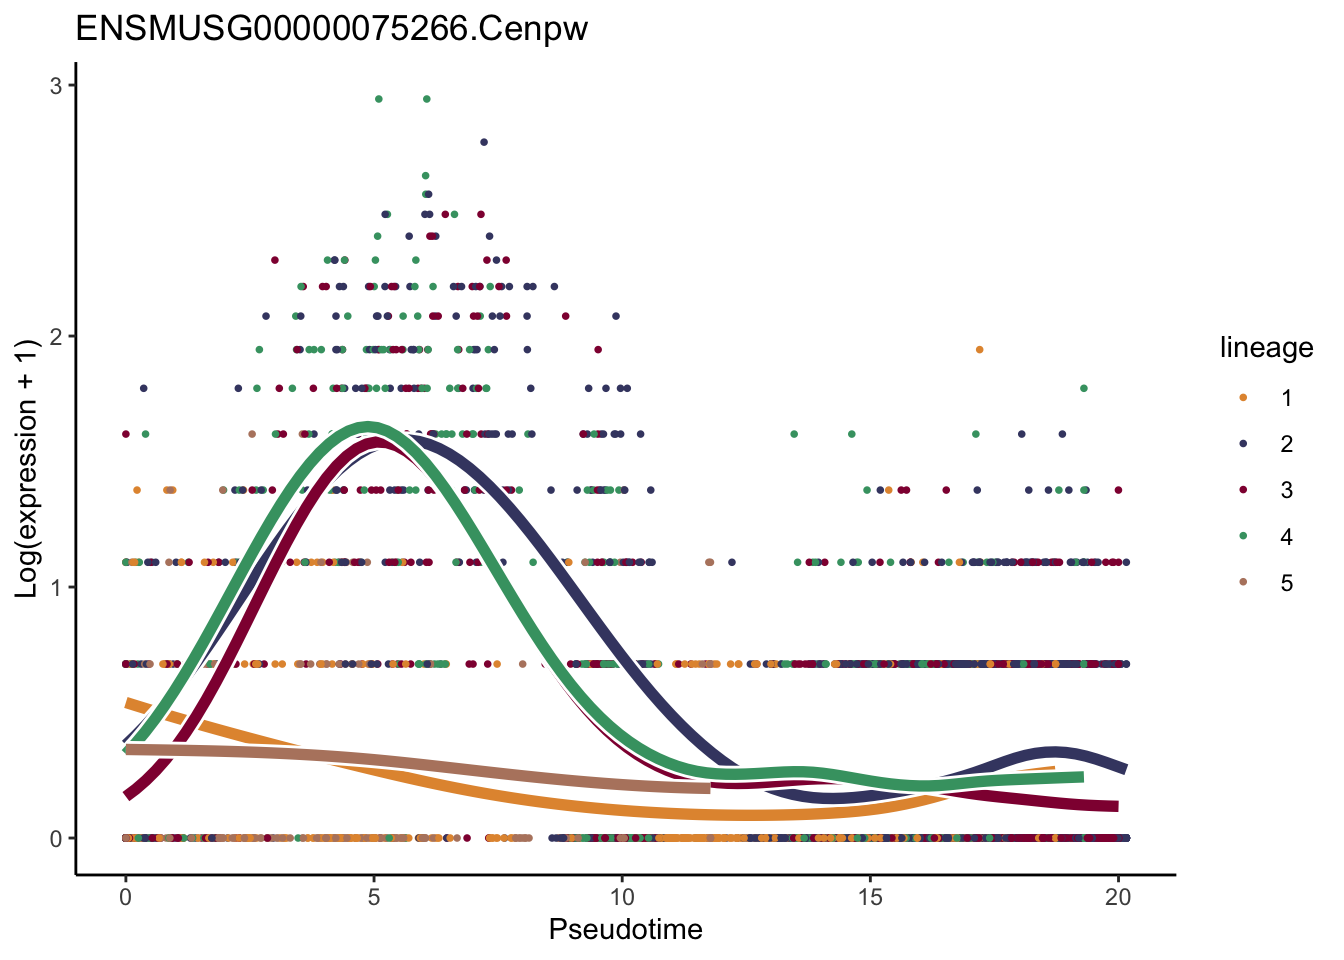
[[35]]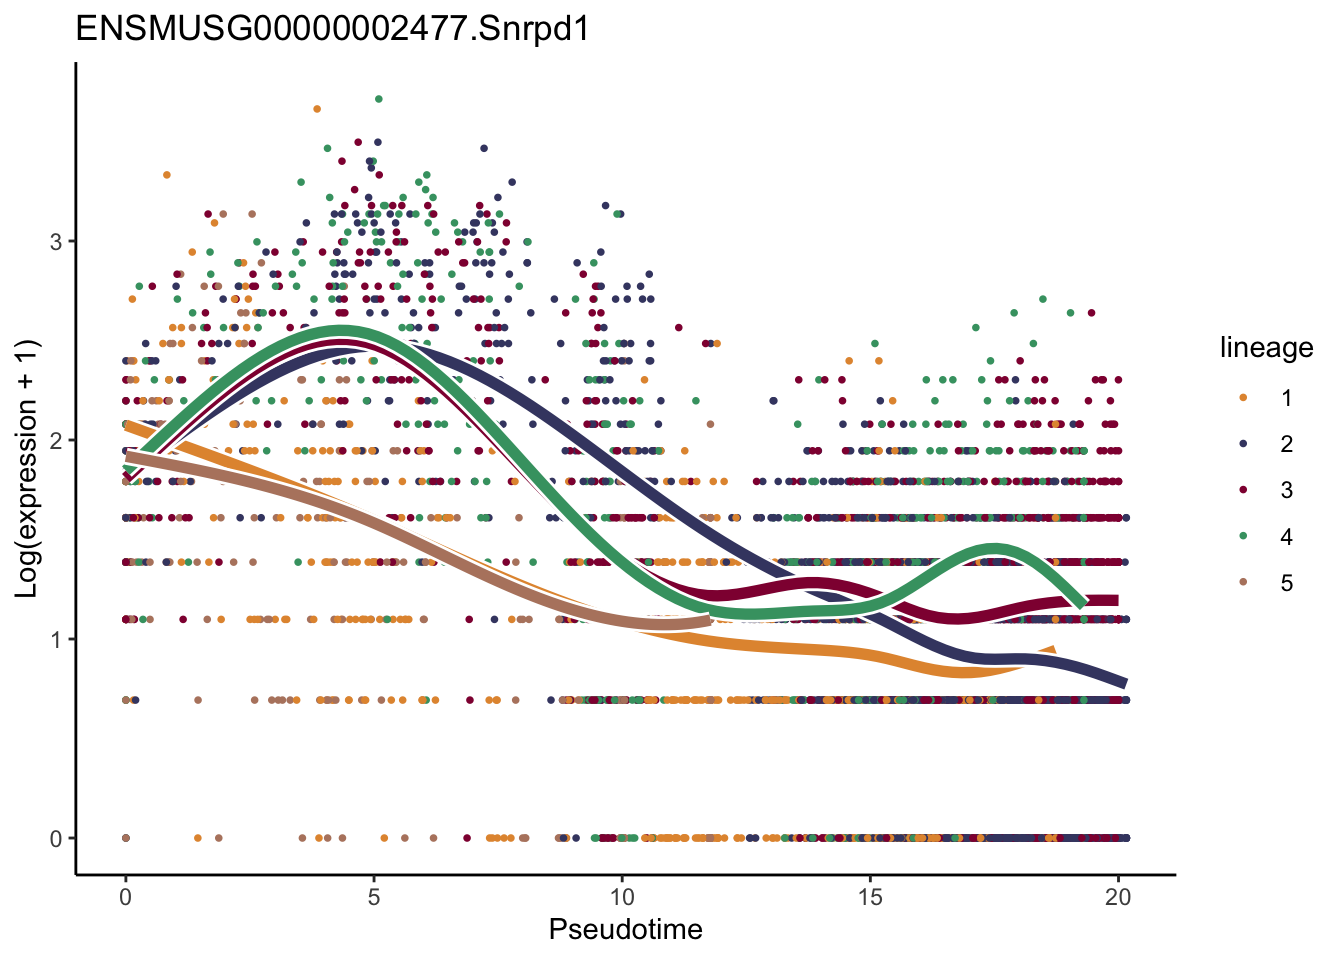
[[36]]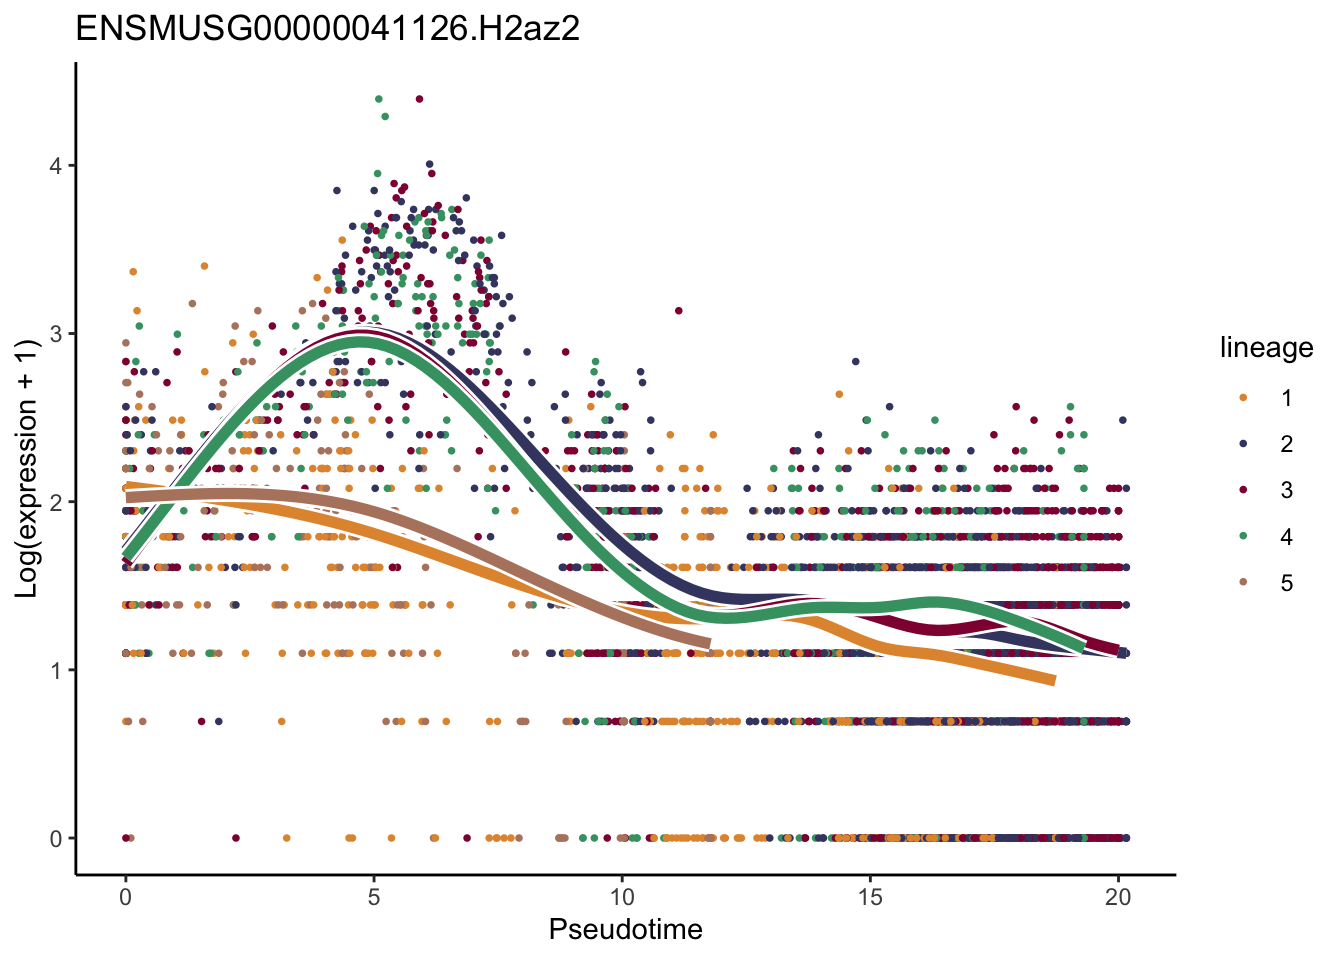
[[37]]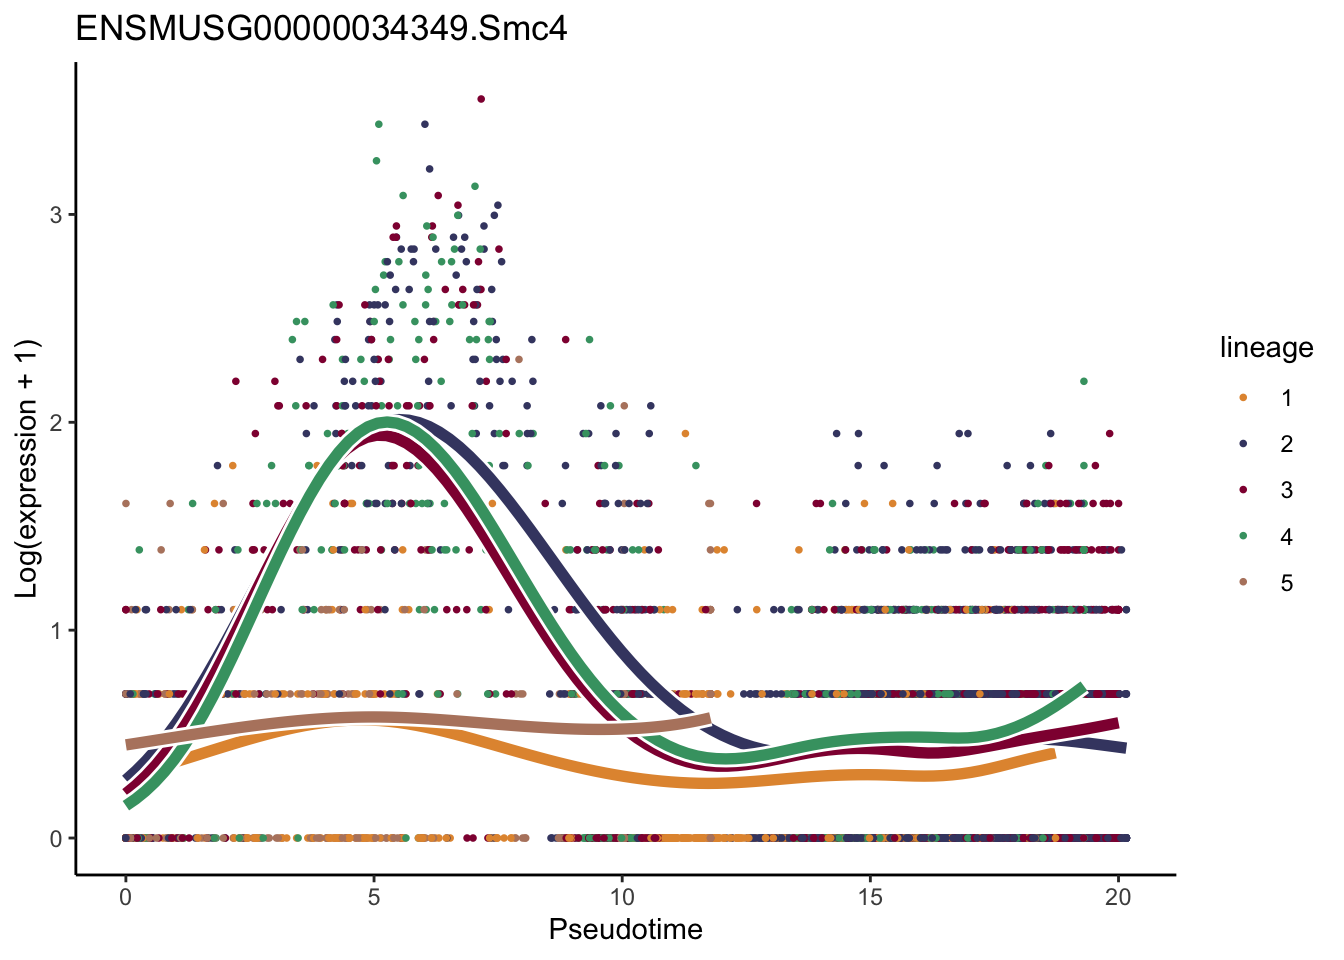
[[38]]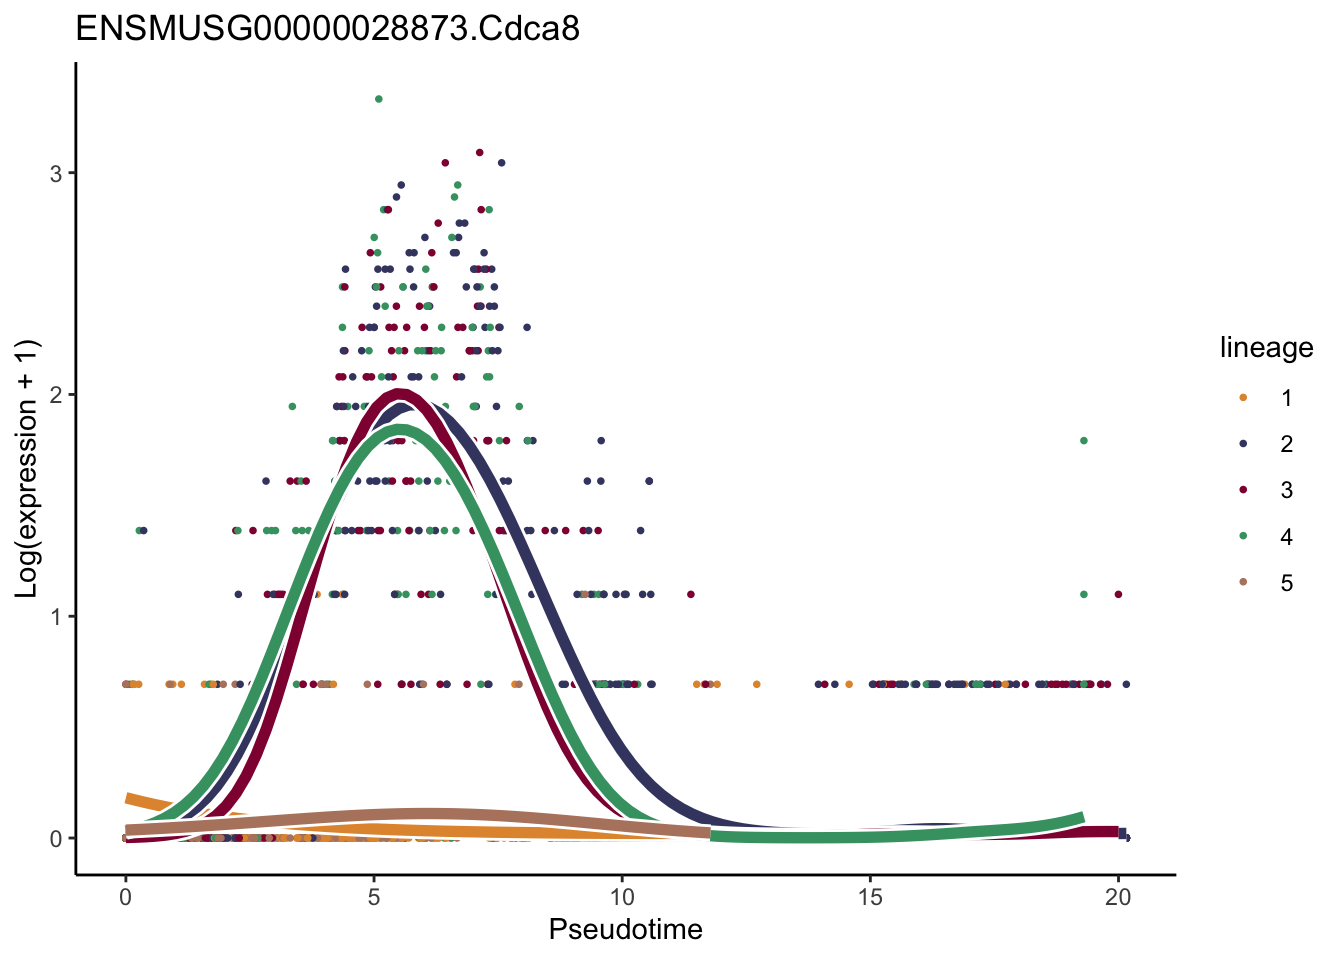
[[39]]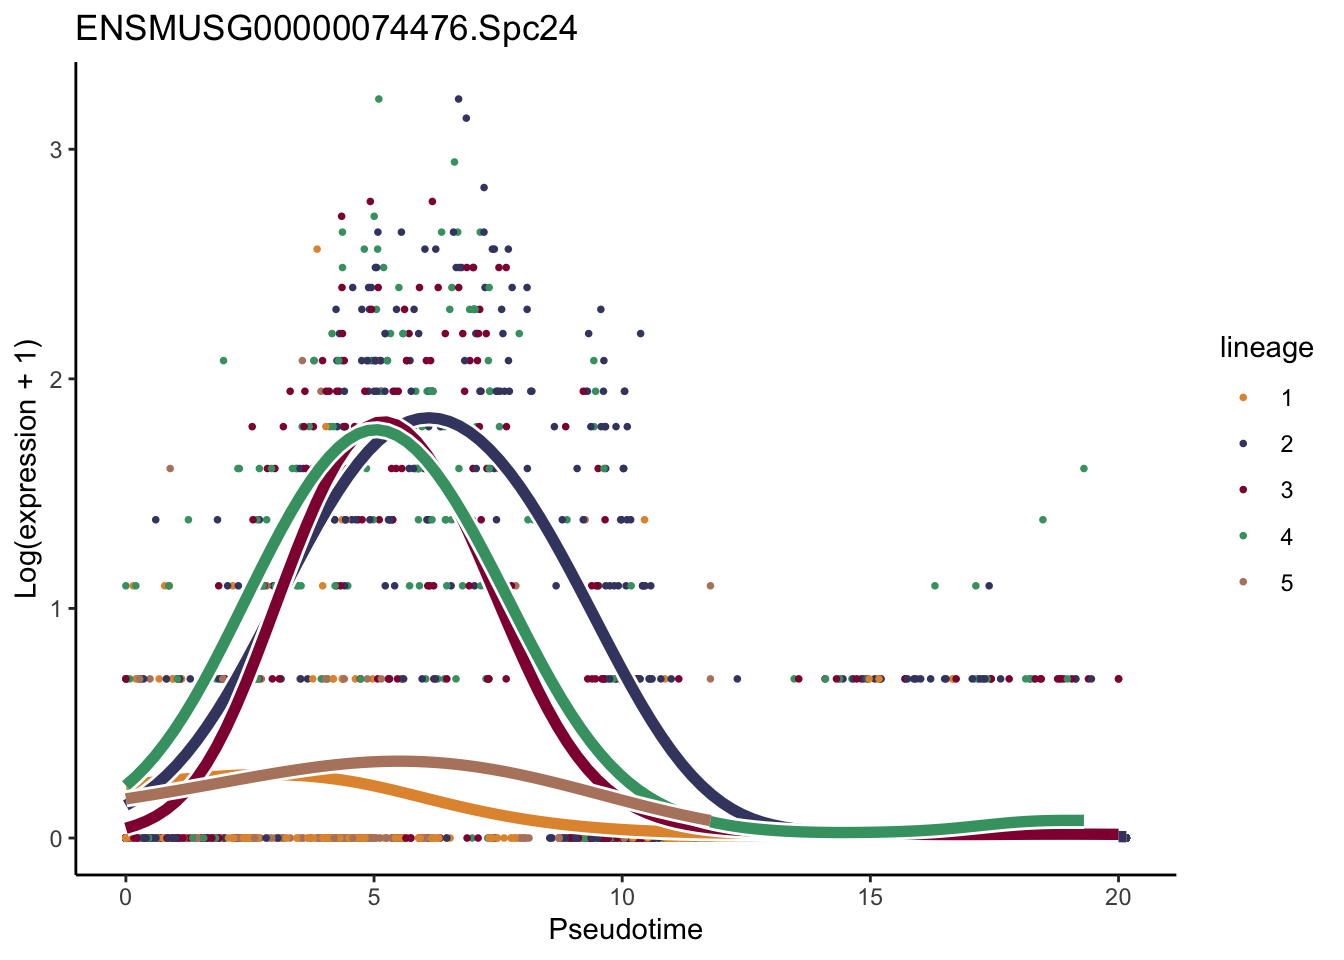
[[40]]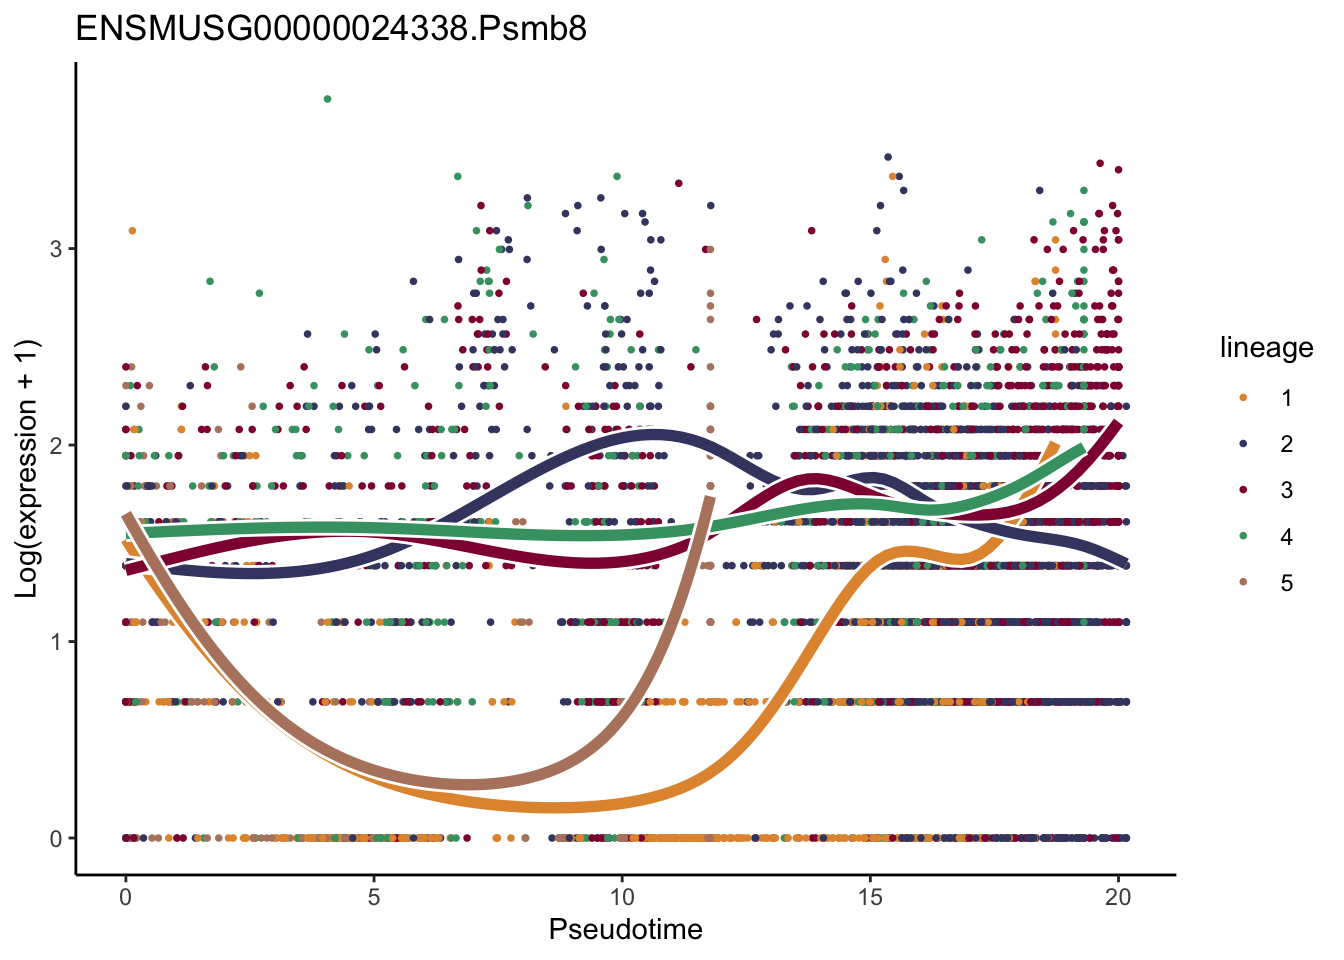
[[41]]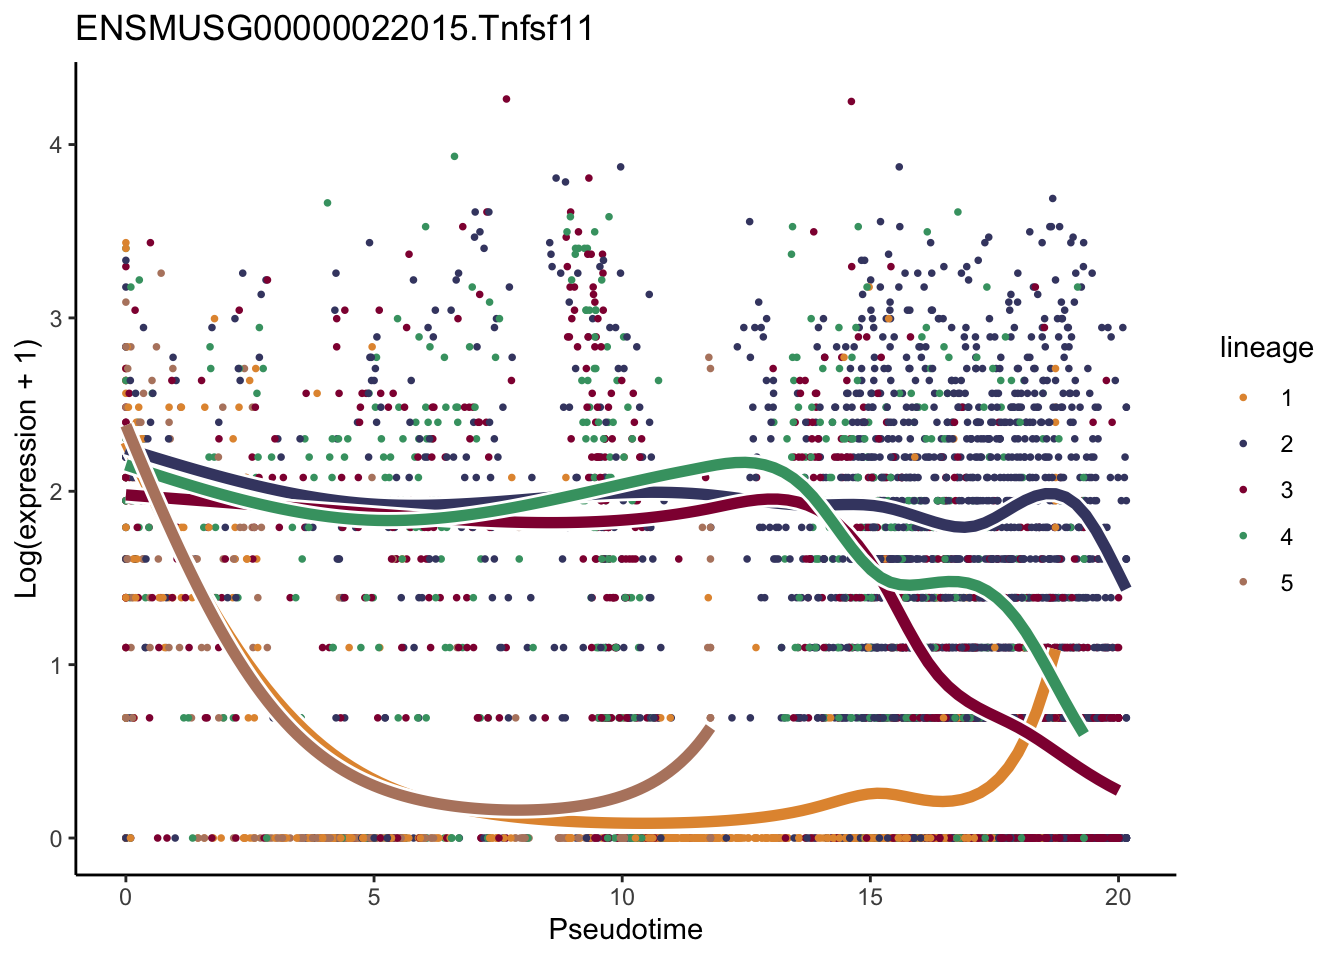
[[42]]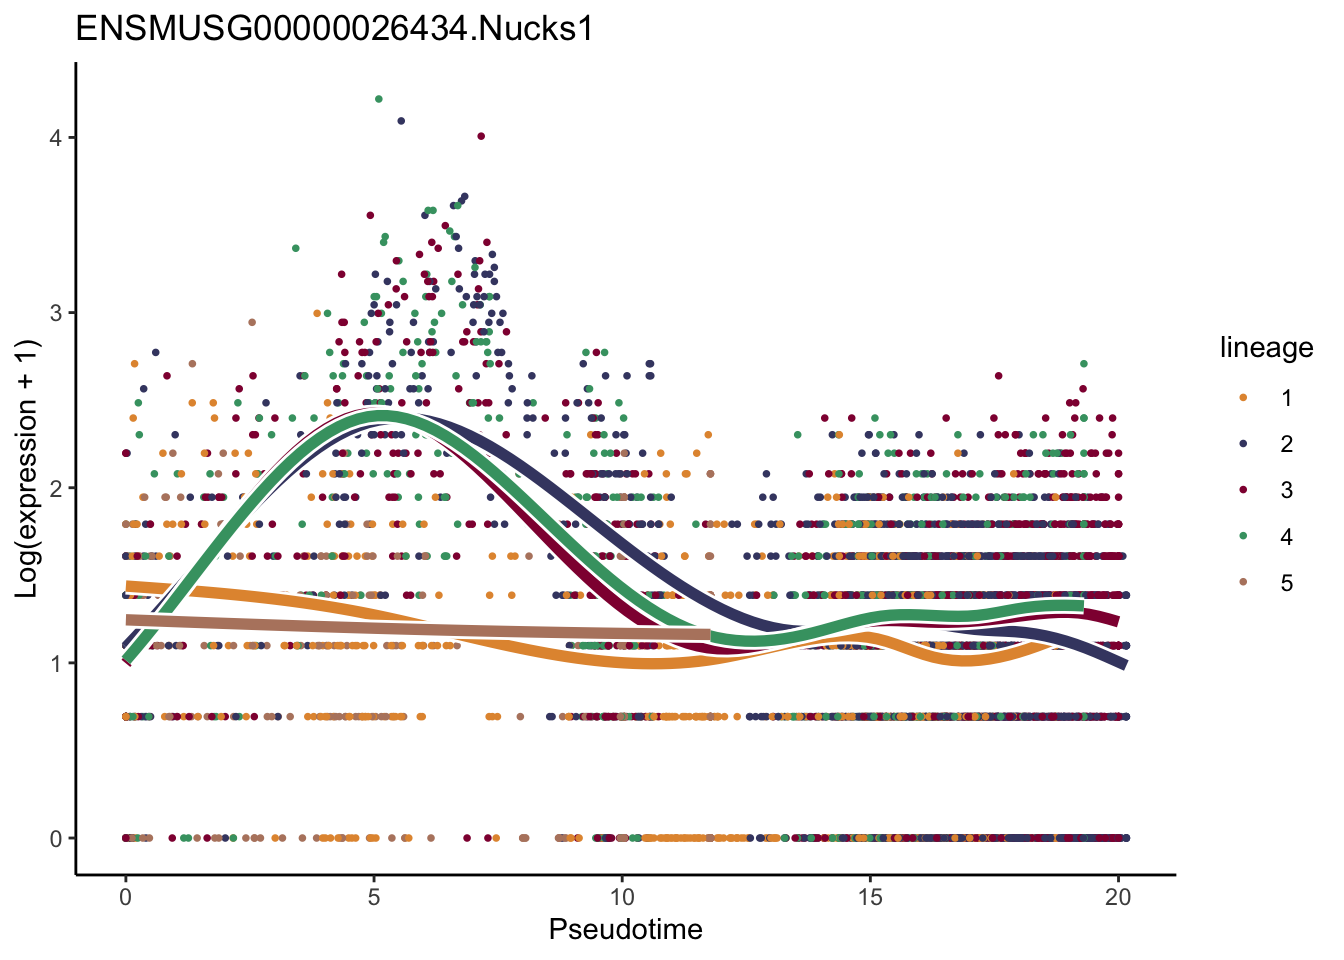
[[43]]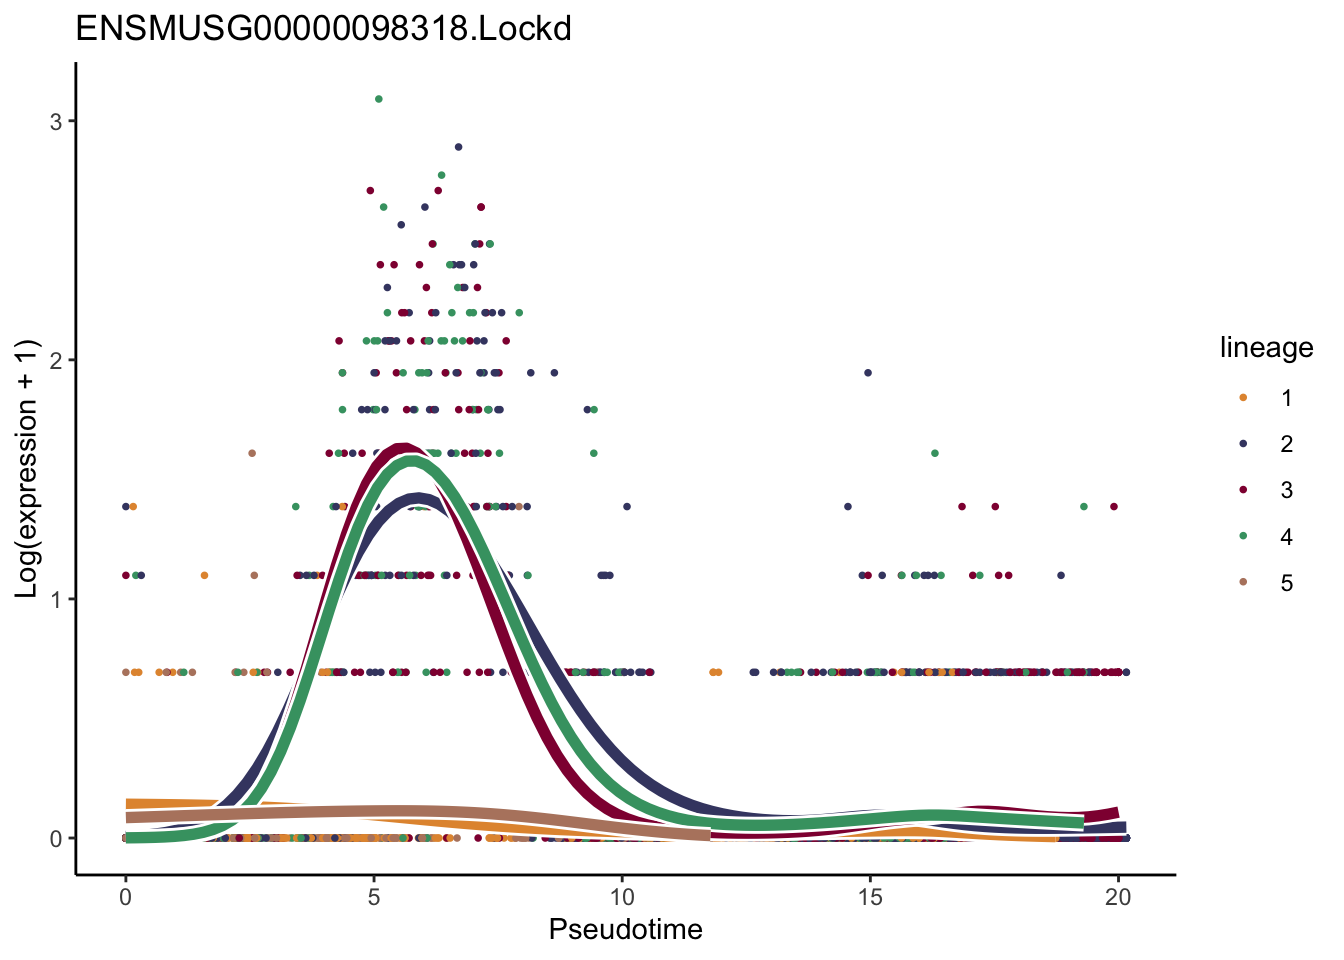
[[44]]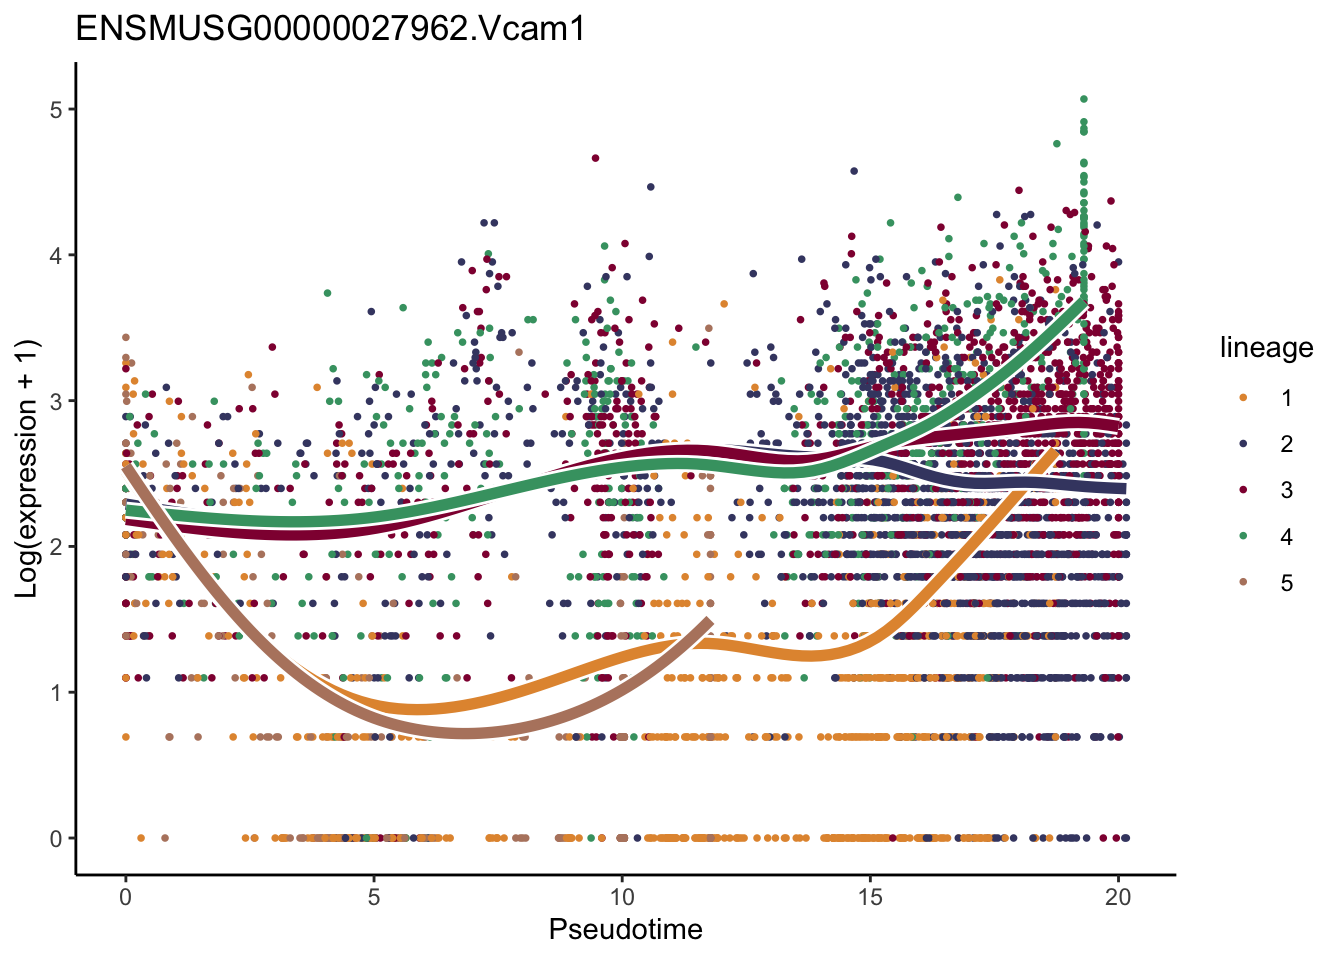
[[45]]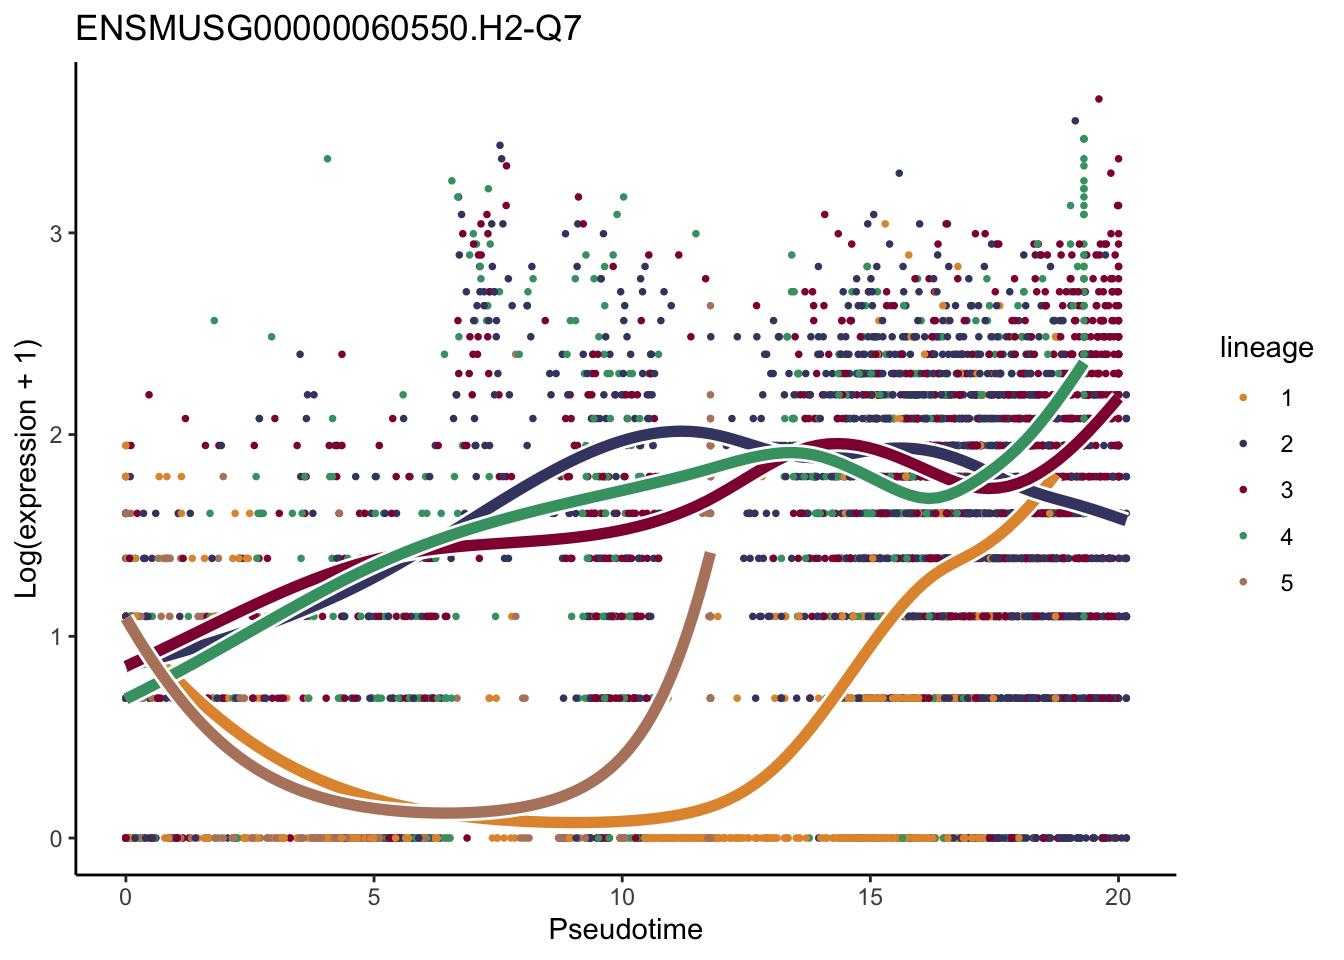
[[46]]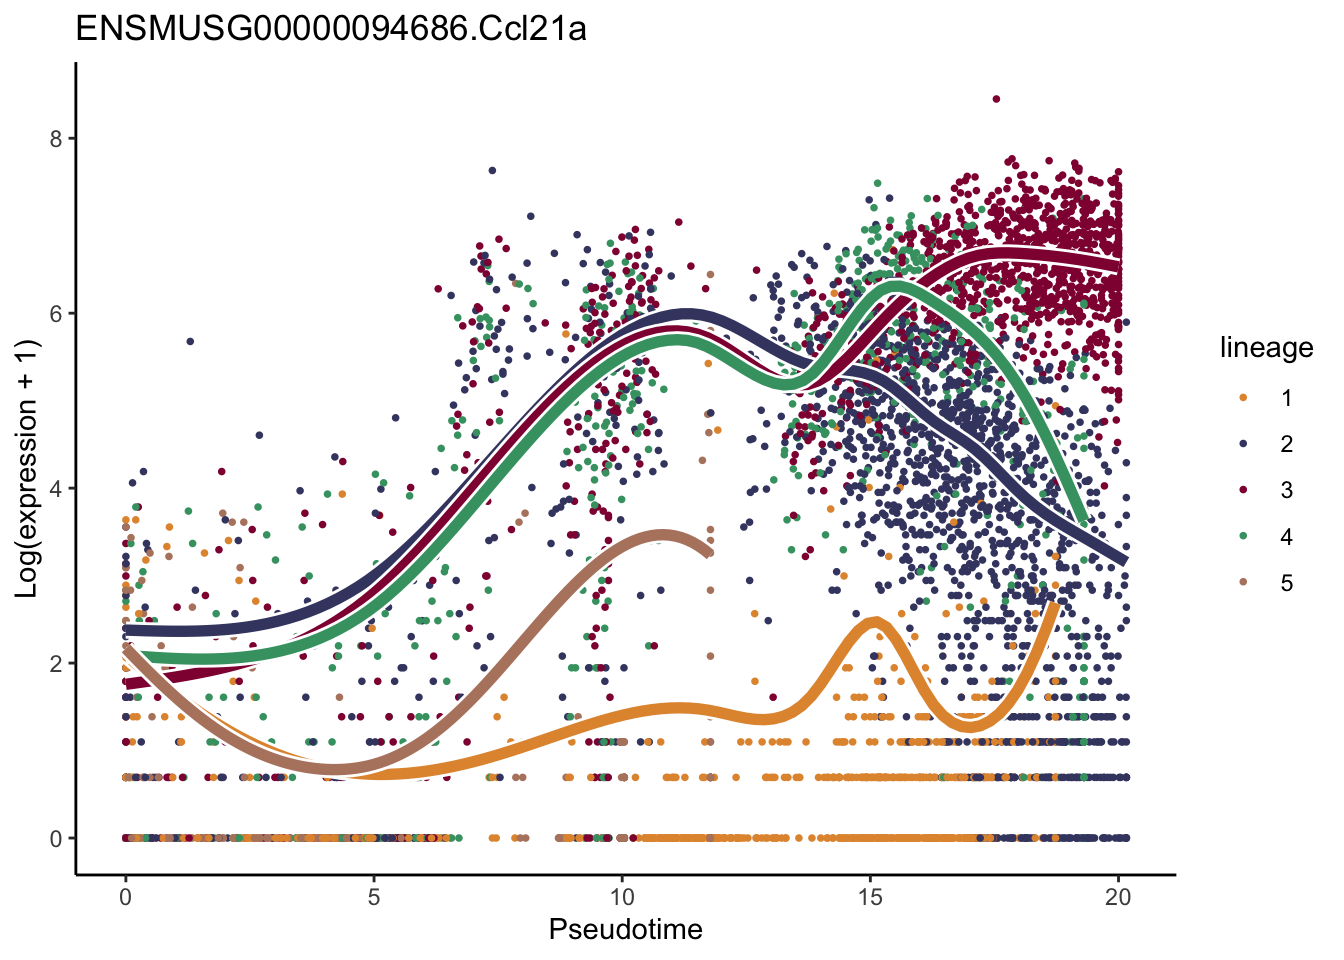
[[47]]
[[48]]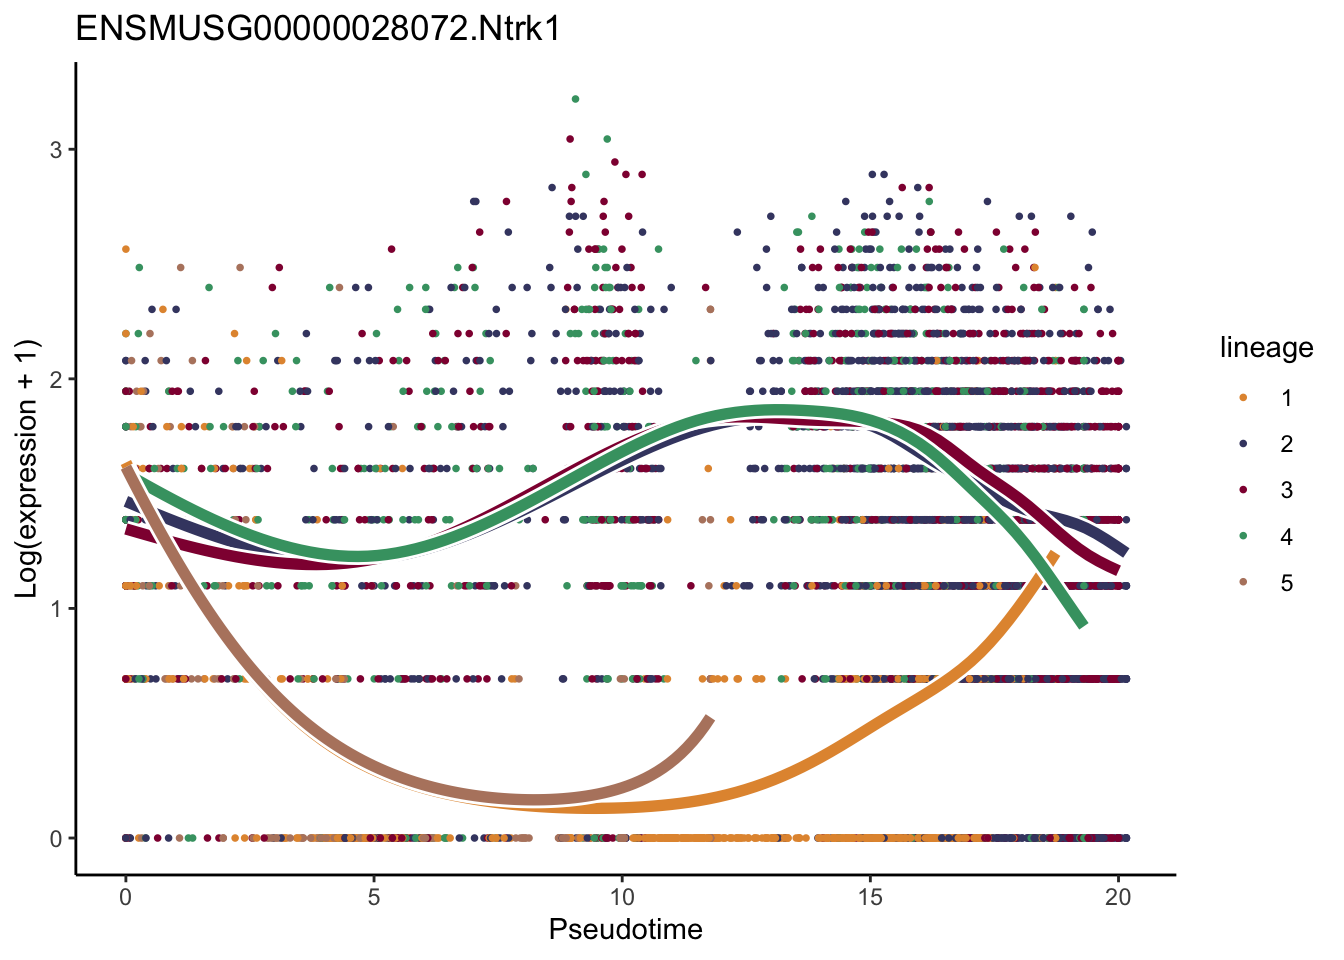
[[49]]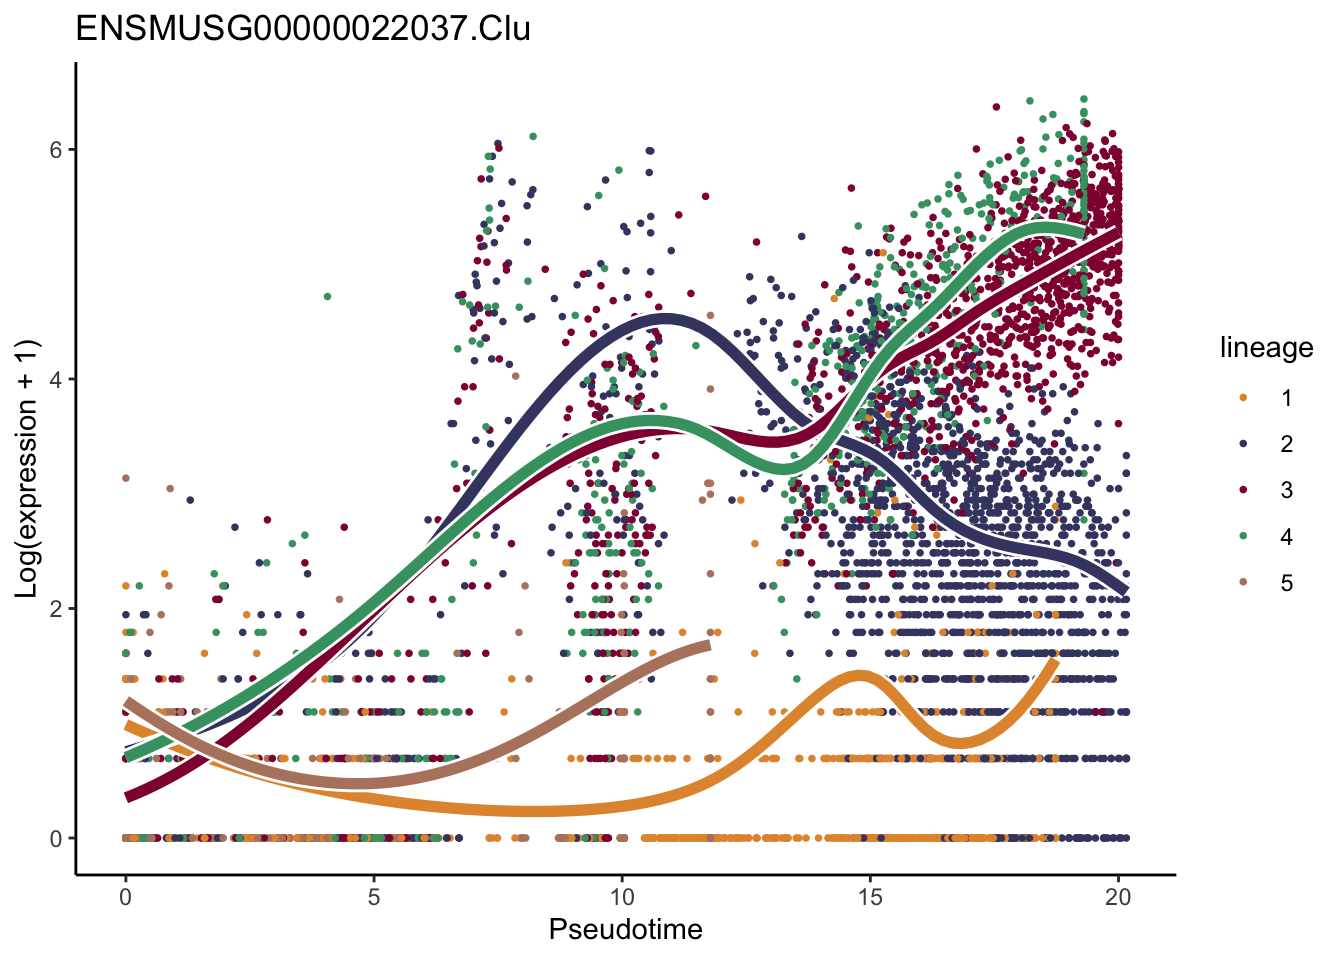
[[50]]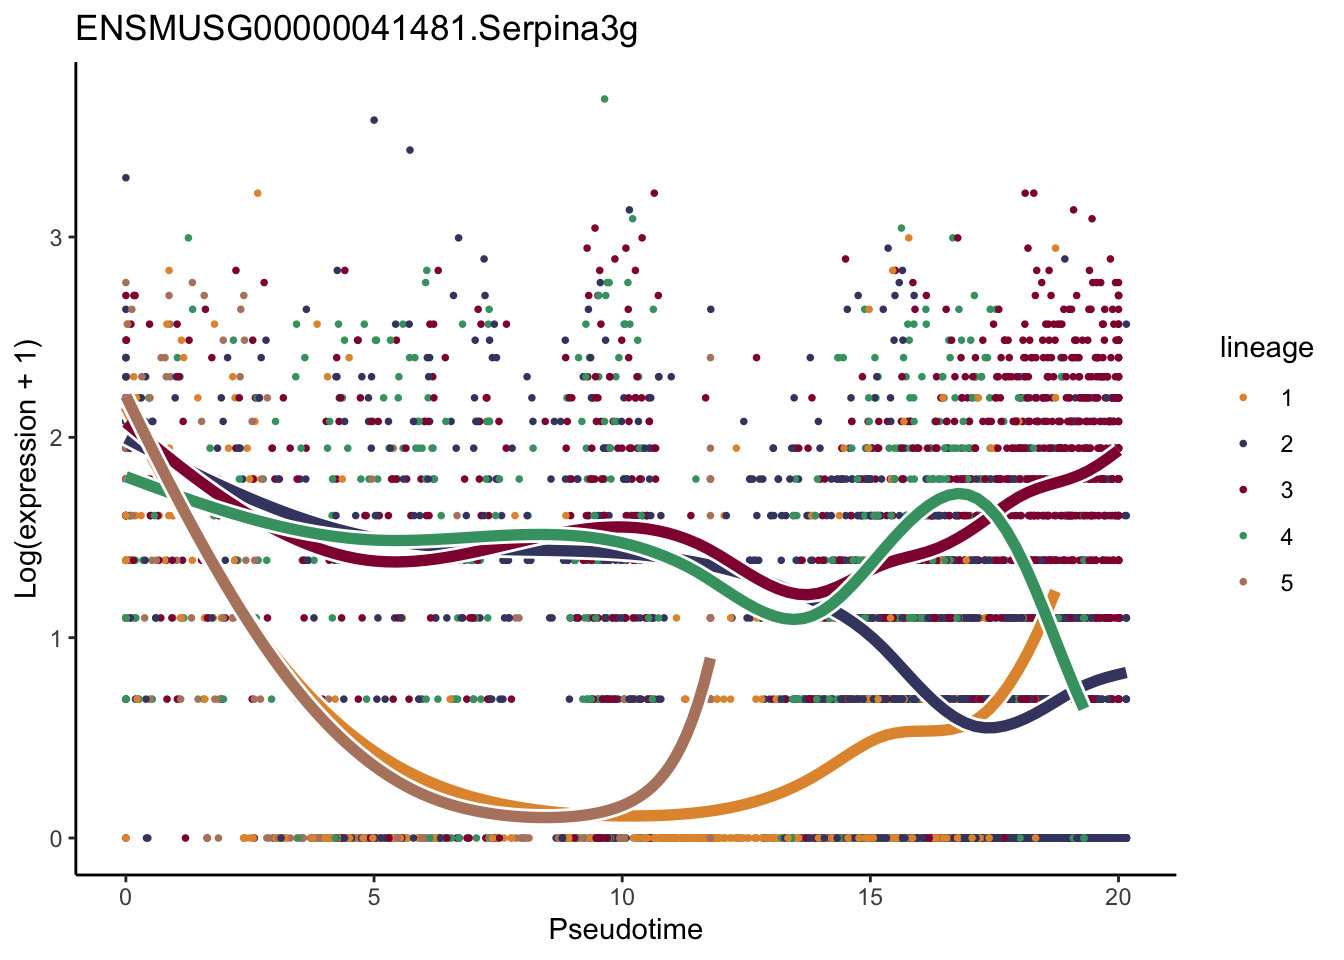
lapply(rankGene[1:50], function(selGene){
  plotGeneCount(SlingshotDataSet(sceSub), counts(sceSub), gene = selGene) +
    scale_color_gradientn( colours = c("#e7e7e7", "#c98599", "#8a062d"))
})
[[1]]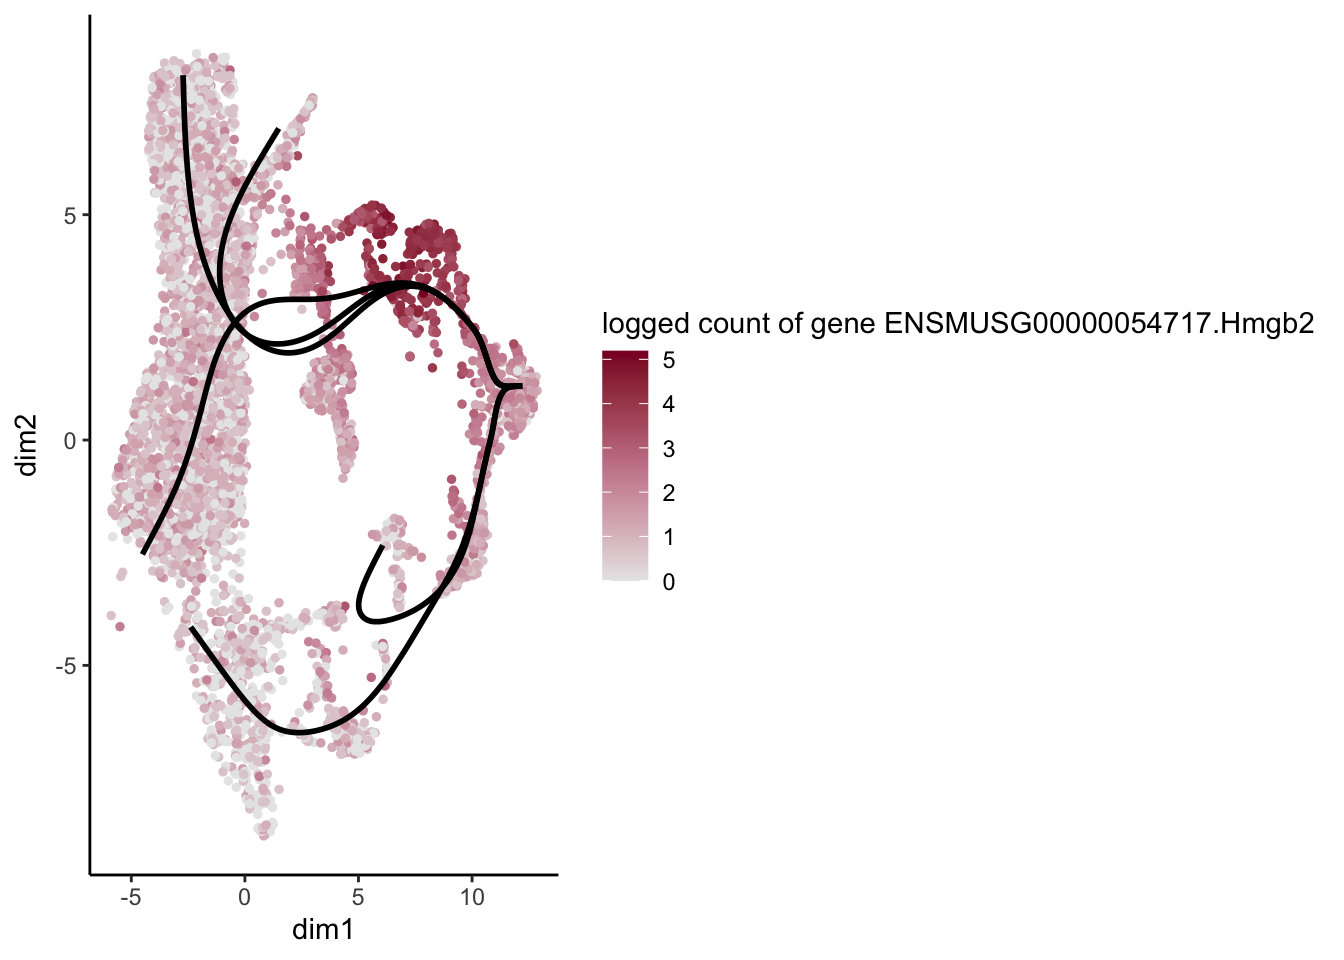
[[2]]
[[3]]
[[4]]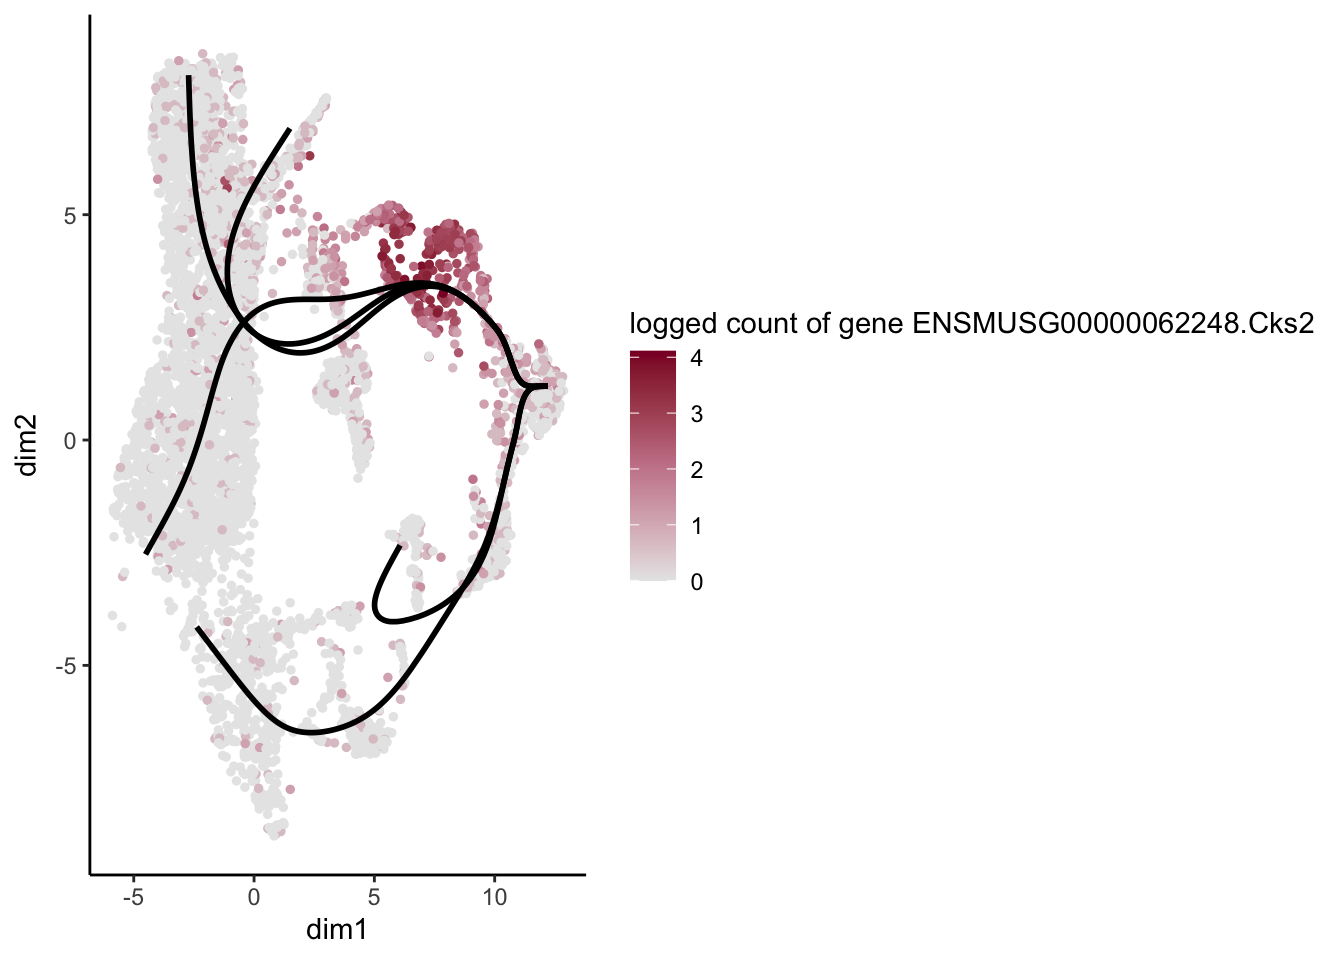
[[5]]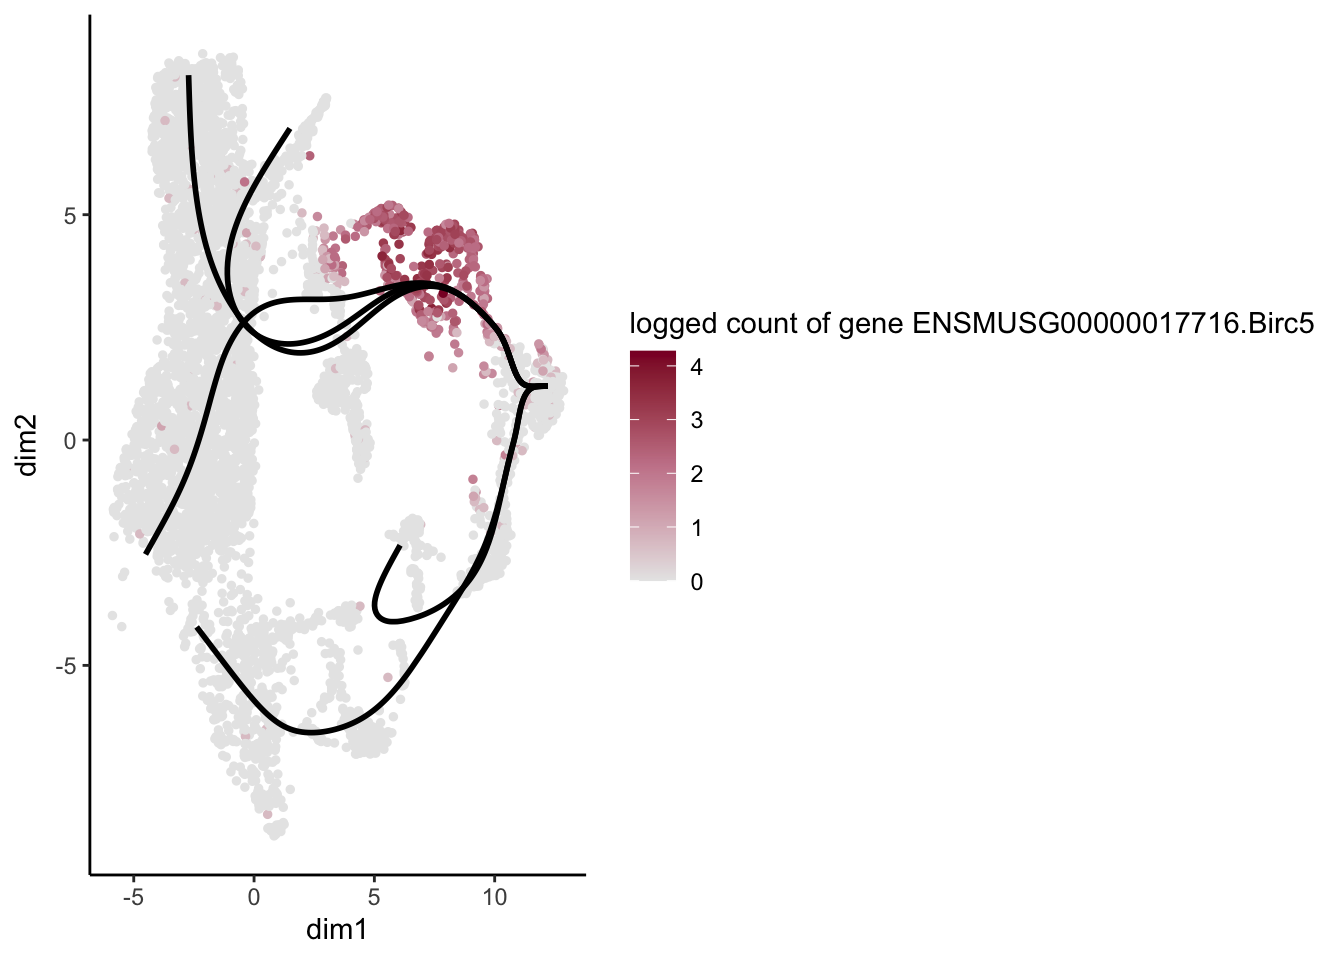
[[6]]
[[7]]
[[8]]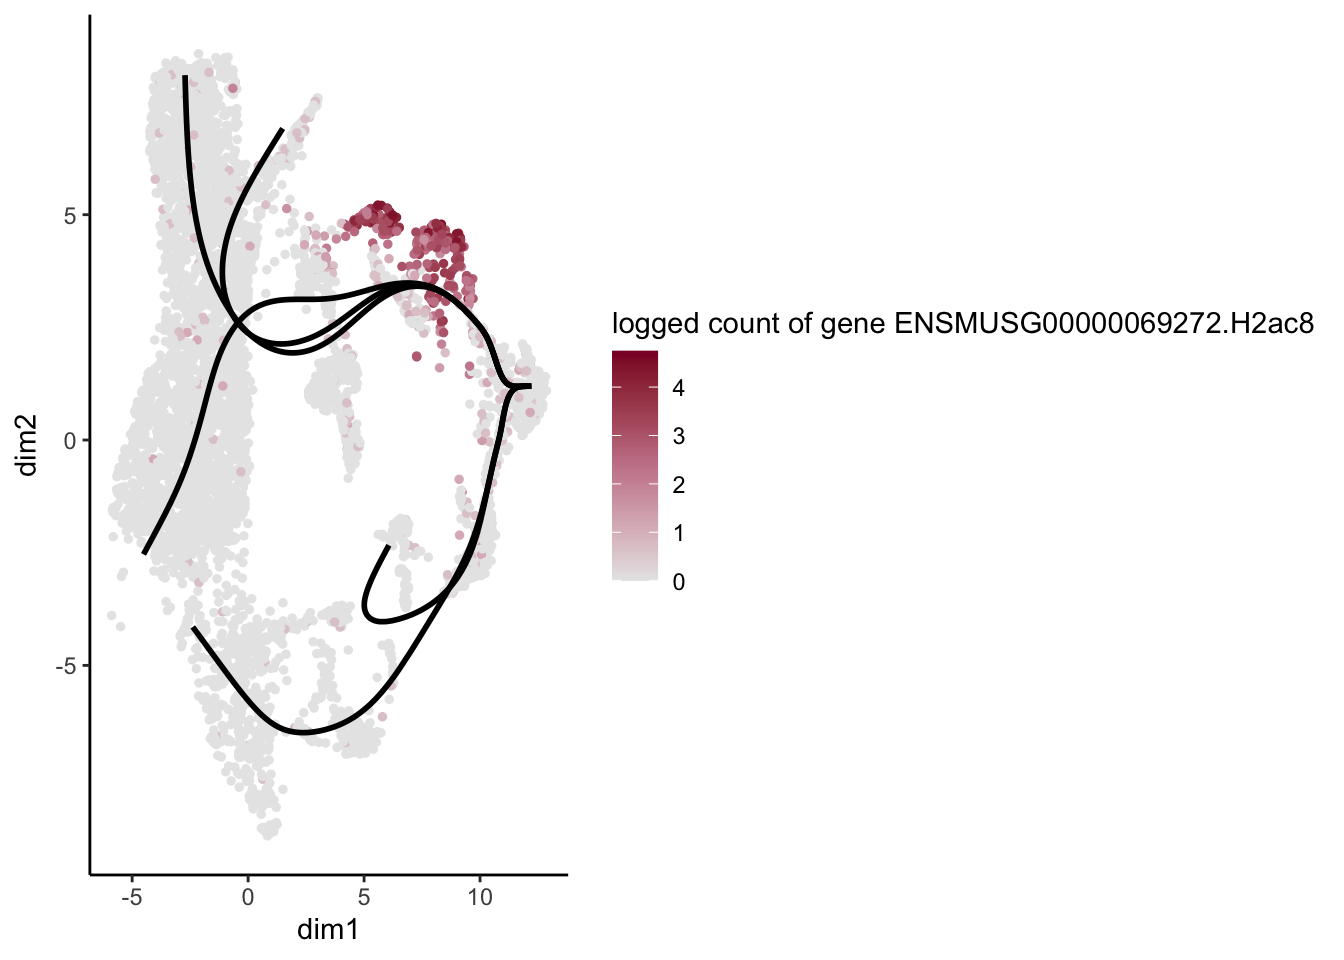
[[9]]
[[10]]
[[11]]
[[12]]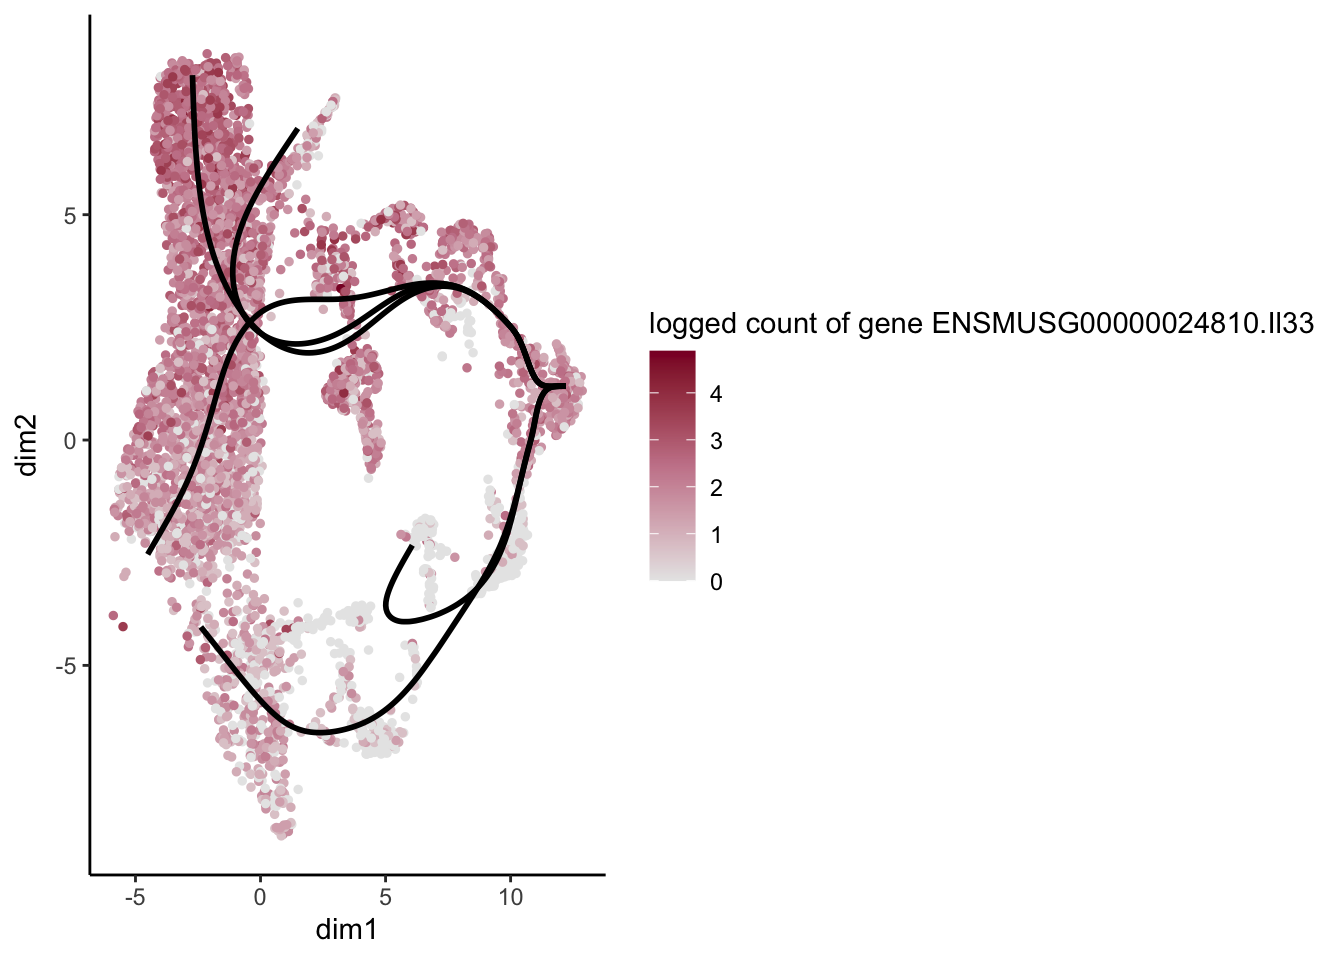
[[13]]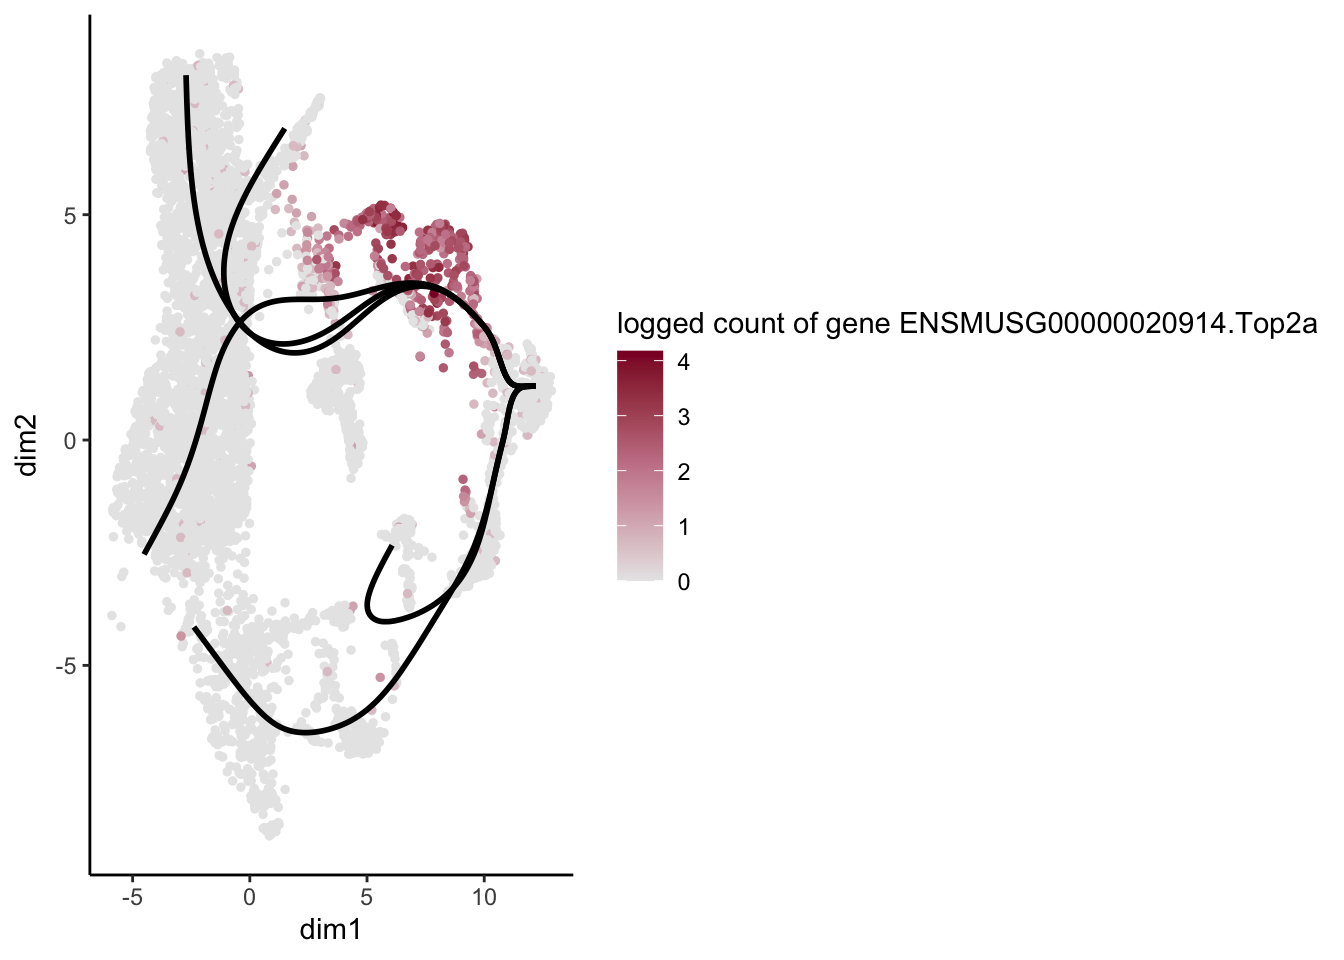
[[14]]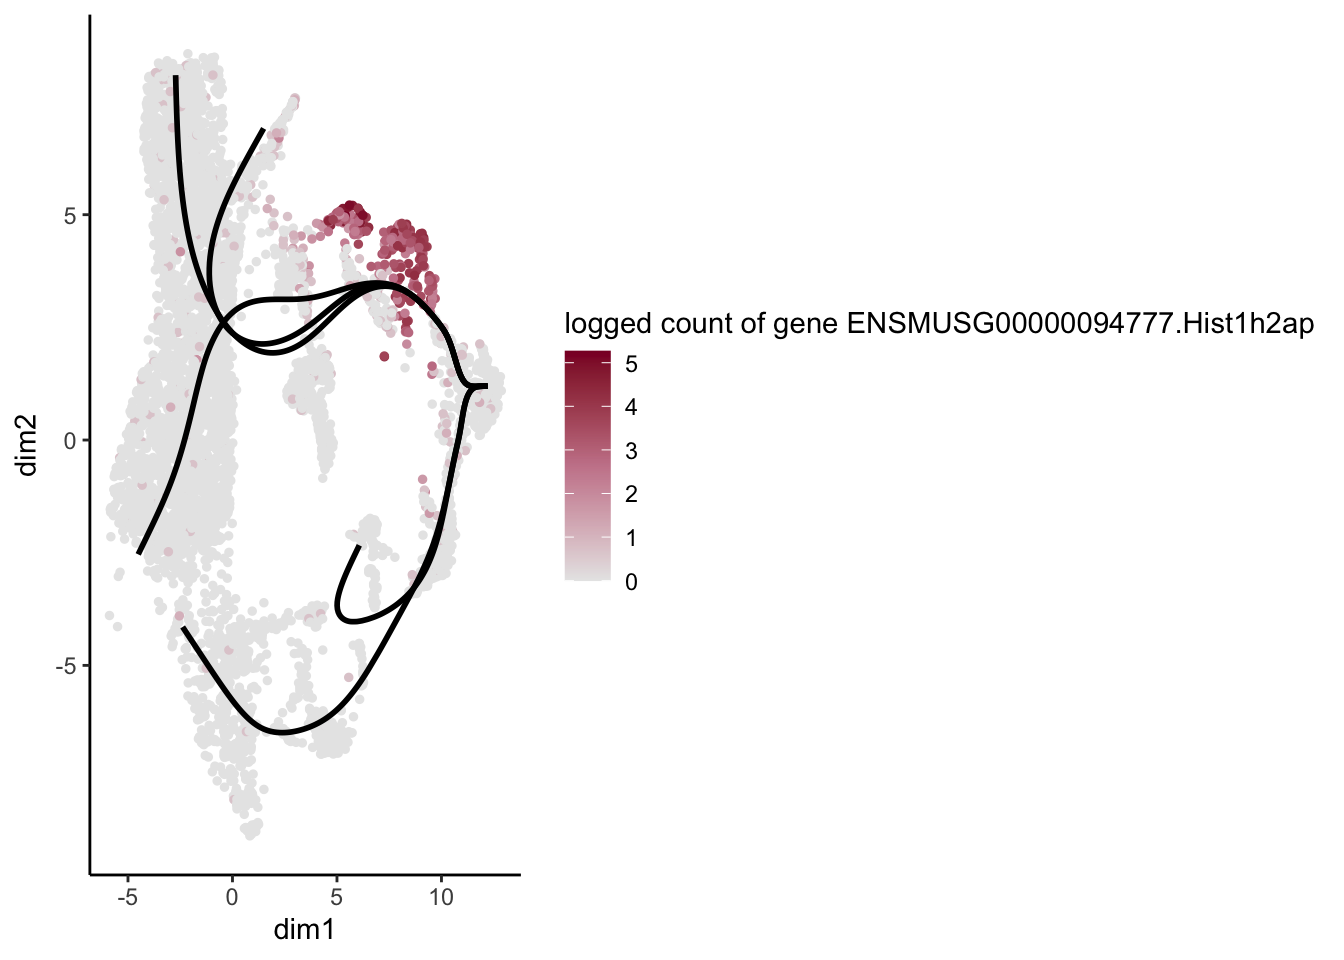
[[15]]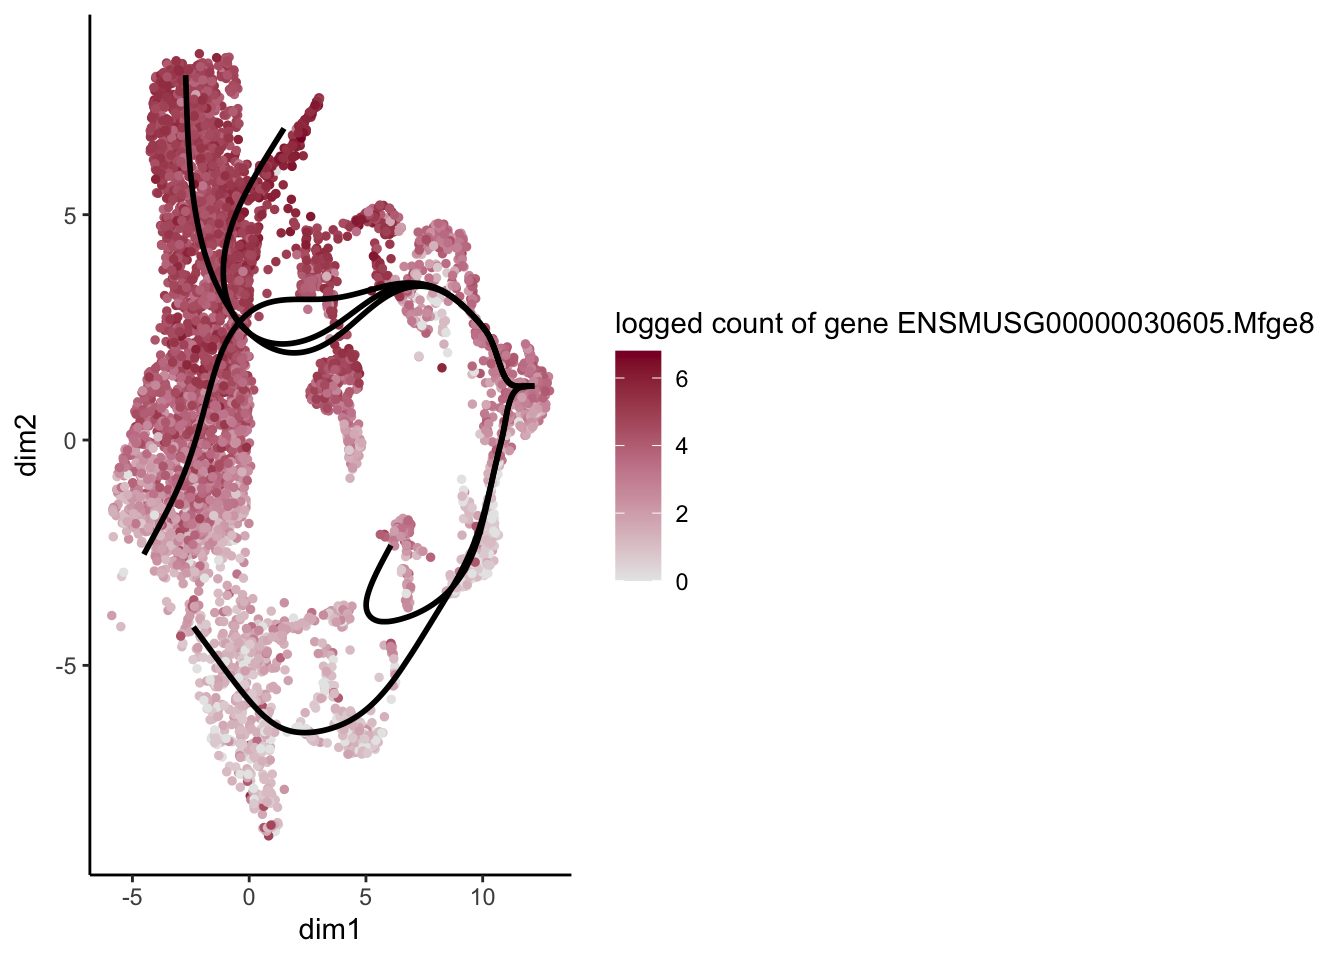
[[16]]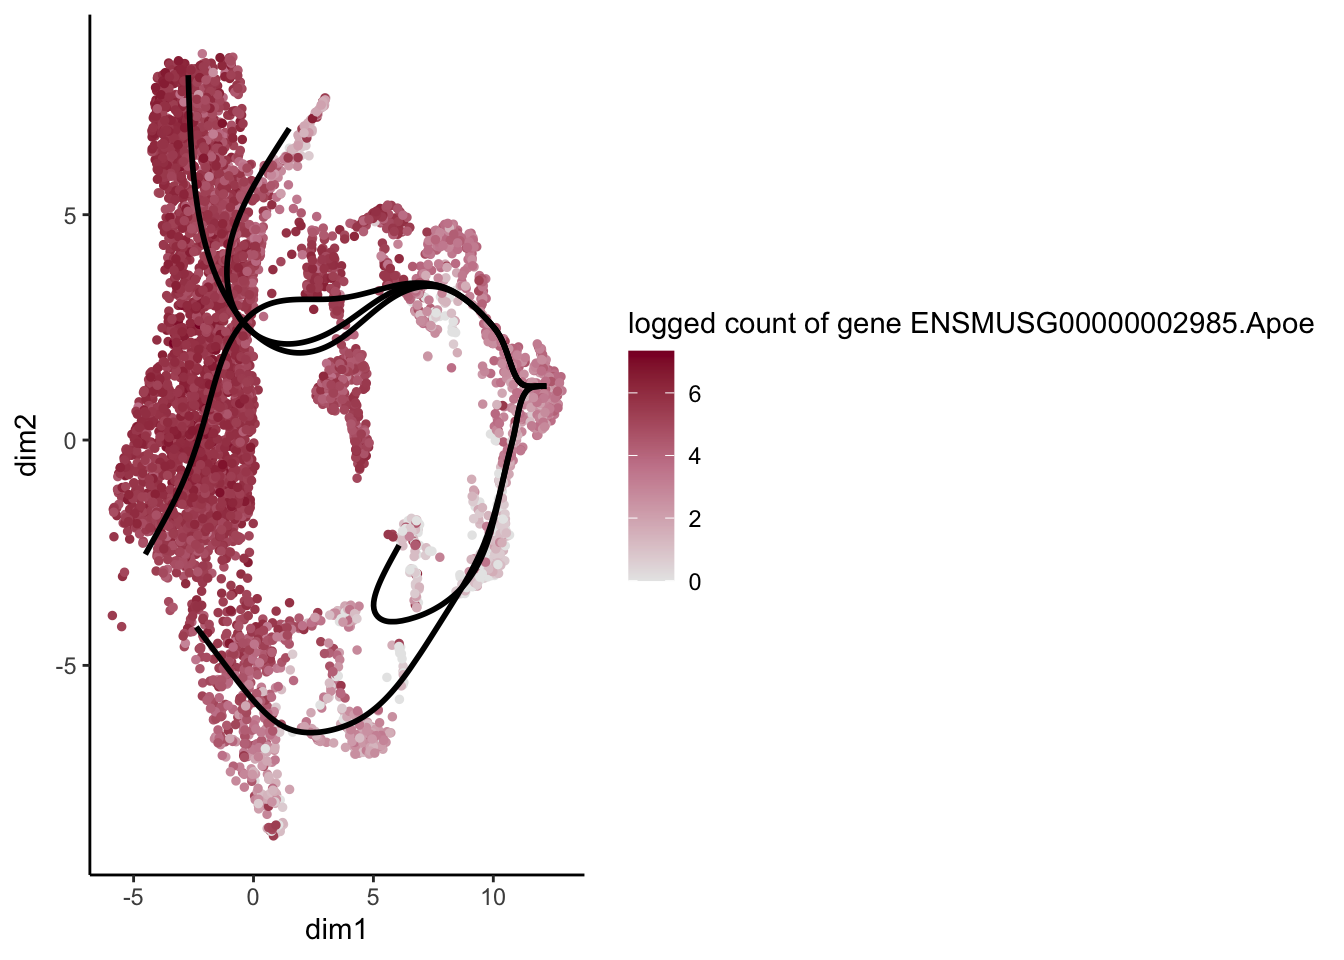
[[17]]
[[18]]
[[19]]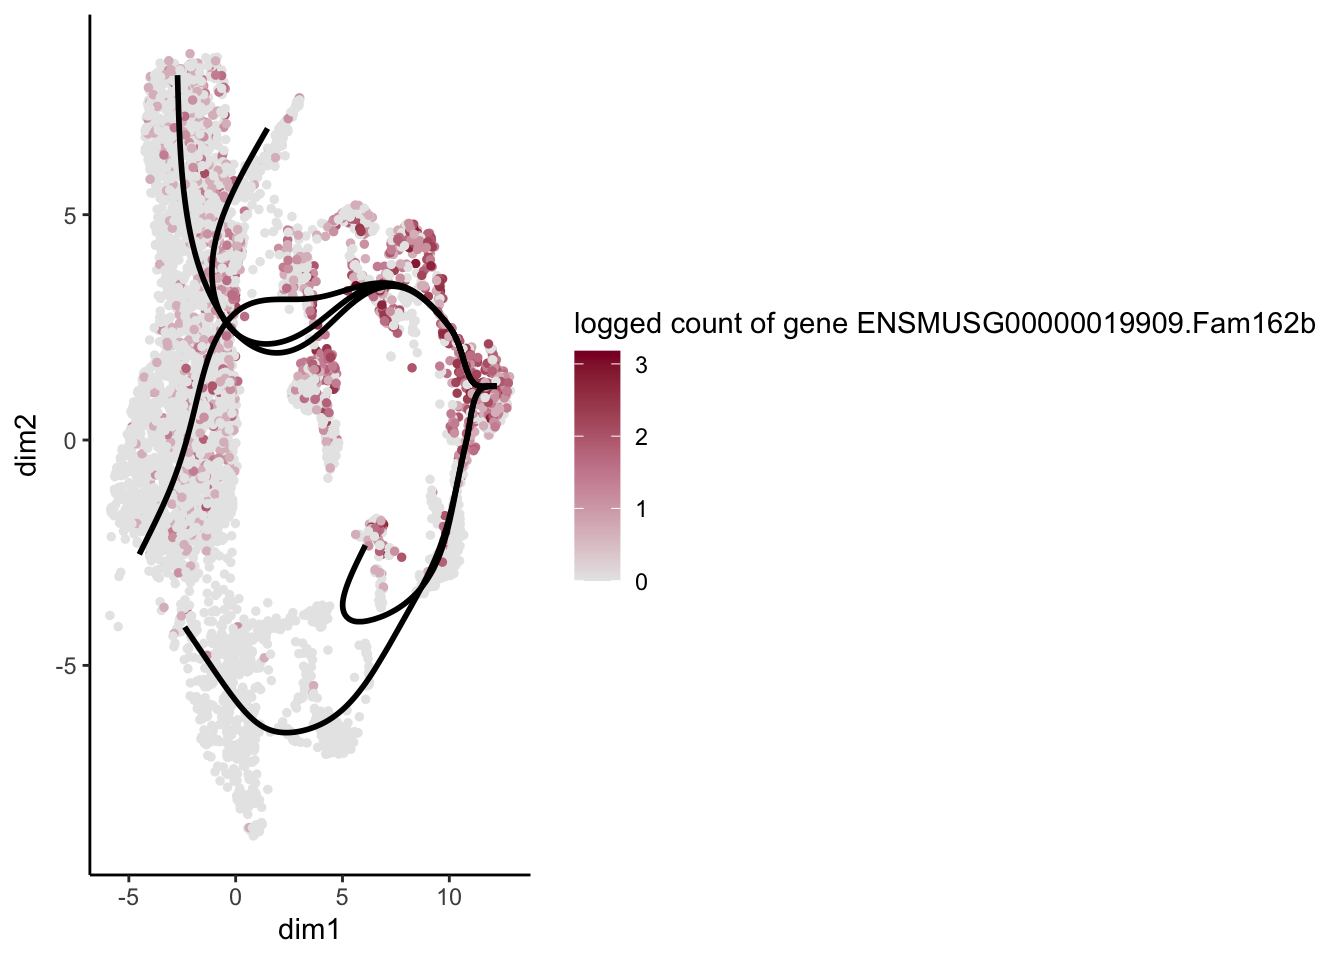
[[20]]
[[21]]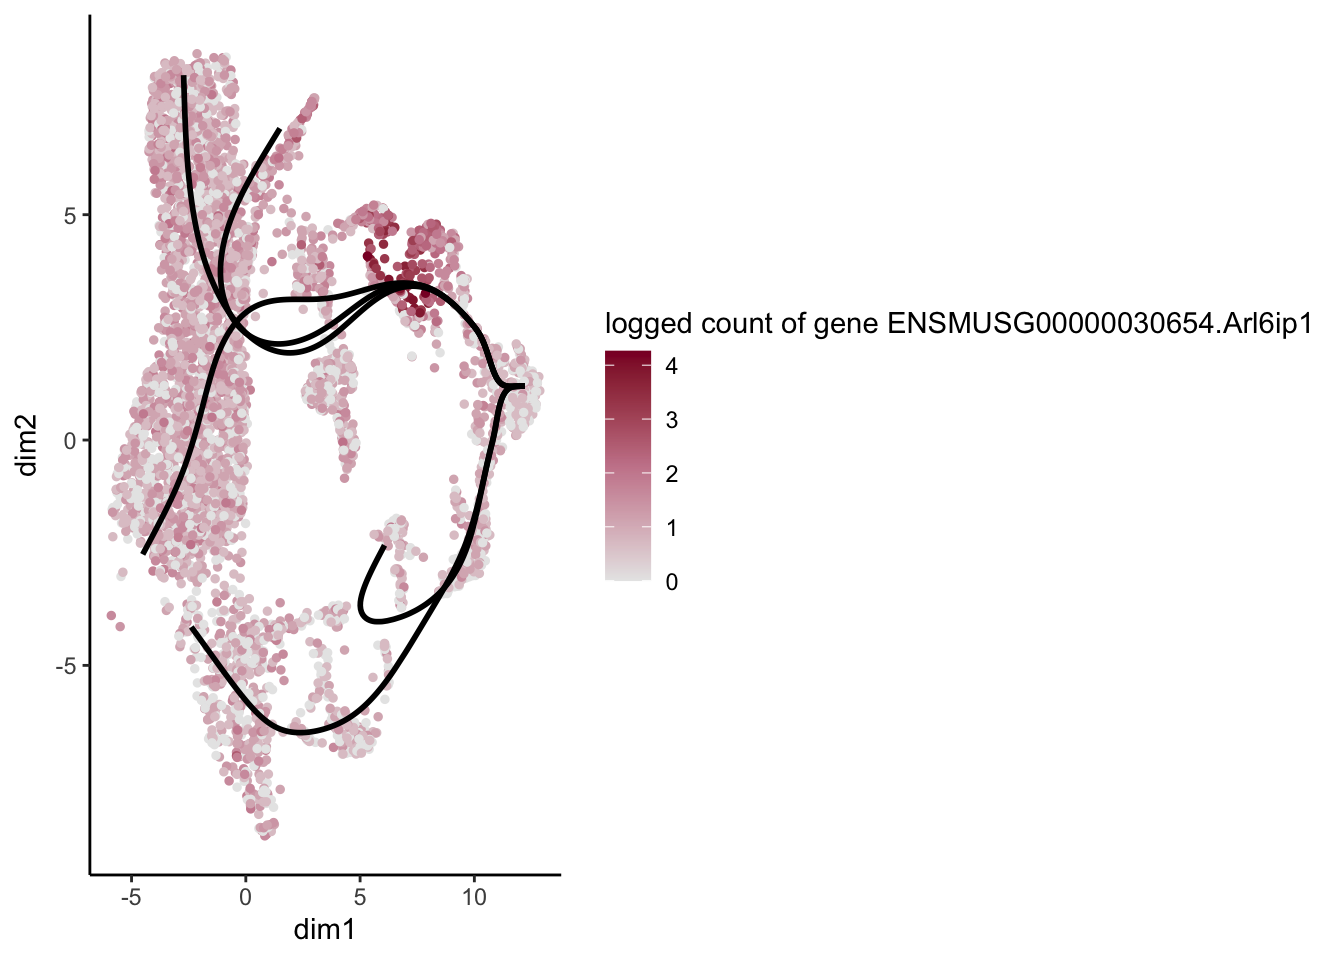
[[22]]
[[23]]
[[24]]
[[25]]
[[26]]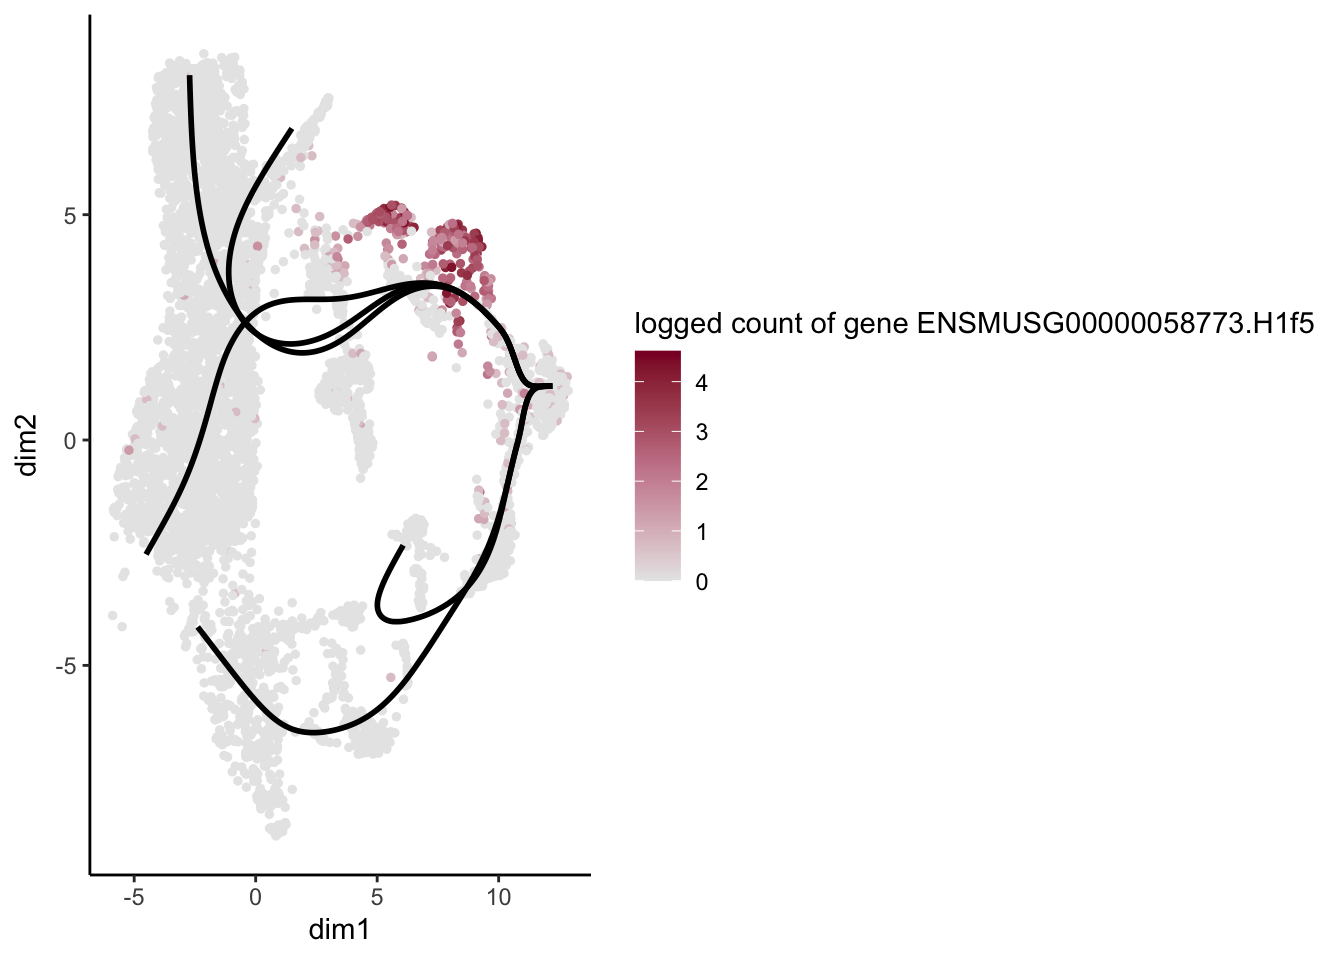
[[27]]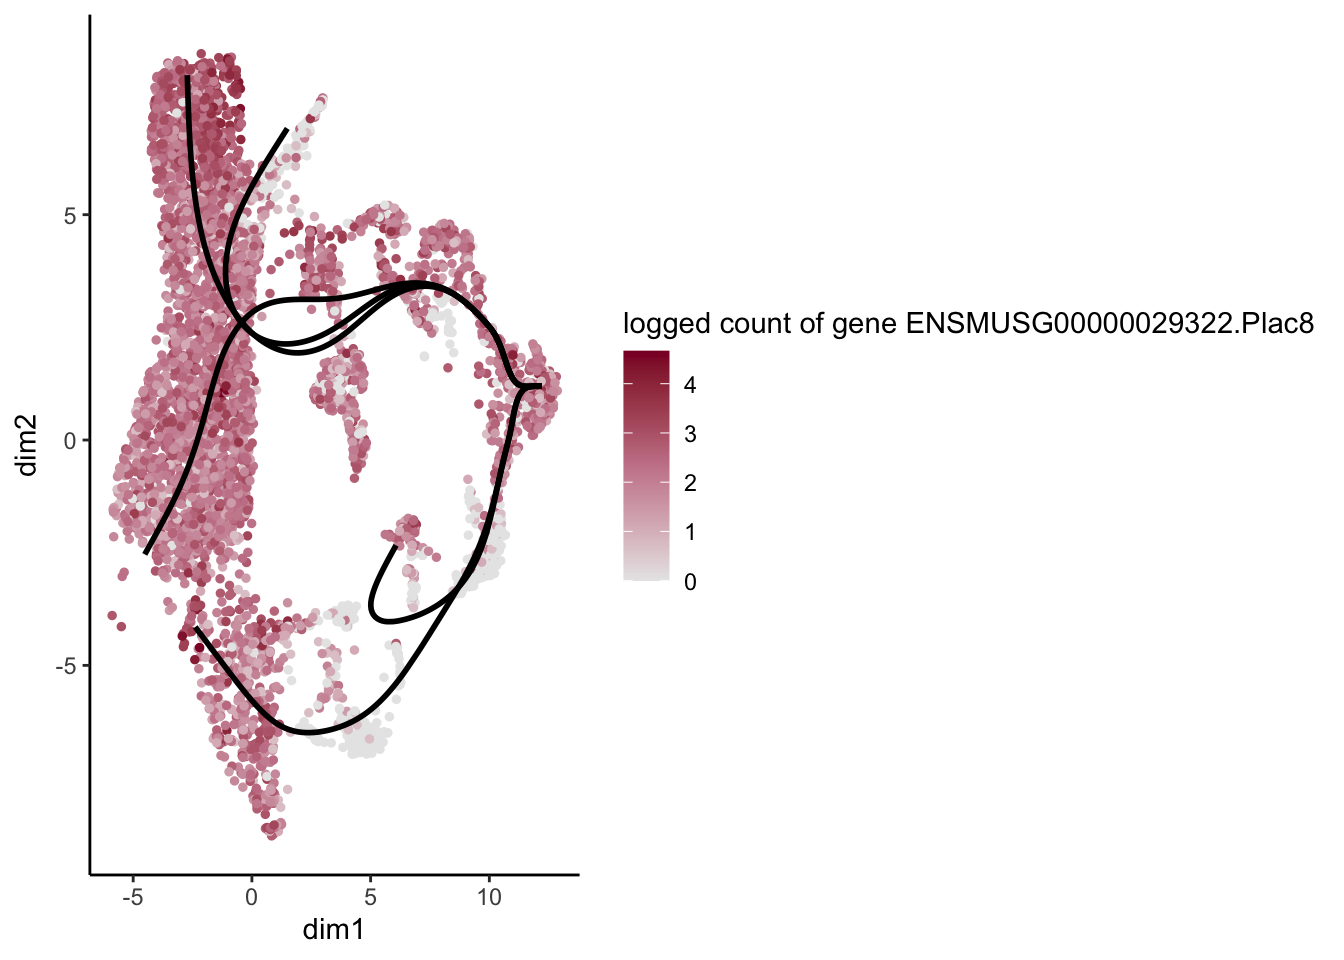
[[28]]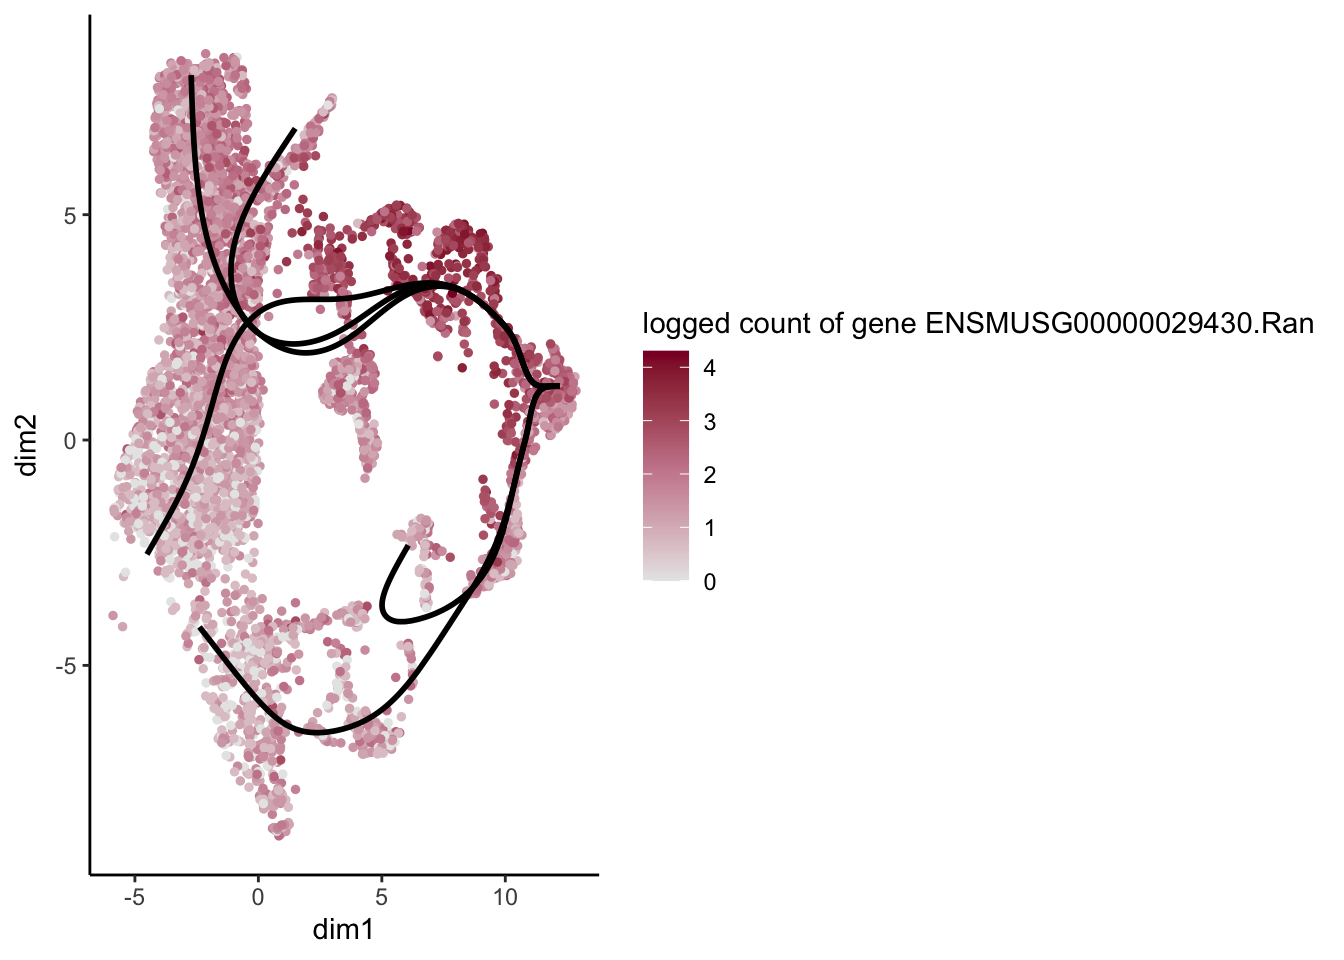
[[29]]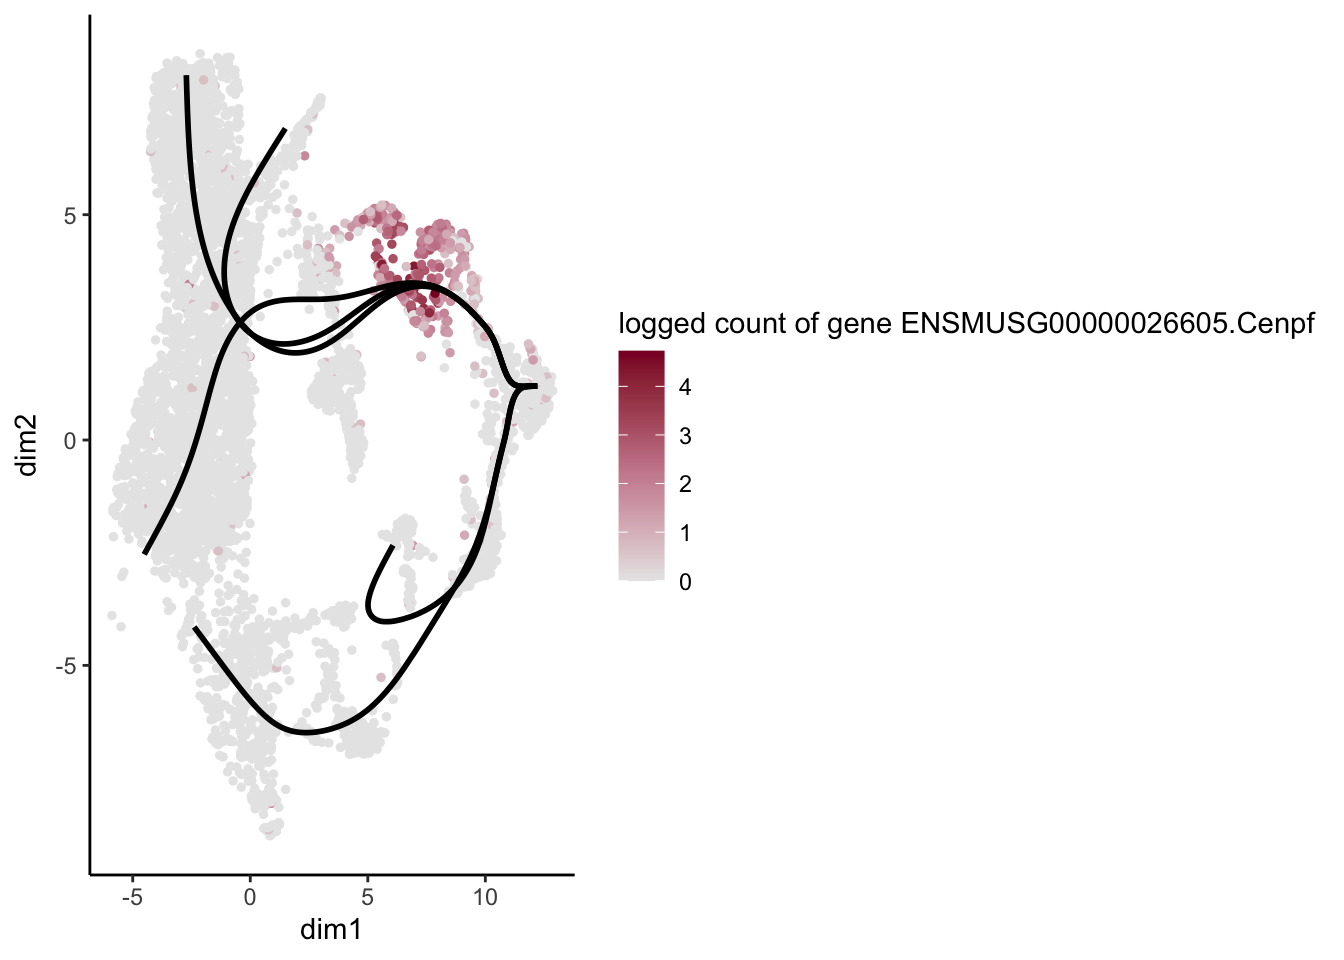
[[30]]
[[31]]
[[32]]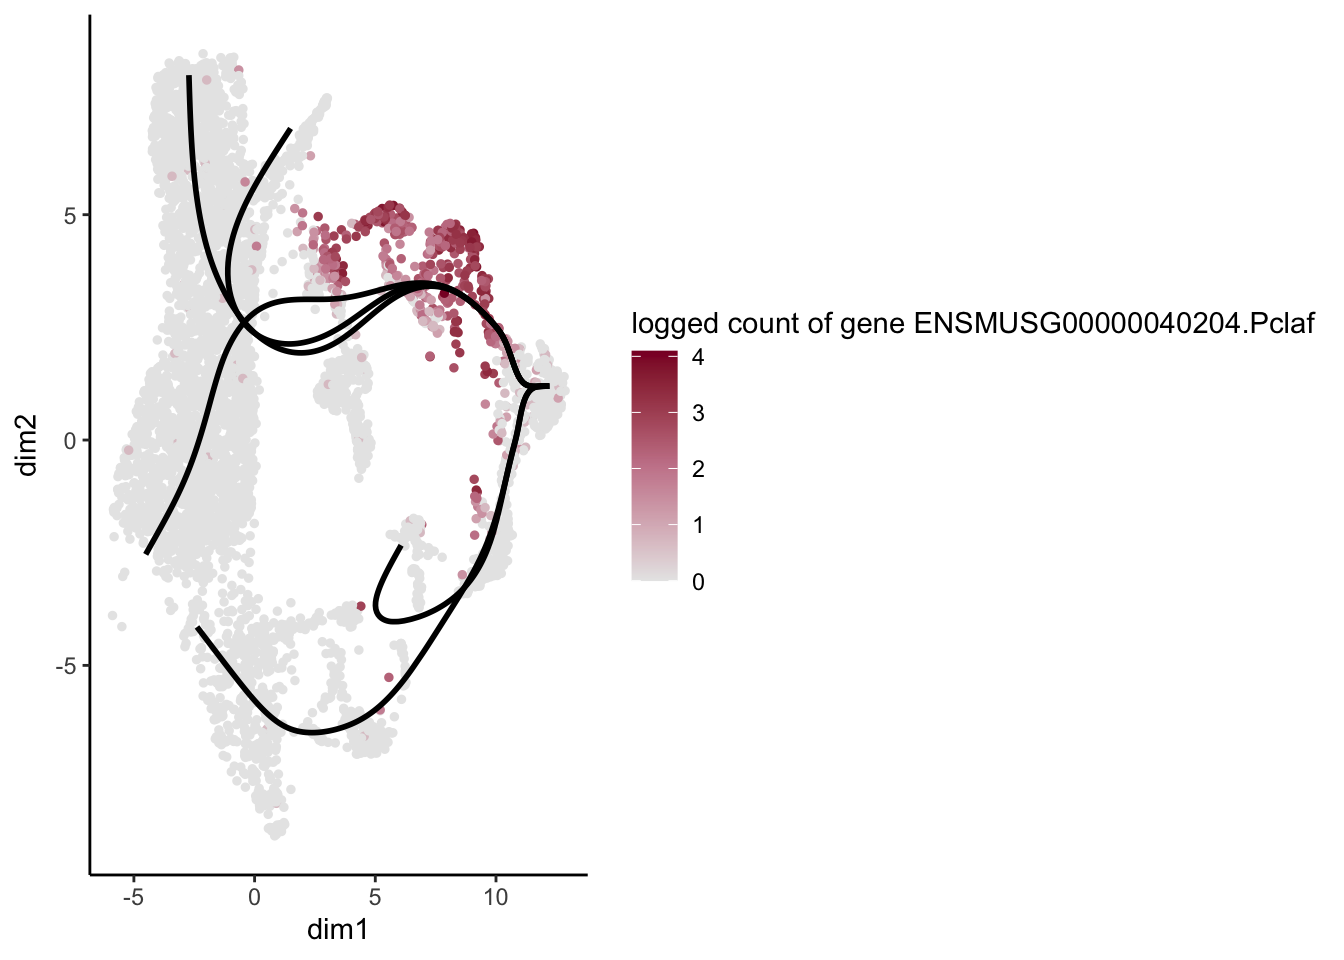
[[33]]
[[34]]
[[35]]
[[36]]
[[37]]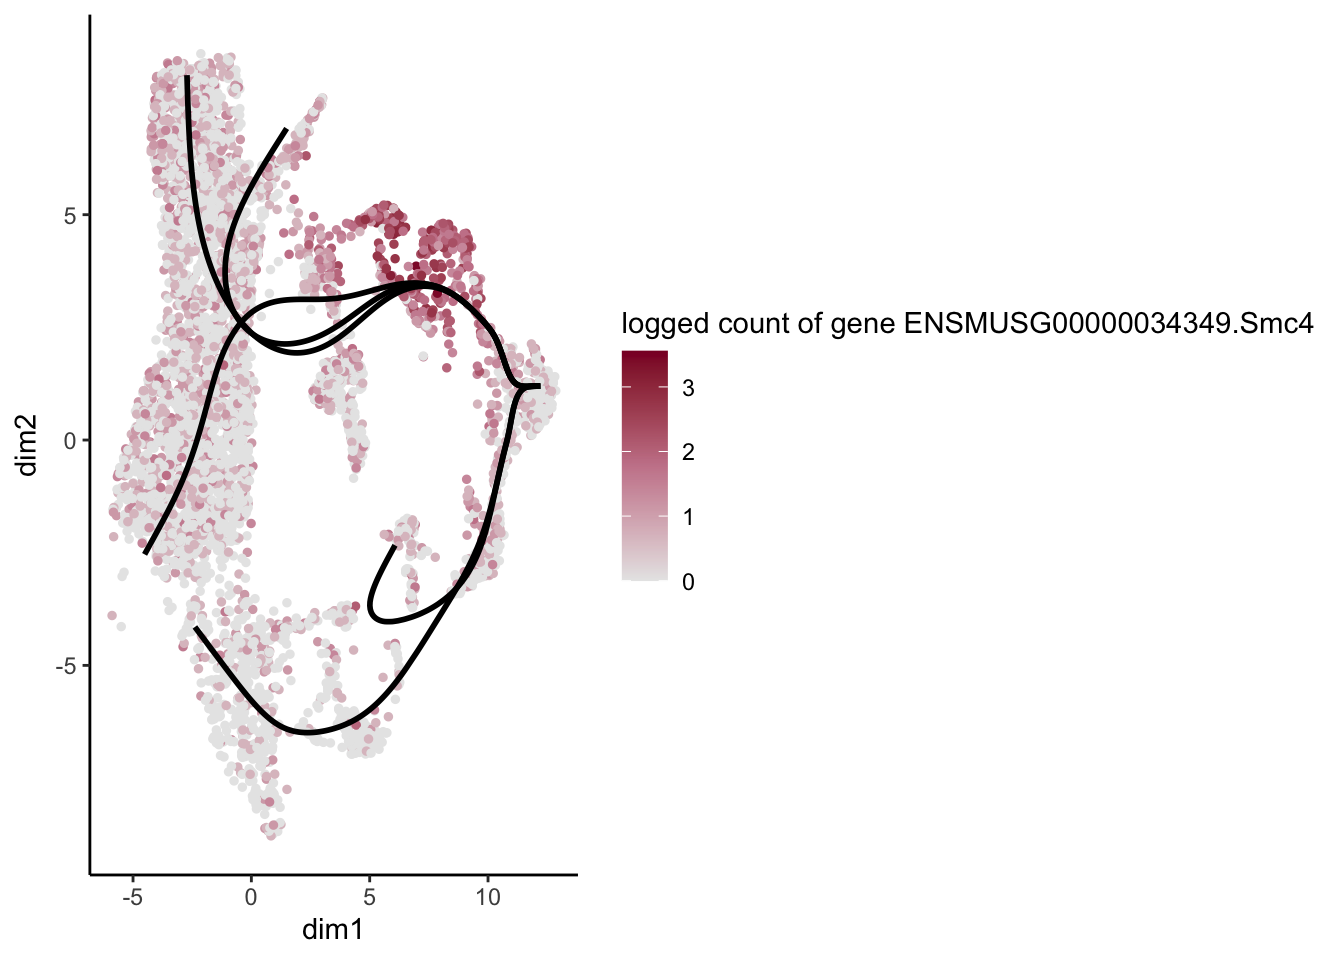
[[38]]
[[39]]
[[40]]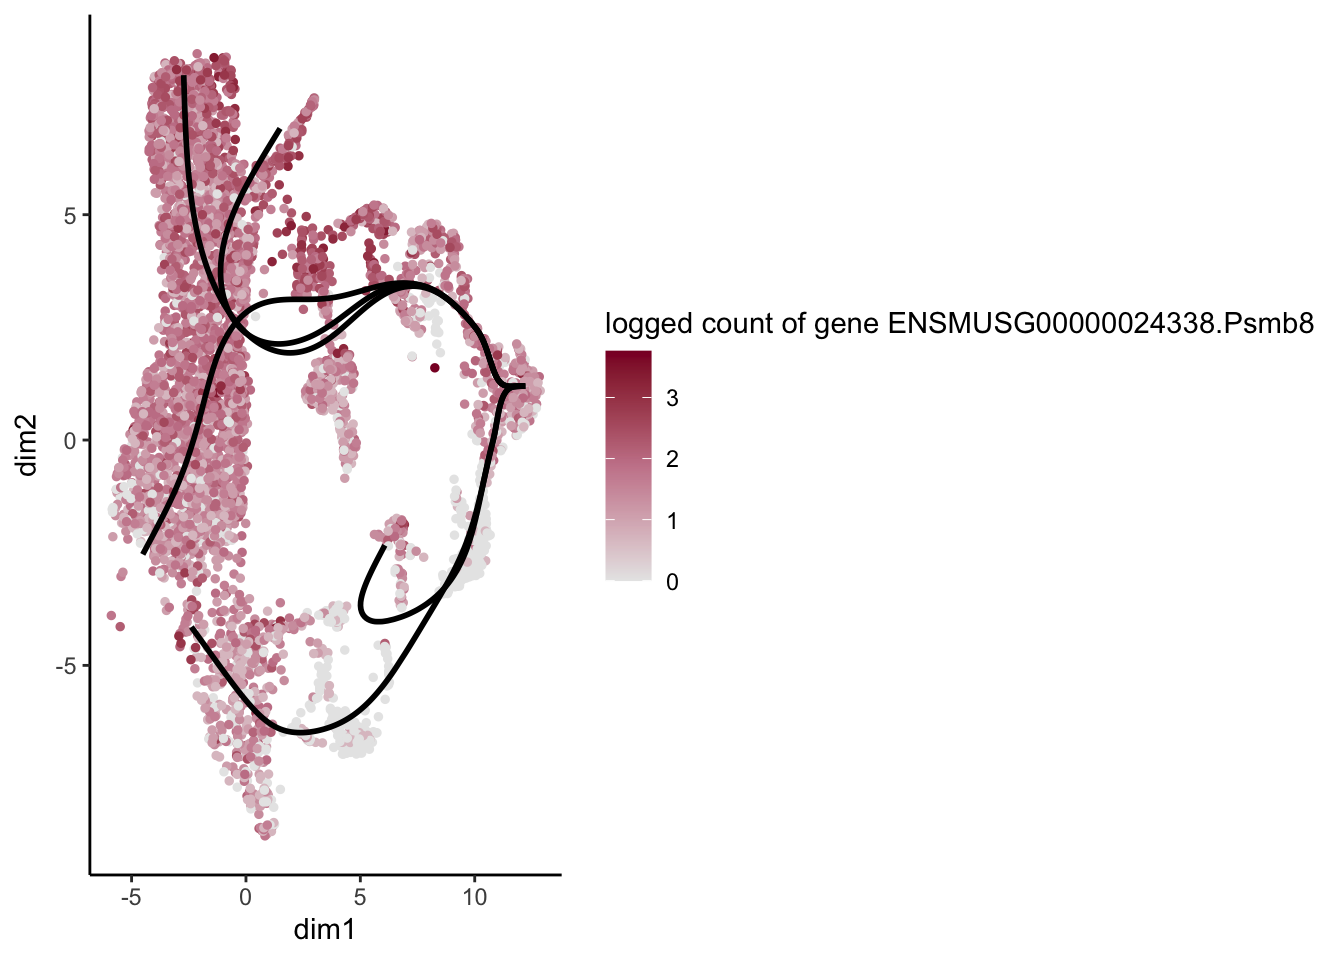
[[41]]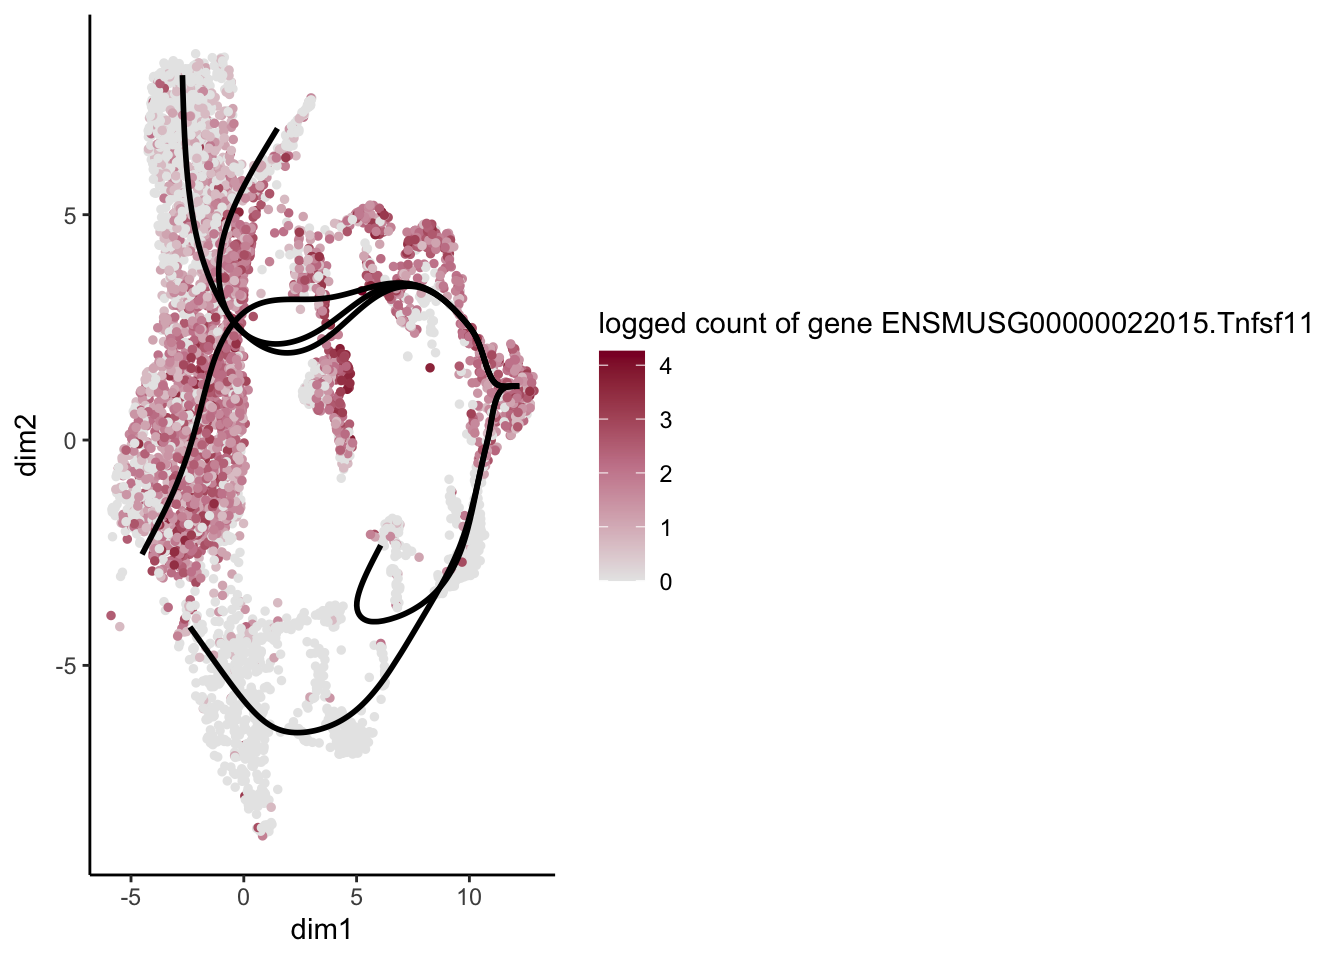
[[42]]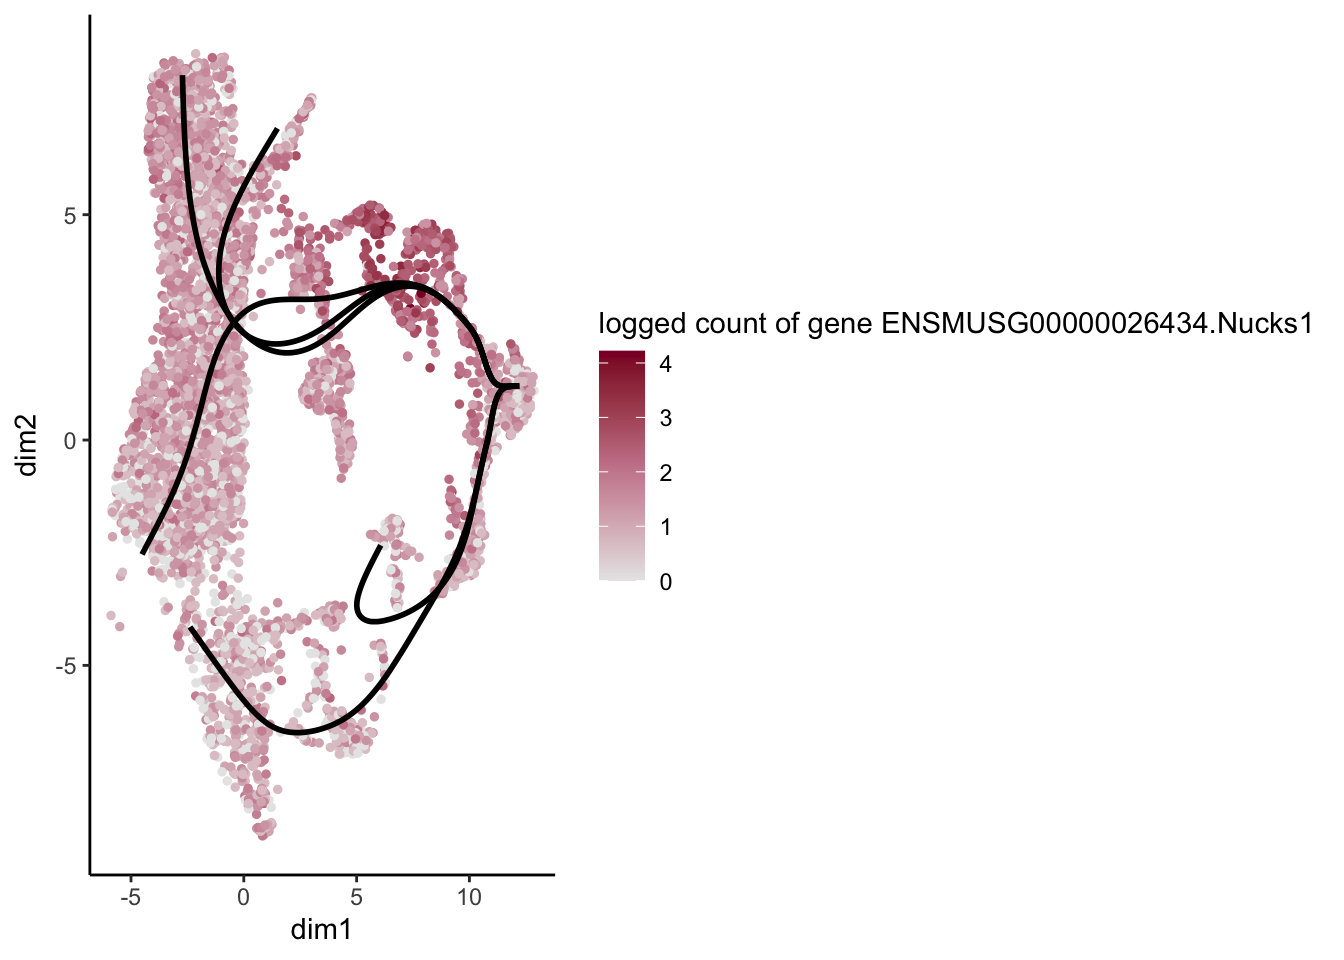
[[43]]
[[44]]
[[45]]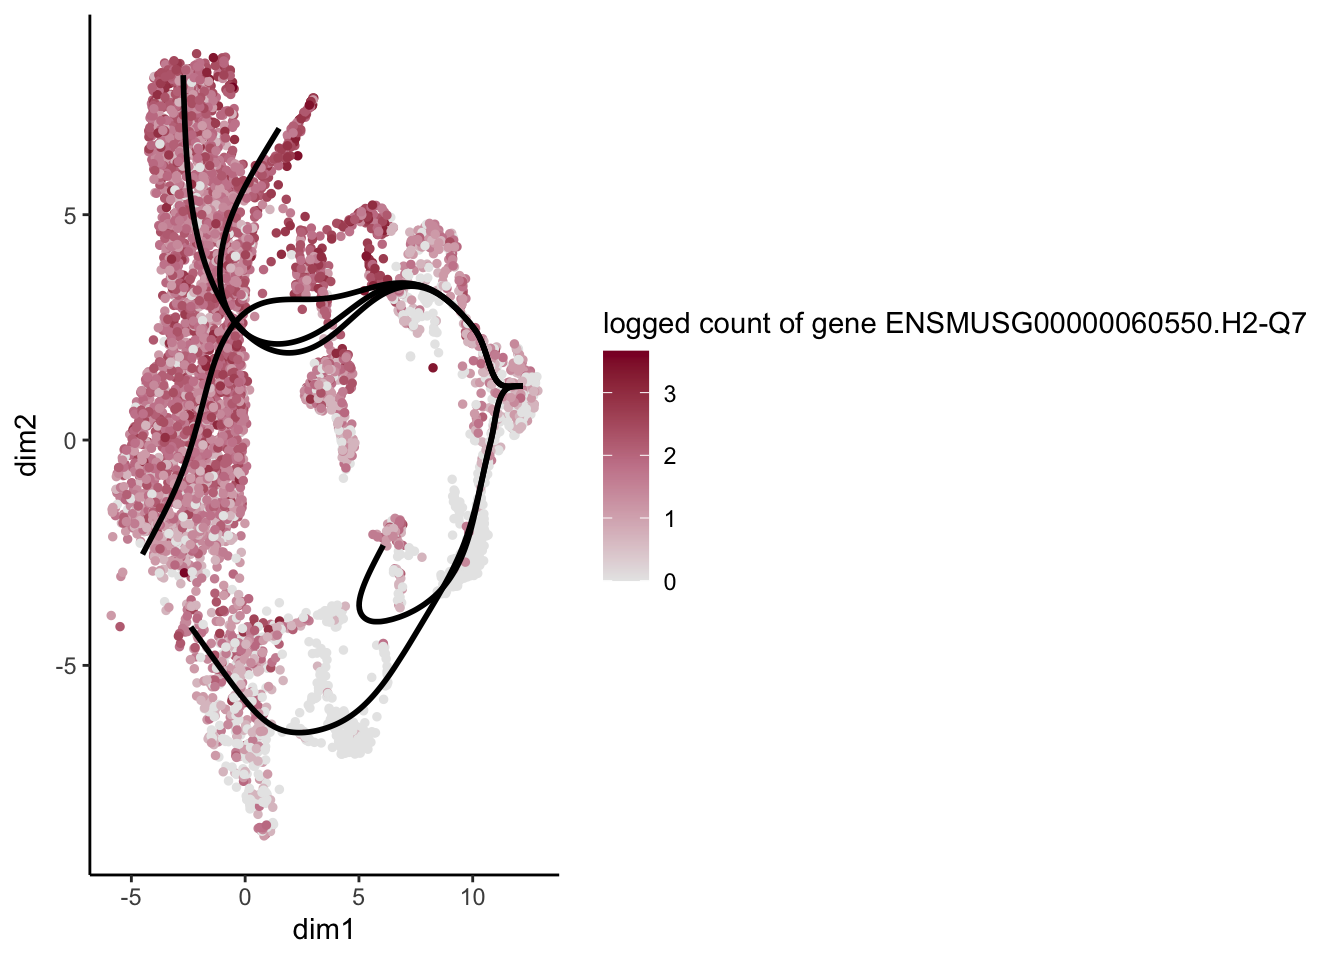
[[46]]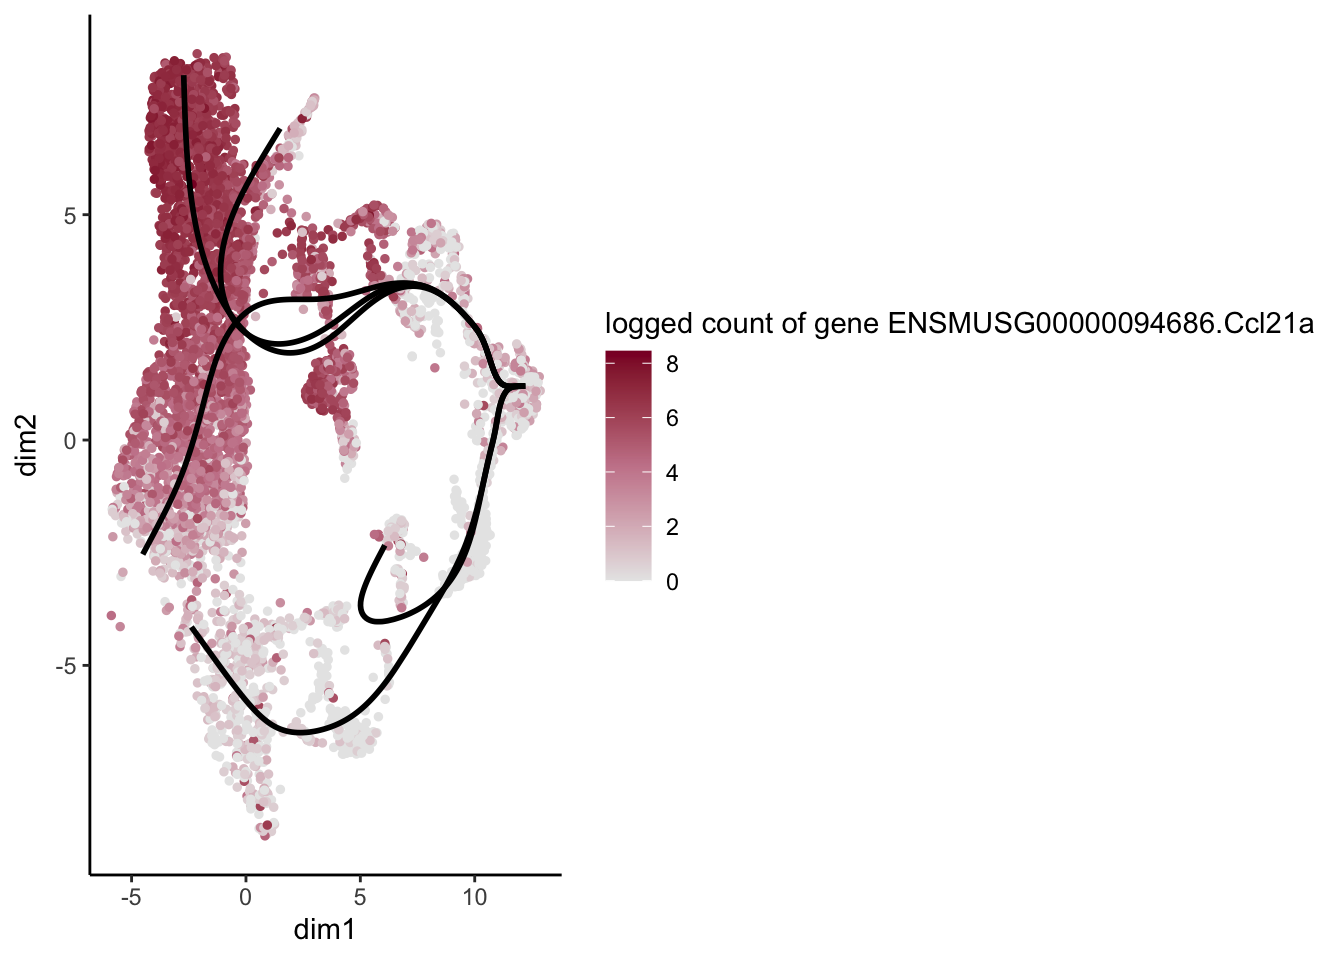
[[47]]
[[48]]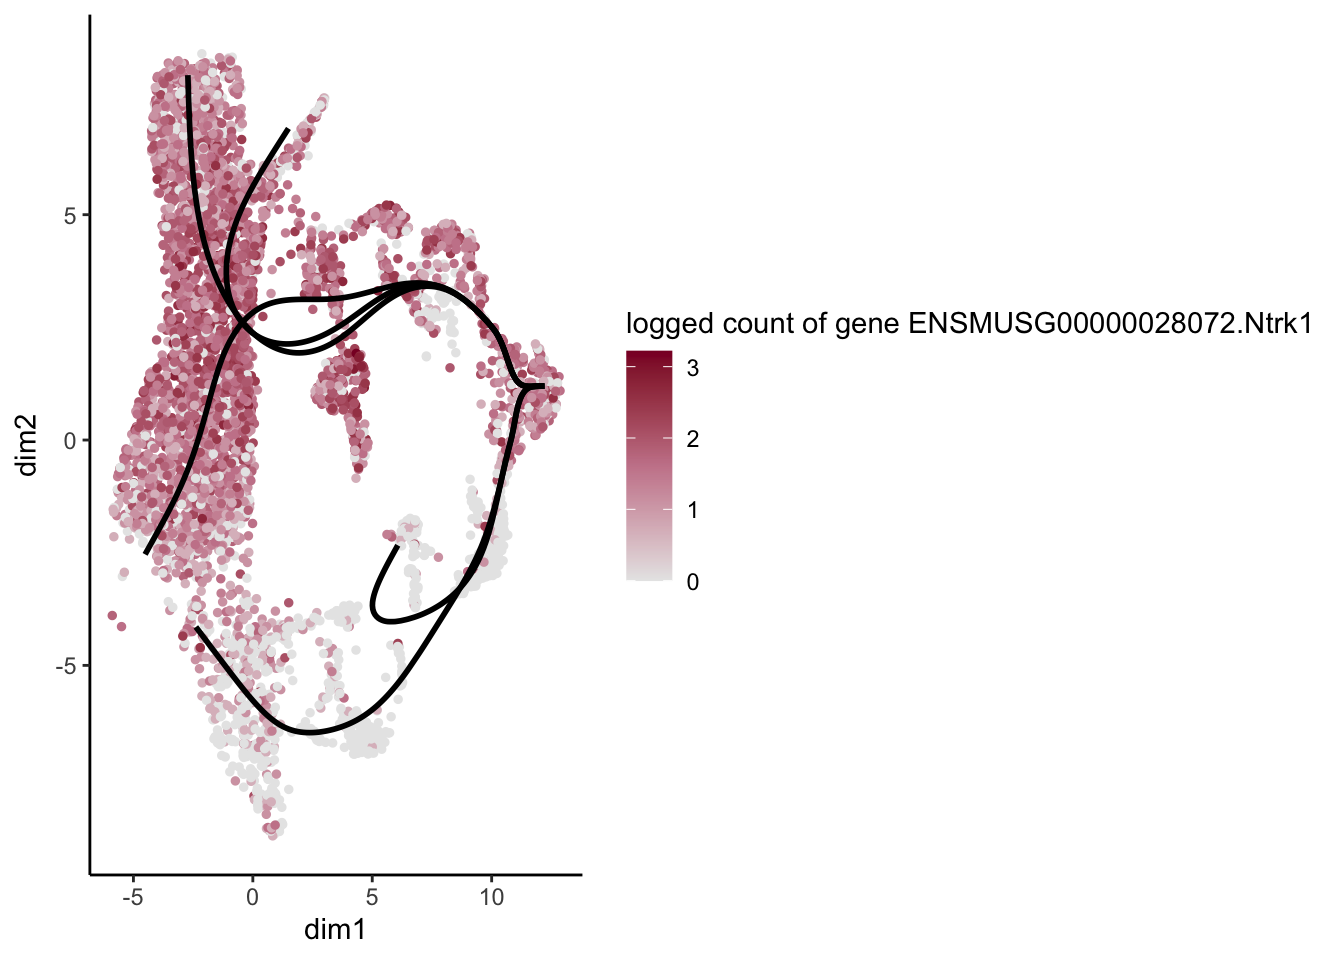
[[49]]
[[50]]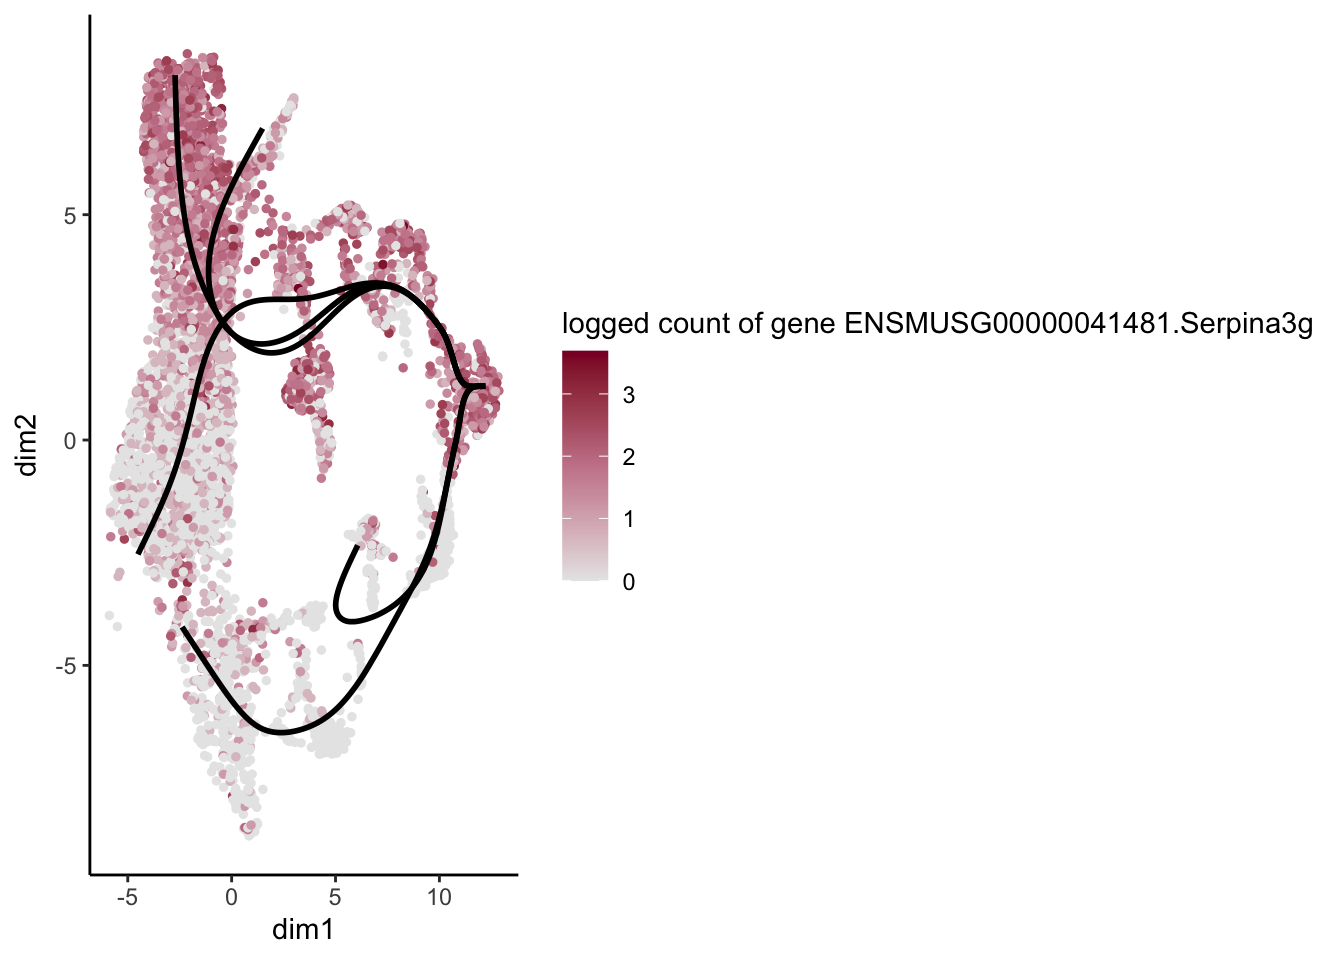
session info
sessionInfo()R version 4.3.0 (2023-04-21)
Platform: x86_64-apple-darwin20 (64-bit)
Running under: macOS Ventura 13.4.1
Matrix products: default
BLAS: /Library/Frameworks/R.framework/Versions/4.3-x86_64/Resources/lib/libRblas.0.dylib
LAPACK: /Library/Frameworks/R.framework/Versions/4.3-x86_64/Resources/lib/libRlapack.dylib; LAPACK version 3.11.0
locale:
[1] en_US.UTF-8/en_US.UTF-8/en_US.UTF-8/C/en_US.UTF-8/en_US.UTF-8
time zone: Europe/Berlin
tzcode source: internal
attached base packages:
[1] stats4 stats graphics grDevices utils datasets methods
[8] base
other attached packages:
[1] Matrix_1.6-5 clusterExperiment_2.20.0
[3] slingshot_2.8.0 TrajectoryUtils_1.8.0
[5] princurve_2.1.6 tradeSeq_1.14.0
[7] viridis_0.6.5 viridisLite_0.4.2
[9] ggsci_3.0.1 scran_1.28.2
[11] scater_1.28.0 scuttle_1.10.3
[13] pheatmap_1.0.12 RColorBrewer_1.1-3
[15] SingleCellExperiment_1.22.0 SummarizedExperiment_1.30.2
[17] Biobase_2.60.0 GenomicRanges_1.52.1
[19] GenomeInfoDb_1.36.4 IRanges_2.36.0
[21] S4Vectors_0.40.1 BiocGenerics_0.48.0
[23] MatrixGenerics_1.12.3 matrixStats_1.2.0
[25] runSeurat3_0.1.0 here_1.0.1
[27] magrittr_2.0.3 Seurat_5.0.2
[29] SeuratObject_5.0.1 sp_2.1-3
[31] lubridate_1.9.3 forcats_1.0.0
[33] stringr_1.5.1 dplyr_1.1.4
[35] purrr_1.0.2 readr_2.1.5
[37] tidyr_1.3.1 tibble_3.2.1
[39] ggplot2_3.5.0 tidyverse_2.0.0
loaded via a namespace (and not attached):
[1] spatstat.sparse_3.0-3 bitops_1.0-7
[3] httr_1.4.7 doParallel_1.0.17
[5] zinbwave_1.22.0 tools_4.3.0
[7] sctransform_0.4.1 utf8_1.2.4
[9] R6_2.5.1 HDF5Array_1.28.1
[11] lazyeval_0.2.2 uwot_0.1.16
[13] mgcv_1.9-1 rhdf5filters_1.12.1
[15] withr_3.0.0 prettyunits_1.2.0
[17] gridExtra_2.3 progressr_0.14.0
[19] cli_3.6.2 spatstat.explore_3.2-6
[21] fastDummies_1.7.3 labeling_0.4.3
[23] spatstat.data_3.0-4 genefilter_1.82.1
[25] ggridges_0.5.6 pbapply_1.7-2
[27] parallelly_1.37.1 limma_3.56.2
[29] RSQLite_2.3.5 howmany_0.3-1
[31] rstudioapi_0.15.0 generics_0.1.3
[33] ica_1.0-3 spatstat.random_3.2-3
[35] ggbeeswarm_0.7.2 fansi_1.0.6
[37] abind_1.4-5 lifecycle_1.0.4
[39] yaml_2.3.8 edgeR_3.42.4
[41] rhdf5_2.44.0 Rtsne_0.17
[43] blob_1.2.4 grid_4.3.0
[45] promises_1.2.1 dqrng_0.3.2
[47] crayon_1.5.2 miniUI_0.1.1.1
[49] lattice_0.22-5 beachmat_2.16.0
[51] cowplot_1.1.3 annotate_1.78.0
[53] KEGGREST_1.40.1 pillar_1.9.0
[55] knitr_1.45 metapod_1.8.0
[57] future.apply_1.11.1 codetools_0.2-19
[59] leiden_0.4.3.1 glue_1.7.0
[61] RNeXML_2.4.11 data.table_1.15.2
[63] vctrs_0.6.5 png_0.1-8
[65] spam_2.10-0 locfdr_1.1-8
[67] gtable_0.3.4 kernlab_0.9-32
[69] cachem_1.0.8 xfun_0.42
[71] S4Arrays_1.0.6 mime_0.12
[73] phylobase_0.8.12 survival_3.5-8
[75] iterators_1.0.14 statmod_1.5.0
[77] bluster_1.10.0 ellipsis_0.3.2
[79] fitdistrplus_1.1-11 ROCR_1.0-11
[81] nlme_3.1-164 bit64_4.0.5
[83] progress_1.2.3 RcppAnnoy_0.0.22
[85] rprojroot_2.0.4 irlba_2.3.5.1
[87] vipor_0.4.7 KernSmooth_2.23-22
[89] DBI_1.2.2 colorspace_2.1-0
[91] ade4_1.7-22 tidyselect_1.2.0
[93] bit_4.0.5 compiler_4.3.0
[95] BiocNeighbors_1.18.0 xml2_1.3.6
[97] DelayedArray_0.26.7 plotly_4.10.4
[99] scales_1.3.0 lmtest_0.9-40
[101] NMF_0.27 digest_0.6.34
[103] goftest_1.2-3 spatstat.utils_3.0-4
[105] rmarkdown_2.26 XVector_0.40.0
[107] htmltools_0.5.7 pkgconfig_2.0.3
[109] sparseMatrixStats_1.12.2 fastmap_1.1.1
[111] rlang_1.1.3 htmlwidgets_1.6.4
[113] shiny_1.8.0 DelayedMatrixStats_1.22.6
[115] farver_2.1.1 zoo_1.8-12
[117] jsonlite_1.8.8 BiocParallel_1.34.2
[119] BiocSingular_1.16.0 RCurl_1.98-1.14
[121] GenomeInfoDbData_1.2.10 dotCall64_1.1-1
[123] patchwork_1.2.0 Rhdf5lib_1.22.1
[125] munsell_0.5.0 Rcpp_1.0.12
[127] ape_5.7-1 reticulate_1.35.0
[129] stringi_1.8.3 zlibbioc_1.46.0
[131] MASS_7.3-60.0.1 plyr_1.8.9
[133] parallel_4.3.0 listenv_0.9.1
[135] ggrepel_0.9.5 deldir_2.0-4
[137] rncl_0.8.7 Biostrings_2.68.1
[139] splines_4.3.0 tensor_1.5
[141] hms_1.1.3 locfit_1.5-9.9
[143] igraph_2.0.2 uuid_1.2-0
[145] spatstat.geom_3.2-9 softImpute_1.4-1
[147] rngtools_1.5.2 RcppHNSW_0.6.0
[149] reshape2_1.4.4 ScaledMatrix_1.8.1
[151] XML_3.99-0.16.1 evaluate_0.23
[153] tzdb_0.4.0 foreach_1.5.2
[155] httpuv_1.6.14 RANN_2.6.1
[157] polyclip_1.10-6 future_1.33.1
[159] scattermore_1.2 gridBase_0.4-7
[161] rsvd_1.0.5 xtable_1.8-4
[163] RSpectra_0.16-1 later_1.3.2
[165] memoise_2.0.1 AnnotationDbi_1.62.2
[167] beeswarm_0.4.0 registry_0.5-1
[169] cluster_2.1.6 timechange_0.3.0
[171] globals_0.16.2 date()[1] "Wed Apr 24 09:23:03 2024"