suppressPackageStartupMessages({
  library(tidyverse)
  library(Seurat)
  library(magrittr)
  library(dplyr)
  library(purrr)
  library(ggplot2)
  library(here)
#  library(runSeurat3)
  library(SingleCellExperiment)
  library(RColorBrewer)
  library(pheatmap)
  library(scater)
  library(scran)
  library(ggsci)
  library(CellMixS)
})DE genes mLN WT versus Ltbr floxed
load packages
heatmap function
avgHeatmap <- function(seurat, selGenes, colVecIdent, colVecCond=NULL,
                       ordVec=NULL, gapVecR=NULL, gapVecC=NULL,cc=FALSE,
                       cr=FALSE, condCol=FALSE){

  selGenes <- selGenes$gene

  ## assay data
  clusterAssigned <- as.data.frame(Idents(seurat)) %>%
  dplyr::mutate(cell=rownames(.))
  colnames(clusterAssigned)[1] <- "ident"
  seuratDat <- GetAssayData(seurat)

  ## genes of interest
  genes <- data.frame(gene=rownames(seurat)) %>%
    mutate(geneID=gsub("^.*\\.", "", gene)) %>% filter(geneID %in% selGenes)

  ## matrix with averaged cnts per ident
  logNormExpres <- as.data.frame(t(as.matrix(
    seuratDat[which(rownames(seuratDat) %in% genes$gene),])))
  logNormExpres <- logNormExpres %>% dplyr::mutate(cell=rownames(.)) %>%
    dplyr::left_join(.,clusterAssigned, by=c("cell")) %>%
    dplyr::select(-cell) %>% dplyr::group_by(ident) %>%
    dplyr::summarise_all(mean)
  logNormExpresMa <- logNormExpres %>% dplyr::select(-ident) %>% as.matrix()
  rownames(logNormExpresMa) <- logNormExpres$ident
  logNormExpresMa <- t(logNormExpresMa)
  rownames(logNormExpresMa) <- gsub("^.*?\\.","",rownames(logNormExpresMa))

  ## remove genes if they are all the same in all groups
  ind <- apply(logNormExpresMa, 1, sd) == 0
  logNormExpresMa <- logNormExpresMa[!ind,]
  genes <- genes[!ind,]

  ## color columns according to cluster
  annotation_col <- as.data.frame(gsub("(^.*?_)","",
                                       colnames(logNormExpresMa)))%>%
    dplyr::mutate(celltype=gsub("(_.*$)","",colnames(logNormExpresMa)))
  colnames(annotation_col)[1] <- "col1"
  annotation_col <- annotation_col %>%
    dplyr::mutate(cond = gsub(".*_","",col1)) %>%
    dplyr::select(cond, celltype)
  rownames(annotation_col) <- colnames(logNormExpresMa)

  ann_colors = list(
      cond = colVecCond,
      celltype=colVecIdent)
  if(is.null(ann_colors$cond)){
    annotation_col$cond <- NULL
  }

  ## adjust order
  logNormExpresMa <- logNormExpresMa[selGenes,]
  if(is.null(ordVec)){
    ordVec <- levels(seurat)
  }
  logNormExpresMa <- logNormExpresMa[,ordVec]

  ## scaled row-wise
  pheatmap(logNormExpresMa, scale="row" ,treeheight_row = 0, cluster_rows = cr,
         cluster_cols = cc,
         color = colorRampPalette(c("#2166AC", "#F7F7F7", "#B2182B"))(50),
         annotation_col = annotation_col, cellwidth=15, cellheight=10,
         annotation_colors = ann_colors, gaps_row = gapVecR, gaps_col = gapVecC)
}
set dir and load sample
basedir <- here()
seurat <- readRDS(file = paste0(basedir,
                              "/data/WT_allTime_mLNonly_WtplusLtbr_EYFPonly_labelTrans",
                              "_seurat.rds"))
table(seurat$EYFP, seurat$age)
        3w   8w E17to7wk  E18   P7
pos 6241 7693 3035 2510 1764table(seurat$cond)
 LTbR    WT
 4366 16877
colCond <- c("#446a7f", "#cb7457")
names(colCond) <- c("LTbR", "WT")
colAge <- c("#440154FF", "#3B528BFF", "#21908CFF", "#5DC863FF", "#FDE725FF")
names(colAge) <- c("E18" , "P7", "3w", "8w","E17to7wk")
colPal <- c("#DAF7A6", "#FFC300", "#FF5733", "#C70039", "#900C3F", "#b66e8d",
"#61a4ba", "#6178ba", "#54a87f", "#25328a",
"#b6856e", "#0073C2FF", "#e3953d")
names(colPal) <- c("12", "10", "5", "6", "3", "11", "0", "8", "4", "2", "9", "7", "1" )
colPal2 <- c("#DAF7A6", "#FFC300", "#FF5733", "#C70039", "#900C3F", "#b66e8d",
"#61a4ba", "#6178ba", "#54a87f", "#25328a",
"#b6856e", "#0073C2FF", "#e3953d", "#cacaca")
names(colPal2) <- c("12", "10", "5", "6", "3", "11", "0", "8", "4", "2", "9", "7", "1",
"<8w")
colDat <- colDat <- c(pal_npg()(10),pal_futurama()(12), pal_aaas()(10),
pal_jama()(8))[1:length(unique(seurat$dataset))]
names(colDat) <- unique(seurat$dataset)
colLab <- c("#42a071", "#900C3F","#b66e8d", "#61a4ba", "#424671", "#003C67FF",
"#e3953d", "#714542", "#b6856e", "#a4a4a4")
names(colLab) <- c("FDC/MRC", "TRC", "TBRC", "MedRC/IFRC", "MedRC" , "actMedRC",
"PRC", "Pi16+RC", "VSMC", "unassigned")DimPlot all
clustering
DimPlot(seurat, reduction = "umap", group.by = "RNA_snn_res.0.4",
        cols = colPal)+
  theme_bw() +
  theme(axis.text = element_blank(), axis.ticks = element_blank(),
        panel.grid.minor = element_blank()) +
  xlab("UMAP1") +
  ylab("UMAP2")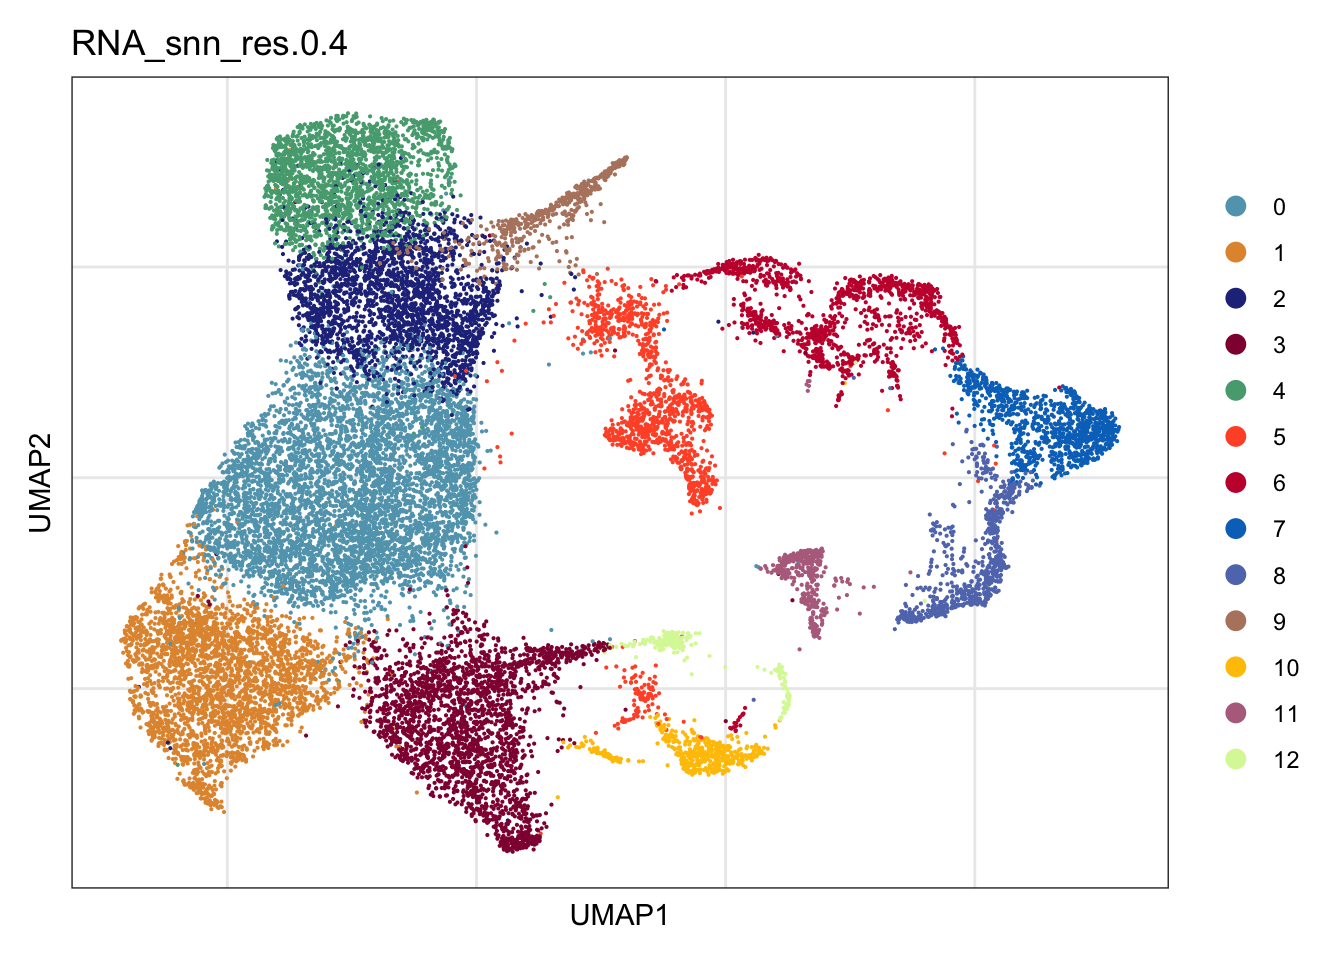
DimPlot(seurat, reduction = "umap", group.by = "RNA_snn_res.0.4", pt.size=1,
        cols = colPal)+
  theme_void()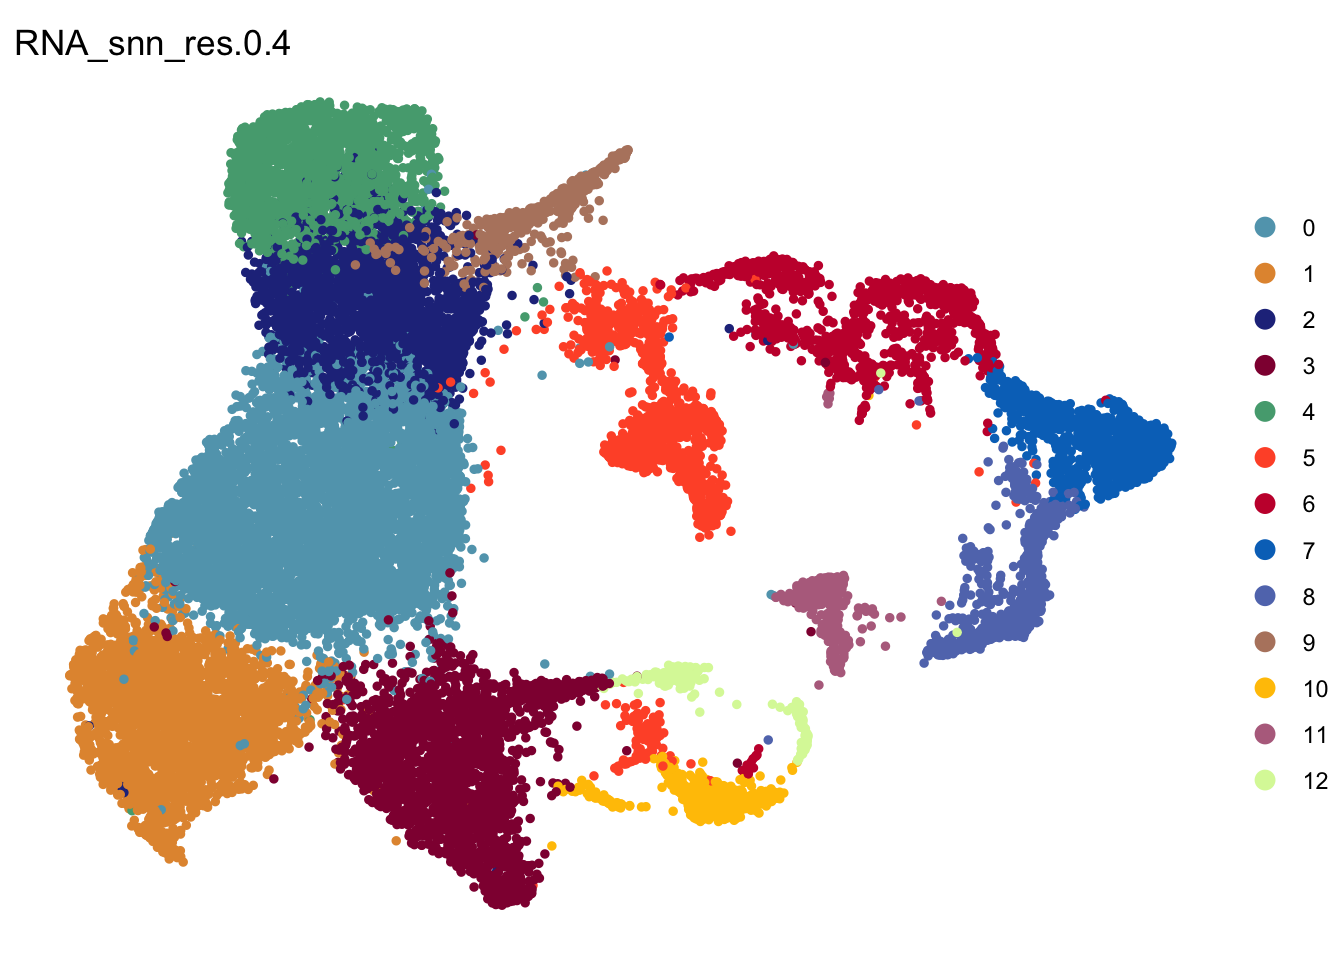
clustering split by cond
DimPlot(seurat, reduction = "umap", group.by = "RNA_snn_res.0.4", pt.size=1,
        cols = colPal, split.by = "cond")+
  theme_void()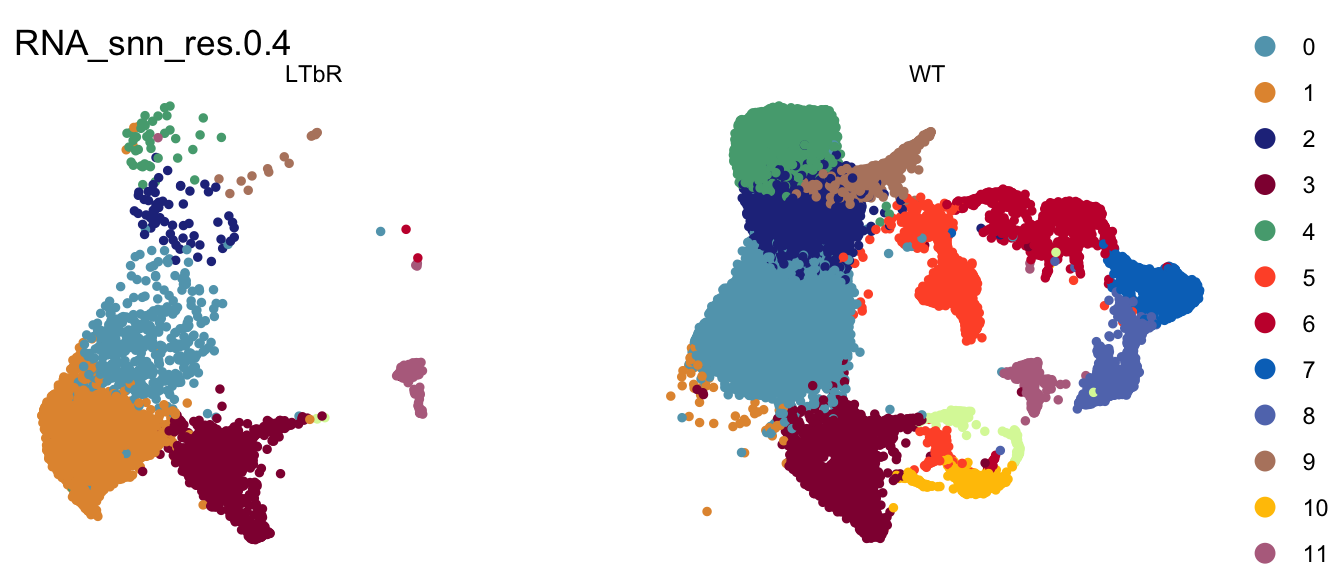
seurat$clusterAdult <- as.character(seurat$RNA_snn_res.0.4)
seurat$clusterAdult[which(seurat$age %in% c("P7", "E18", "3w"))] <- "<8w"

DimPlot(seurat, reduction = "umap", group.by = "clusterAdult", pt.size=1,
        cols = colPal2, split.by = "cond")+
  theme_void()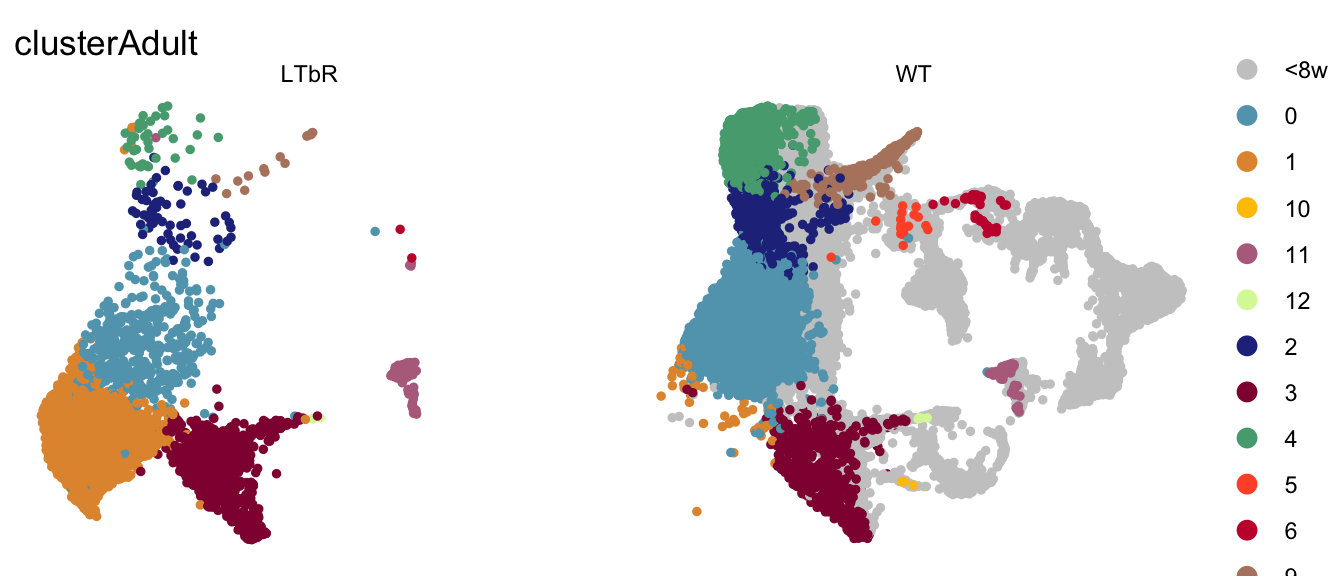
seuratSub <- subset(seurat, age %in% c("E17to7wk", "8w"))
DimPlot(seuratSub, reduction = "umap", group.by = "RNA_snn_res.0.4", pt.size=1,
        cols = colPal, split.by = "cond")+
  theme_void()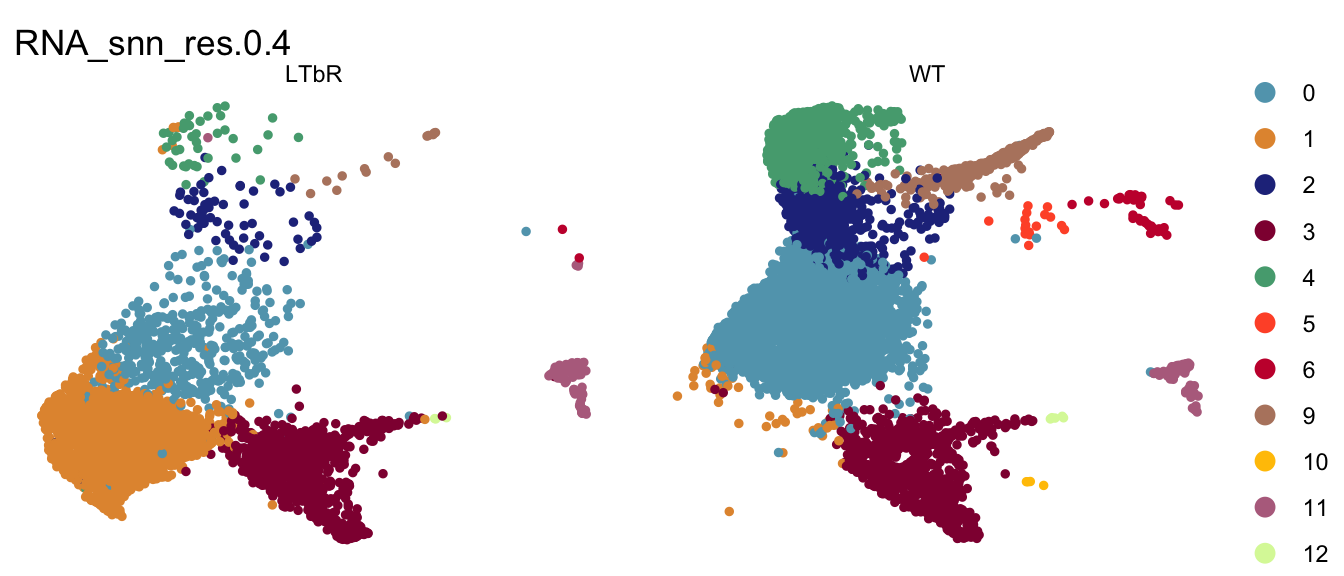
vis age
DimPlot(seurat, reduction = "umap", group.by = "age",
        cols = colAge)+
  theme_bw() +
  theme(axis.text = element_blank(), axis.ticks = element_blank(),
        panel.grid.minor = element_blank()) +
  xlab("UMAP1") +
  ylab("UMAP2")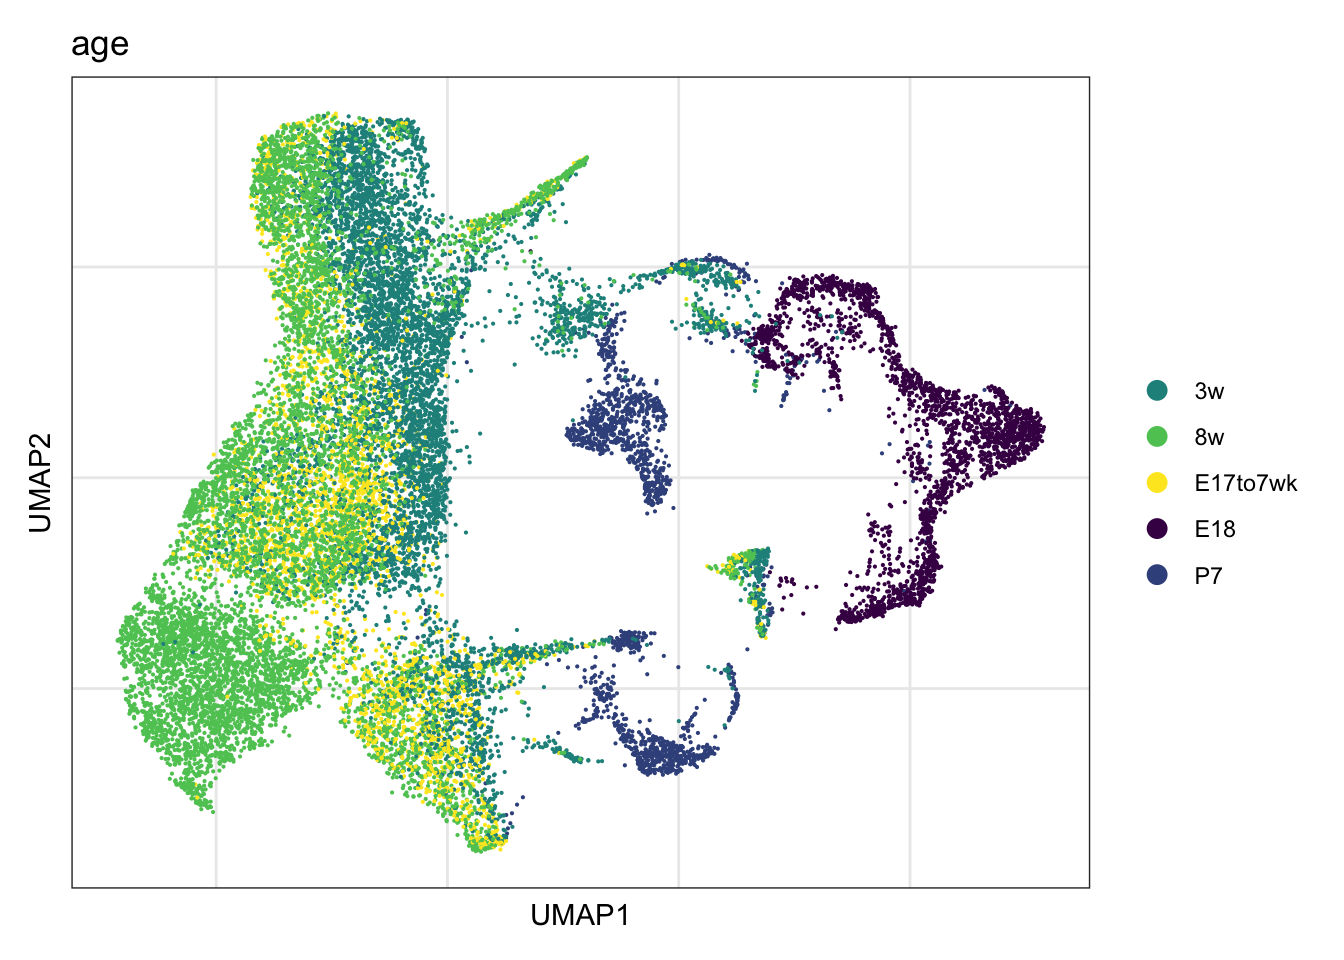
DimPlot(seurat, reduction = "umap", group.by = "age", pt.size=0.5,
        cols = colAge)+
  theme_void()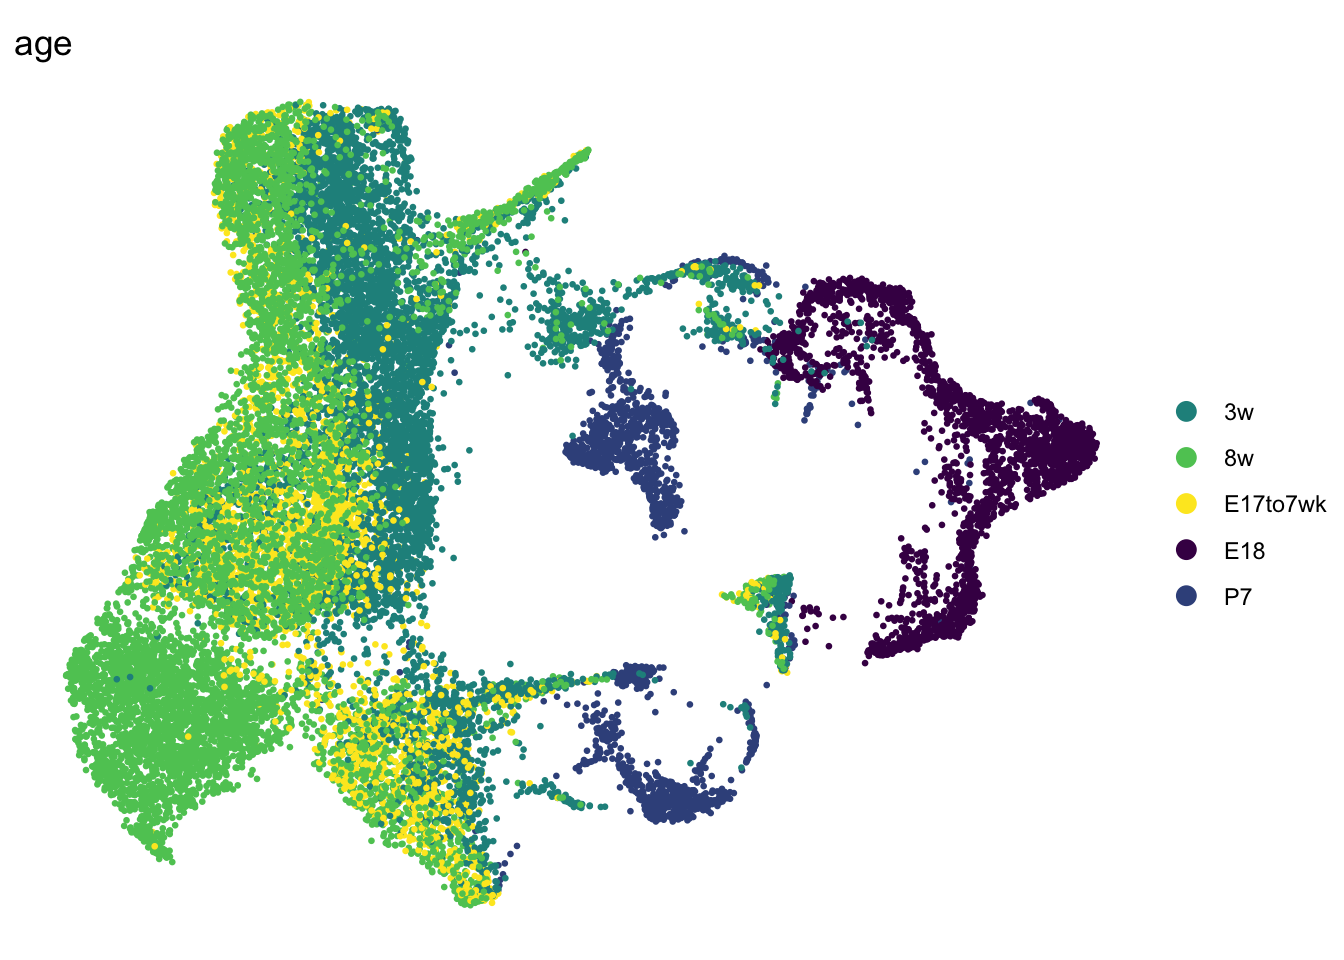
age split by cond
DimPlot(seurat, reduction = "umap", group.by = "age", pt.size=1,
        cols = colAge, split.by = "cond", shuffle = T)+
  theme_void()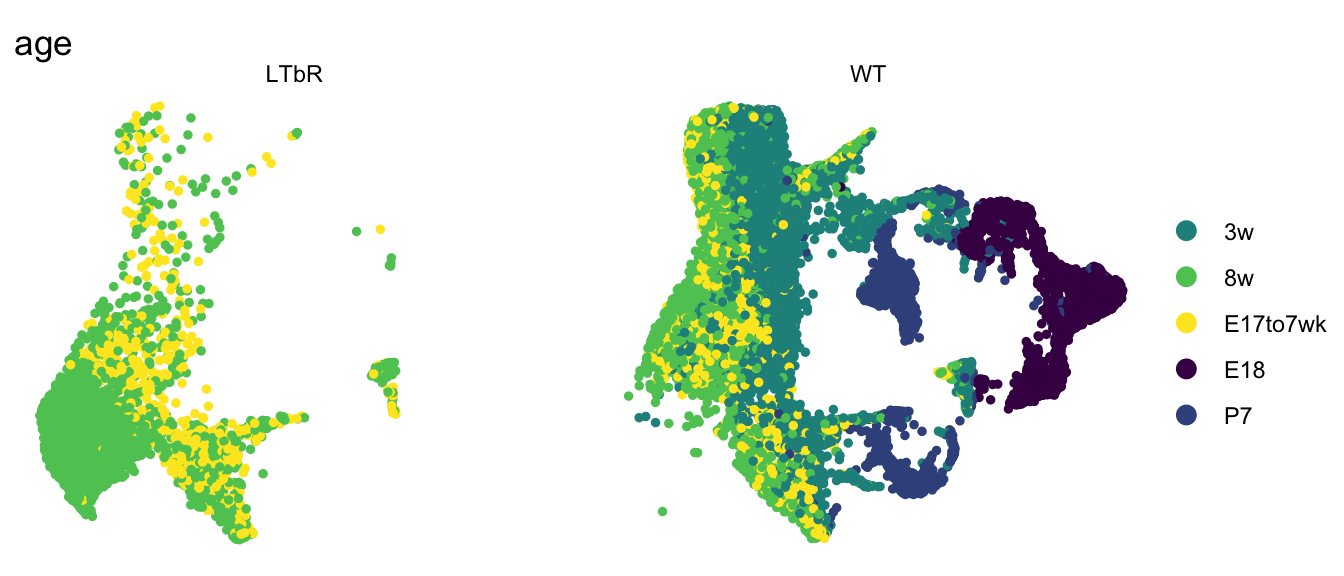
vis label
DimPlot(seurat, reduction = "umap", group.by = "label",
        cols = colLab, shuffle=T)+
  theme_bw() +
  theme(axis.text = element_blank(), axis.ticks = element_blank(),
        panel.grid.minor = element_blank()) +
  xlab("UMAP1") +
  ylab("UMAP2")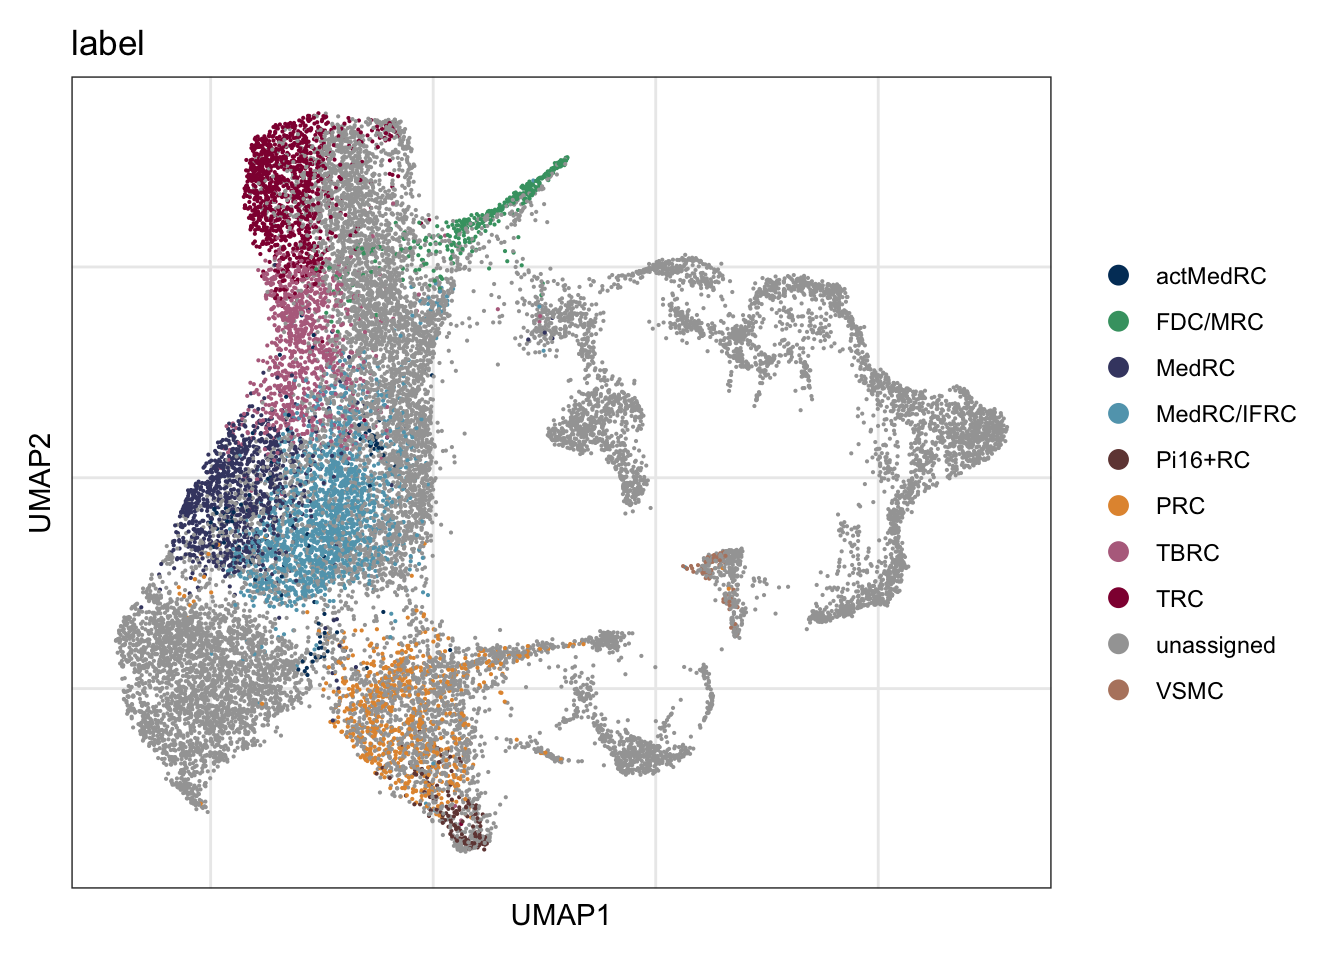
DimPlot(seurat, reduction = "umap", group.by = "label", pt.size=0.5,
        cols = colLab, shuffle=T)+
  theme_void()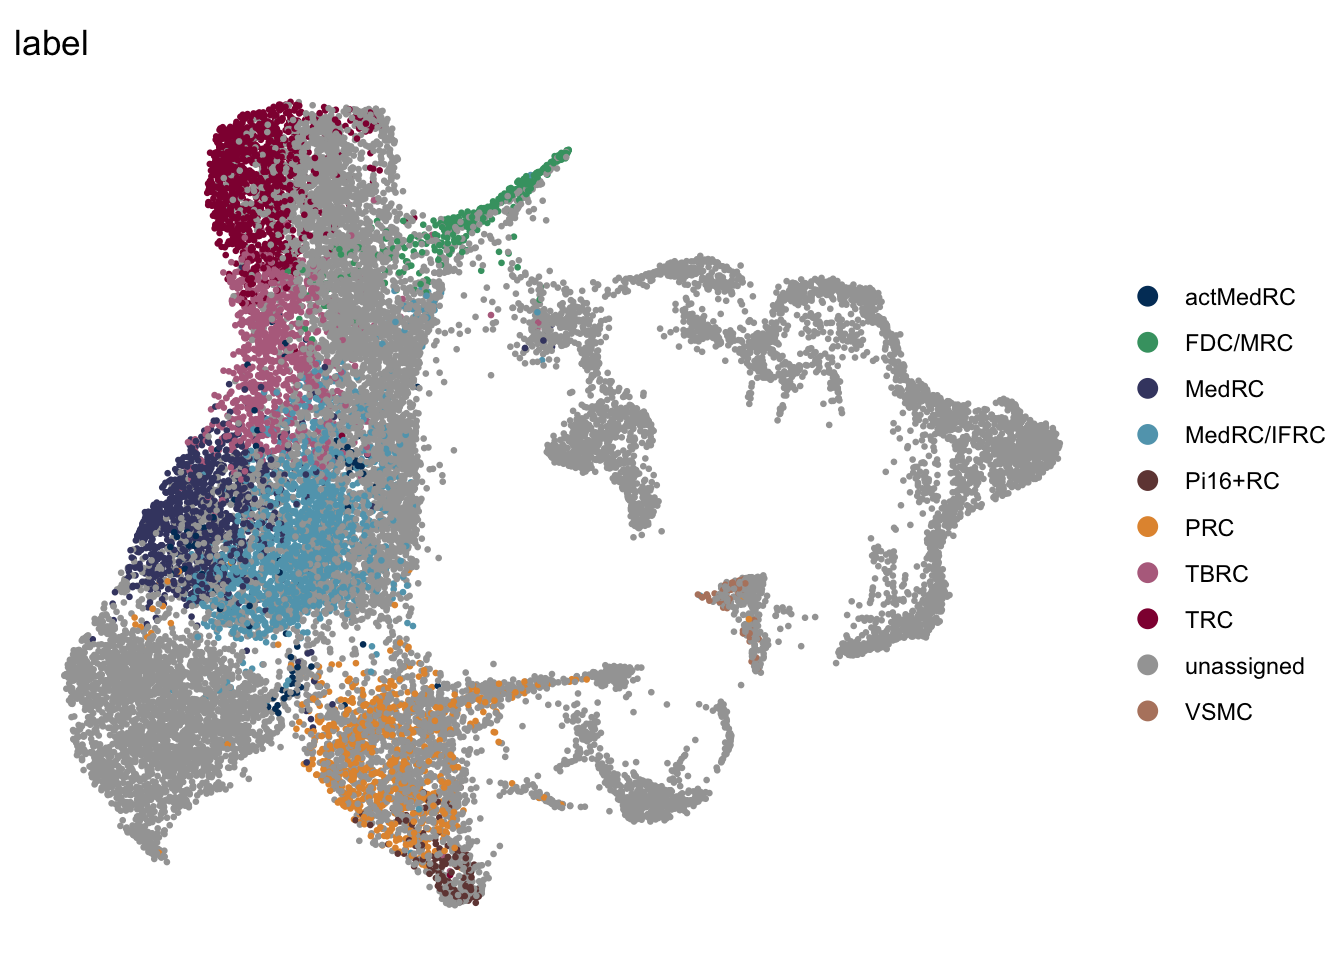
vis cond
DimPlot(seurat, reduction = "umap", group.by = "cond",
        cols = colCond, shuffle=T)+
  theme_bw() +
  theme(axis.text = element_blank(), axis.ticks = element_blank(),
        panel.grid.minor = element_blank()) +
  xlab("UMAP1") +
  ylab("UMAP2")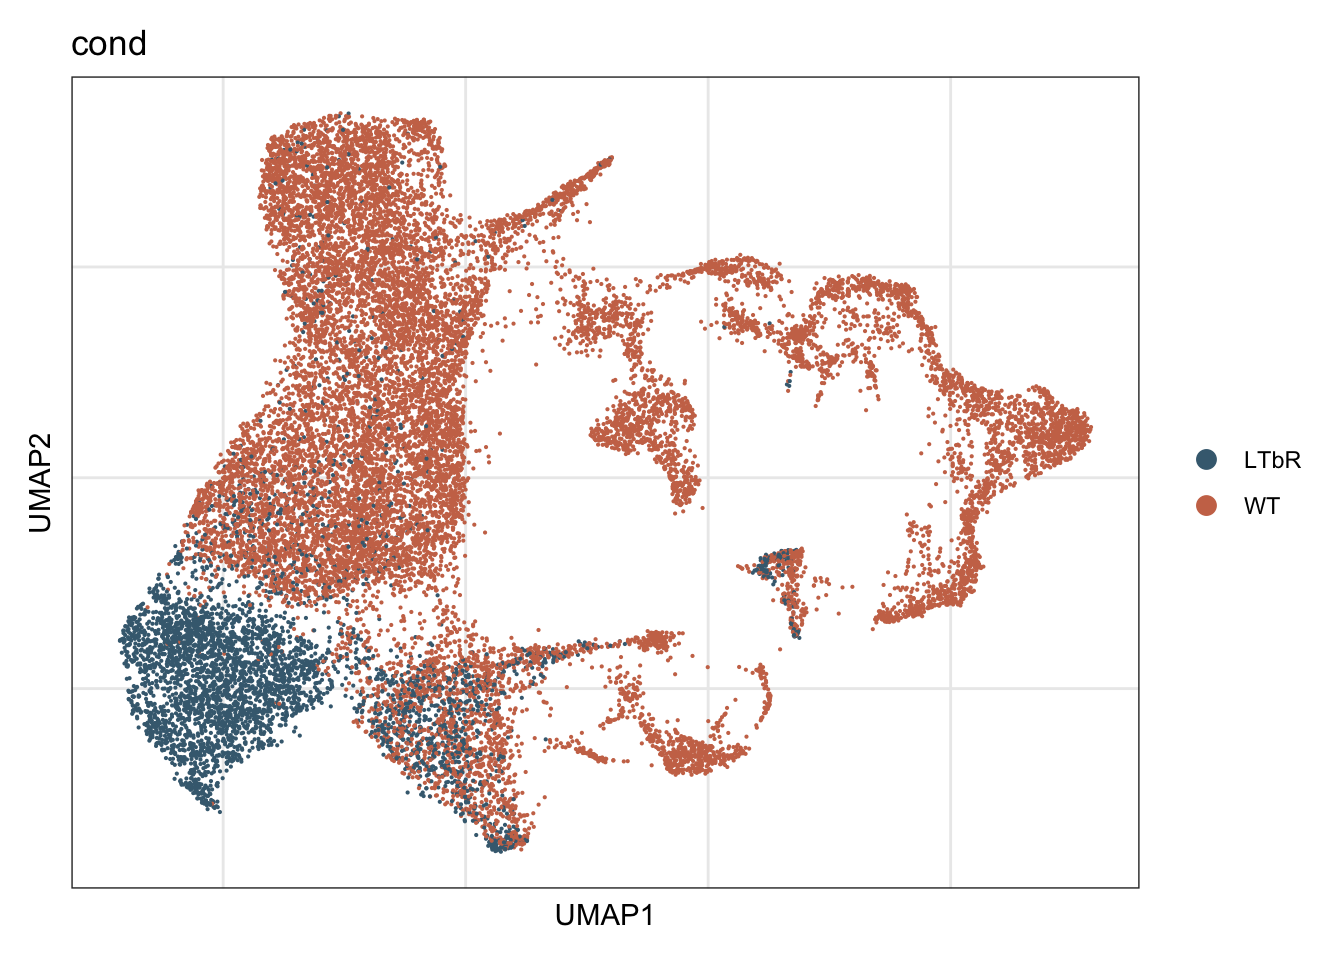
DimPlot(seurat, reduction = "umap", group.by = "cond", pt.size=1,
        cols = colCond, shuffle=T)+
  theme_void()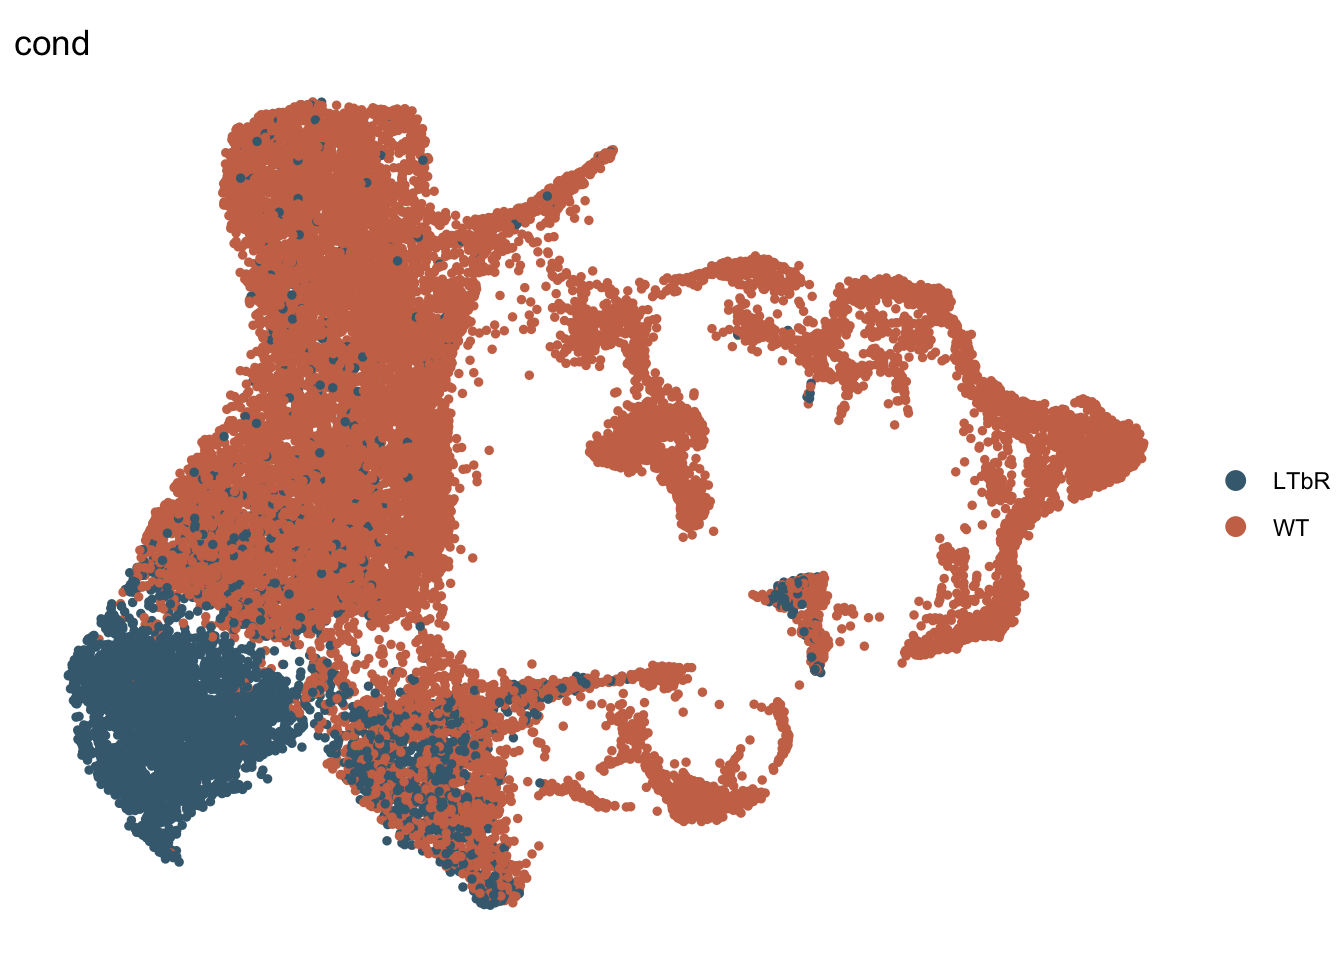
colCond2 <- c("#900C3F" ,"#a4a4a4")
names(colCond2) <- c("LTbR", "WT")

DimPlot(seurat, reduction = "umap", group.by = "cond", pt.size=1,
        cols = colCond2, order="LTbR")+
  theme_void()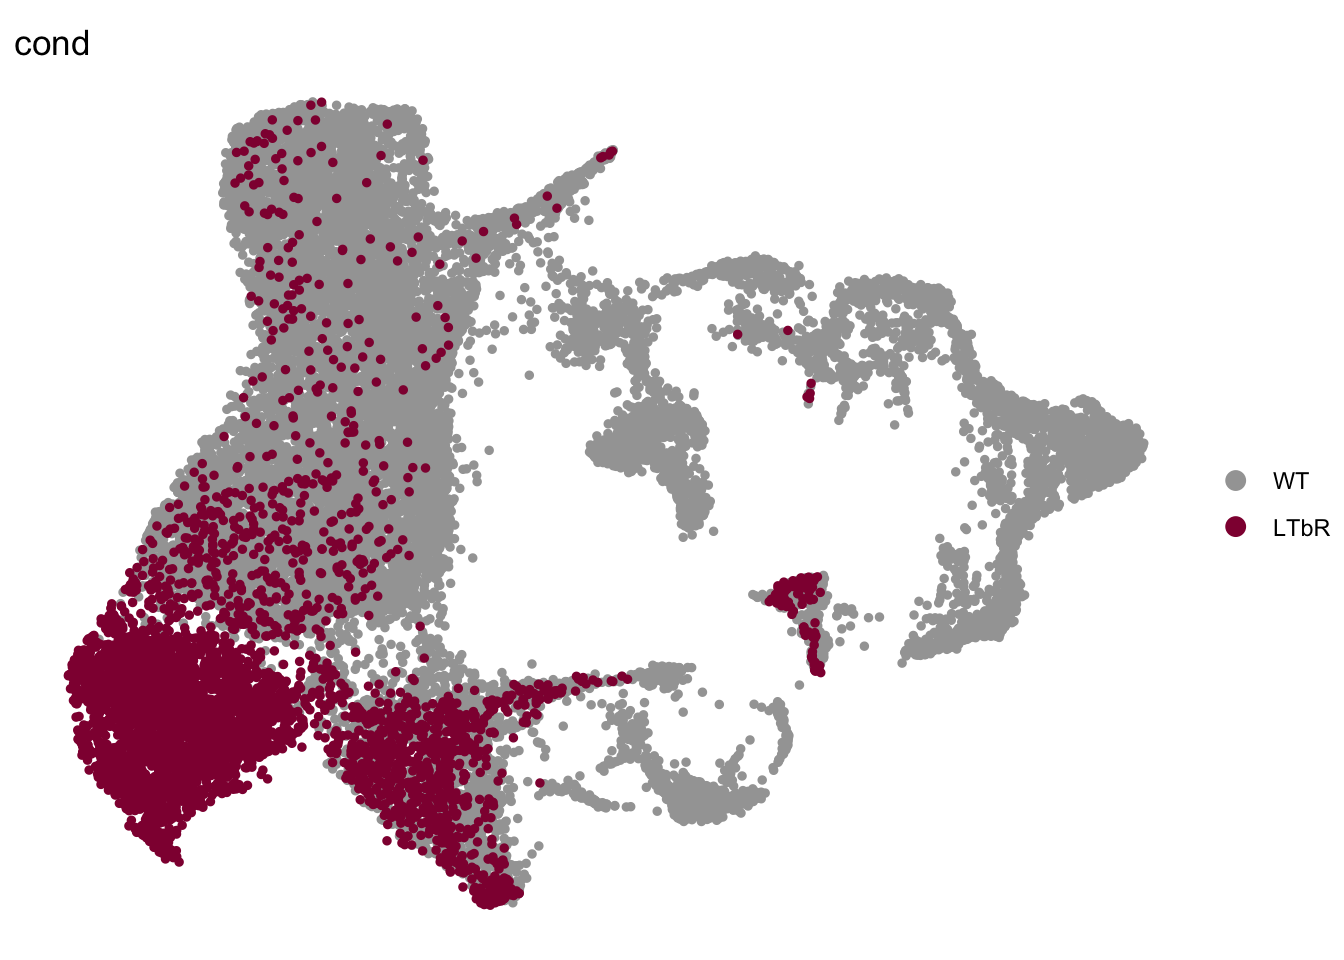
DimPlot(seurat, reduction = "umap", group.by = "cond", pt.size=1,
        cols = colCond2, shuffle=T)+
  theme_void()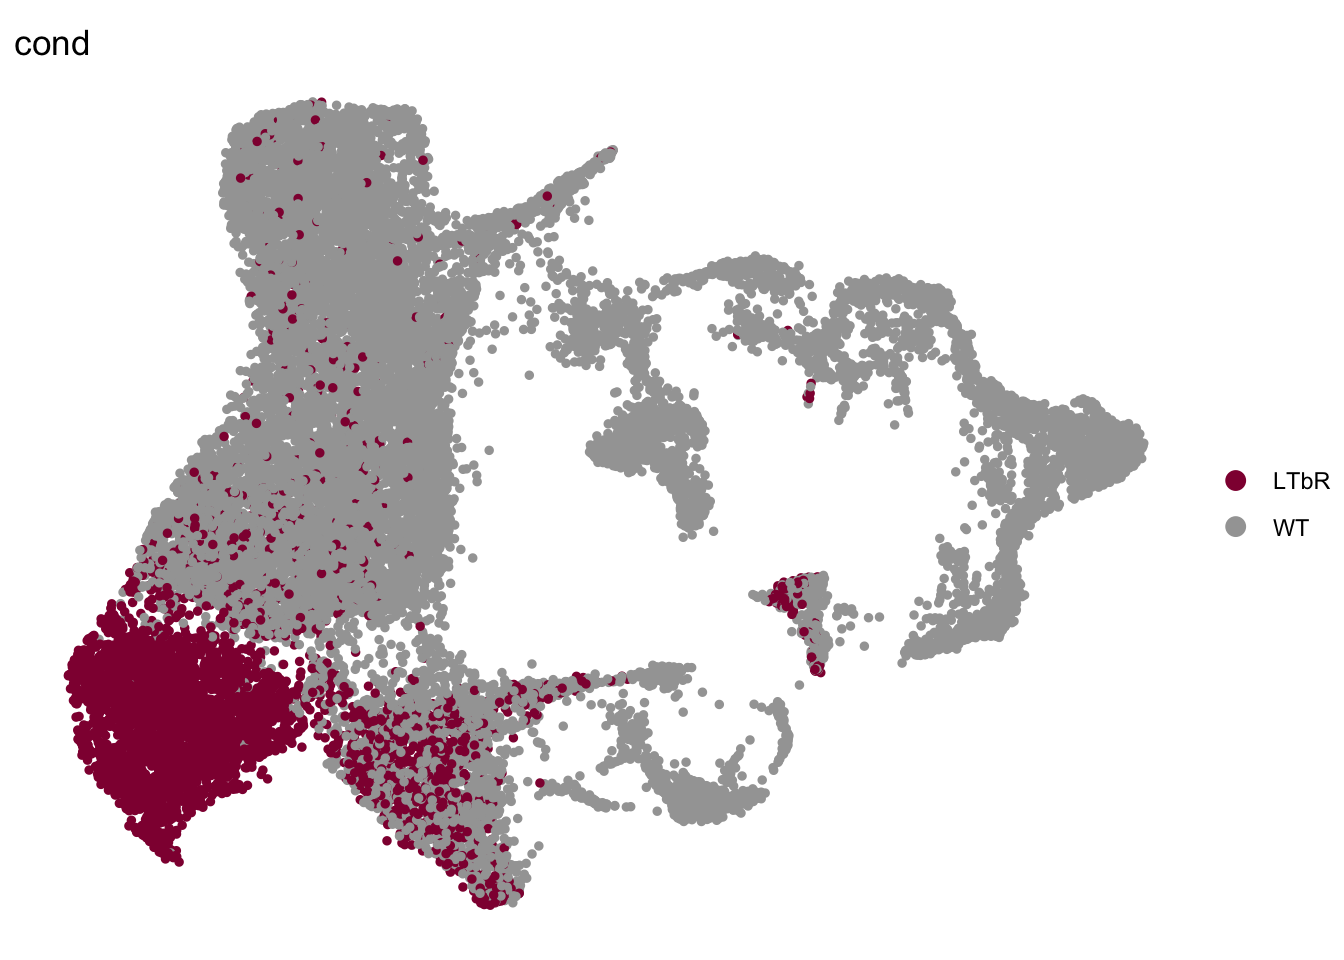
Counts
knitr::kable(table(seurat$RNA_snn_res.0.4, seurat$cond))| LTbR | WT | |
|---|---|---|
| 0 | 432 | 5184 |
| 1 | 2844 | 57 |
| 2 | 64 | 2363 |
| 3 | 835 | 1539 |
| 4 | 43 | 2064 |
| 5 | 0 | 1224 |
| 6 | 2 | 1214 |
| 7 | 0 | 1036 |
| 8 | 0 | 715 |
| 9 | 14 | 484 |
| 10 | 0 | 497 |
| 11 | 129 | 264 |
| 12 | 3 | 236 |
seuratSub <- subset(seurat, age %in% c("E17to7wk", "8w"))
knitr::kable(table(seuratSub$RNA_snn_res.0.4, seuratSub$cond))| LTbR | WT | |
|---|---|---|
| 0 | 432 | 3168 |
| 1 | 2844 | 51 |
| 2 | 64 | 807 |
| 3 | 835 | 838 |
| 4 | 43 | 1034 |
| 5 | 0 | 17 |
| 6 | 2 | 36 |
| 7 | 0 | 0 |
| 8 | 0 | 0 |
| 9 | 14 | 342 |
| 10 | 0 | 4 |
| 11 | 129 | 60 |
| 12 | 3 | 5 |
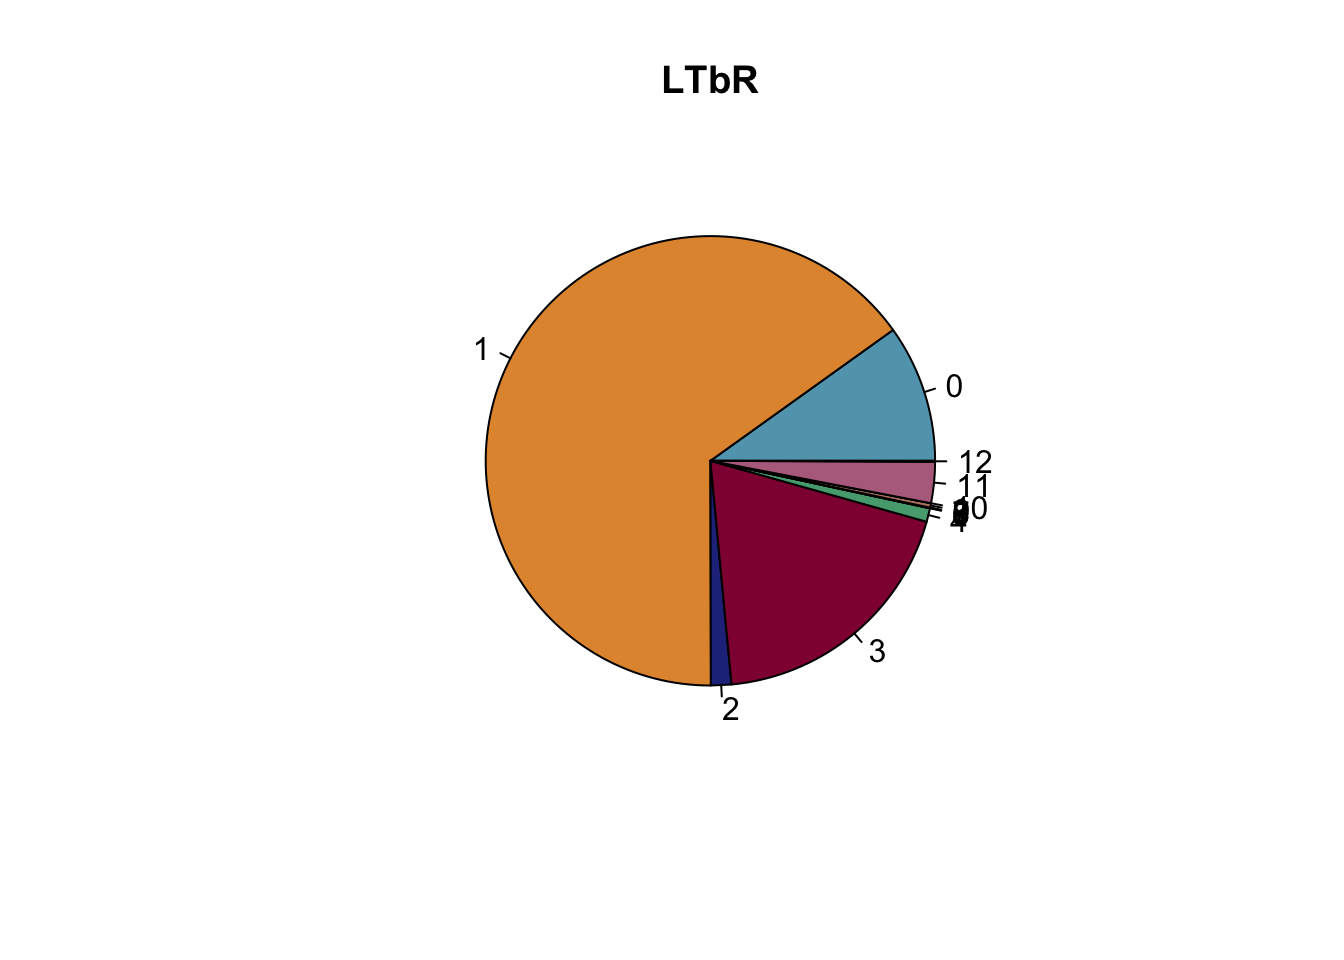
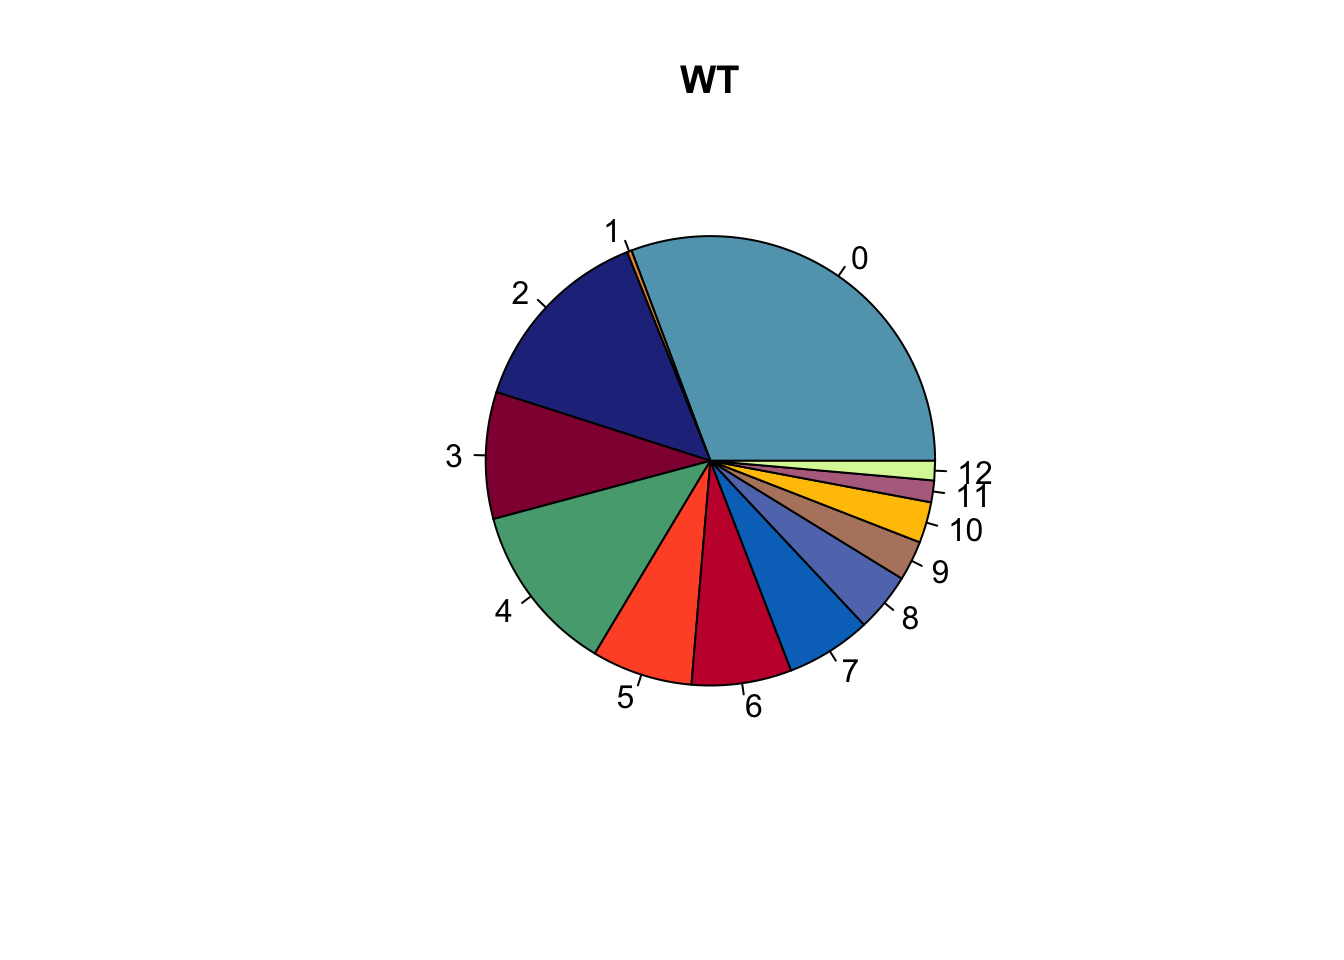
## relative abundance per cond
clustCond <- data.frame(table(seurat$cond, seurat$RNA_snn_res.0.4))
colnames(clustCond) <- c("cond", "intCluster", "cnt")
condTot <- data.frame(table(seurat$cond))
colnames(condTot) <- c("cond", "tot")
colPaldat <- data.frame(col=colPal) %>%
  rownames_to_column(var = "intCluster")
clustDat2 <- clustCond %>%  left_join(., condTot, by = "cond") %>%
  mutate(relAb = cnt/tot * 100) %>%
  left_join(., colPaldat, by = "intCluster")

knitr::kable(clustDat2)| cond | intCluster | cnt | tot | relAb | col |
|---|---|---|---|---|---|
| LTbR | 0 | 432 | 4366 | 9.8946404 | #61a4ba |
| WT | 0 | 5184 | 16877 | 30.7163595 | #61a4ba |
| LTbR | 1 | 2844 | 4366 | 65.1397160 | #e3953d |
| WT | 1 | 57 | 16877 | 0.3377377 | #e3953d |
| LTbR | 2 | 64 | 4366 | 1.4658727 | #25328a |
| WT | 2 | 2363 | 16877 | 14.0013035 | #25328a |
| LTbR | 3 | 835 | 4366 | 19.1250573 | #900C3F |
| WT | 3 | 1539 | 16877 | 9.1189192 | #900C3F |
| LTbR | 4 | 43 | 4366 | 0.9848832 | #54a87f |
| WT | 4 | 2064 | 16877 | 12.2296617 | #54a87f |
| LTbR | 5 | 0 | 4366 | 0.0000000 | #FF5733 |
| WT | 5 | 1224 | 16877 | 7.2524738 | #FF5733 |
| LTbR | 6 | 2 | 4366 | 0.0458085 | #C70039 |
| WT | 6 | 1214 | 16877 | 7.1932215 | #C70039 |
| LTbR | 7 | 0 | 4366 | 0.0000000 | #0073C2FF |
| WT | 7 | 1036 | 16877 | 6.1385317 | #0073C2FF |
| LTbR | 8 | 0 | 4366 | 0.0000000 | #6178ba |
| WT | 8 | 715 | 16877 | 4.2365349 | #6178ba |
| LTbR | 9 | 14 | 4366 | 0.3206596 | #b6856e |
| WT | 9 | 484 | 16877 | 2.8678083 | #b6856e |
| LTbR | 10 | 0 | 4366 | 0.0000000 | #FFC300 |
| WT | 10 | 497 | 16877 | 2.9448362 | #FFC300 |
| LTbR | 11 | 129 | 4366 | 2.9546496 | #b66e8d |
| WT | 11 | 264 | 16877 | 1.5642591 | #b66e8d |
| LTbR | 12 | 3 | 4366 | 0.0687128 | #DAF7A6 |
| WT | 12 | 236 | 16877 | 1.3983528 | #DAF7A6 |
lapply(names(colCond), function(co){
  clustDat2sel <- clustDat2 %>% filter(cond==co)
  pie(clustDat2sel$relAb,
      labels = clustDat2sel$intCluster,
      col = clustDat2sel$col,
      main = paste0(co))
})
[[1]]
NULL

[[2]]
NULL
Marker genes additional cluster ltbr floxed
Idents(seuratSub) <- seuratSub$RNA_snn_res.0.4
markers <- FindMarkers(seuratSub, ident.1 = "1", only.pos = T)

## plot top 20 marker
markerDat <- markers %>% rownames_to_column(var = "geneID") %>%
  slice_min(p_val_adj, n=20) %>% slice_max(avg_log2FC, n=20)
genes <- data.frame(geneID=rownames(seuratSub)) %>%
  mutate(gene=gsub(".*\\.", "",  geneID))

markerAll <- markerDat %>% left_join(., genes, by="geneID")

seuratSub$clusterSel <- as.character(seuratSub$RNA_snn_res.0.4)
Idents(seuratSub) <- seuratSub$clusterSel

DotPlot(seuratSub, assay="RNA", features = rev(markerAll$geneID), scale =T,
        cluster.idents = F) +
  scale_color_viridis_c() +
  coord_flip() +
  theme(axis.text.x = element_text(angle = 90, hjust = 1)) +
  scale_x_discrete(breaks=rev(markerAll$geneID), labels=rev(markerAll$gene)) +
  xlab("") + ylab("")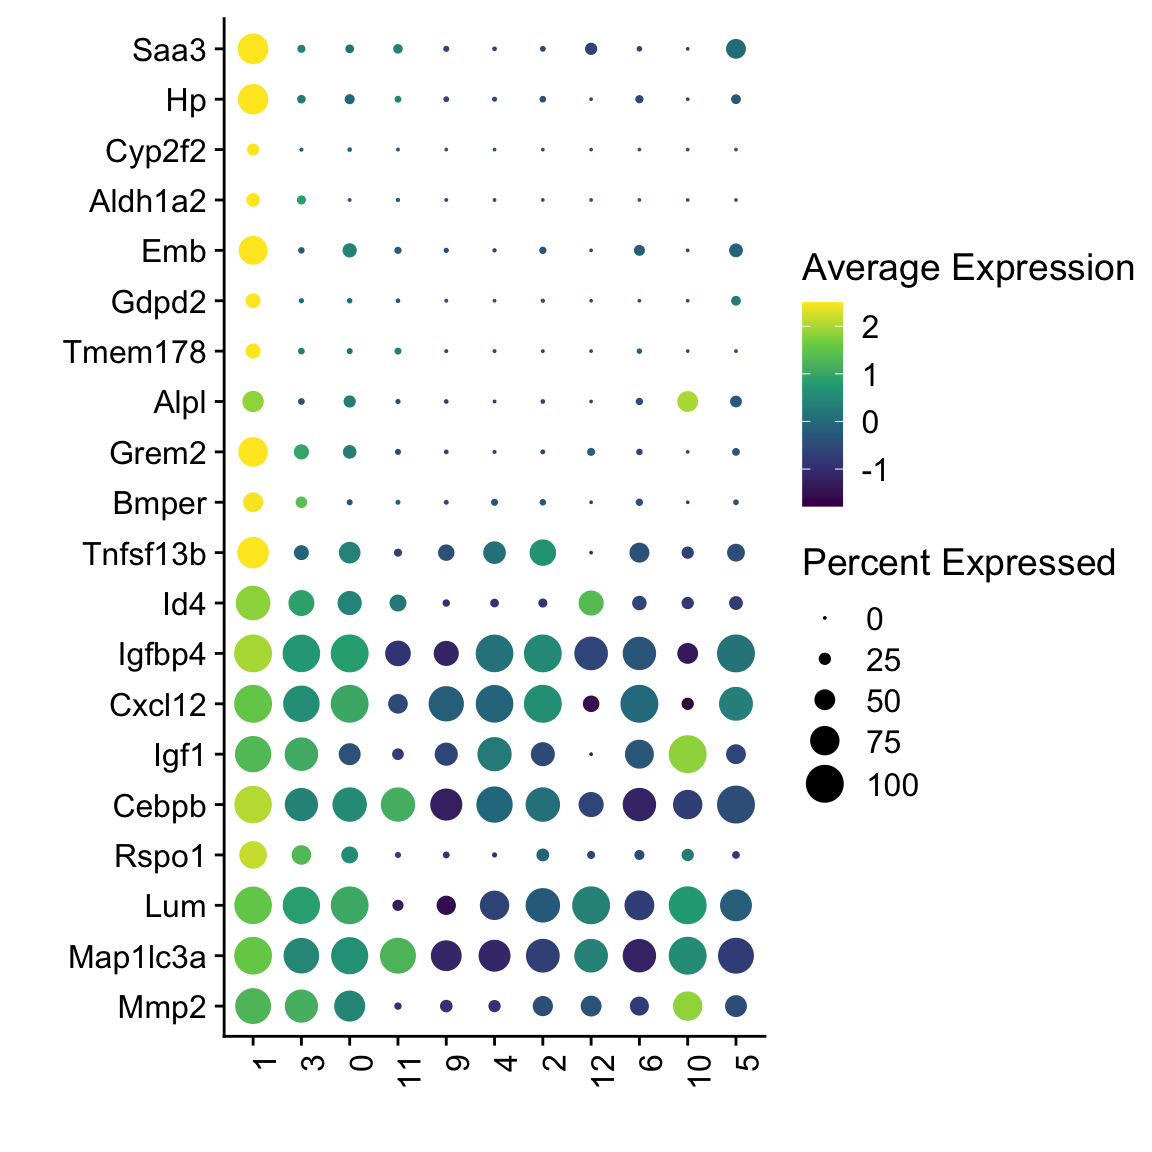
DotPlot(seuratSub, assay="RNA", features = rev(markerAll$geneID), scale =F,
        cluster.idents = F) +
  scale_color_viridis_c() +
  coord_flip() +
  theme(axis.text.x = element_text(angle = 90, hjust = 1)) +
  scale_x_discrete(breaks=rev(markerAll$geneID), labels=rev(markerAll$gene)) +
  xlab("") + ylab("")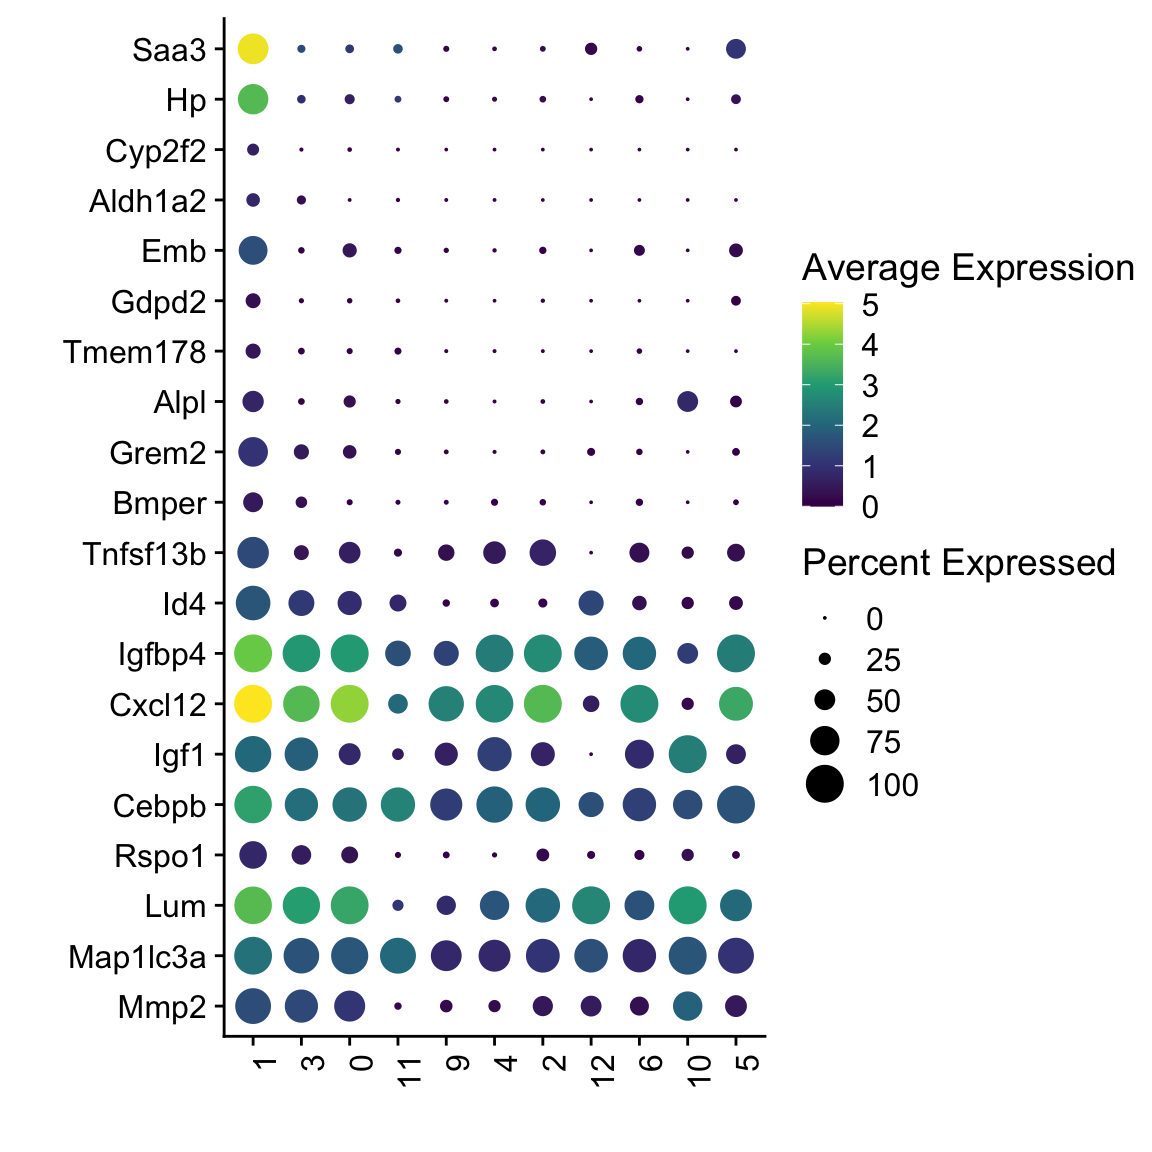
##### all ltbr vs WT
Idents(seuratSub) <- seuratSub$cond
markers <- FindMarkers(seuratSub, ident.1 = "LTbR", only.pos = T)

## plot top 20 marker
markerDat <- markers %>% rownames_to_column(var = "geneID") %>%
  slice_min(p_val_adj, n=20) %>% slice_max(avg_log2FC, n=20)
genes <- data.frame(geneID=rownames(seuratSub)) %>%
  mutate(gene=gsub(".*\\.", "",  geneID))

markerAll <- markerDat %>% left_join(., genes, by="geneID")

Idents(seuratSub) <- seuratSub$clusterSel

DotPlot(seuratSub, assay="RNA", features = rev(markerAll$geneID), scale =T,
        cluster.idents = F) +
  scale_color_viridis_c() +
  coord_flip() +
  theme(axis.text.x = element_text(angle = 90, hjust = 1)) +
  scale_x_discrete(breaks=rev(markerAll$geneID), labels=rev(markerAll$gene)) +
  xlab("") + ylab("")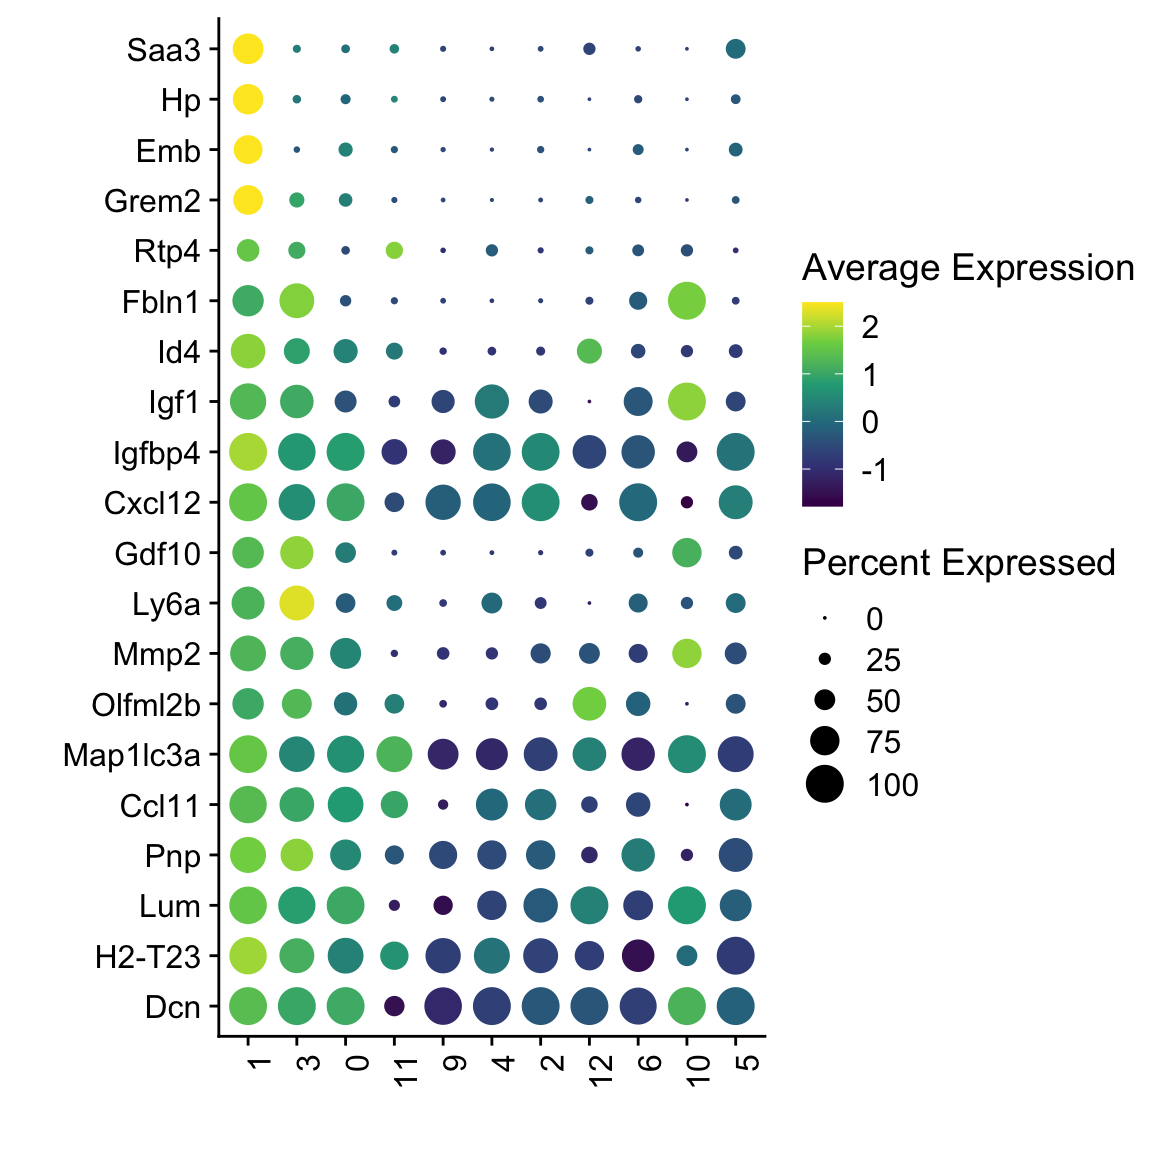
DotPlot(seuratSub, assay="RNA", features = rev(markerAll$geneID), scale =F,
        cluster.idents = F) +
  scale_color_viridis_c() +
  coord_flip() +
  theme(axis.text.x = element_text(angle = 90, hjust = 1)) +
  scale_x_discrete(breaks=rev(markerAll$geneID), labels=rev(markerAll$gene)) +
  xlab("") + ylab("")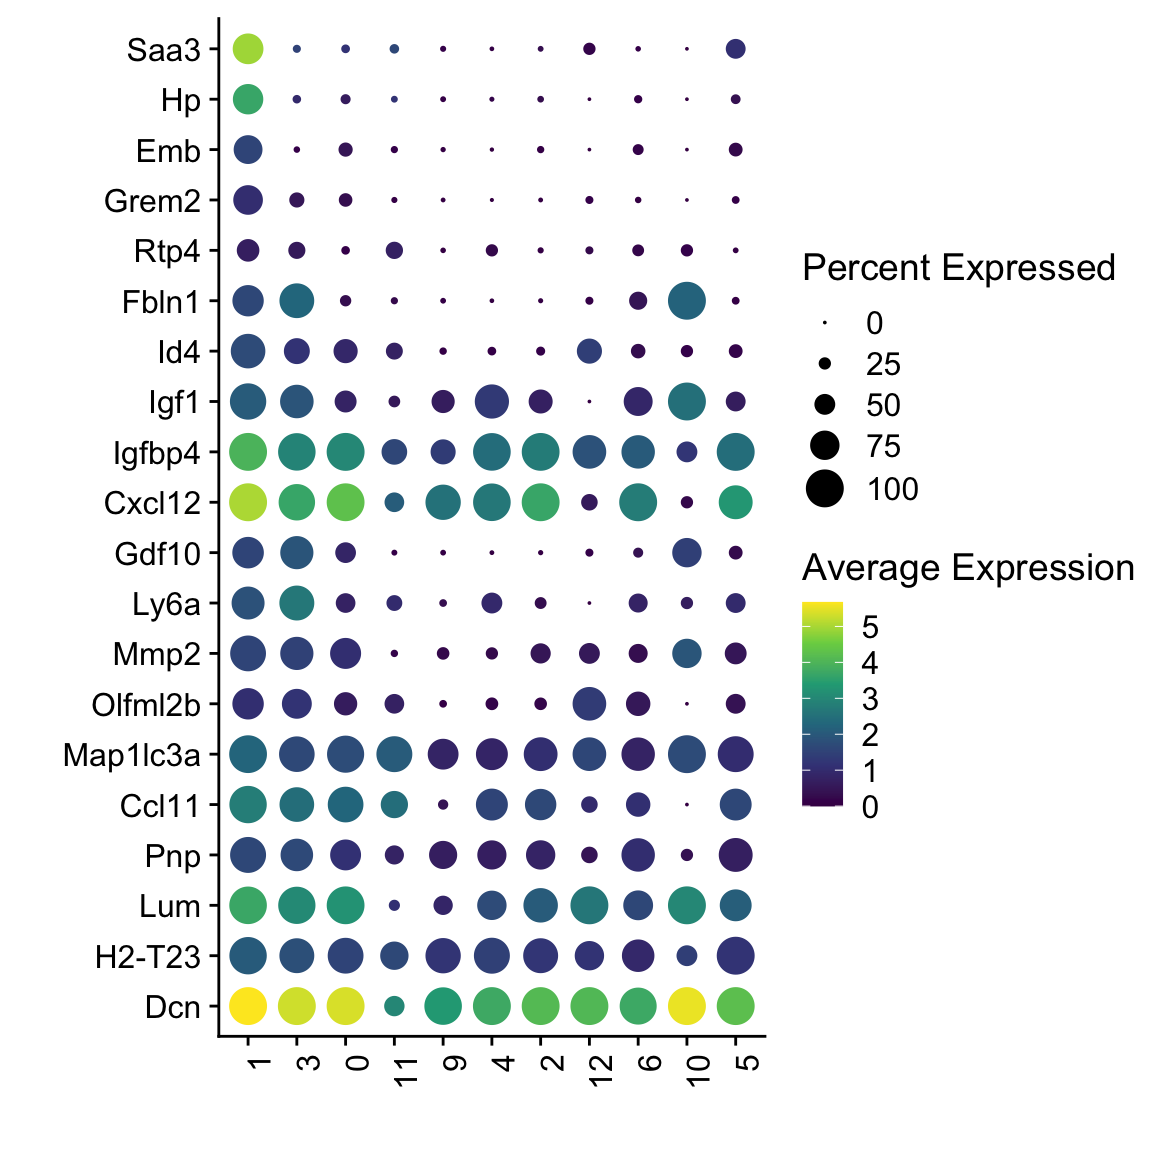
Project MedRC signature
genesDat <- data.frame(EnsID=rownames(seurat)) %>%
  mutate(gene=gsub(".*\\.", "", EnsID))
selGenes <- data.frame(gene=c("Tnfsf11", "Fbn2","Pltp" ,"C1rb", "Lepr", "Ptn","Nr4a1")) %>%
  left_join(., genesDat, by="gene")

## seurat module score..
seurat <- AddModuleScore(
  object = seurat,
  features = list(c(selGenes$EnsID)),
  ctrl = 100,
  name = 'MedRCsign'
)

cut <- 1*max(seurat$MedRCsign1)
selSign <- "MedRCsign1"
p <- FeaturePlot(seurat, reduction = "umap", pt.size = 1, max.cutoff = cut,
            features = selSign,
            cols=c("#00155e", "#4575B4","#E0F3F8", "#FFFFBF" ,"#f6aa3e","#d64141"),
            order = F)+
  theme(legend.position="right")
plot(p)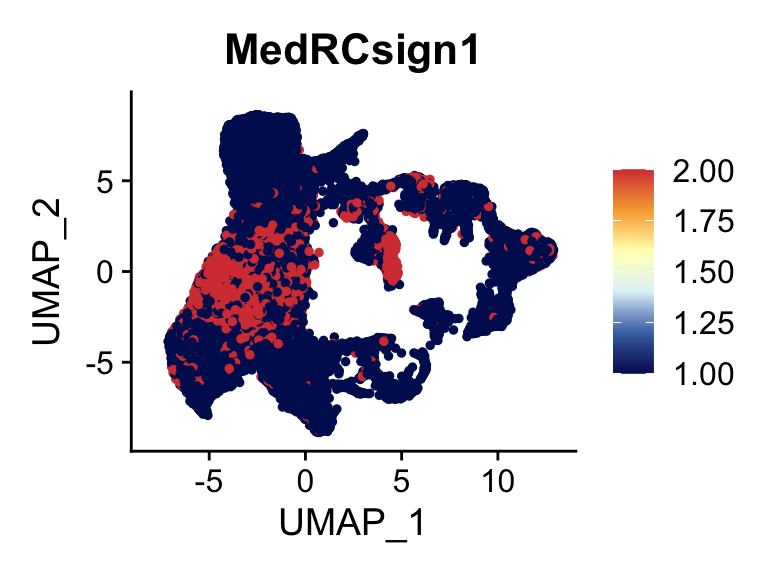
p <- FeaturePlot(seurat, reduction = "umap", pt.size = 0.3,
            features = selSign,
            cols=c('#dadada', '#c3b0b1' ,'#9c676b', '#93003a'),
            order = F)+
  theme(legend.position="right")
plot(p)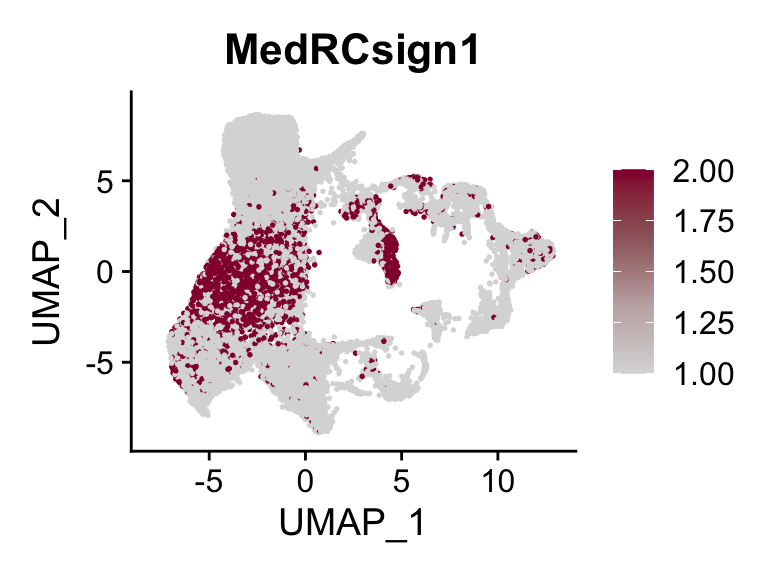
## average expression across genes
sce <- as.SingleCellExperiment(seurat)
sceSub <- sce[which(rownames(sce) %in% selGenes$EnsID),]
dim(sceSub)
[1] 7 21243cntMat <- rowSums(t(as.matrix(sceSub@assays@data$logcounts)))/nrow(selGenes)
sceSub$sign <- cntMat
maxCM <- 0.8*max(cntMat)
minCM <- min(cntMat)
pal = colorRampPalette(rev(brewer.pal(11, 'RdBu')))
sc <- scale_colour_gradientn(colours = pal(100), limits=c(minCM,maxCM), na.value = pal(100)[100])
p <- visGroup(sceSub, 'sign', dim_red = 'UMAP') +
sc +
guides(colour = guide_colourbar(title = '')) +
ggtitle(paste0('MedRC - ', ' signature')) +
theme_classic() +
theme(axis.text = element_blank(),
axis.ticks = element_blank()) +
labs(x='Dimension 1', y='Dimension 2')
p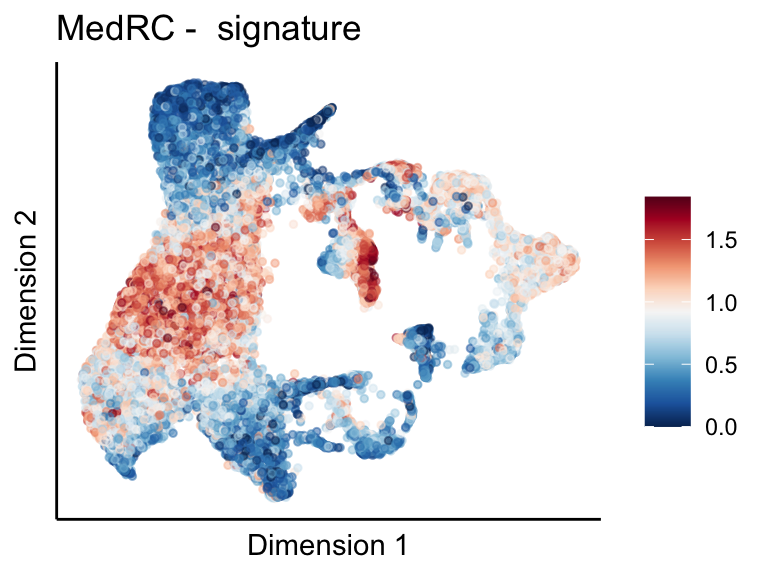
session info
sessionInfo()R version 4.4.0 (2024-04-24)
Platform: aarch64-apple-darwin20
Running under: macOS Sonoma 14.1
Matrix products: default
BLAS: /Library/Frameworks/R.framework/Versions/4.4-arm64/Resources/lib/libRblas.0.dylib
LAPACK: /Library/Frameworks/R.framework/Versions/4.4-arm64/Resources/lib/libRlapack.dylib; LAPACK version 3.12.0
locale:
[1] en_US.UTF-8/en_US.UTF-8/en_US.UTF-8/C/en_US.UTF-8/en_US.UTF-8
time zone: Europe/Zurich
tzcode source: internal
attached base packages:
[1] stats4 stats graphics grDevices utils datasets methods
[8] base
other attached packages:
[1] CellMixS_1.20.0 kSamples_1.2-10
[3] SuppDists_1.1-9.7 ggsci_3.1.0
[5] scran_1.32.0 scater_1.32.0
[7] scuttle_1.14.0 pheatmap_1.0.12
[9] RColorBrewer_1.1-3 SingleCellExperiment_1.26.0
[11] SummarizedExperiment_1.34.0 Biobase_2.64.0
[13] GenomicRanges_1.56.0 GenomeInfoDb_1.40.1
[15] IRanges_2.38.0 S4Vectors_0.42.0
[17] BiocGenerics_0.50.0 MatrixGenerics_1.16.0
[19] matrixStats_1.3.0 here_1.0.1
[21] magrittr_2.0.3 Seurat_5.1.0
[23] SeuratObject_5.0.2 sp_2.1-4
[25] lubridate_1.9.3 forcats_1.0.0
[27] stringr_1.5.1 dplyr_1.1.4
[29] purrr_1.0.2 readr_2.1.5
[31] tidyr_1.3.1 tibble_3.2.1
[33] ggplot2_3.5.1 tidyverse_2.0.0
loaded via a namespace (and not attached):
[1] RcppAnnoy_0.0.22 splines_4.4.0
[3] later_1.3.2 polyclip_1.10-6
[5] fastDummies_1.7.3 lifecycle_1.0.4
[7] edgeR_4.2.0 rprojroot_2.0.4
[9] globals_0.16.3 lattice_0.22-6
[11] MASS_7.3-60.2 limma_3.60.2
[13] plotly_4.10.4 rmarkdown_2.27
[15] yaml_2.3.8 metapod_1.12.0
[17] httpuv_1.6.15 sctransform_0.4.1
[19] spam_2.10-0 spatstat.sparse_3.0-3
[21] reticulate_1.37.0 cowplot_1.1.3
[23] pbapply_1.7-2 abind_1.4-5
[25] zlibbioc_1.50.0 Rtsne_0.17
[27] GenomeInfoDbData_1.2.12 ggrepel_0.9.5
[29] irlba_2.3.5.1 listenv_0.9.1
[31] spatstat.utils_3.0-4 goftest_1.2-3
[33] RSpectra_0.16-1 dqrng_0.4.1
[35] spatstat.random_3.2-3 fitdistrplus_1.1-11
[37] parallelly_1.37.1 DelayedMatrixStats_1.26.0
[39] leiden_0.4.3.1 codetools_0.2-20
[41] DelayedArray_0.30.1 tidyselect_1.2.1
[43] farver_2.1.2 UCSC.utils_1.0.0
[45] ScaledMatrix_1.12.0 viridis_0.6.5
[47] spatstat.explore_3.2-7 jsonlite_1.8.8
[49] BiocNeighbors_1.22.0 progressr_0.14.0
[51] ggridges_0.5.6 survival_3.7-0
[53] tools_4.4.0 ica_1.0-3
[55] Rcpp_1.0.12 glue_1.7.0
[57] gridExtra_2.3 SparseArray_1.4.8
[59] xfun_0.44 withr_3.0.0
[61] fastmap_1.2.0 bluster_1.14.0
[63] fansi_1.0.6 digest_0.6.35
[65] rsvd_1.0.5 timechange_0.3.0
[67] R6_2.5.1 mime_0.12
[69] colorspace_2.1-0 scattermore_1.2
[71] tensor_1.5 spatstat.data_3.0-4
[73] utf8_1.2.4 generics_0.1.3
[75] data.table_1.15.4 httr_1.4.7
[77] htmlwidgets_1.6.4 S4Arrays_1.4.1
[79] uwot_0.2.2 pkgconfig_2.0.3
[81] gtable_0.3.5 lmtest_0.9-40
[83] XVector_0.44.0 htmltools_0.5.8.1
[85] dotCall64_1.1-1 scales_1.3.0
[87] png_0.1-8 knitr_1.47
[89] rstudioapi_0.16.0 tzdb_0.4.0
[91] reshape2_1.4.4 nlme_3.1-165
[93] zoo_1.8-12 KernSmooth_2.23-24
[95] parallel_4.4.0 miniUI_0.1.1.1
[97] vipor_0.4.7 pillar_1.9.0
[99] grid_4.4.0 vctrs_0.6.5
[101] RANN_2.6.1 promises_1.3.0
[103] BiocSingular_1.20.0 beachmat_2.20.0
[105] xtable_1.8-4 cluster_2.1.6
[107] beeswarm_0.4.0 evaluate_0.23
[109] locfit_1.5-9.9 cli_3.6.2
[111] compiler_4.4.0 rlang_1.1.4
[113] crayon_1.5.2 future.apply_1.11.2
[115] labeling_0.4.3 plyr_1.8.9
[117] ggbeeswarm_0.7.2 stringi_1.8.4
[119] viridisLite_0.4.2 deldir_2.0-4
[121] BiocParallel_1.38.0 munsell_0.5.1
[123] lazyeval_0.2.2 spatstat.geom_3.2-9
[125] Matrix_1.7-0 RcppHNSW_0.6.0
[127] hms_1.1.3 patchwork_1.2.0
[129] sparseMatrixStats_1.16.0 future_1.33.2
[131] statmod_1.5.0 shiny_1.8.1.1
[133] ROCR_1.0-11 igraph_2.0.3 date()[1] "Sat Jun 8 20:55:30 2024"