visualize DE genes Pi16+RC human LN
Load packages
## load packages
suppressPackageStartupMessages({
  library(dplyr)
  library(reshape2)
  library(ggplot2)
  library(purrr)
  library(Seurat)
  library(tidyverse)
  library(ggpubr)
  library(runSeurat3)
  library(here)
  library(ggsci)
  library(pheatmap)
  library(scater)
  library(SingleCellExperiment)
  library(scran)
  library(clusterProfiler)
  library(org.Hs.eg.db)
  library(DOSE)
  library(enrichplot)
})
load seurat object
basedir <- here()

seurat <- readRDS(file= paste0(basedir,
                               "/data/AllPatWithoutCM_FRConly_intOrig_seurat.rds"))

DefaultAssay(object = seurat) <- "RNA"
seurat$intCluster <- as.character(seurat$integrated_snn_res.0.25)
Idents(seurat) <- seurat$intCluster


## set col palettes
colPal <- c(pal_uchicago()(6), "#6692a3", "#3b7f60")
names(colPal) <- c("0", "1", "2", "3", "4", "5", "6", "7")
colPat <- c(pal_nejm()(7),pal_futurama()(12))[1:length(unique(seurat$patient))]
names(colPat) <- unique(seurat$patient)
colCond <- c("#6692a3","#971c1c","#d17d67")
names(colCond) <- unique(seurat$cond)
colGrp <- pal_uchicago()(length(unique(seurat$grp)))
names(colGrp) <- unique(seurat$grp)
colOri <- pal_npg()(length(unique(seurat$origin)))
names(colOri) <- unique(seurat$origin)
colTon <- colCond

## all activated in one grp
seurat$cond2 <- seurat$cond
seurat$cond2[which(seurat$cond %in% c("chronic", "acute"))] <- "activated"

colCond2 <- c("#6692a3","#971c1c")
names(colCond2) <- c("resting", "activated")
visualize data
clustering
## visualize input data
DimPlot(seurat, reduction = "umap", cols=colPal)+
  theme_bw() +
  theme(axis.text = element_blank(), axis.ticks = element_blank(),
        panel.grid.minor = element_blank()) +
  xlab("UMAP1") +
  ylab("UMAP2")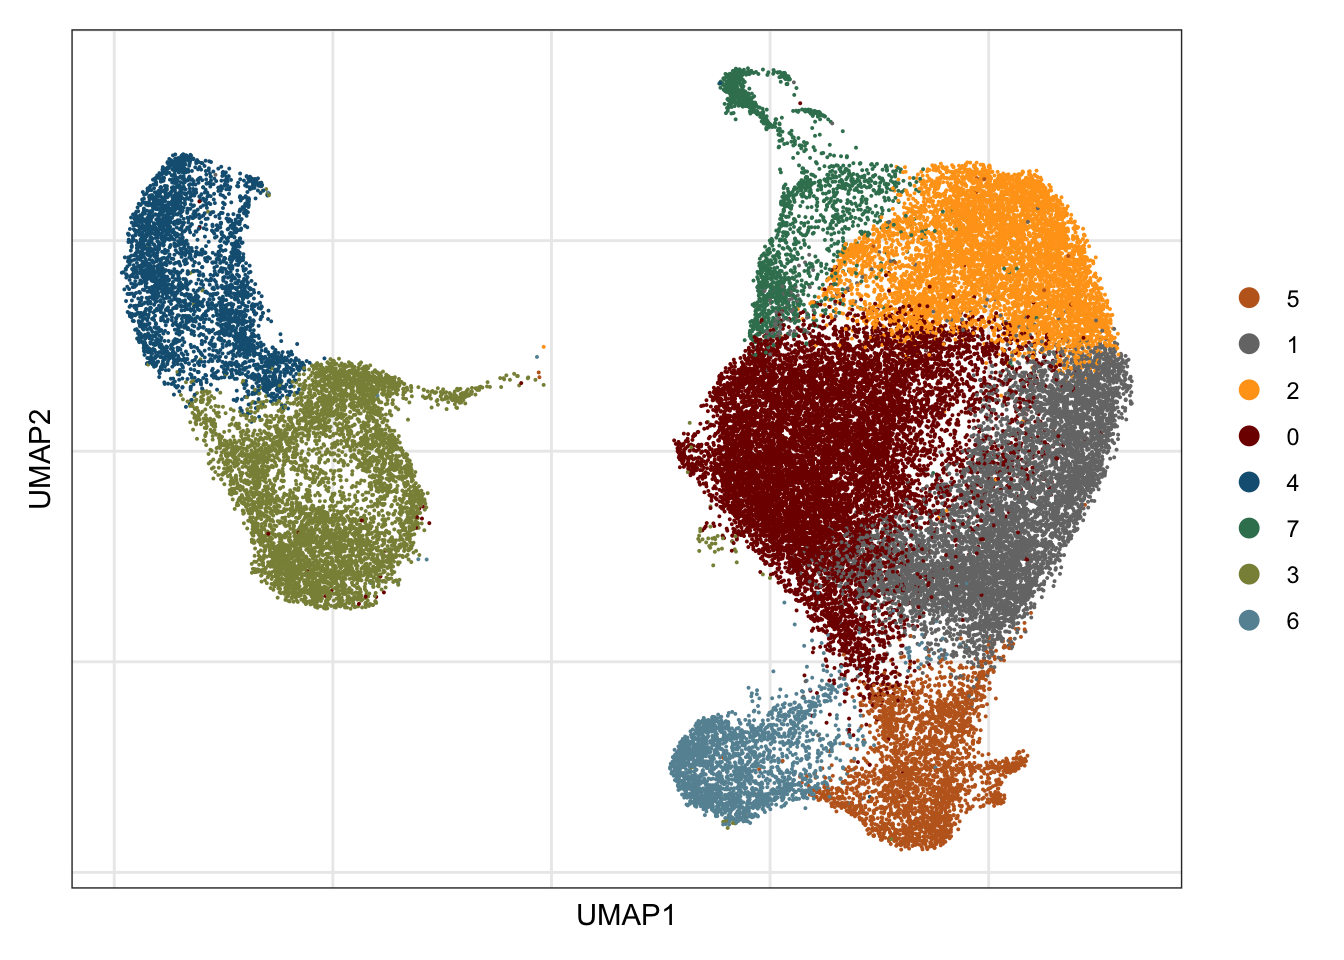
patient
## visualize input data
DimPlot(seurat, reduction = "umap", cols=colPat, group.by = "patient")+
  theme_bw() +
  theme(axis.text = element_blank(), axis.ticks = element_blank(),
        panel.grid.minor = element_blank()) +
  xlab("UMAP1") +
  ylab("UMAP2")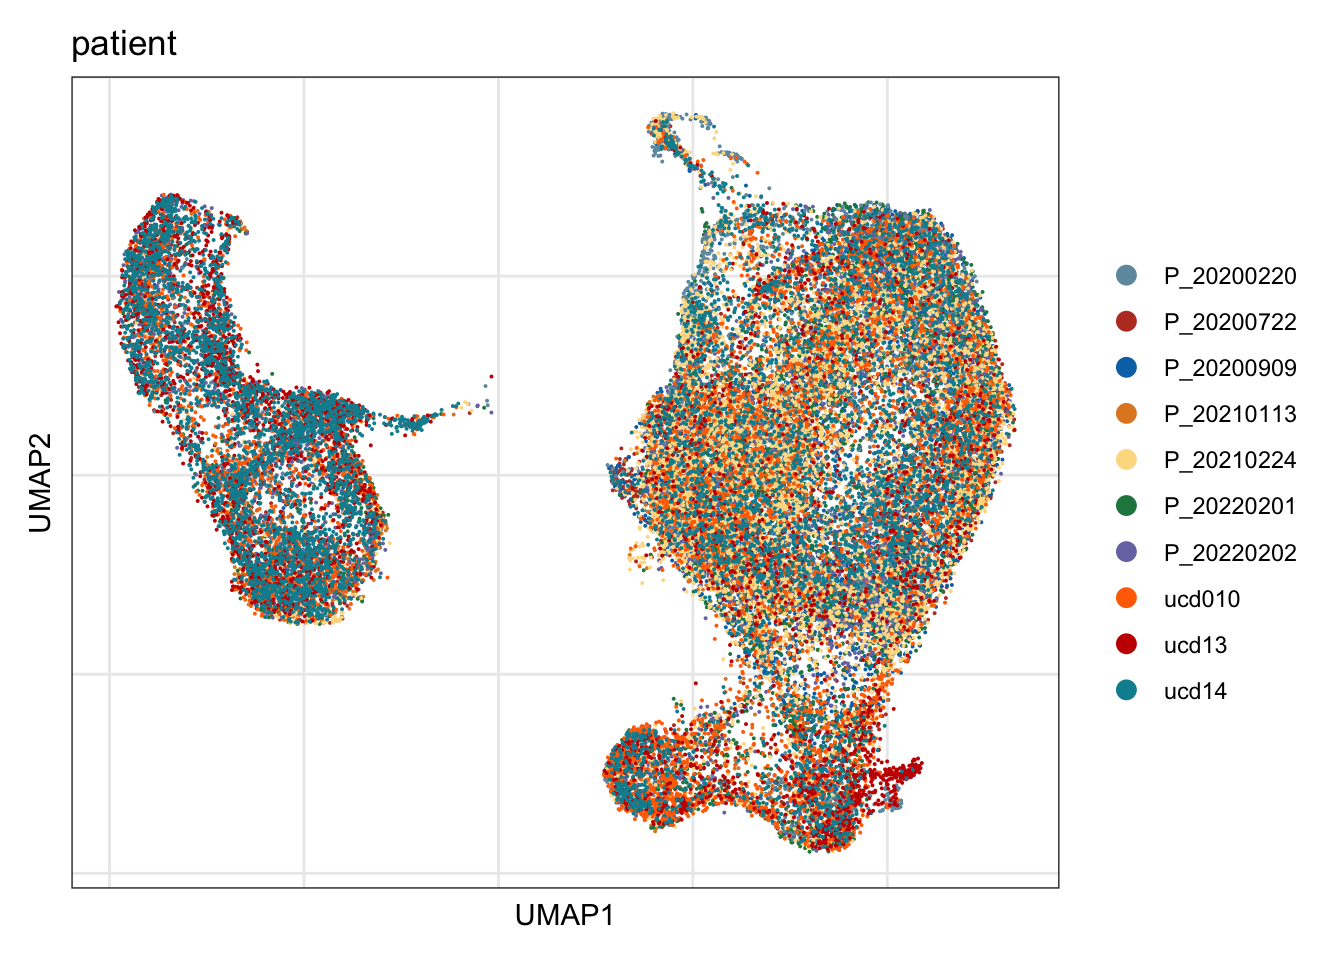
cond2
## visualize input data
DimPlot(seurat, reduction = "umap", cols=colCond2, group.by = "cond2")+
  theme_bw() +
  theme(axis.text = element_blank(), axis.ticks = element_blank(),
        panel.grid.minor = element_blank()) +
  xlab("UMAP1") +
  ylab("UMAP2")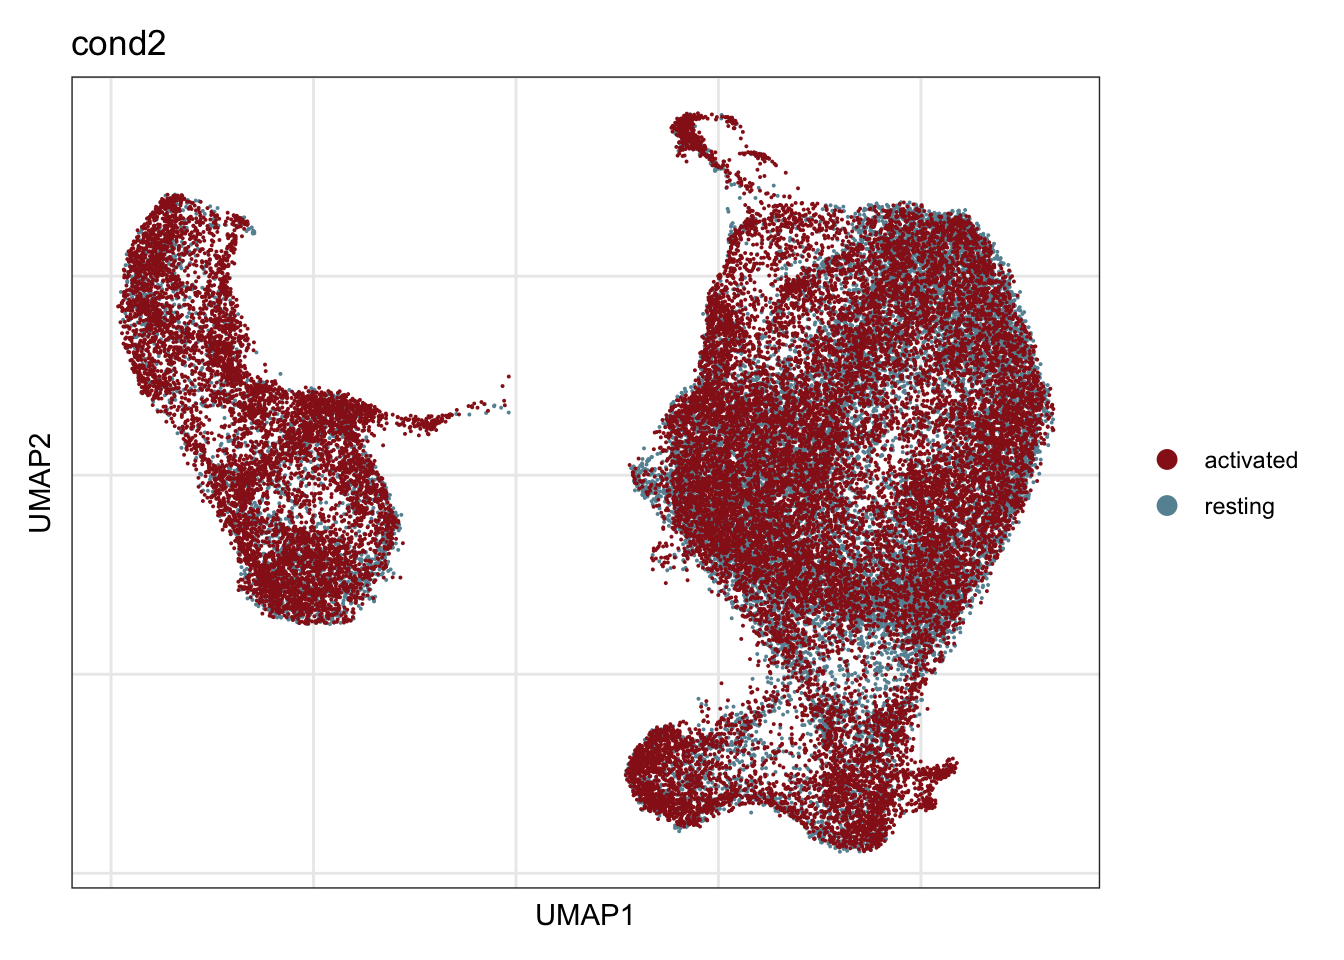
grp
## visualize input data
DimPlot(seurat, reduction = "umap", cols=colGrp, group.by = "grp")+
  theme_bw() +
  theme(axis.text = element_blank(), axis.ticks = element_blank(),
        panel.grid.minor = element_blank()) +
  xlab("UMAP1") +
  ylab("UMAP2")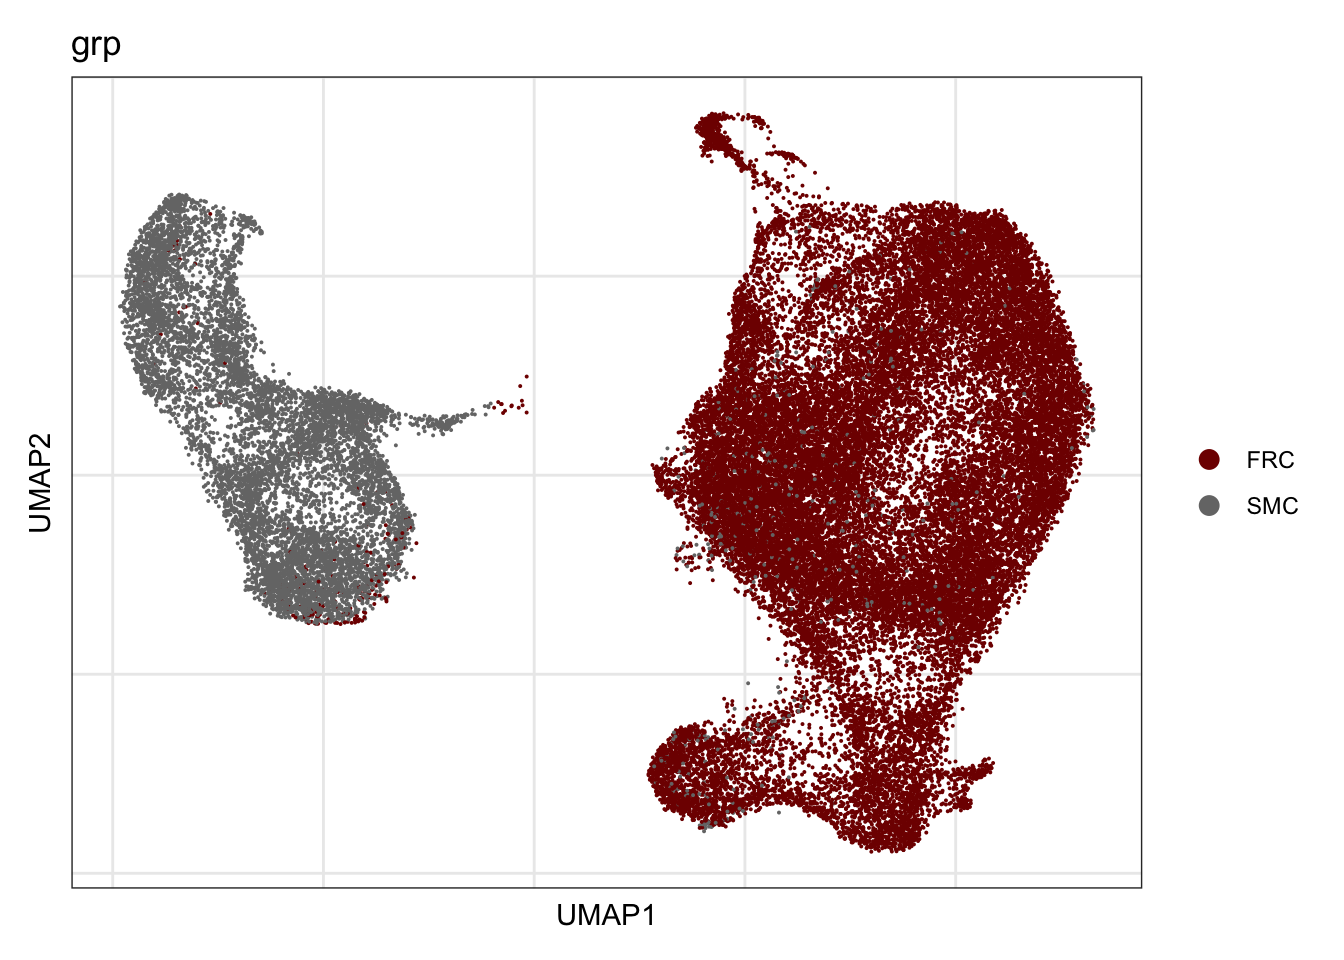
origin
## visualize input data
DimPlot(seurat, reduction = "umap", cols=colOri, group.by = "origin")+
  theme_bw() +
  theme(axis.text = element_blank(), axis.ticks = element_blank(),
        panel.grid.minor = element_blank()) +
  xlab("UMAP1") +
  ylab("UMAP2")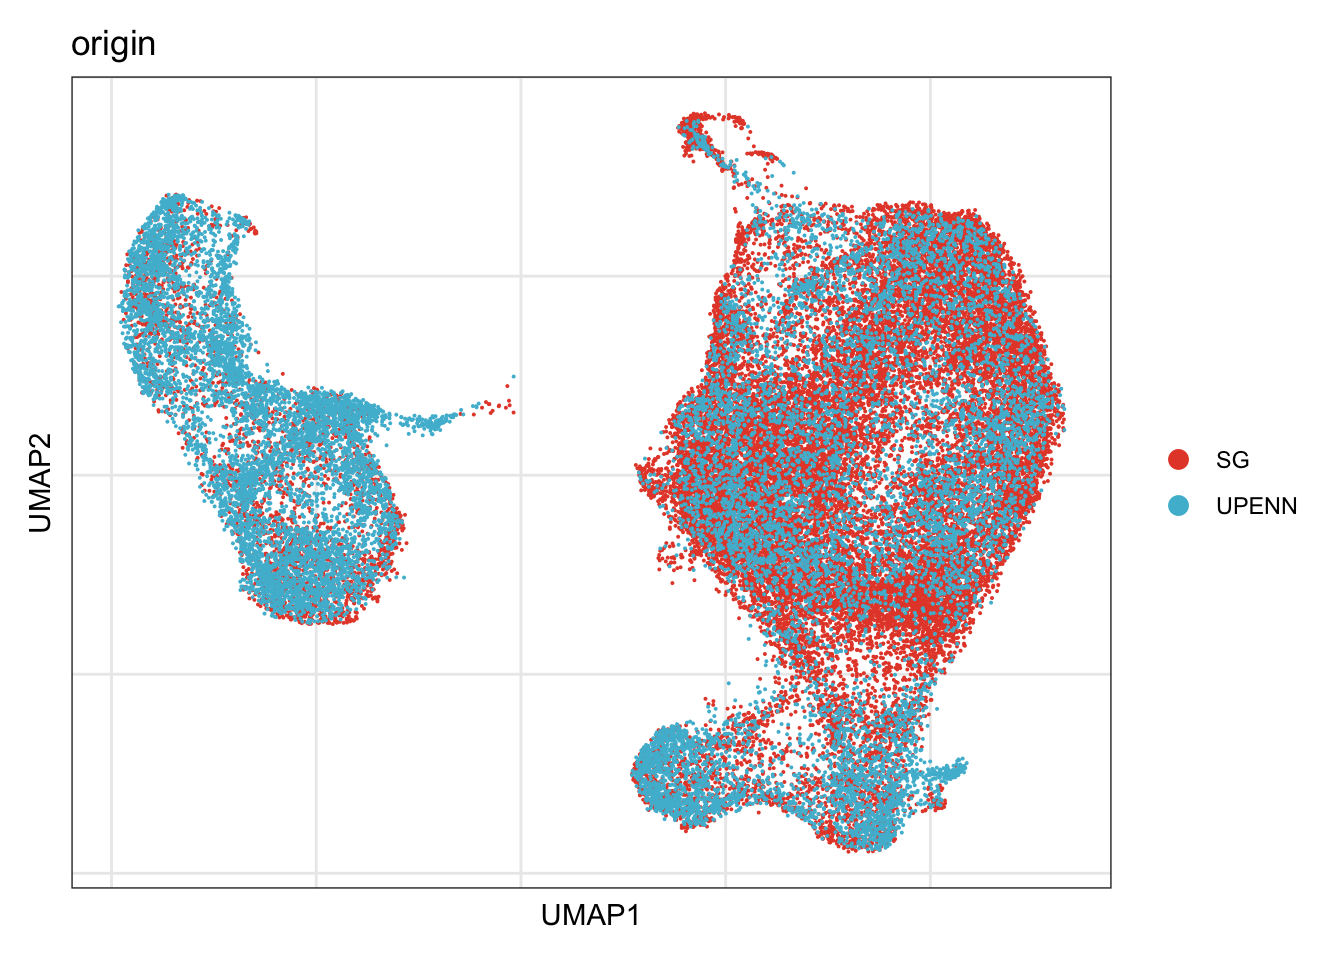
cw DE genes
sce <- as.SingleCellExperiment(seurat)
cluVec <- unique(sce$integrated_snn_res.0.25)

cwDE <- lapply(cluVec, function(cl){
  sceSub <- sce[,which(sce$integrated_snn_res.0.25 == cl)]
  m.out <- scoreMarkers(sceSub, sceSub$cond2)
  condVec <- unique(names(m.out))
  outCW <- lapply(condVec, function(co){
    outSub <- data.frame(m.out@listData[[co]]) %>%
      rownames_to_column(var = "gene") %>%
      slice_max(., order_by=mean.logFC.cohen, n=100) %>%
      mutate(condCl=paste0(co, "_", cl)) %>%
      mutate(cluster=cl)
  })
  outDat <- do.call("rbind", outCW)
})

cwDEdat <- do.call("rbind", cwDE)
vis top genes Pi16+RC activated
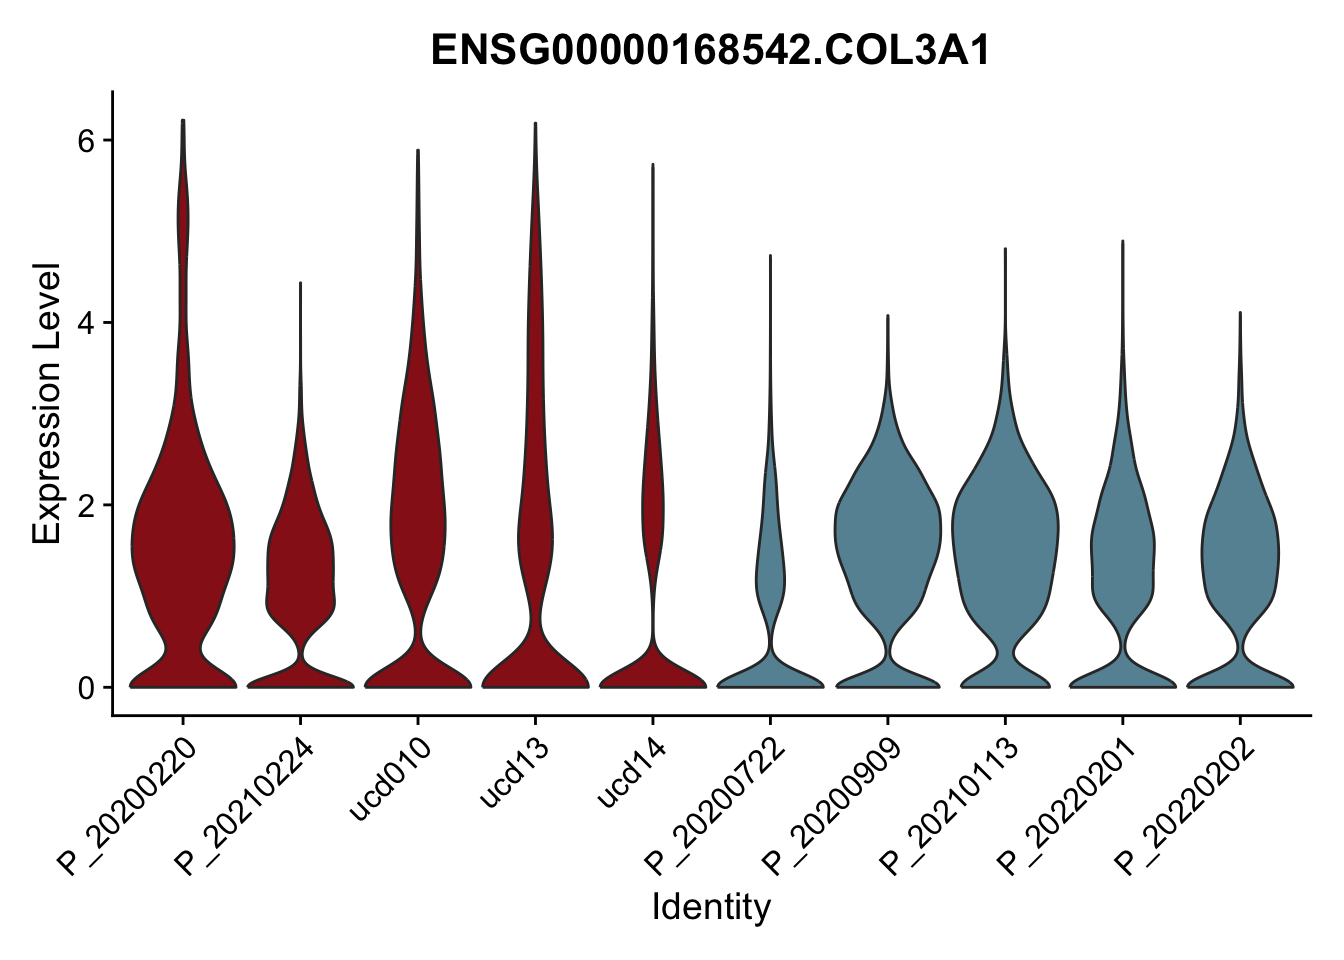
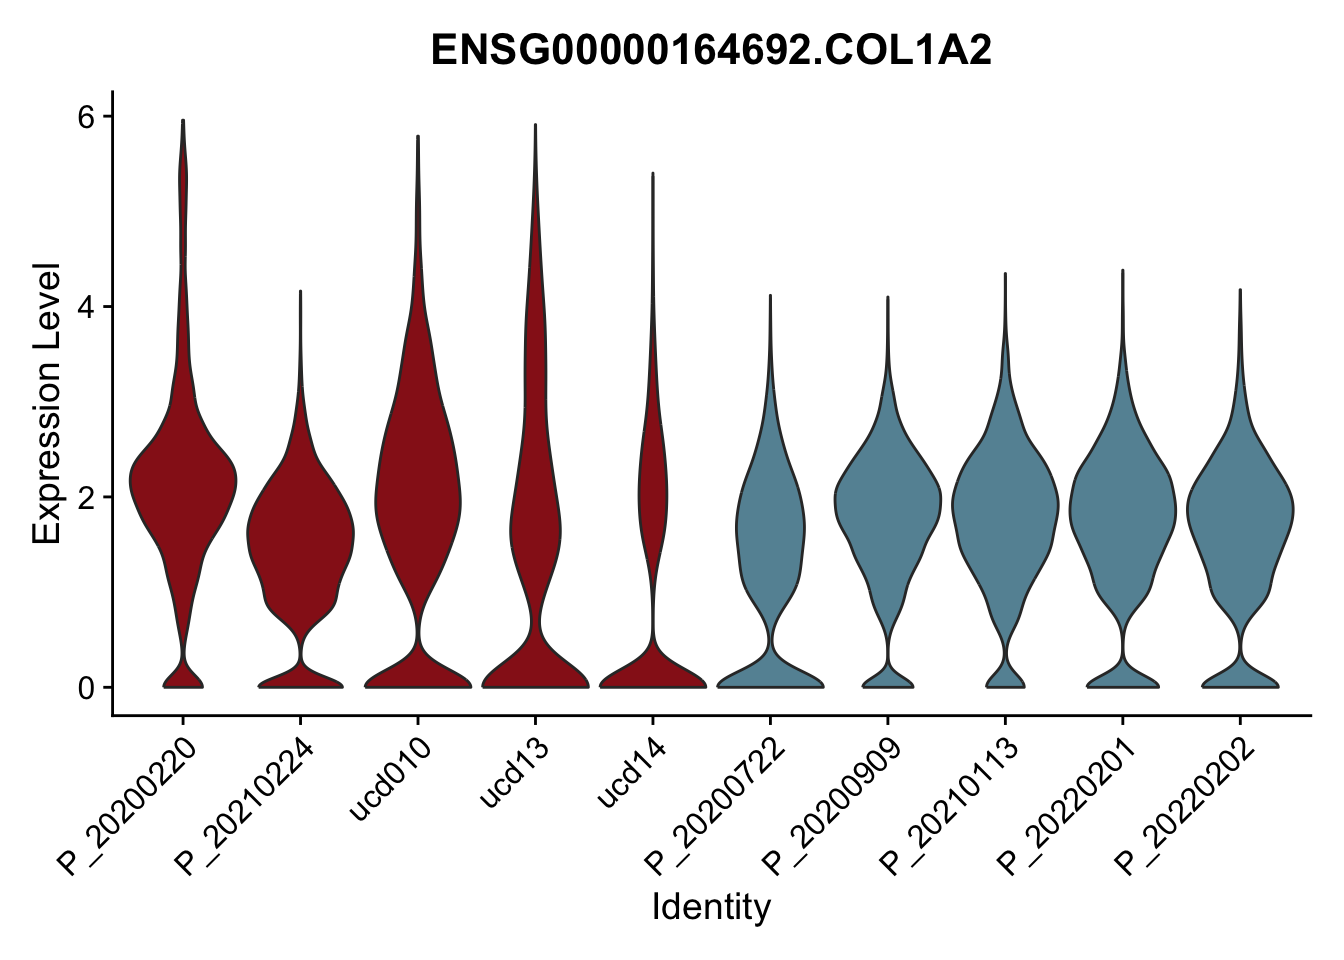
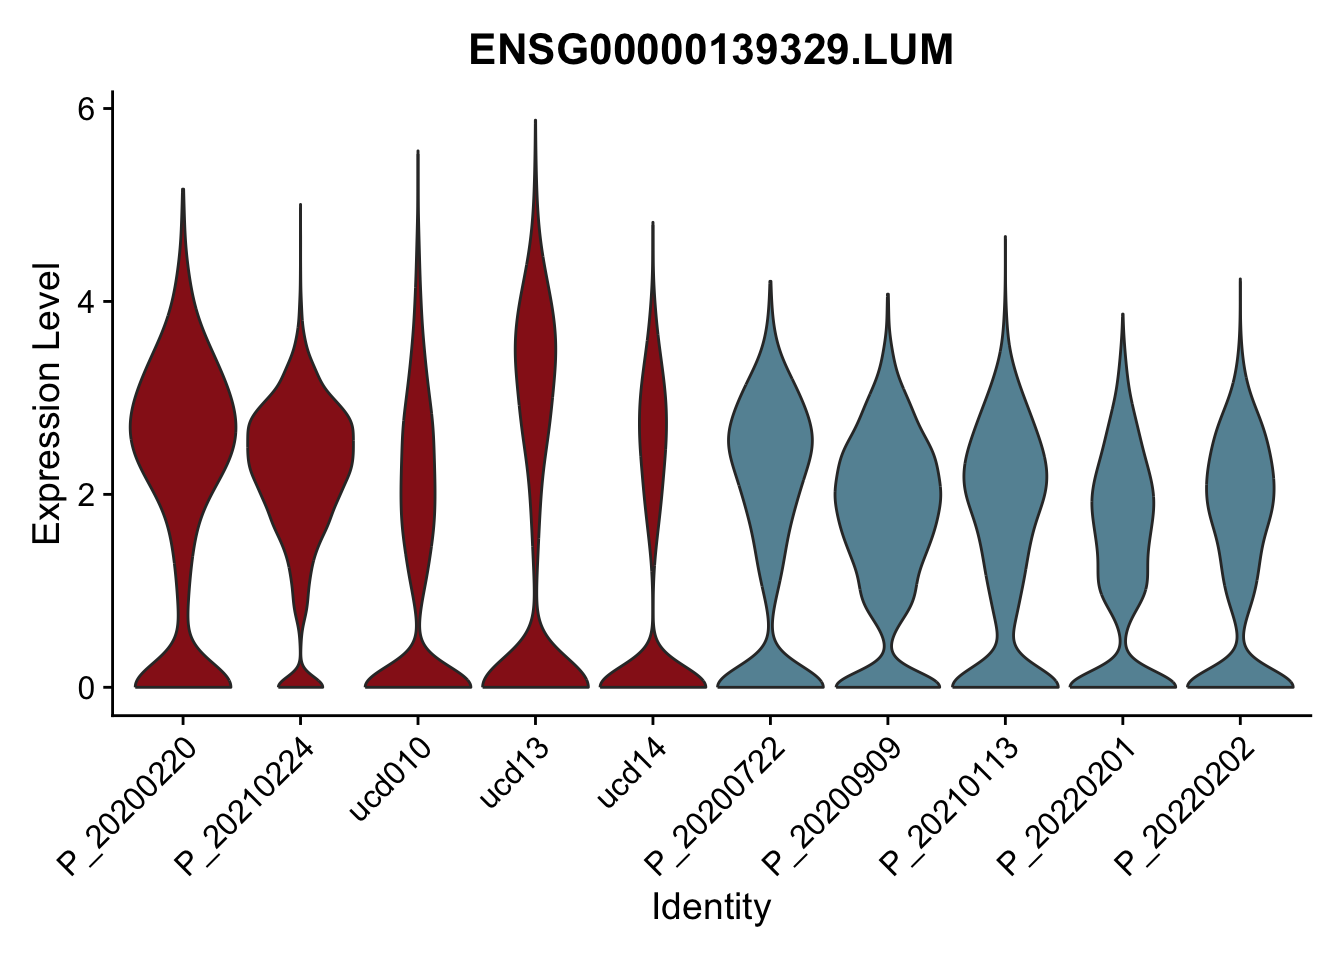
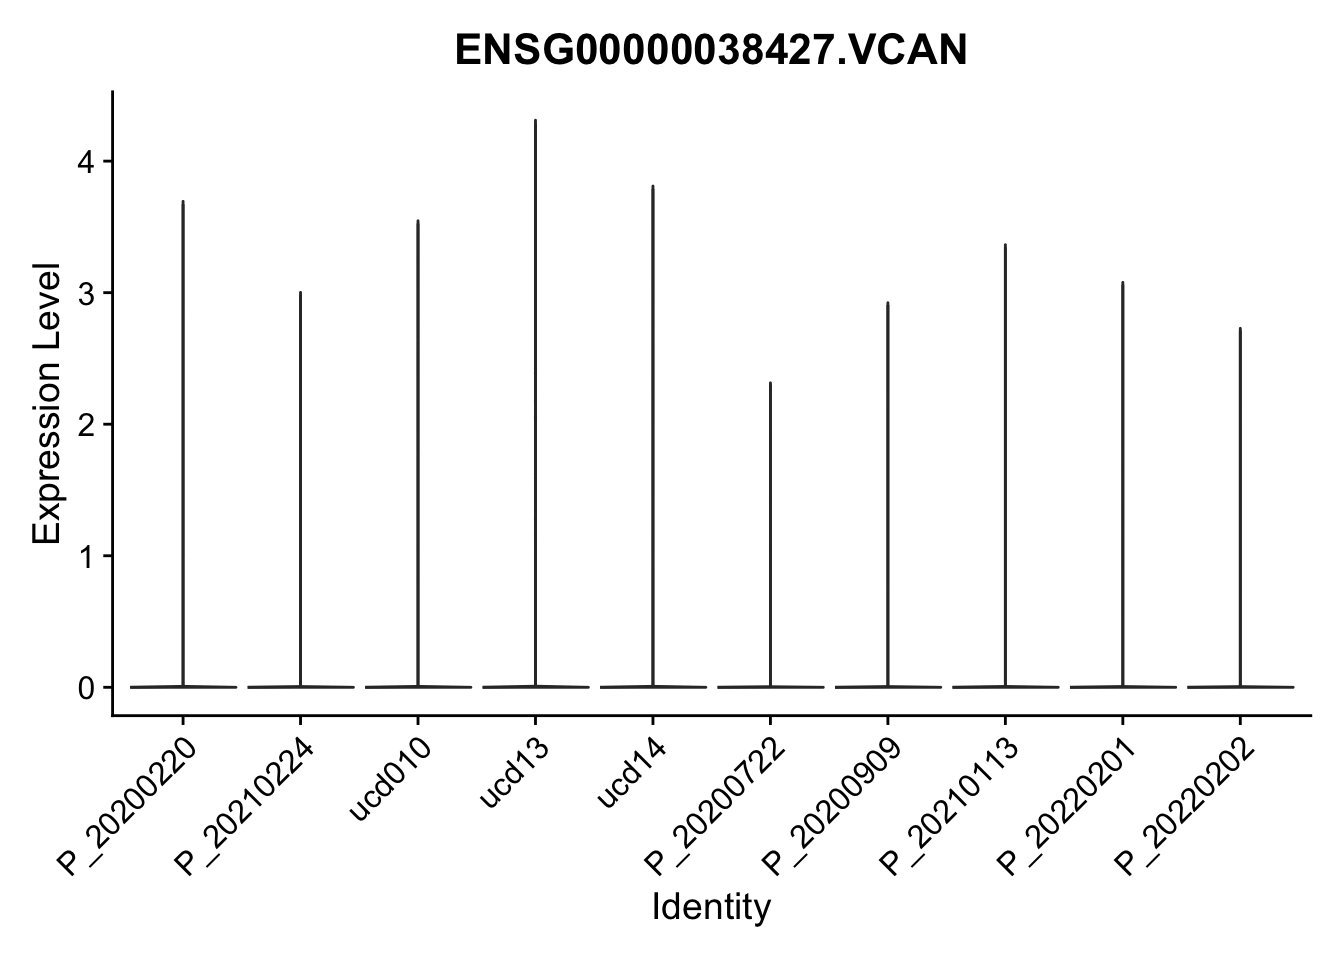
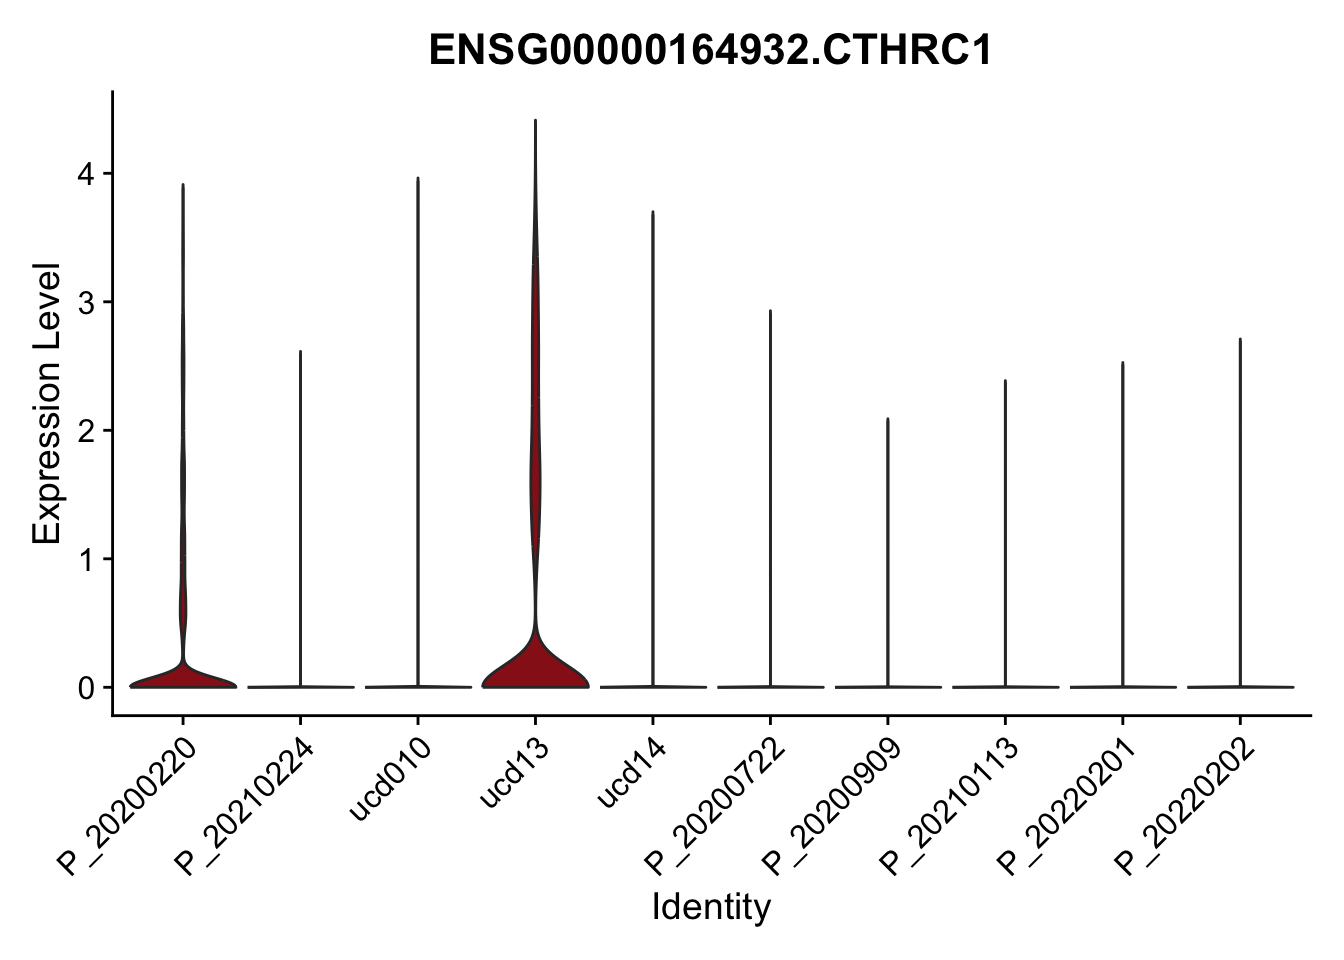
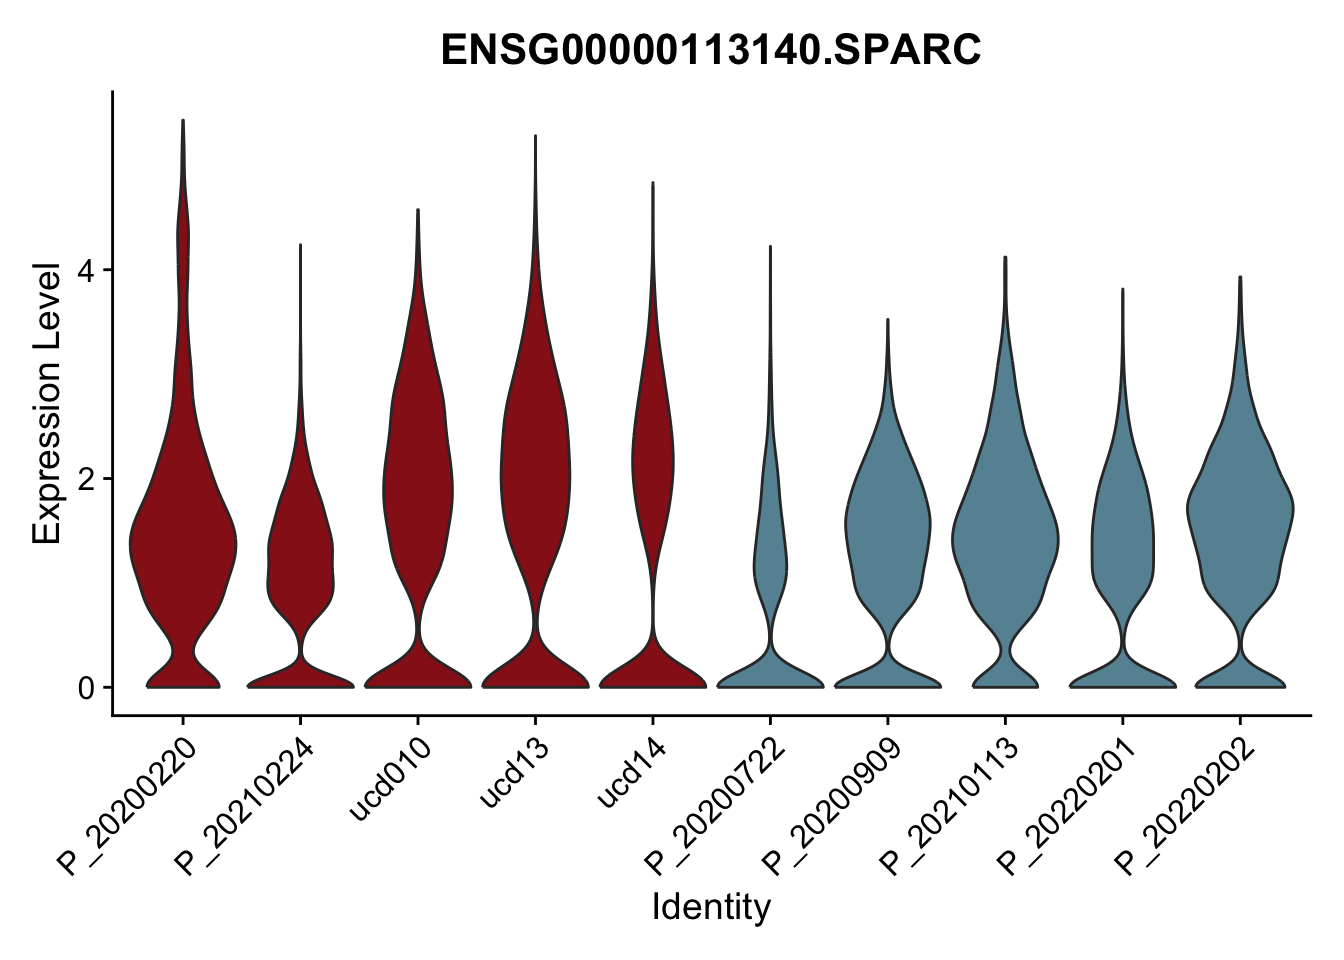
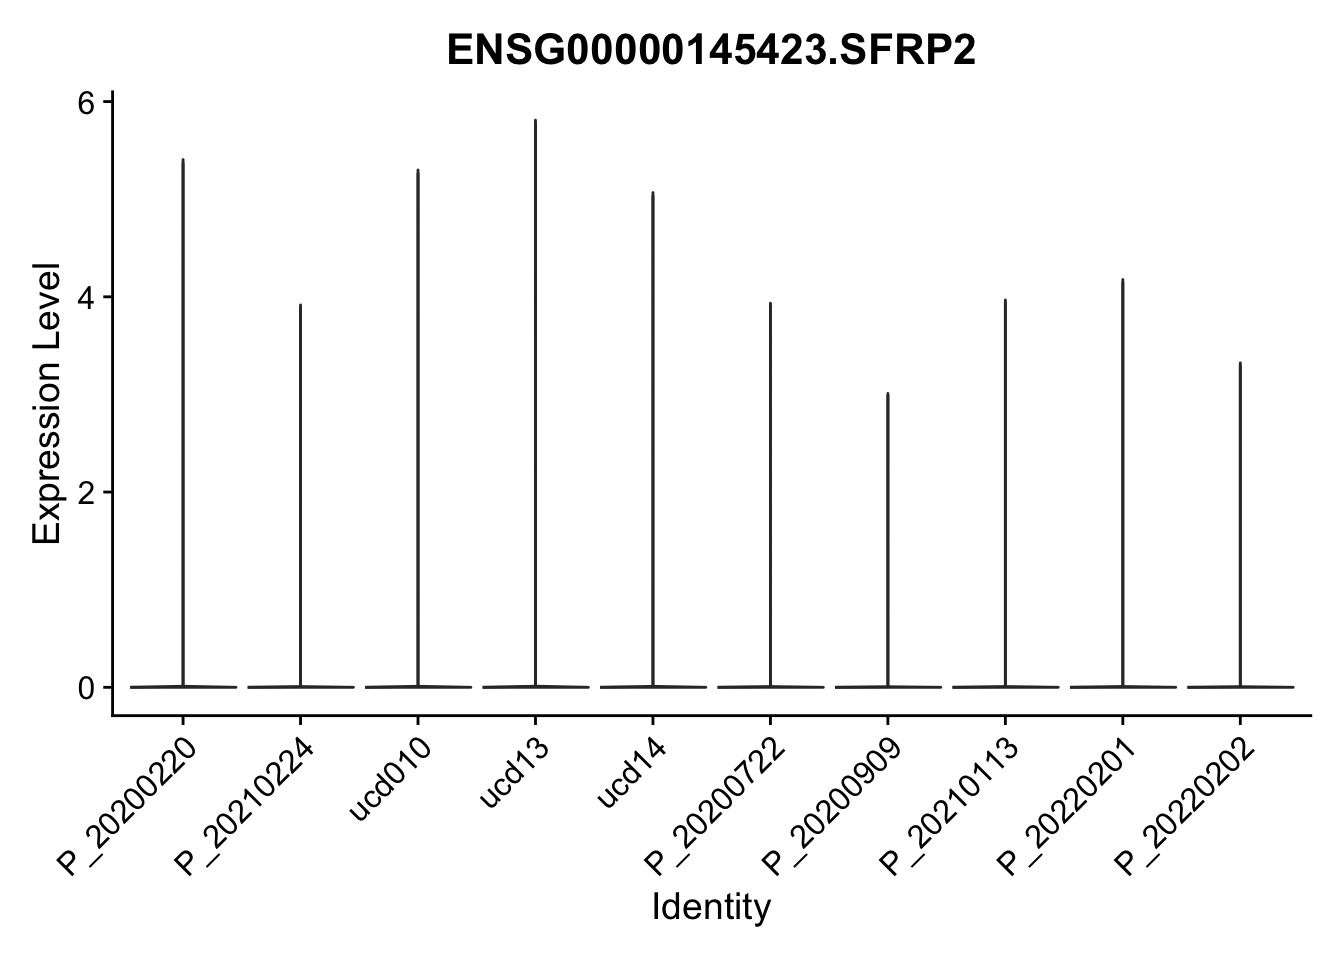
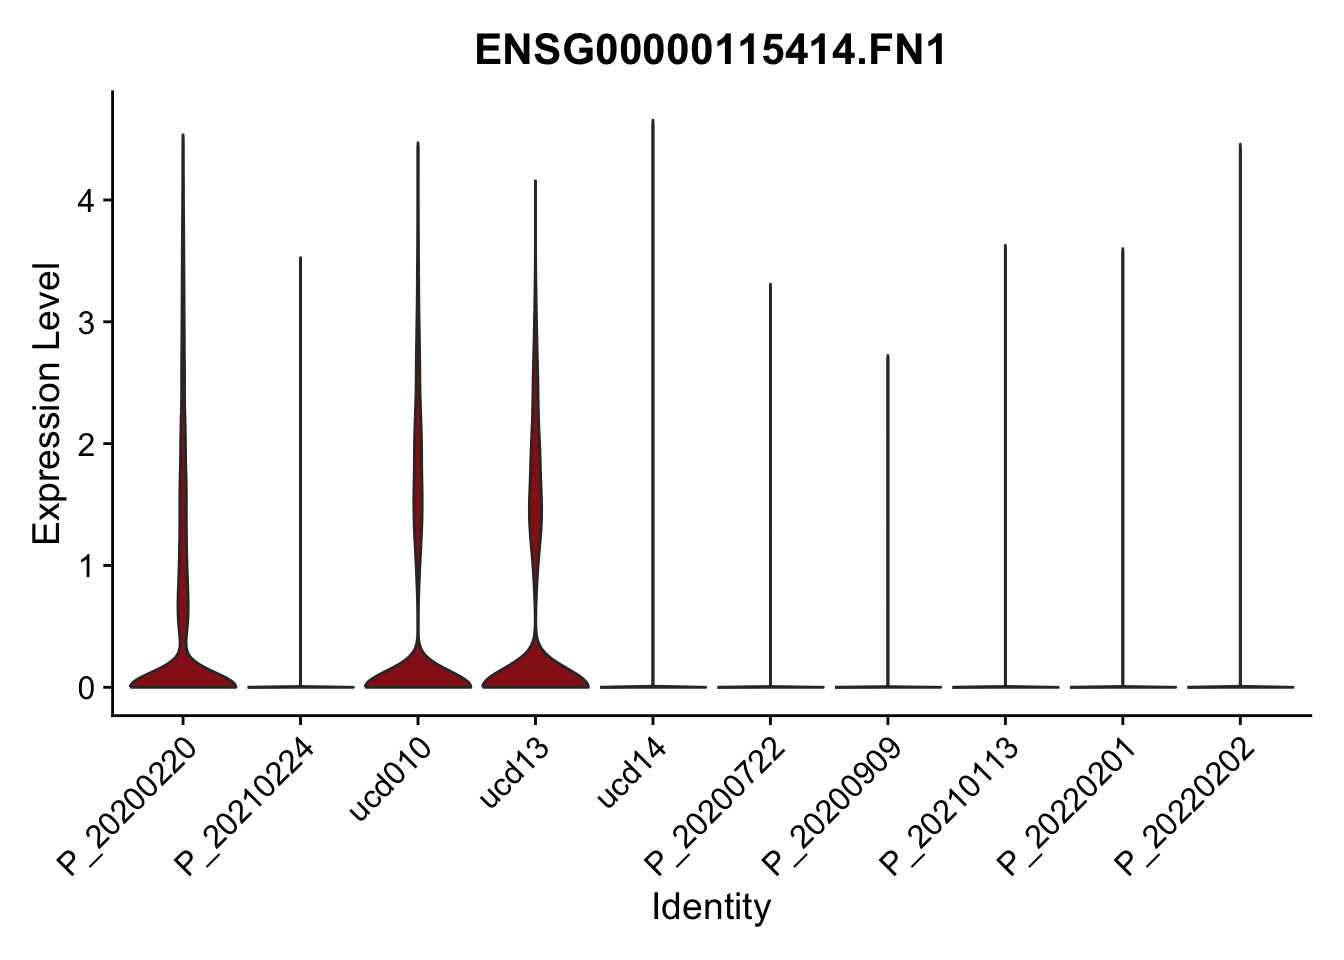
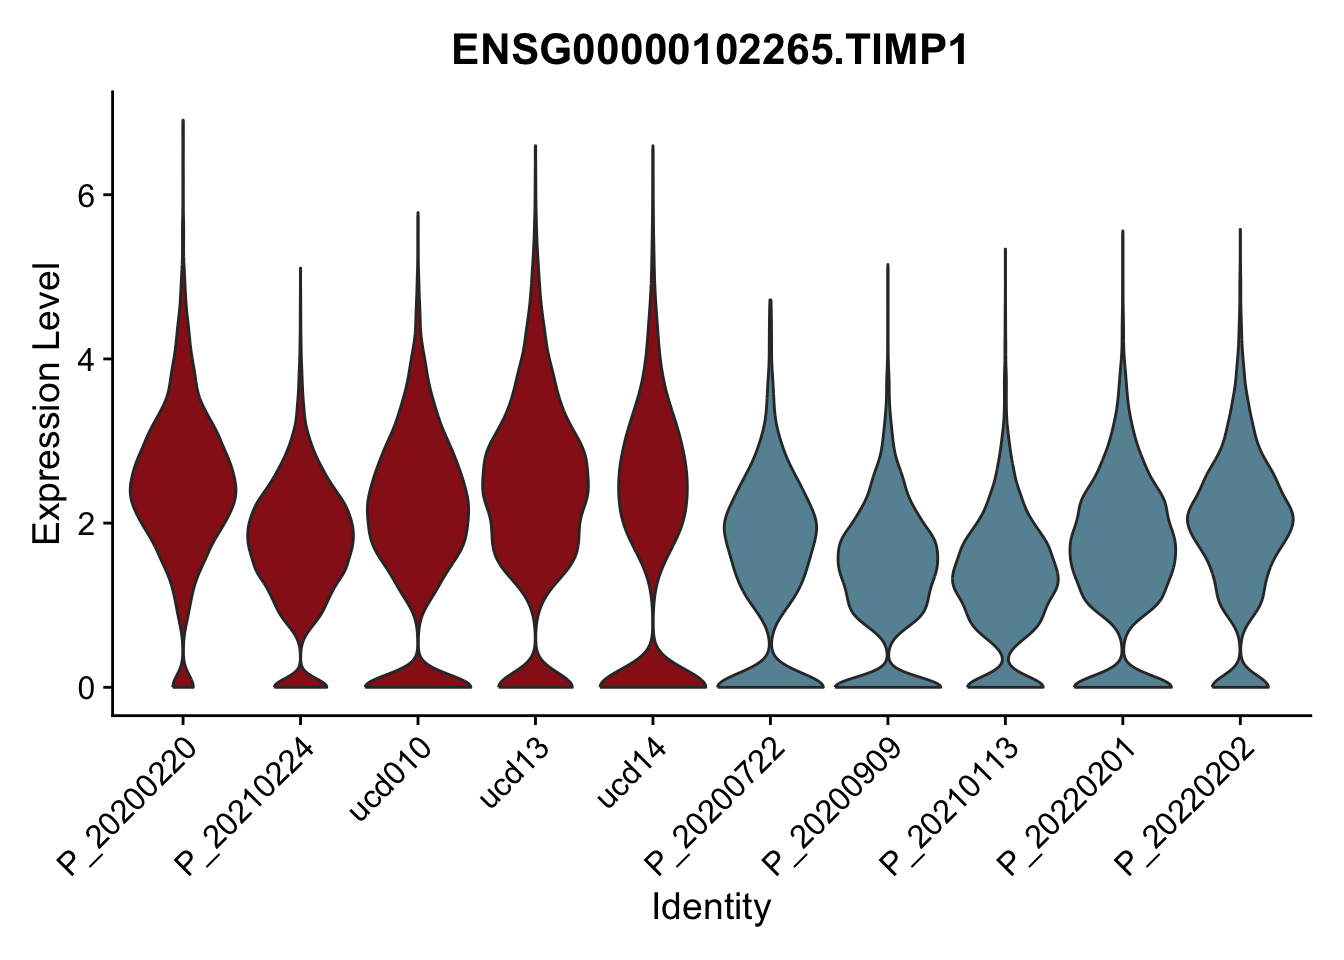
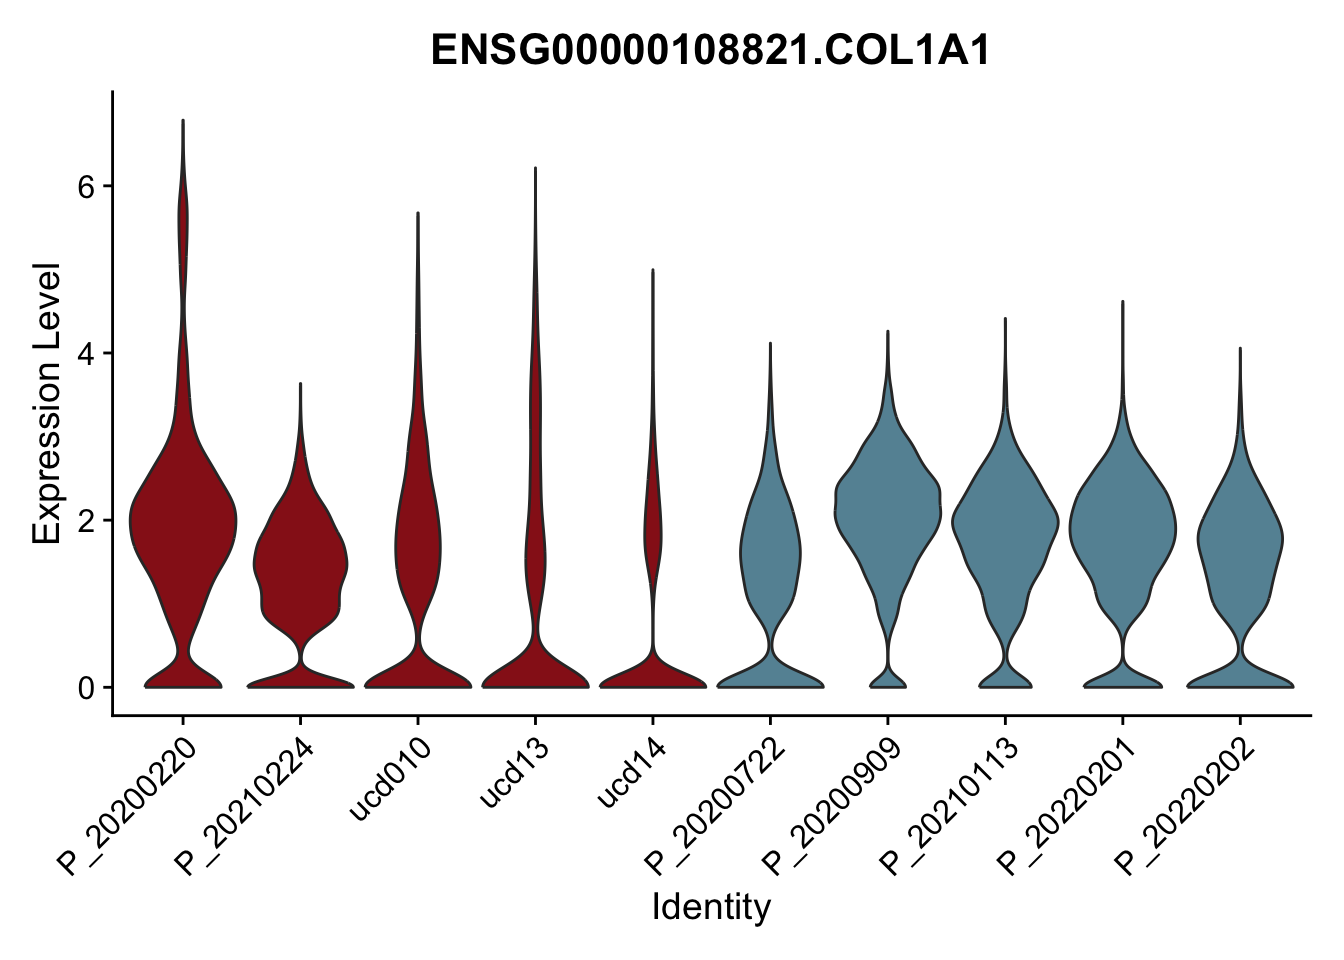
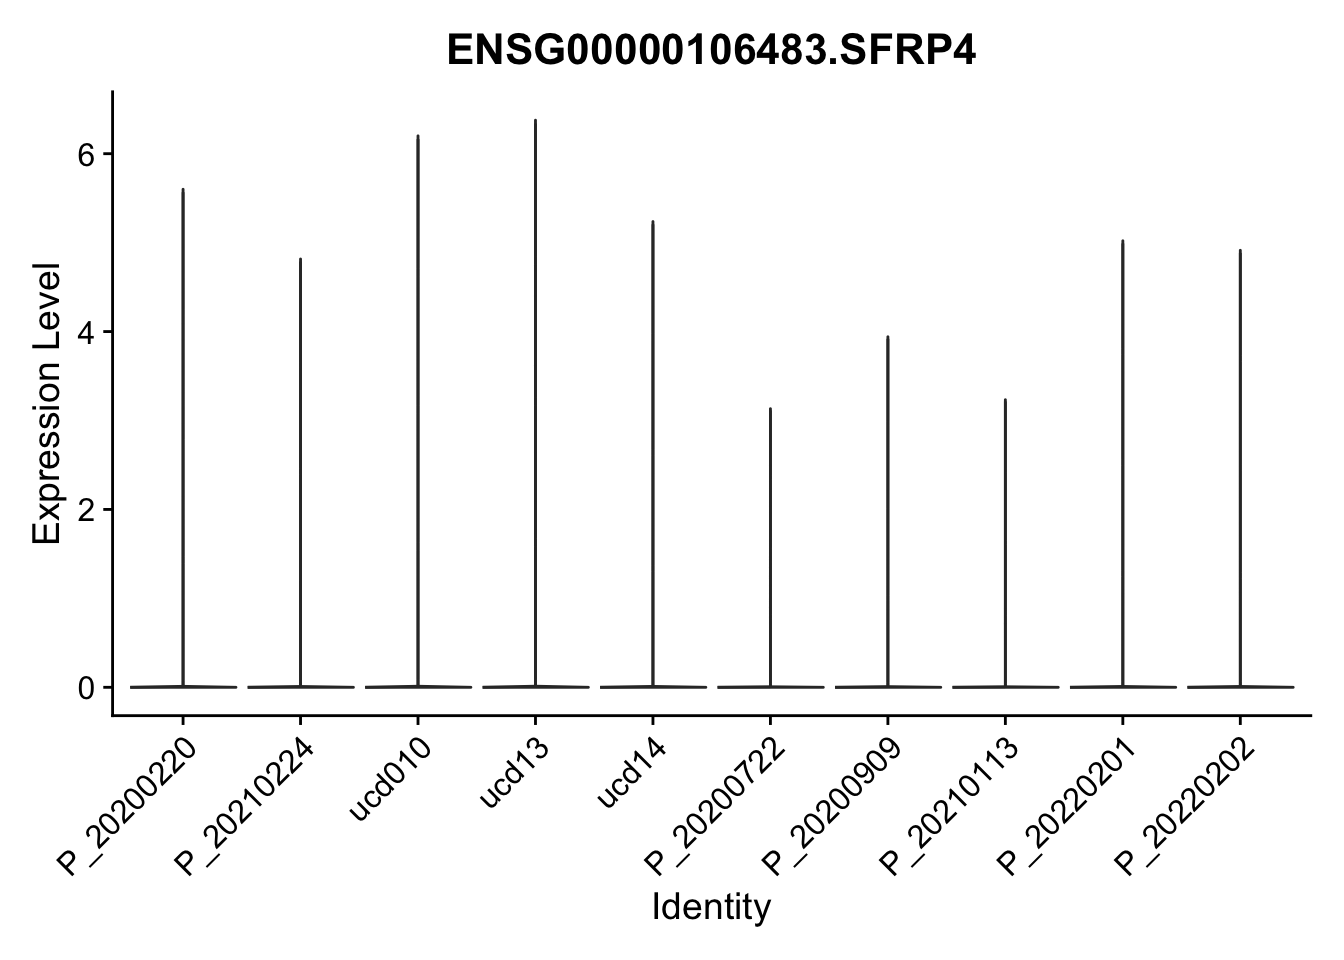
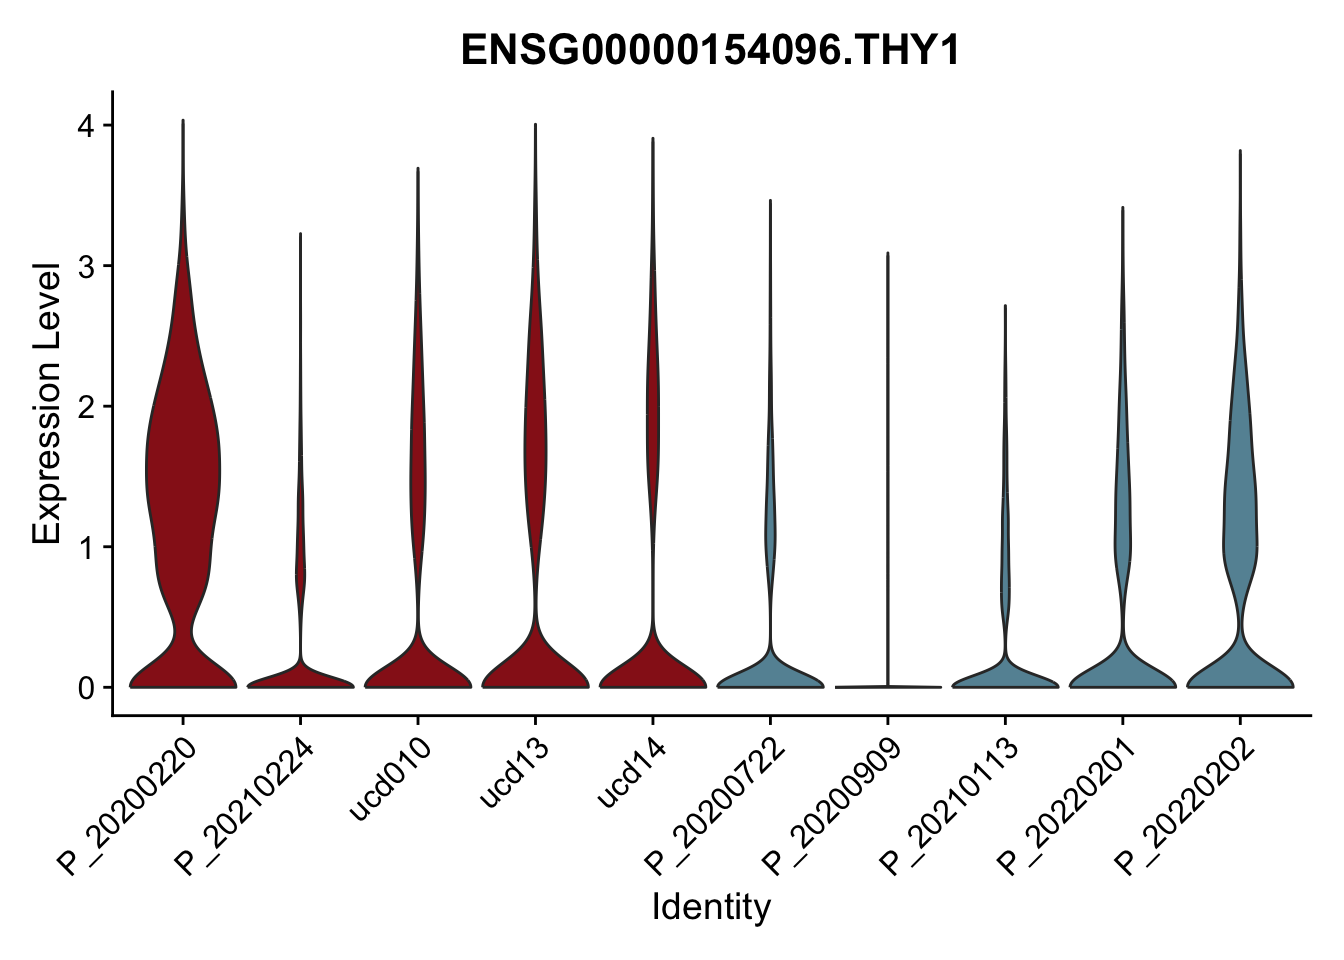
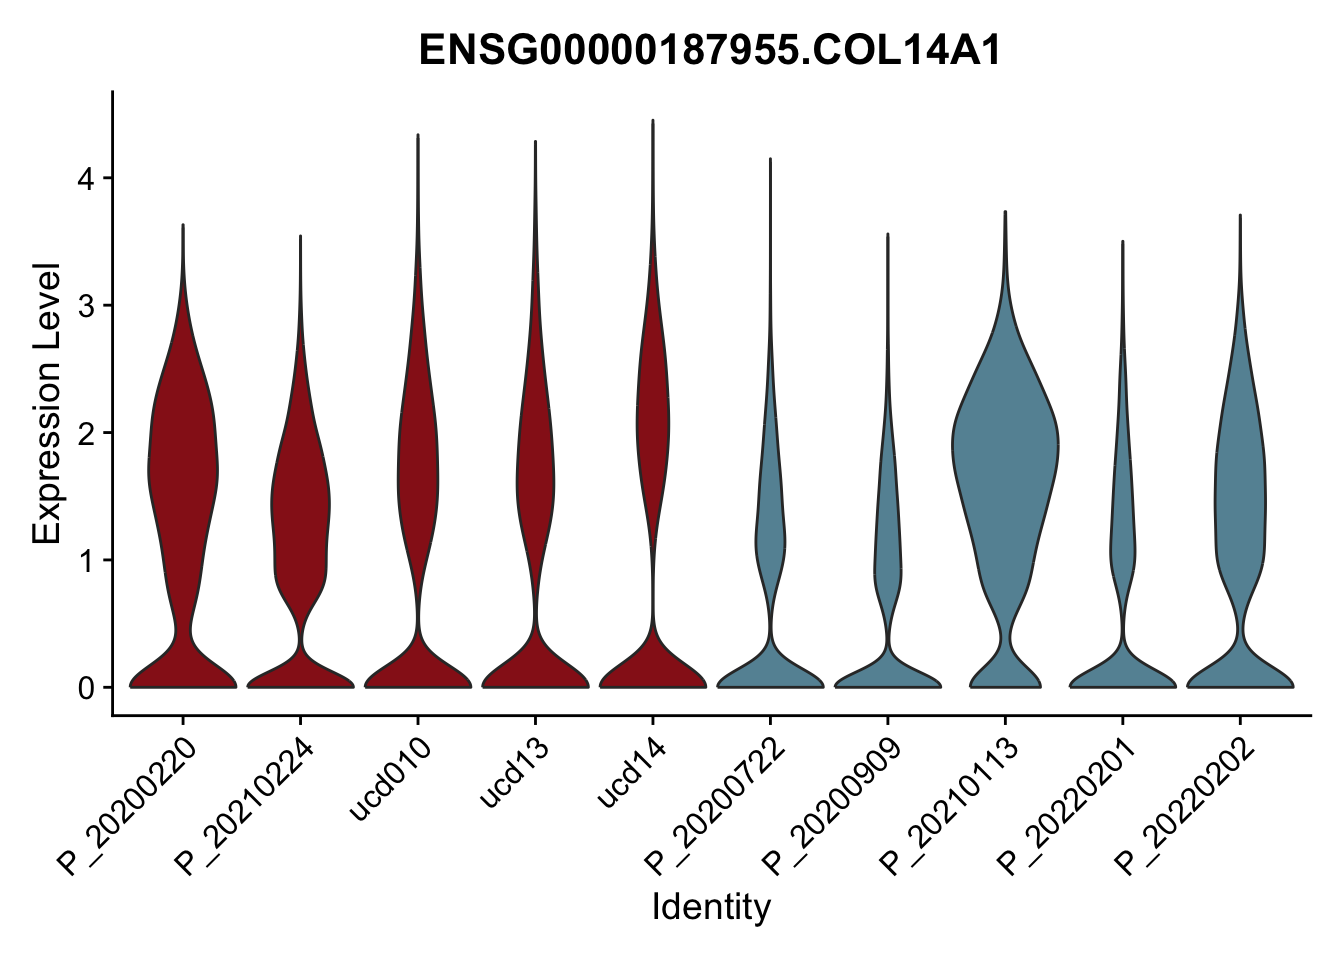
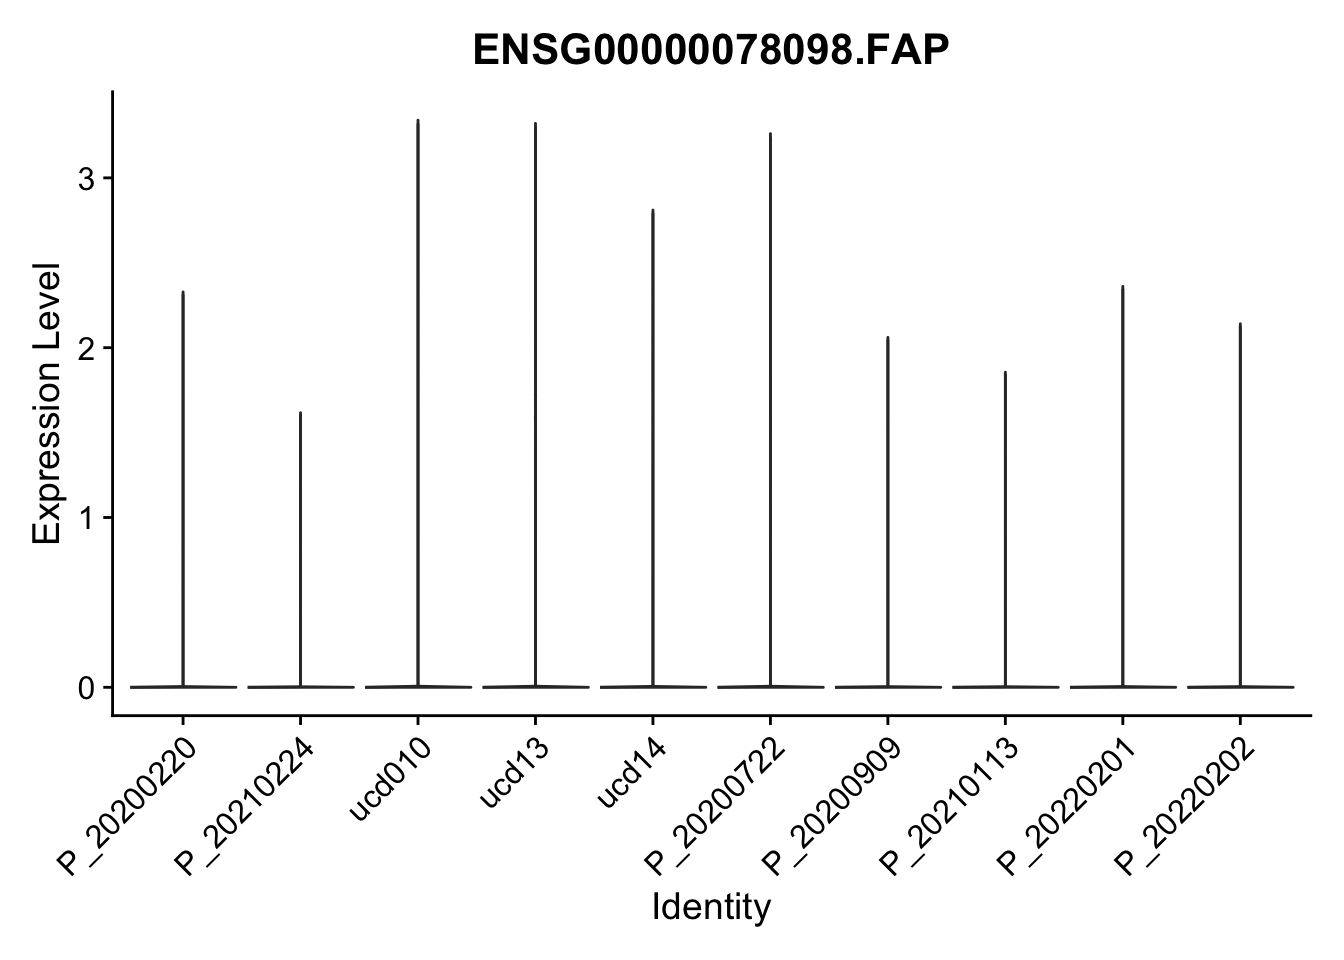
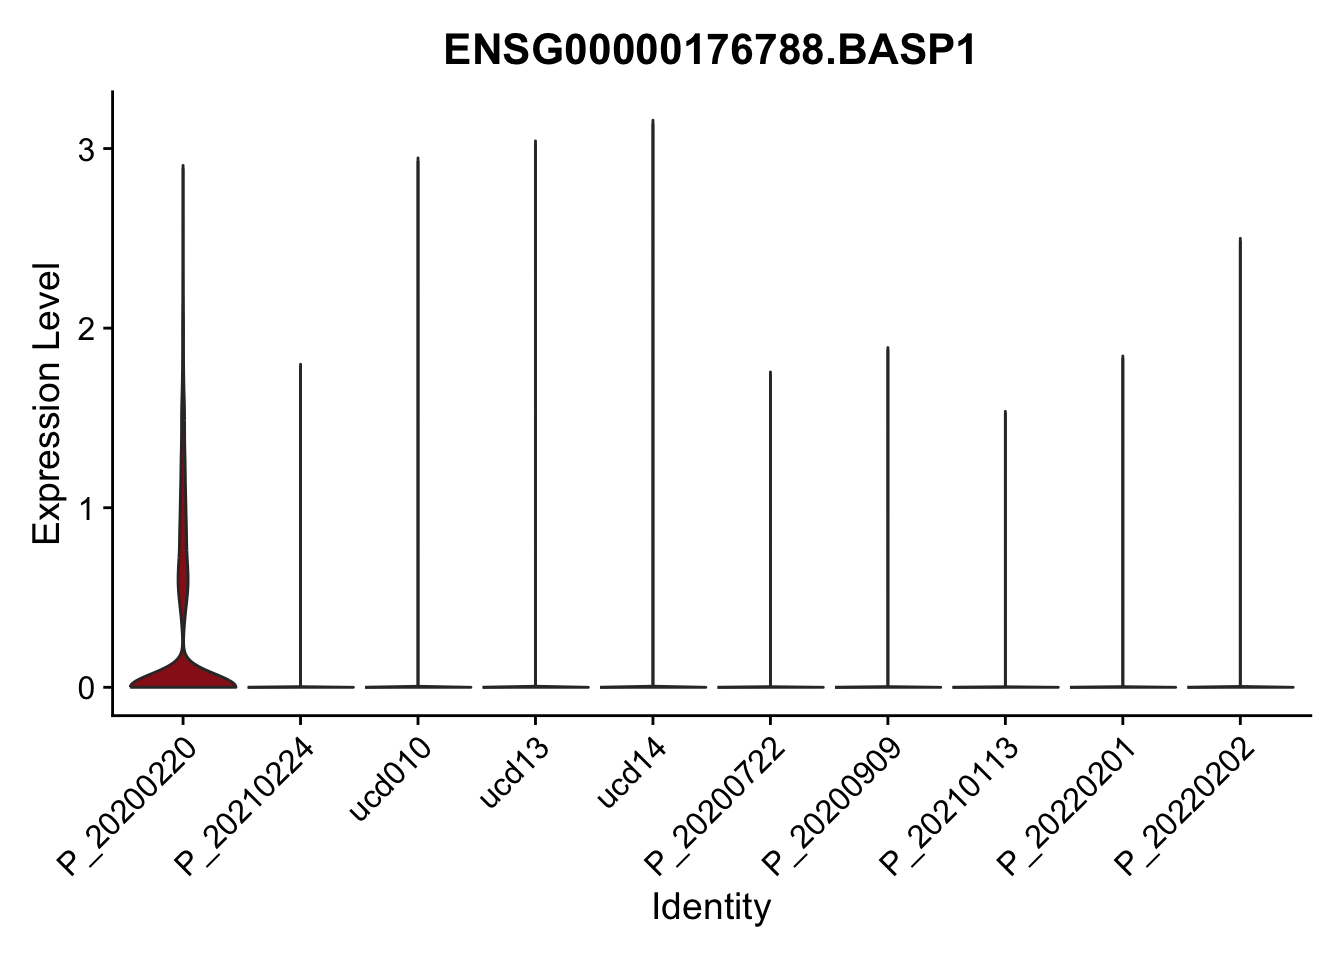
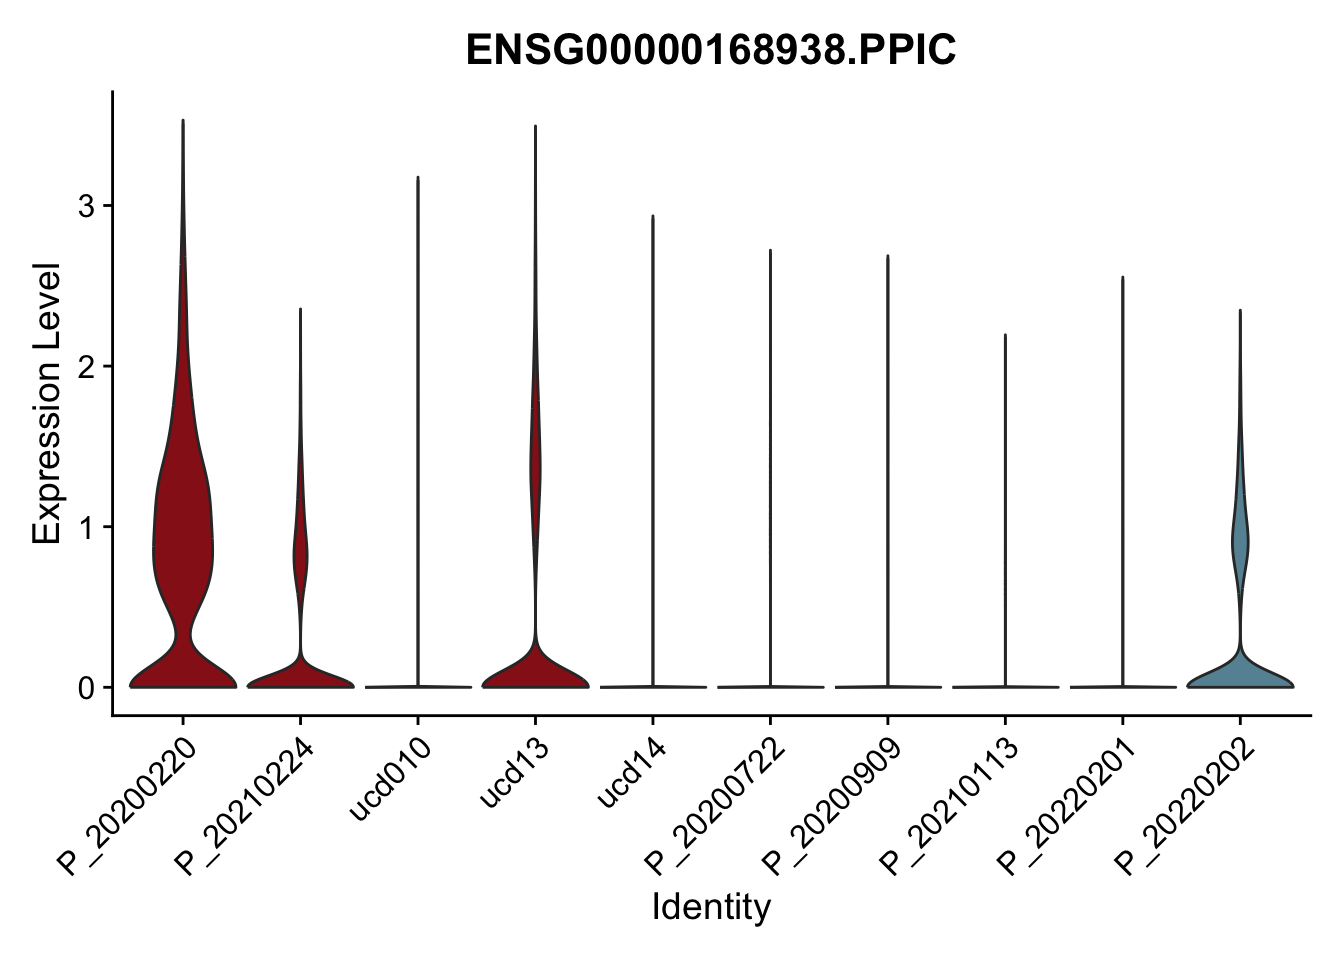
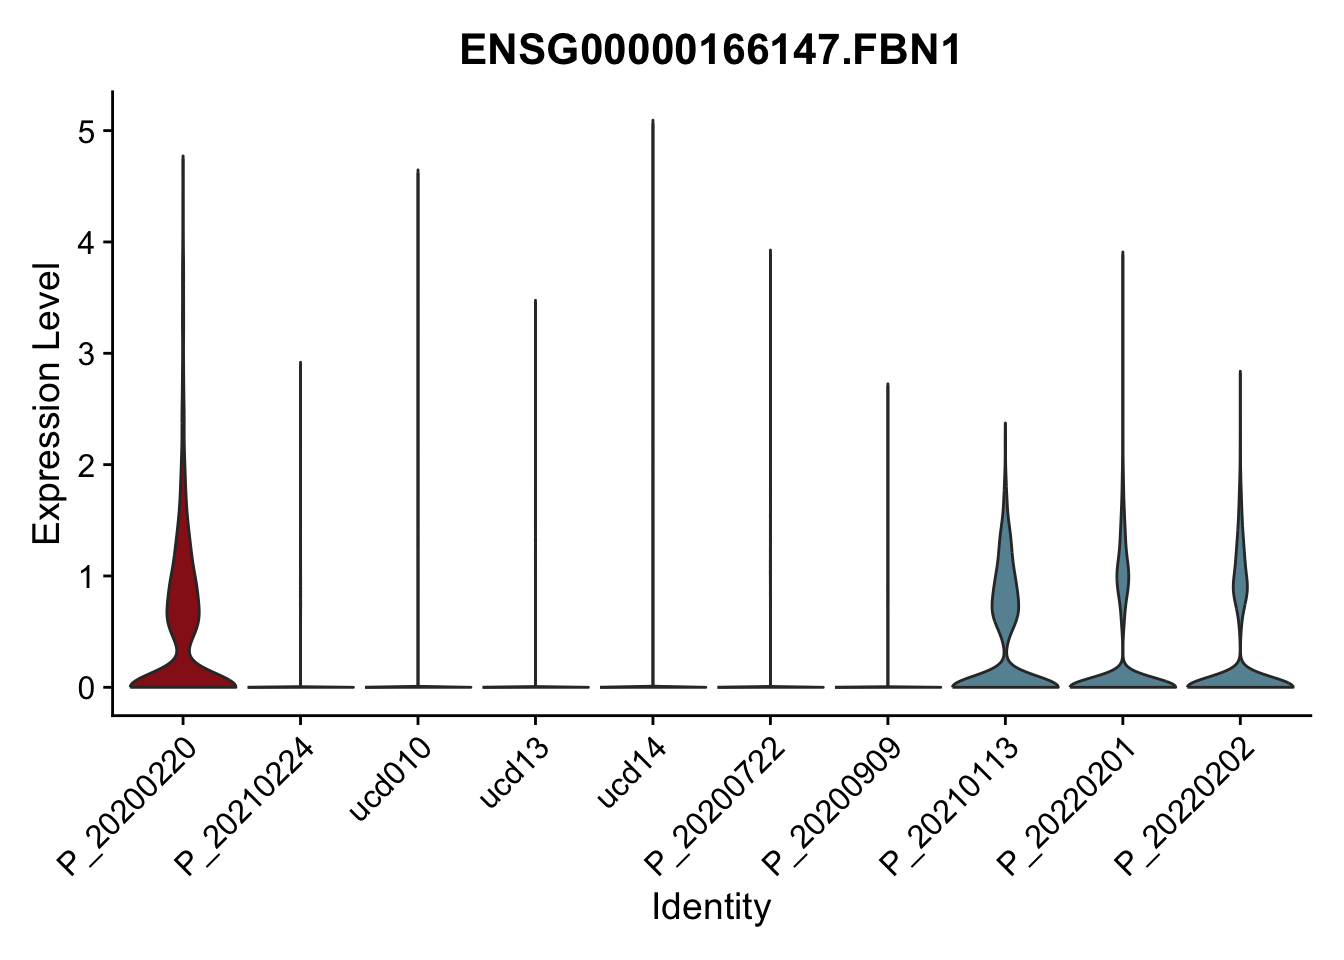
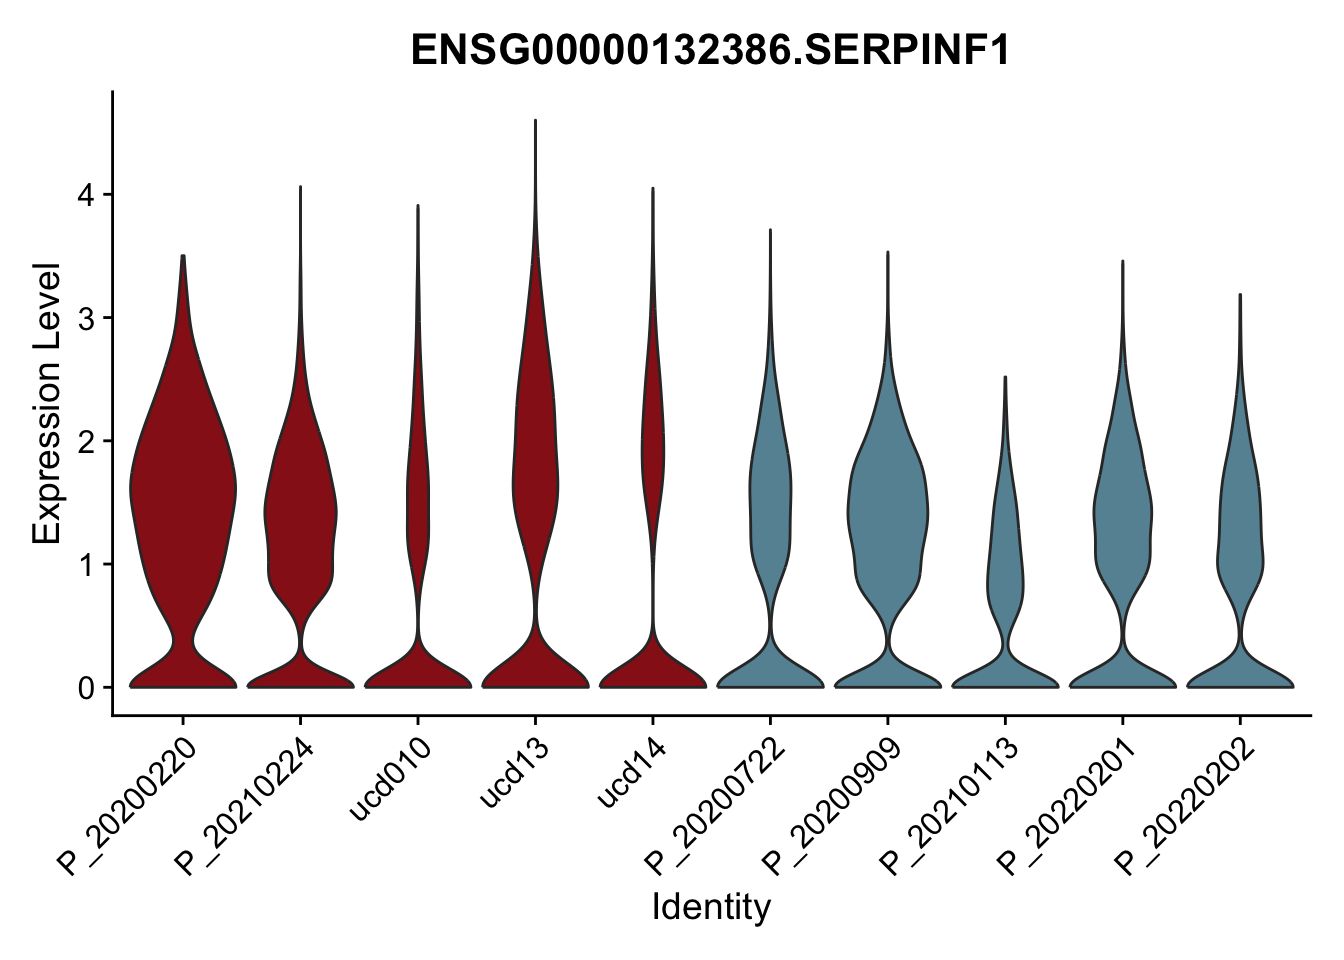
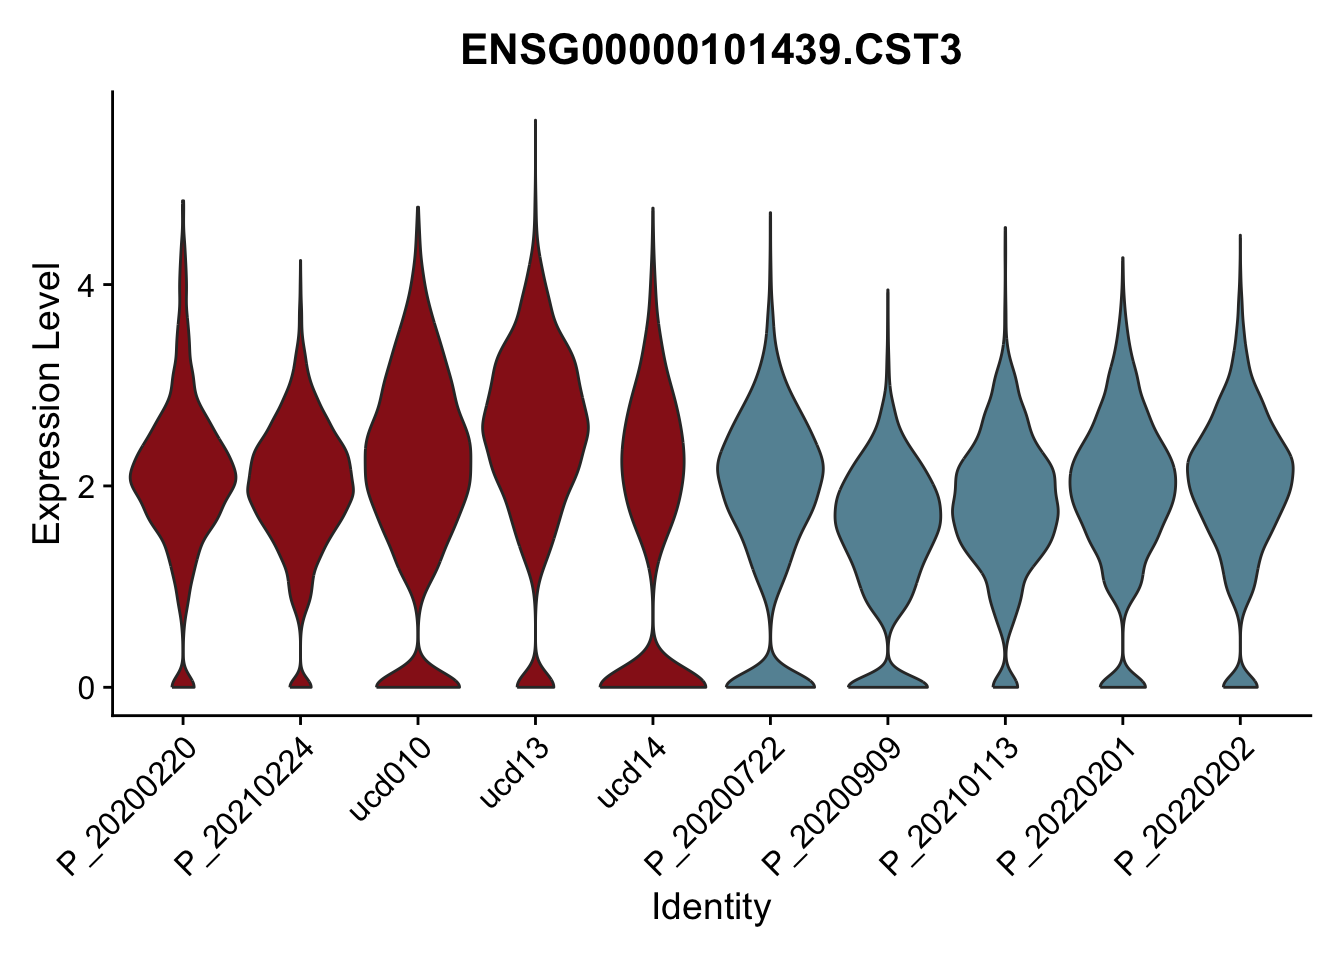
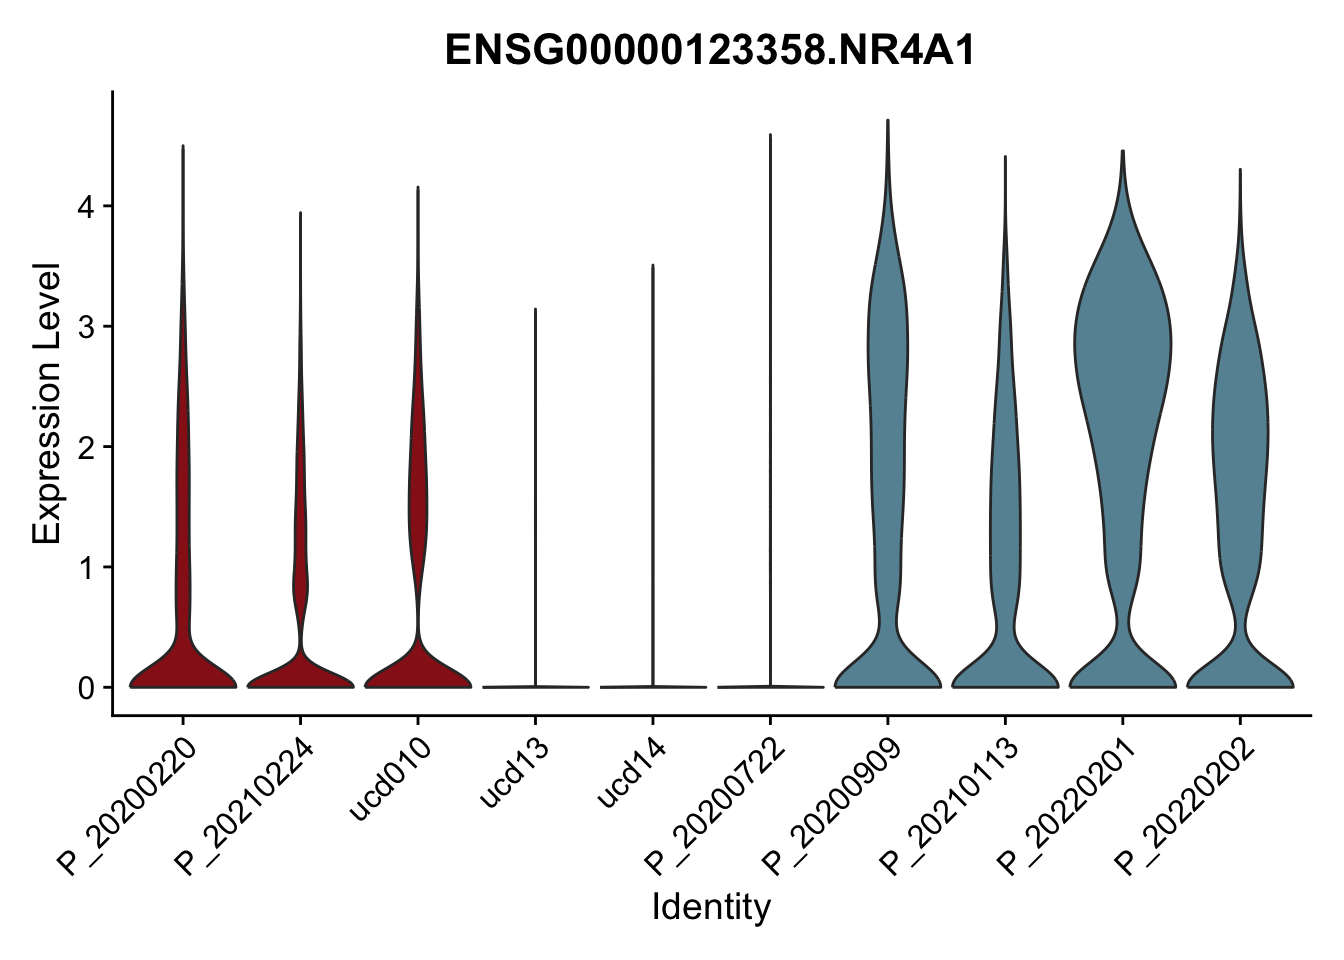
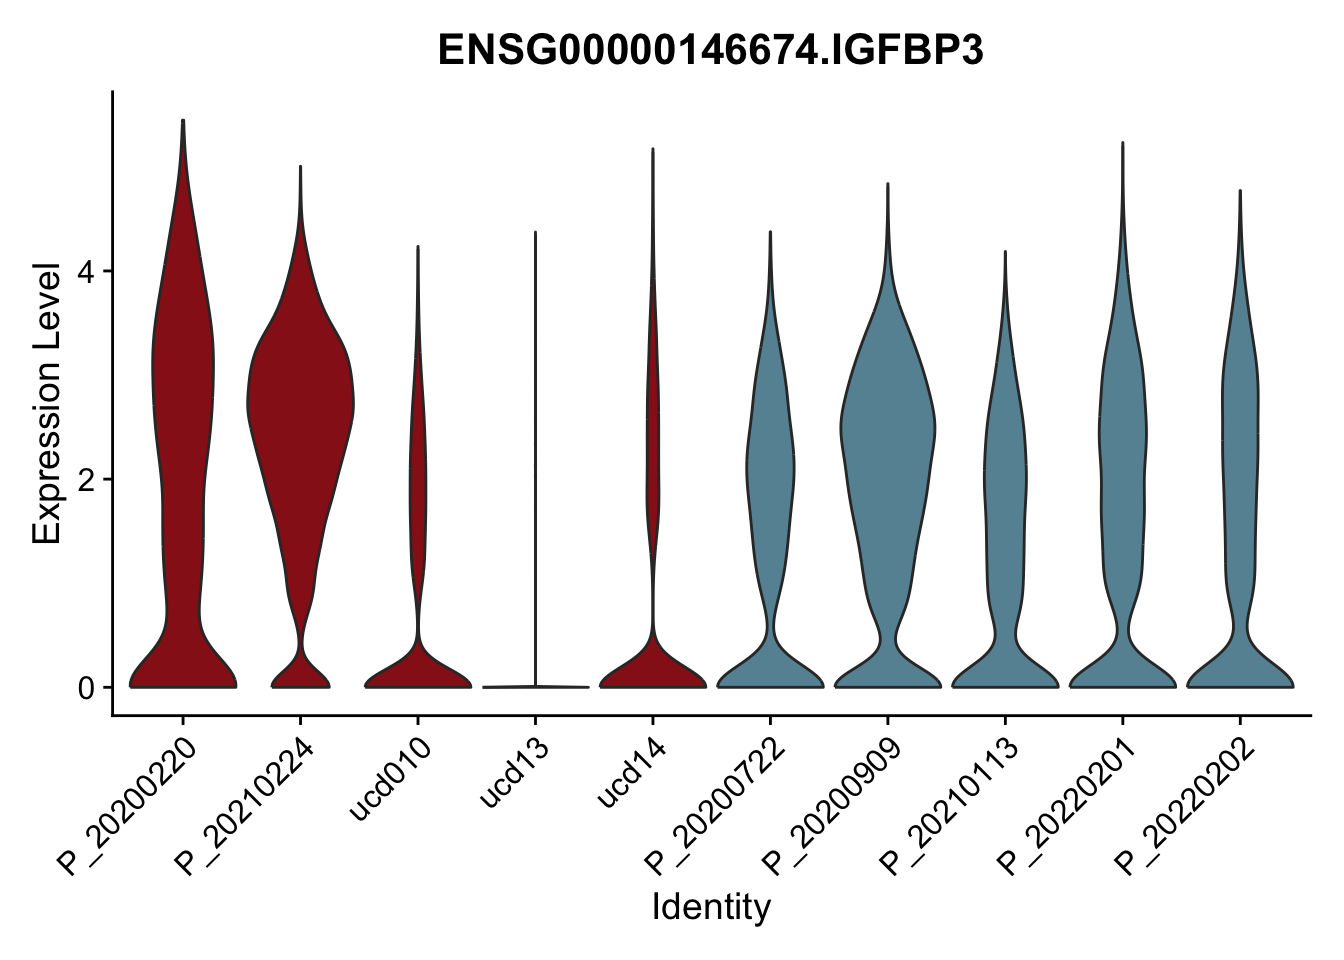
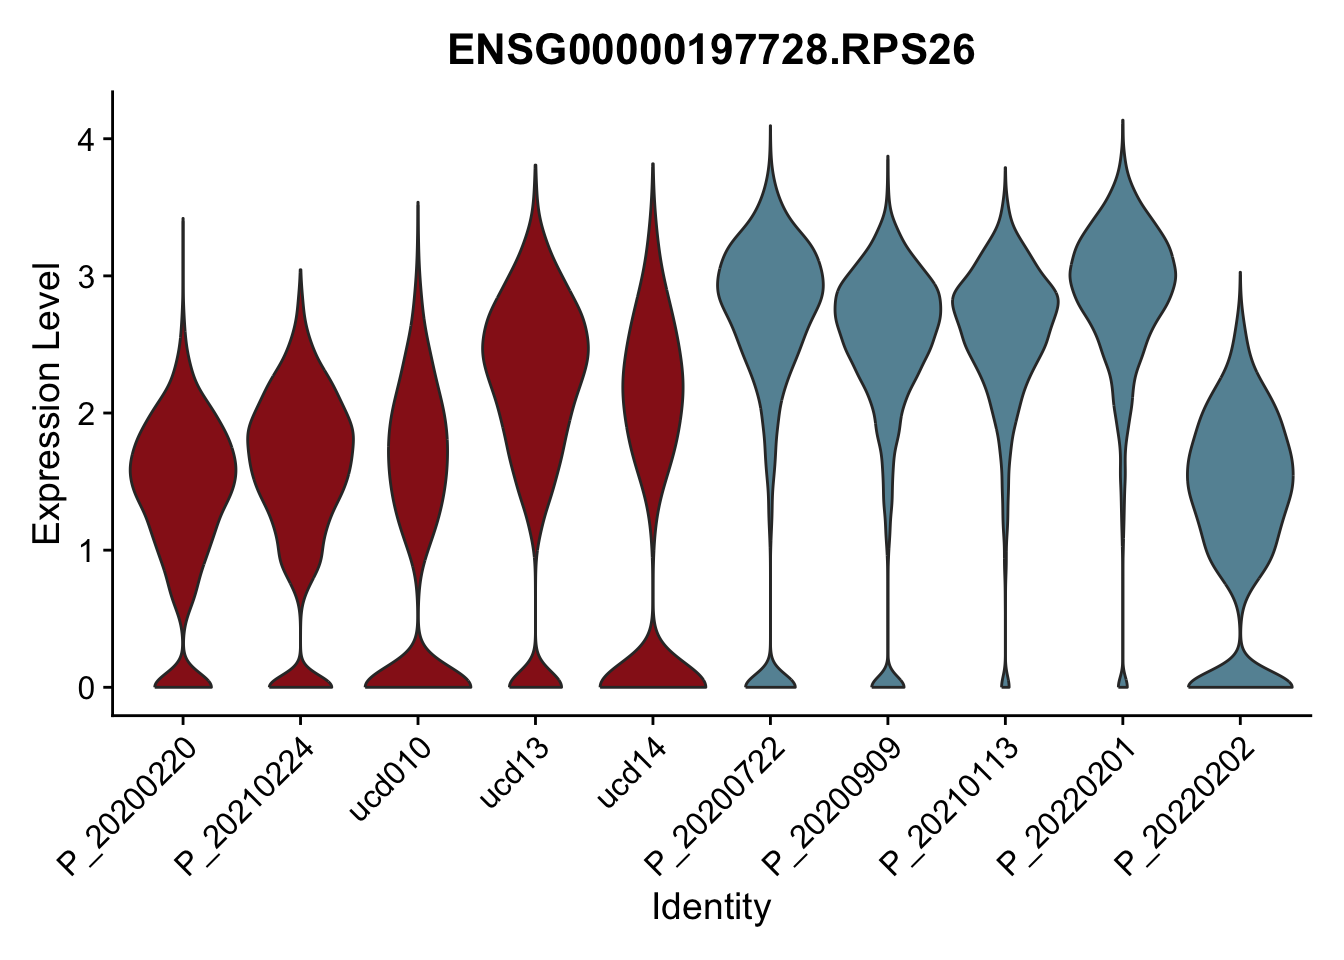
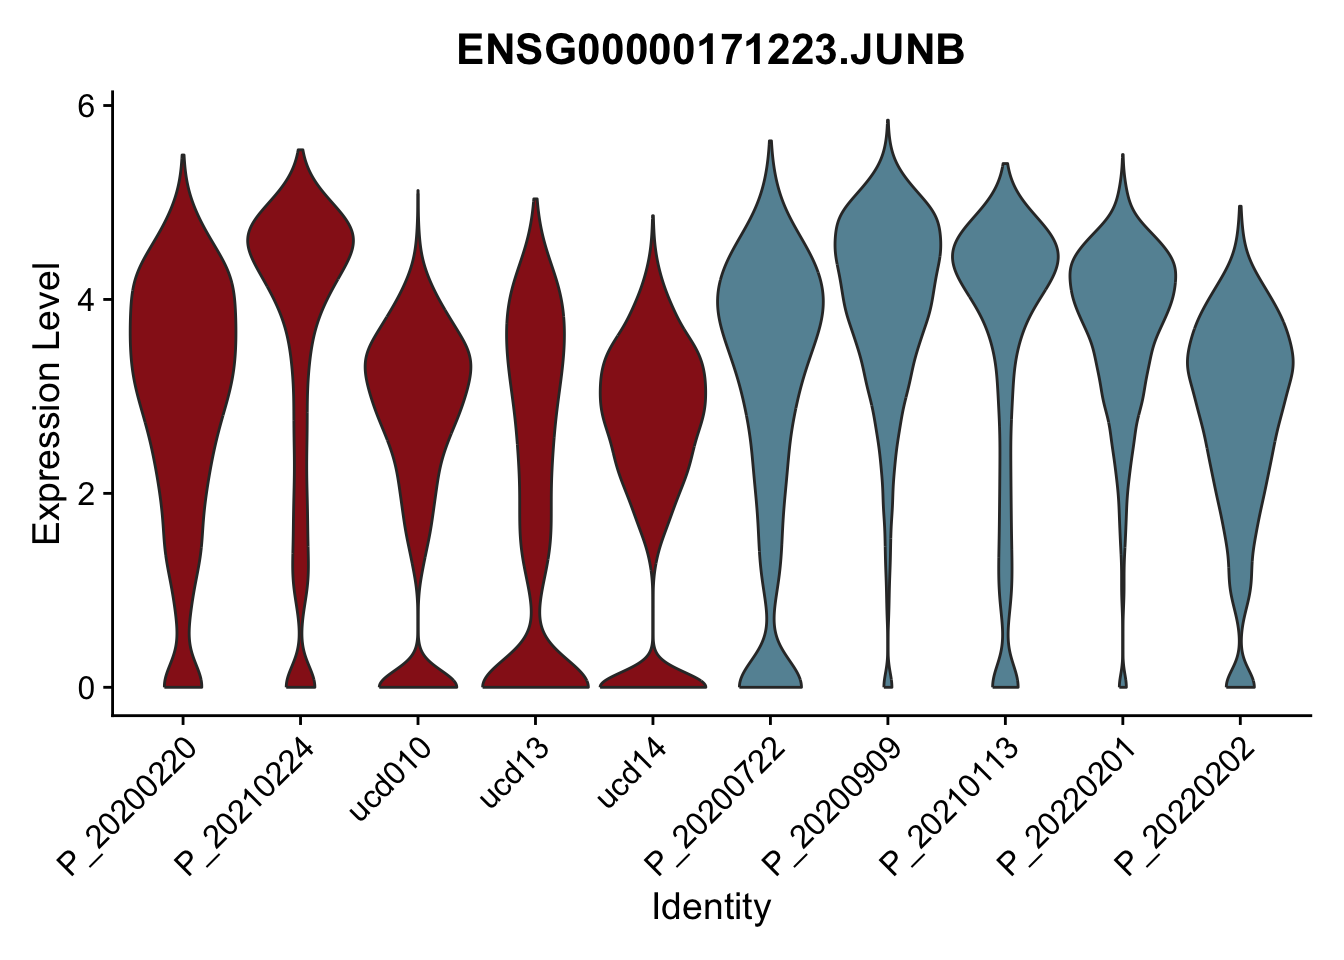
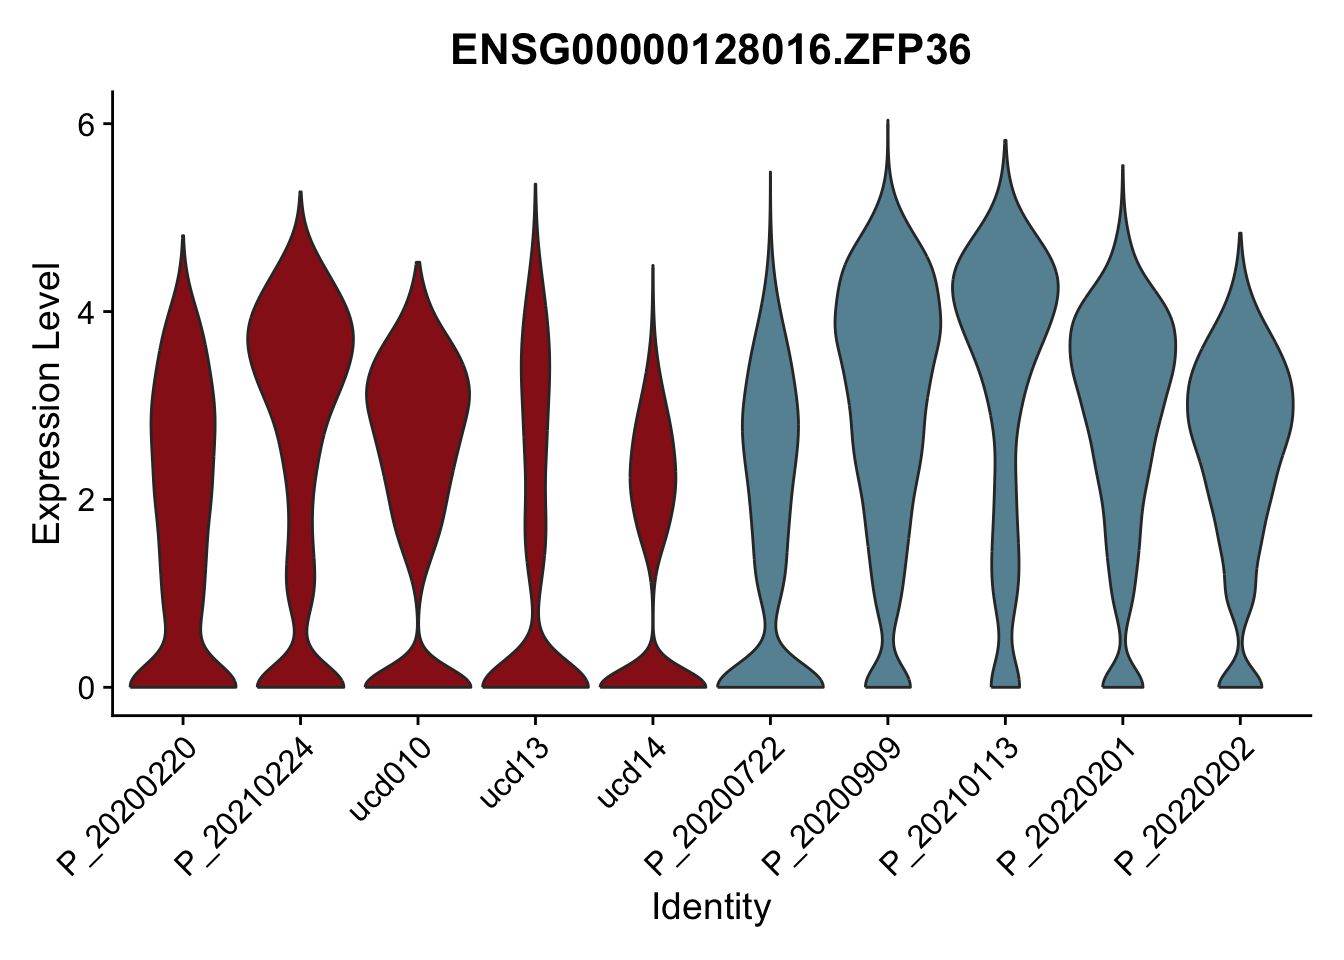
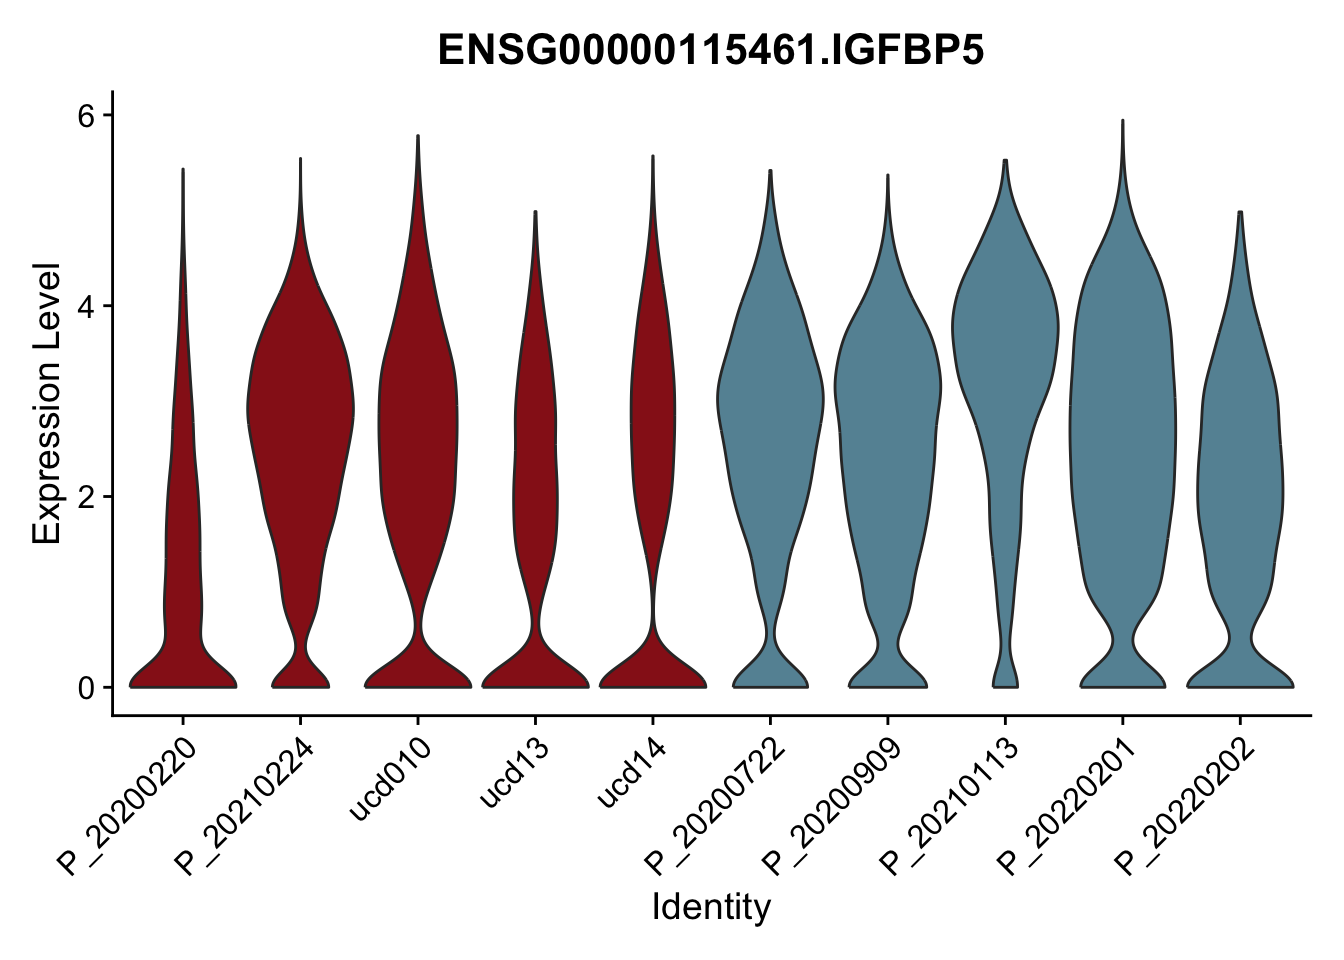
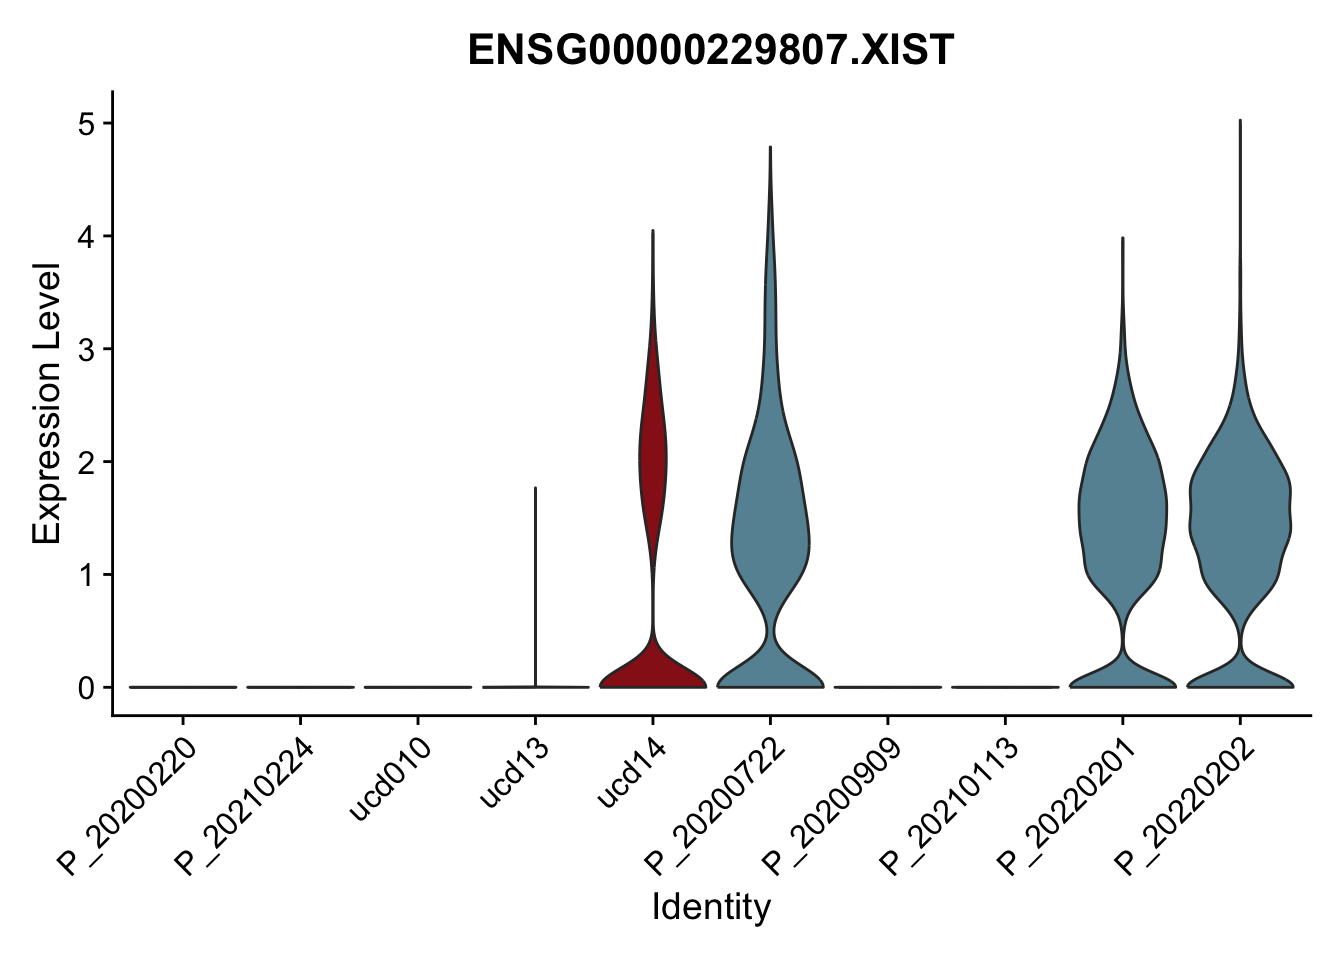
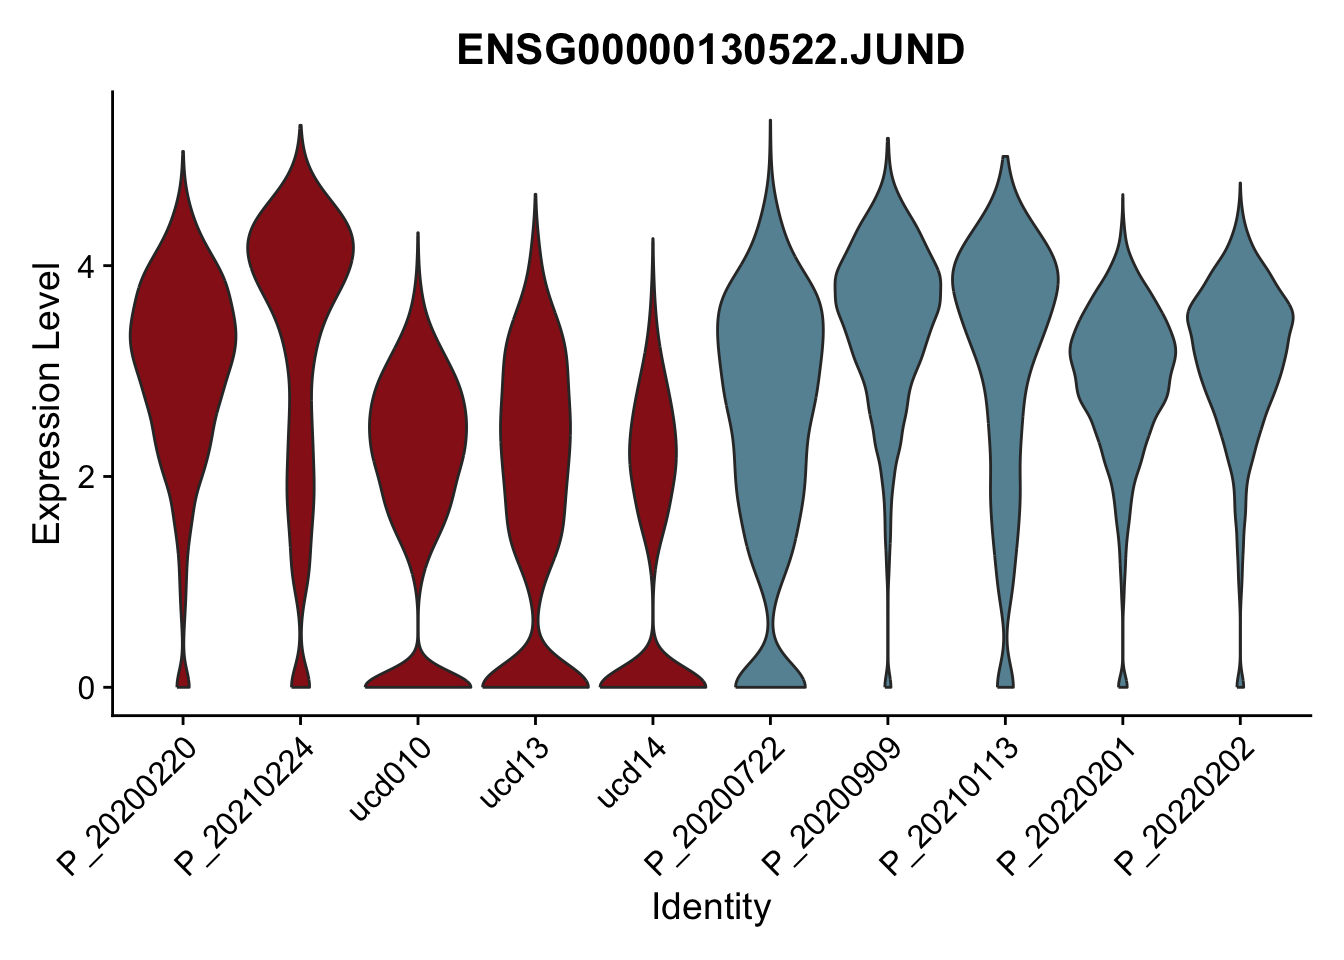
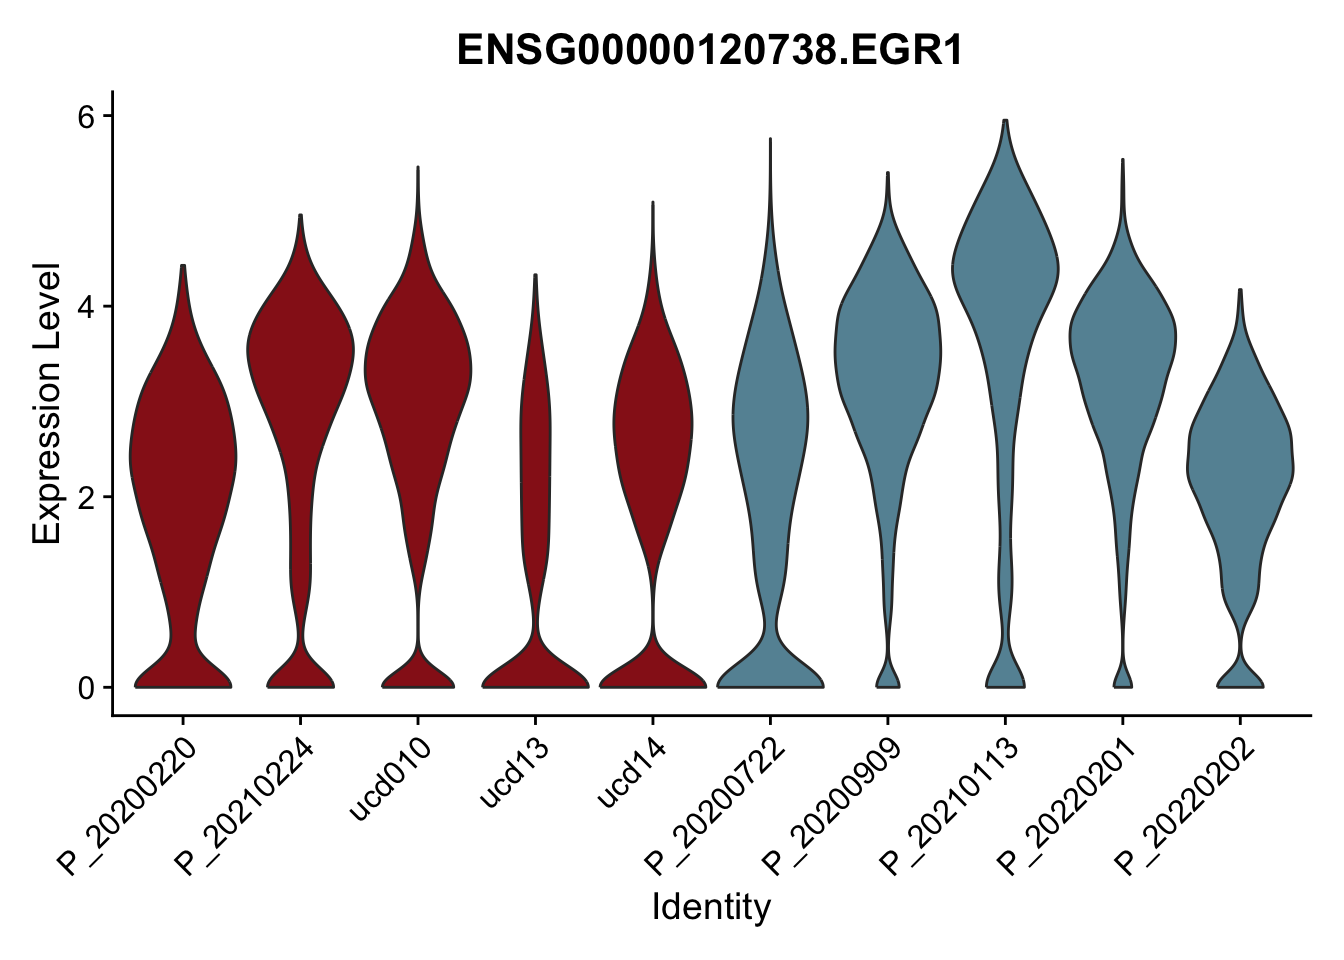
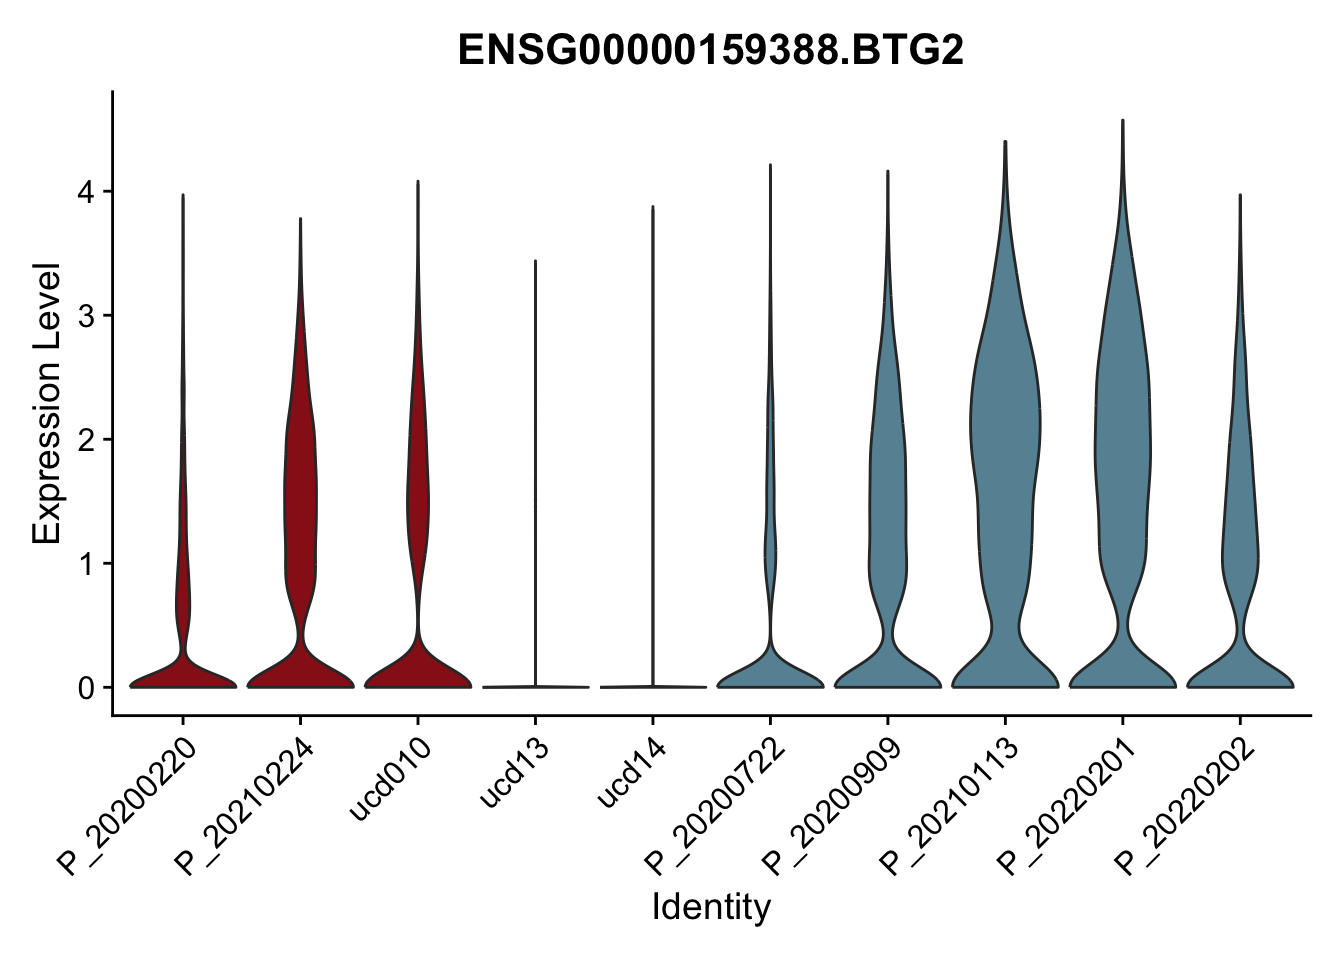
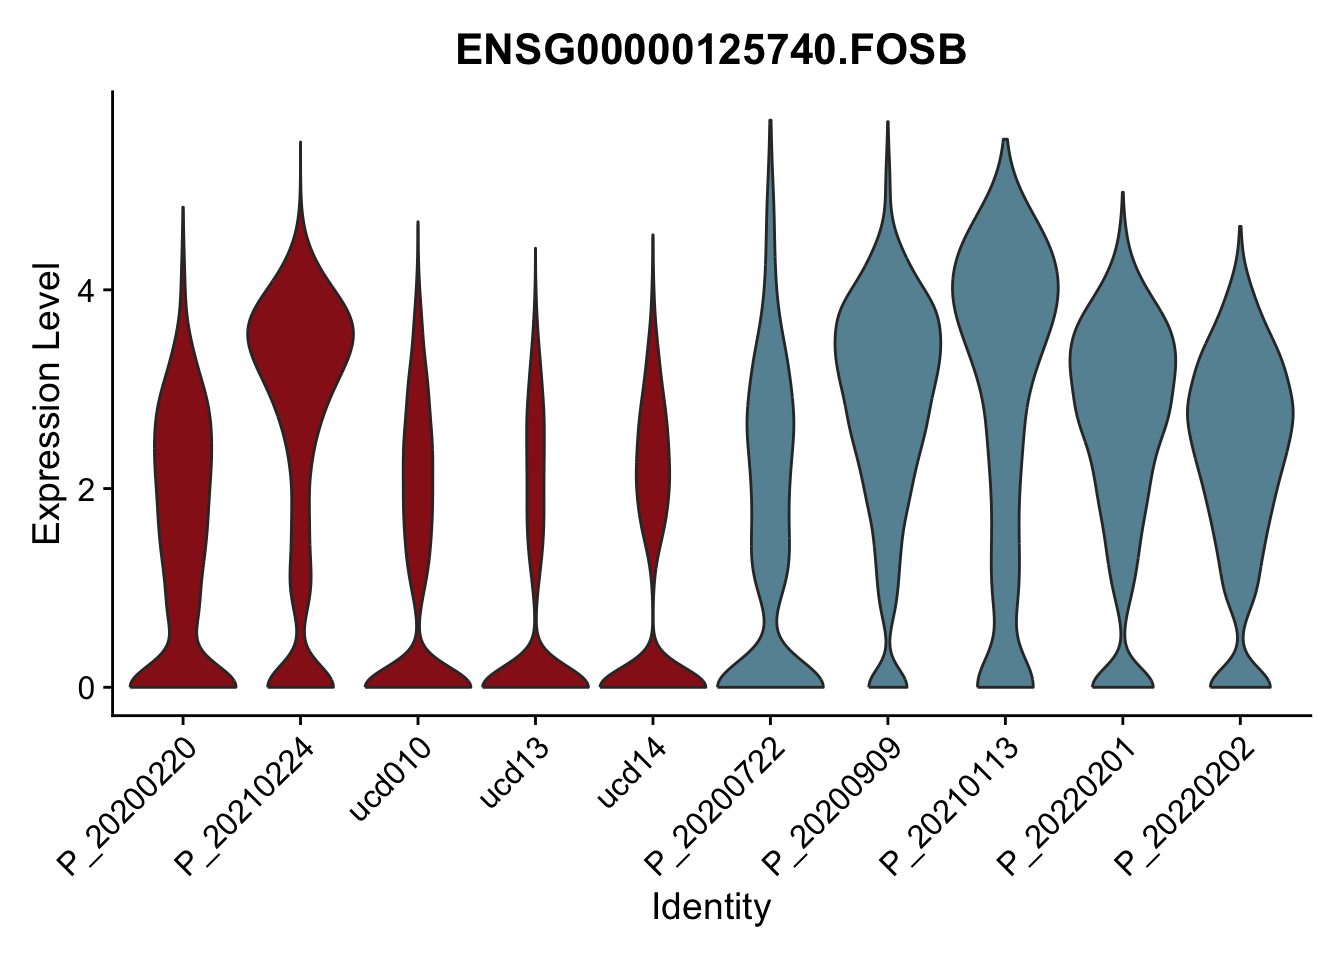
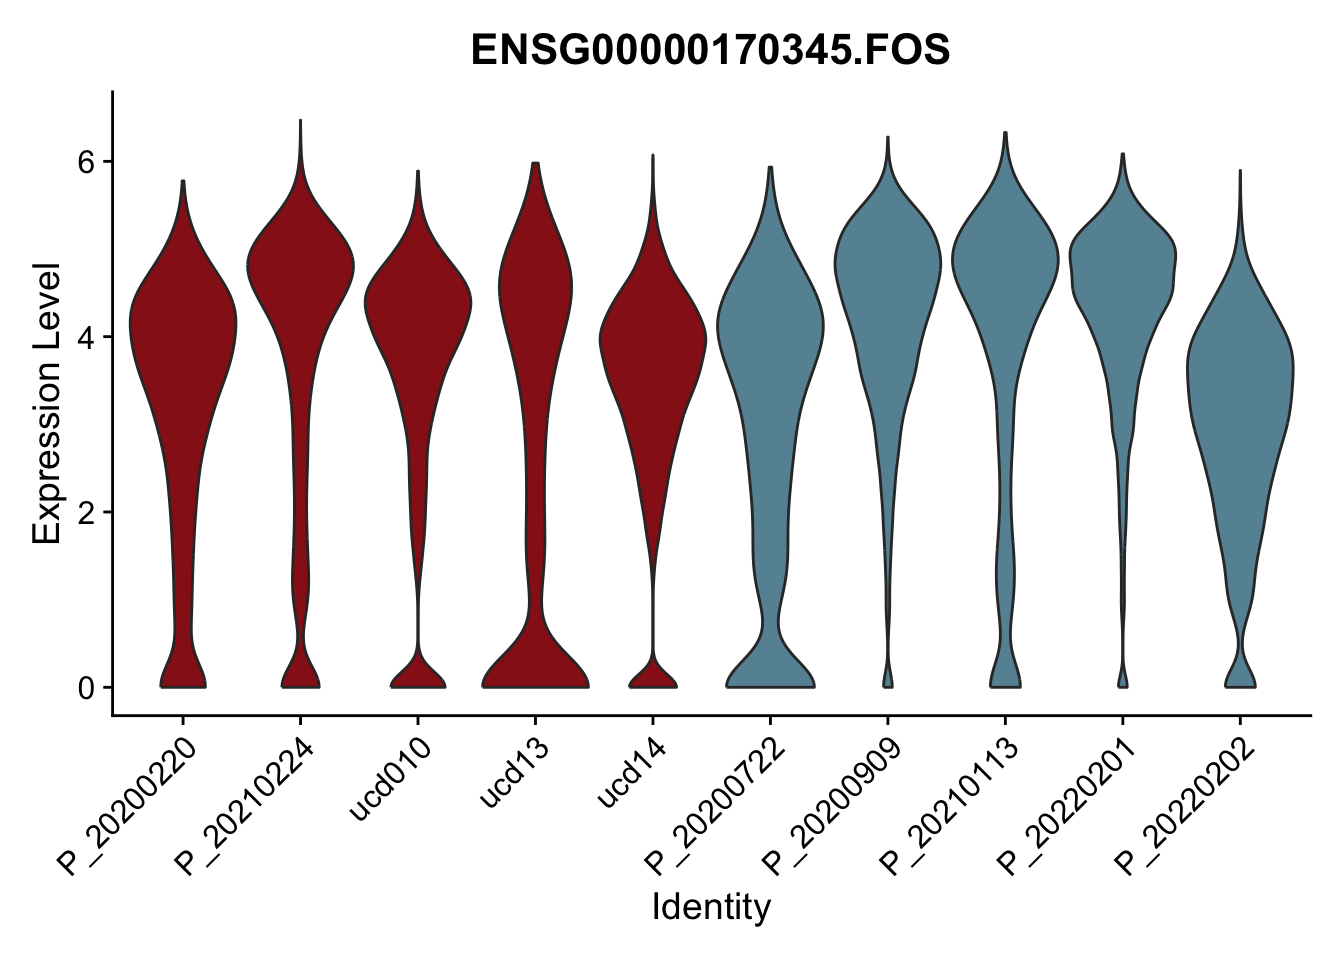
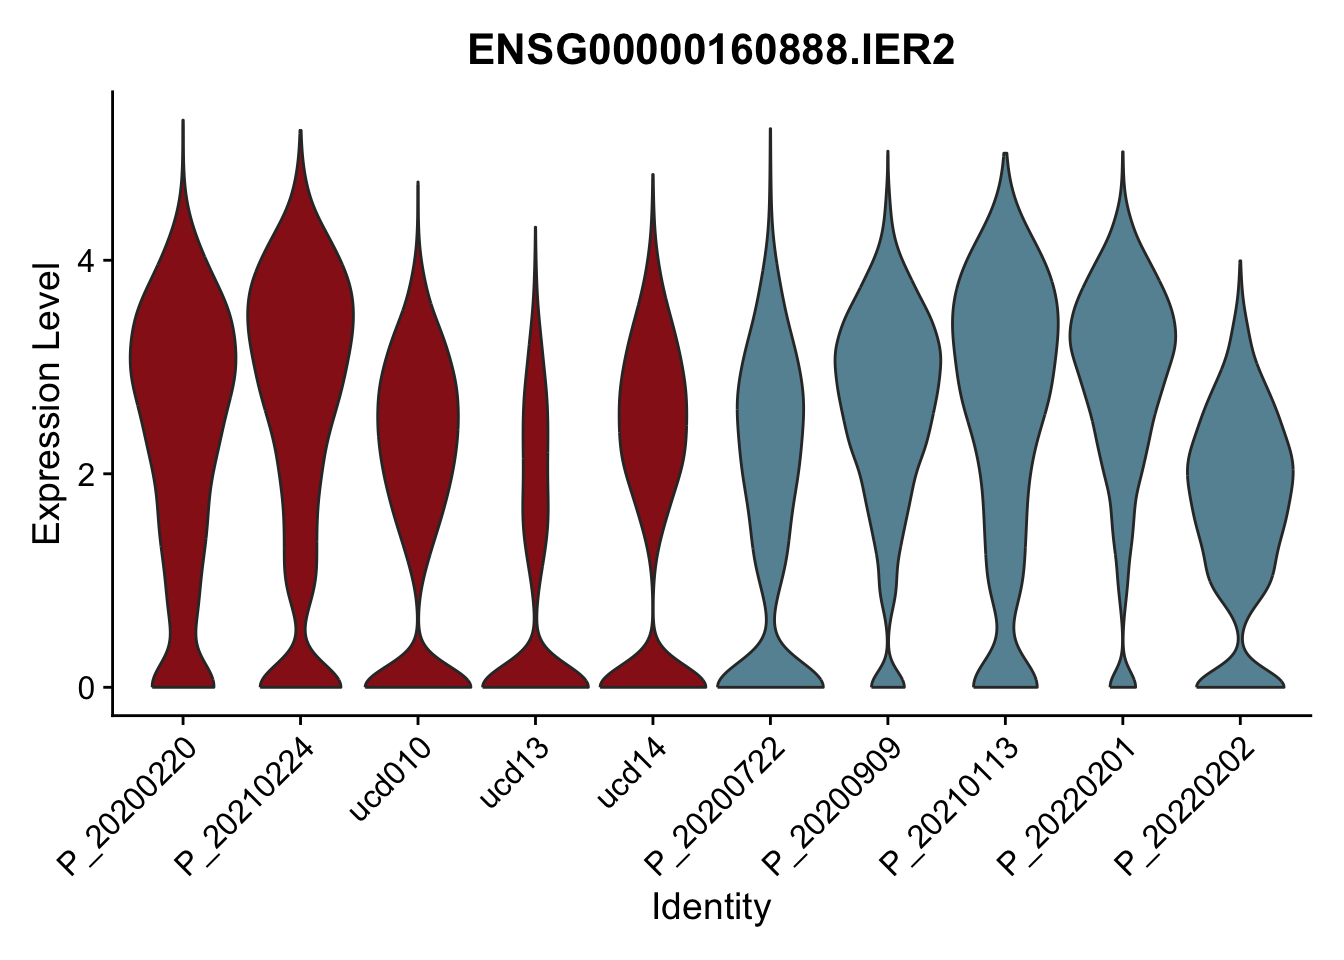
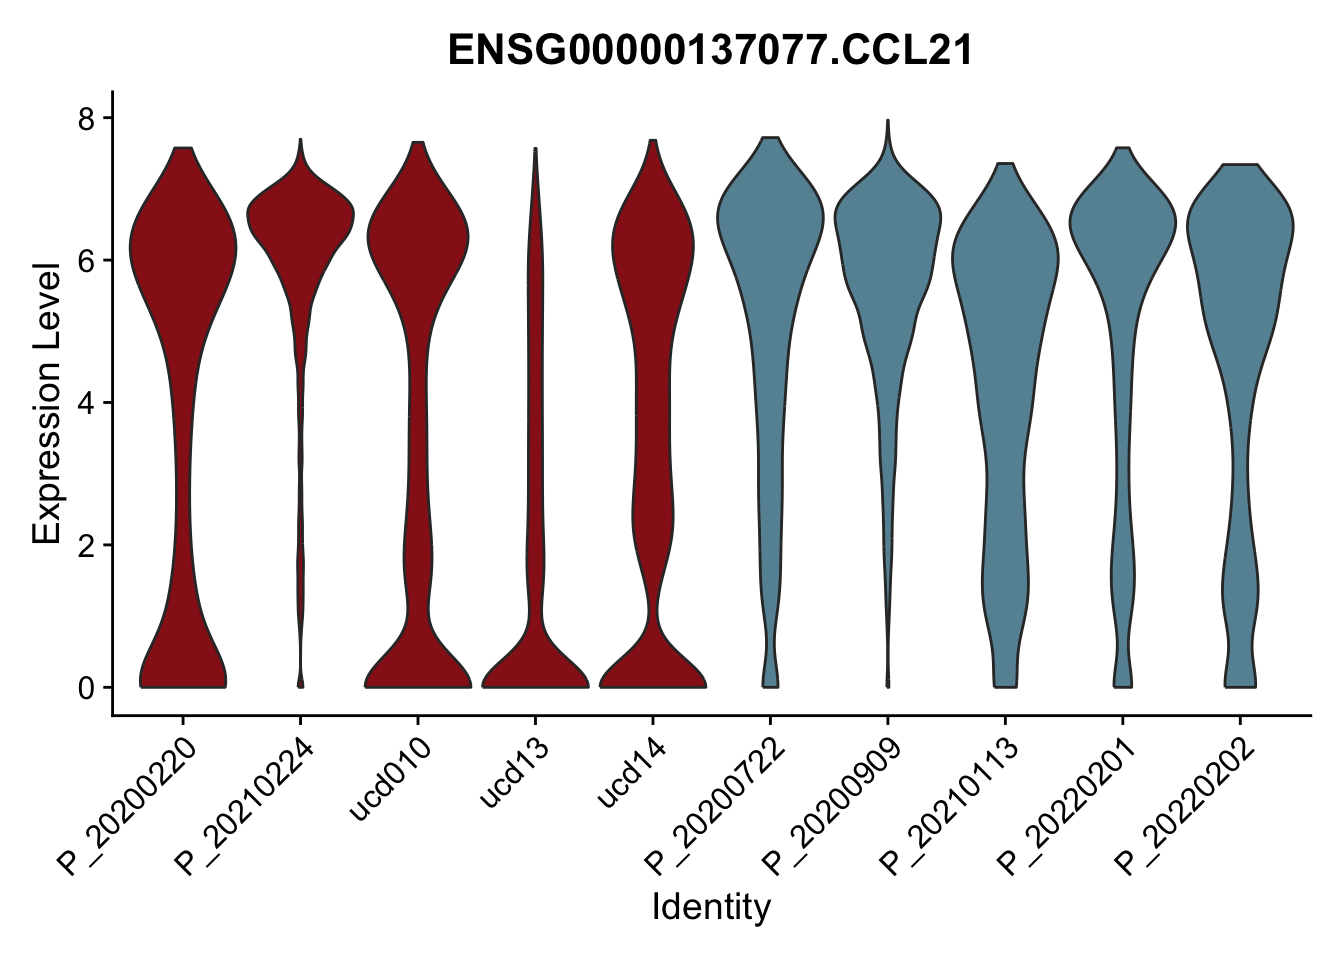
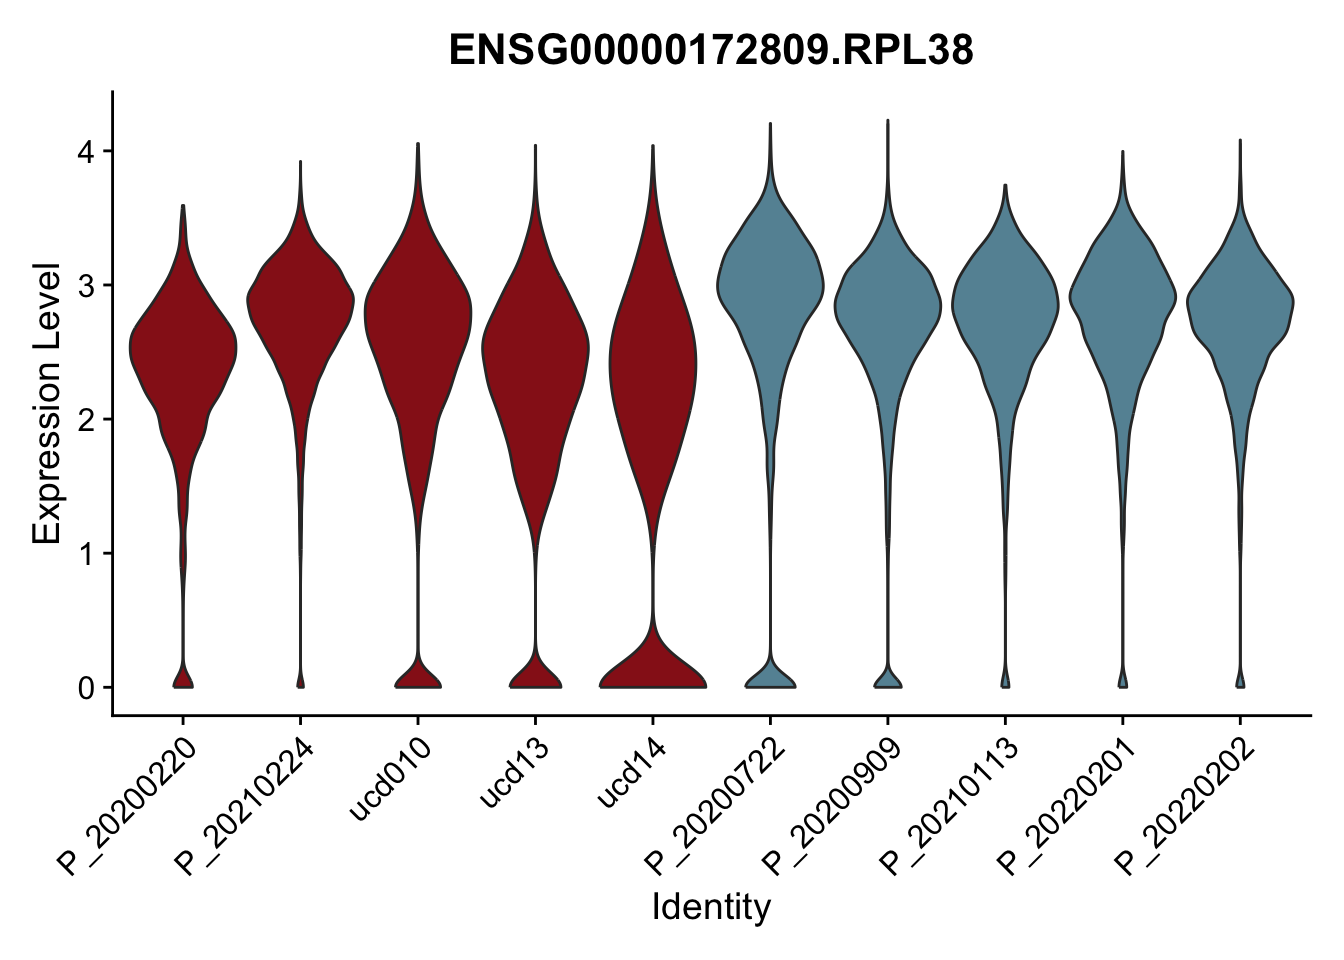
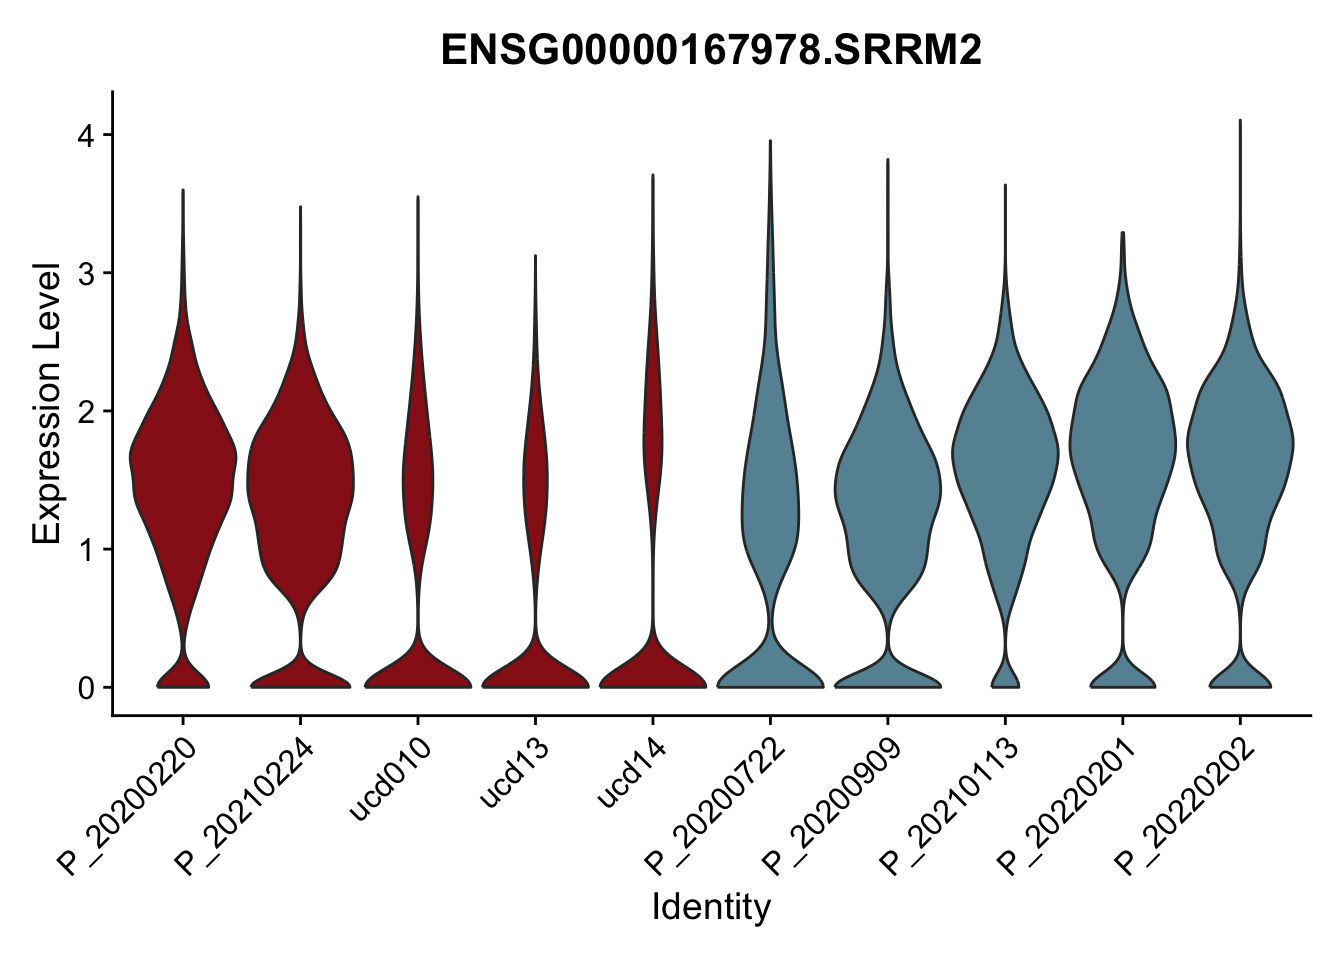
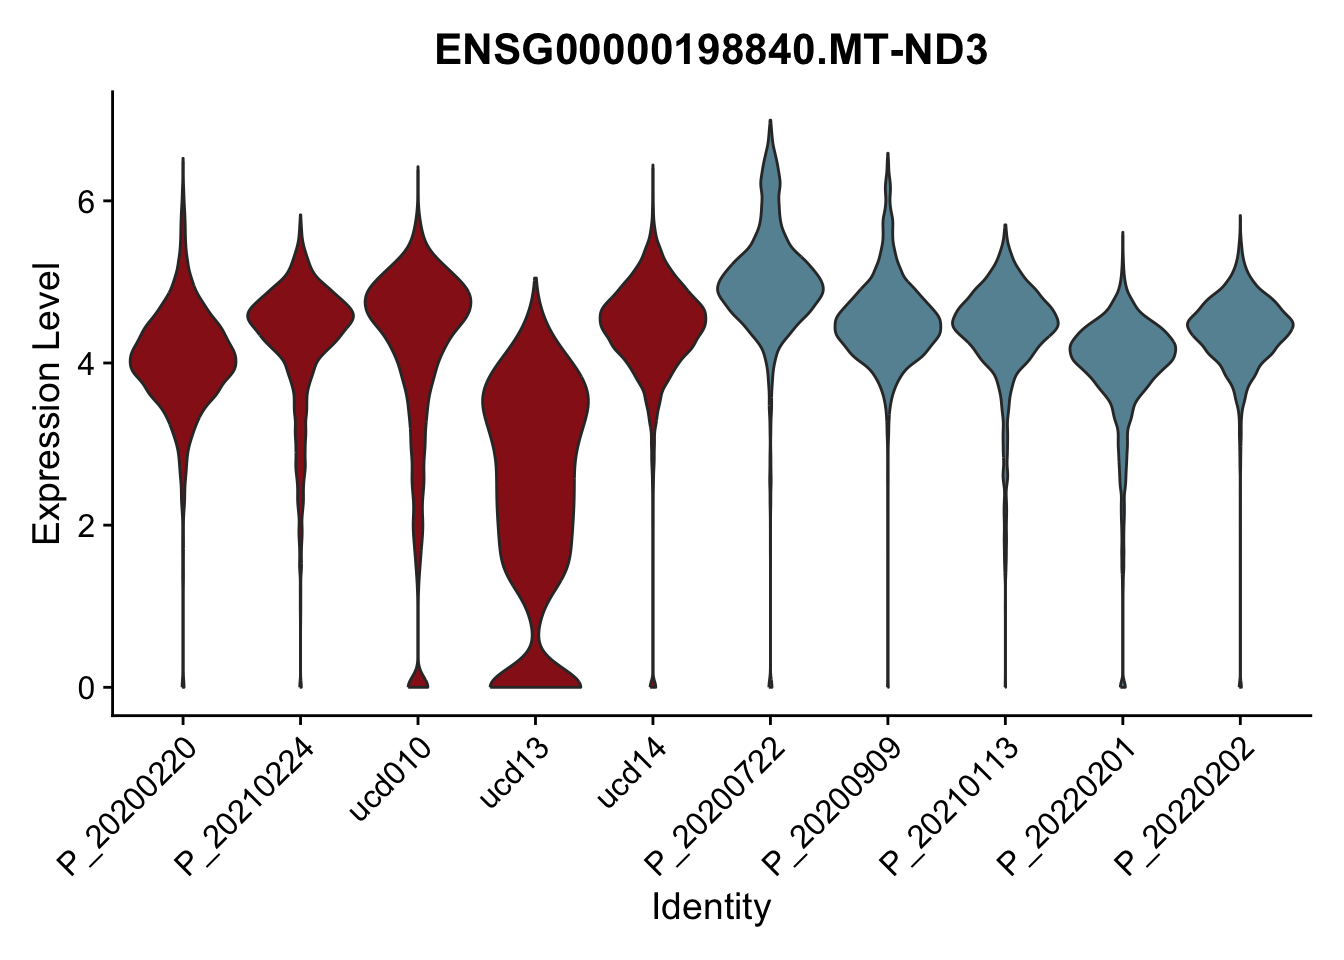
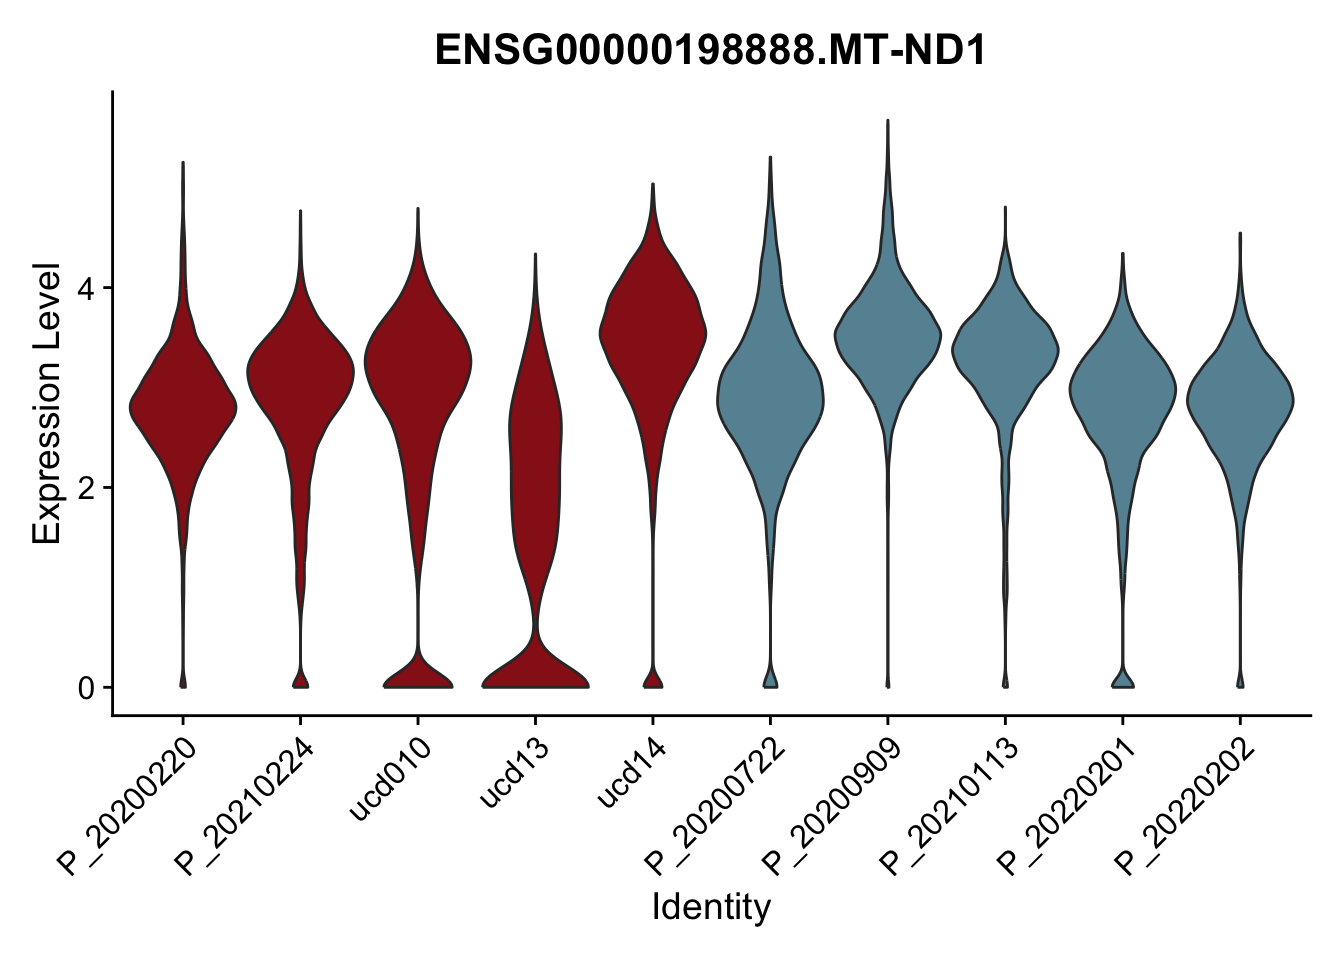
DEsel <- cwDEdat %>% filter(condCl == "activated_5")violinplot across patients
patDat <- data.frame(table(seurat$patient, seurat$cond2)) %>%
  filter(Freq>0) %>%
  mutate(col=ifelse(Var2=="activated",
                    colCond2["activated"],colCond2["resting"]))
colPatCond <- patDat$col
names(colPatCond) <- patDat$Var1
seurat$patient <- factor(seurat$patient, levels = patDat$Var1)

pList <- sapply(DEsel$gene[1:20], function(x){
  p <- VlnPlot(seurat, features = x, pt.size = 0,
               group.by = "patient") +
    scale_fill_manual(values = colPatCond) +
    theme(legend.position = "none")
  plot(p)
})
avg Heatmap
selGenesAll <- DEsel %>%
  slice_max(., order_by=mean.logFC.cohen, n=30)
selGenesAll <- selGenesAll %>% mutate(geneIDval=gsub("^.*\\.", "", gene)) %>% filter(nchar(geneIDval)>1)

seurat$clust_plus_cond <- paste0(seurat$intCluster, "_", seurat$cond2)
seurat$clust_plus_cond <- as.factor(seurat$clust_plus_cond)
Idents(seurat) <- seurat$clust_plus_cond
gapVecCol <- seq(2, length(levels(seurat$clust_plus_cond)), by=2)

pOut <- avgHeatmap(seurat = seurat, selGenes = selGenesAll,
                  colVecIdent = colPal,
                  ordVec=levels(seurat),
                  gapVecR=NULL, gapVecC=gapVecCol,cc=FALSE,
                  cr=T, condCol=T, colVecCond = colCond2)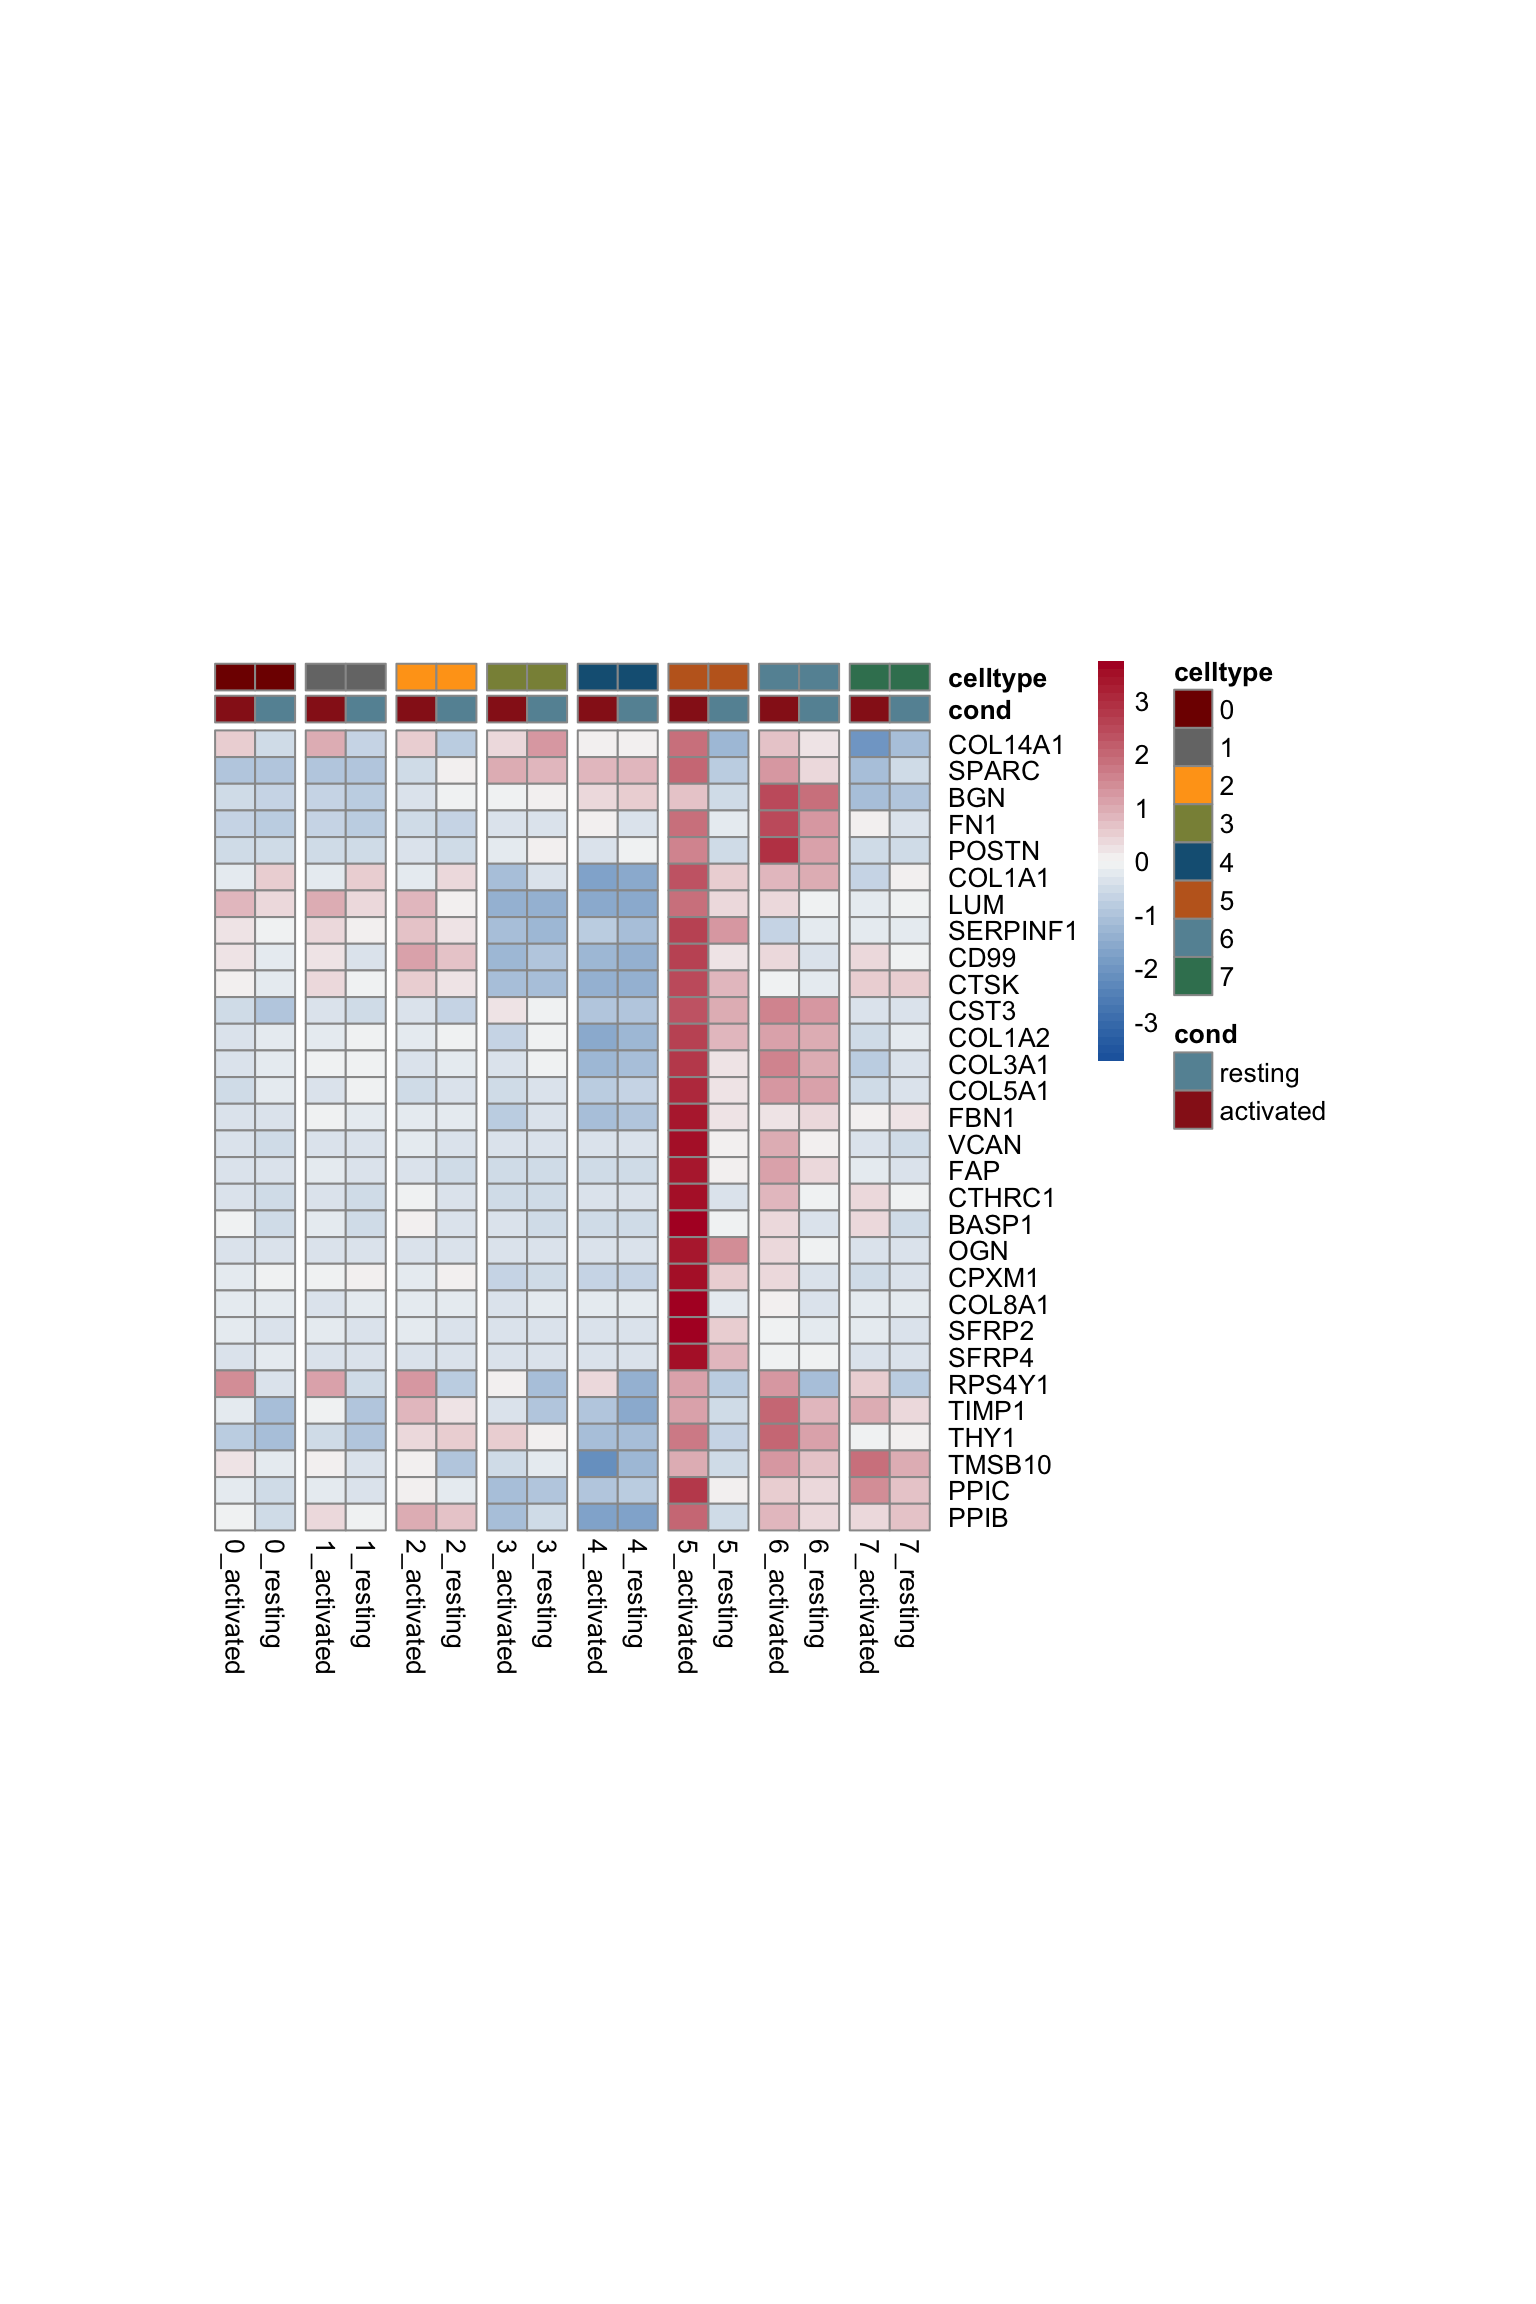
sc Heatmap
DefaultAssay(object = seurat) <- "RNA"
seurat <- ScaleData(seurat, features = rownames(seurat))

colPal2 <- rep(colPal, each=2)
names(colPal2) <- as.vector(t(outer(names(colPal), names(colCond2), paste,
                                    sep="_")))

selFeatures  <- DEsel %>%
  slice_max(., order_by=mean.logFC.cohen, n=30) %>%
  mutate(label=gsub("^.*\\.", "", gene)) %>%
  filter(nchar(label)>1)

DoHeatmap(seurat, features = selFeatures$gene, group.by = "clust_plus_cond",
          group.colors = colPal2, slot = 'scale.data', label = F,
          disp.min = -0.5, disp.max = 1.5) +
  scale_fill_continuous(type = "viridis") +
  scale_y_discrete(breaks=selFeatures$gene, labels=selFeatures$label)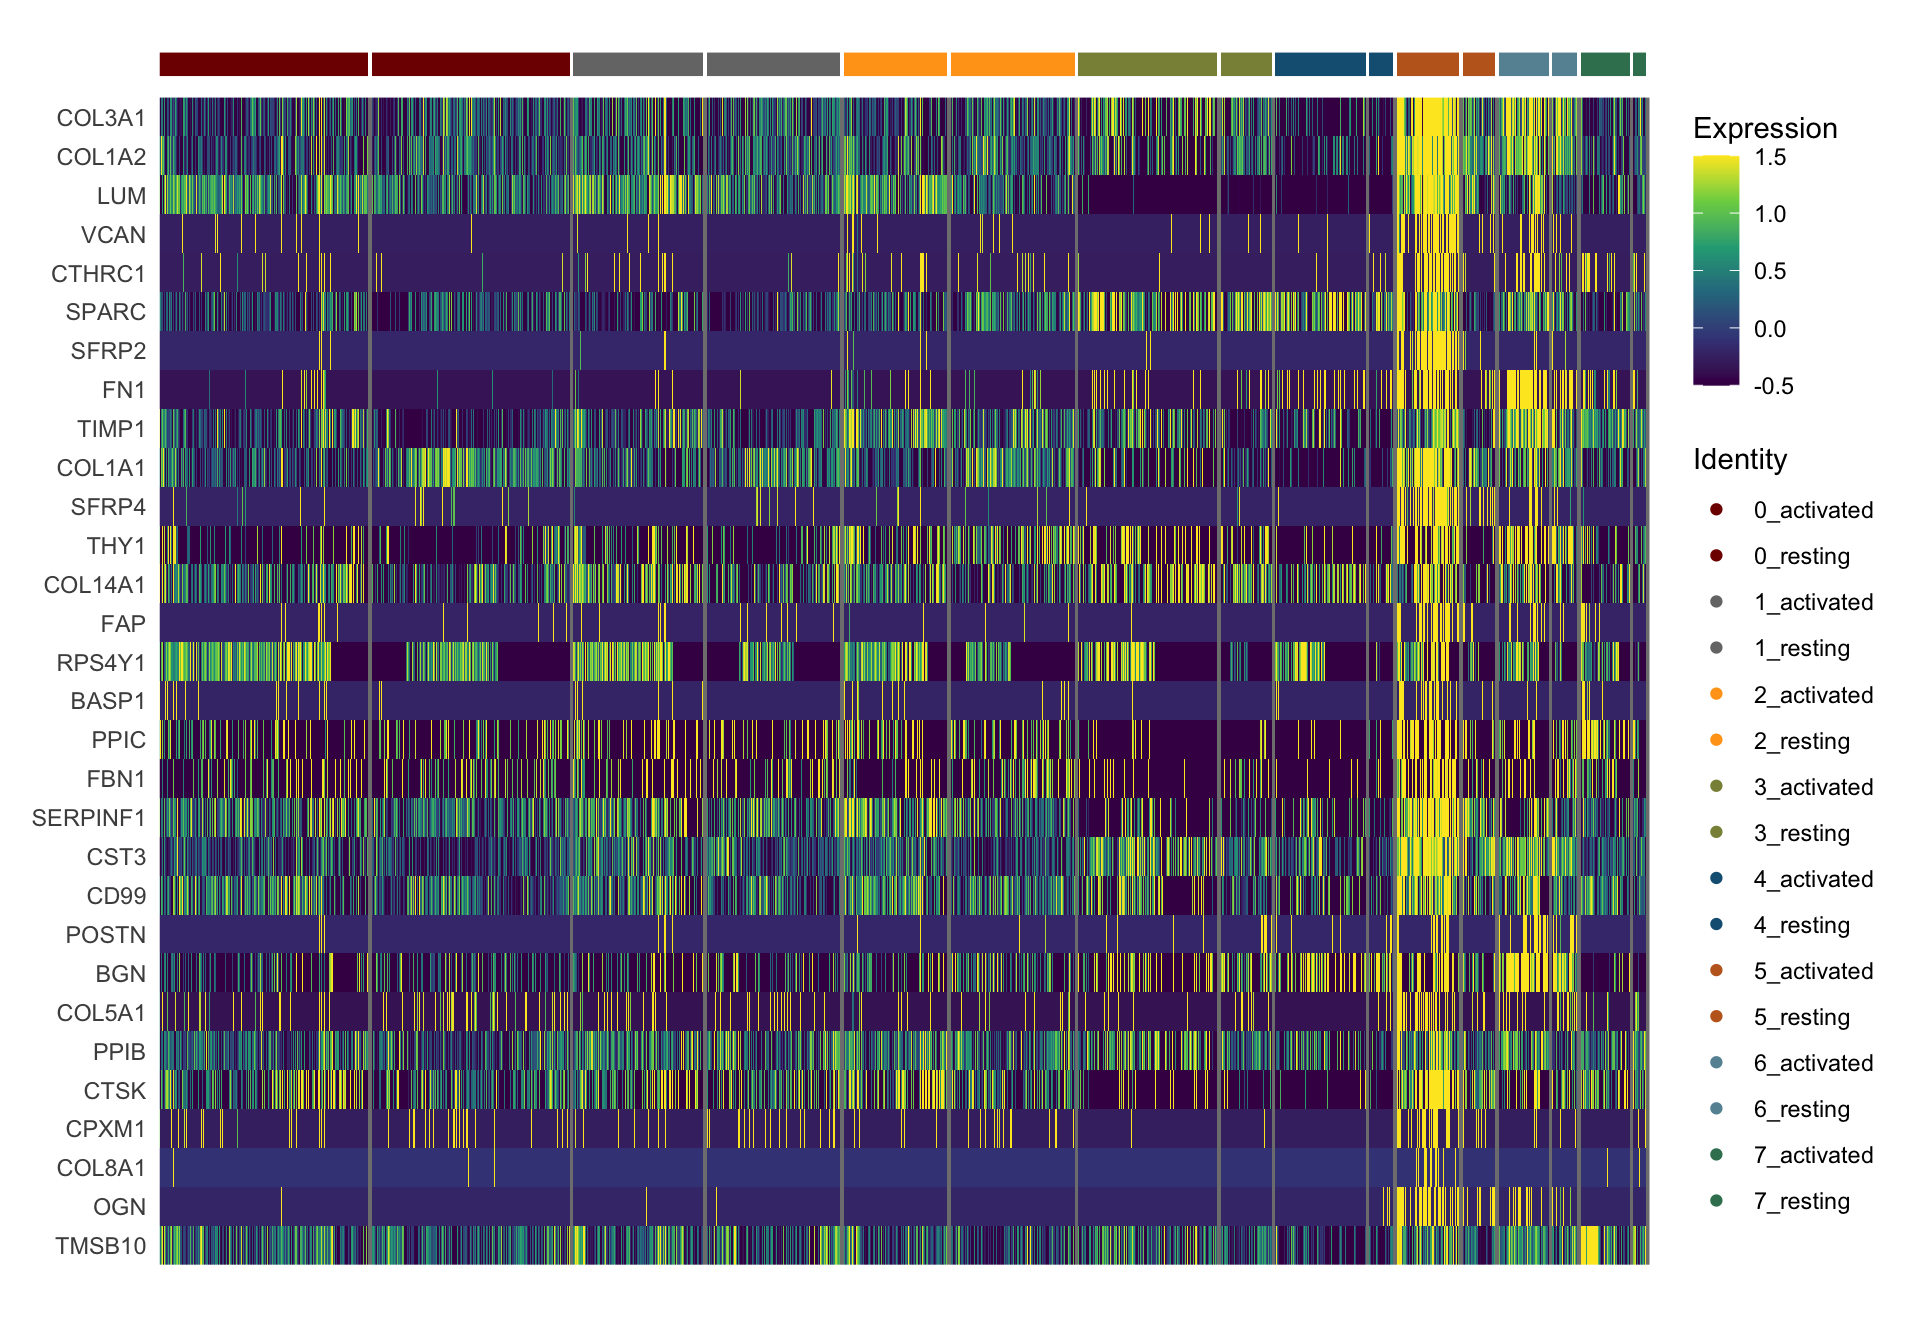
GSEA top genes Pi16+RC activated
orgMarkerDat <- DEsel %>% mutate(EnsID = gsub("\\..*$", "", gene))
egoA <- enrichGO(gene         = unique(orgMarkerDat$EnsID),
                OrgDb         = org.Hs.eg.db,
                keyType       = 'ENSEMBL',
                ont           = "BP",
                pAdjustMethod = "BH",
                pvalueCutoff  = 0.05,
                qvalueCutoff  = 0.05)
egoA <- setReadable(egoA, OrgDb = org.Hs.eg.db)

egoADat <- egoA@result
selGO <- c("GO:0030198", "GO:0030199", "GO:0030510", "GO:0048771",
           "GO:0007229", "GO:0071559", "GO:1901342", "GO:0050727", "GO:0016055")

selGO <- c("GO:0030198", "GO:0030510", "GO:0048771",
           "GO:0007229", "GO:0071559", "GO:1901342")
barplot sel GO
selGODat <- egoADat %>% filter(ID %in% selGO) %>% mutate(cluster="5")
selGODat <- selGODat %>% mutate(qscore=-log(p.adjust, base=10))
p <- ggbarplot(selGODat, x = "Description", y = "qscore",
          fill = "cluster",
          color = "cluster",
          palette = colPal,
          sort.val = "asc",
          sort.by.groups = TRUE
          #x.text.angle = 90
          ) +
  rotate()
p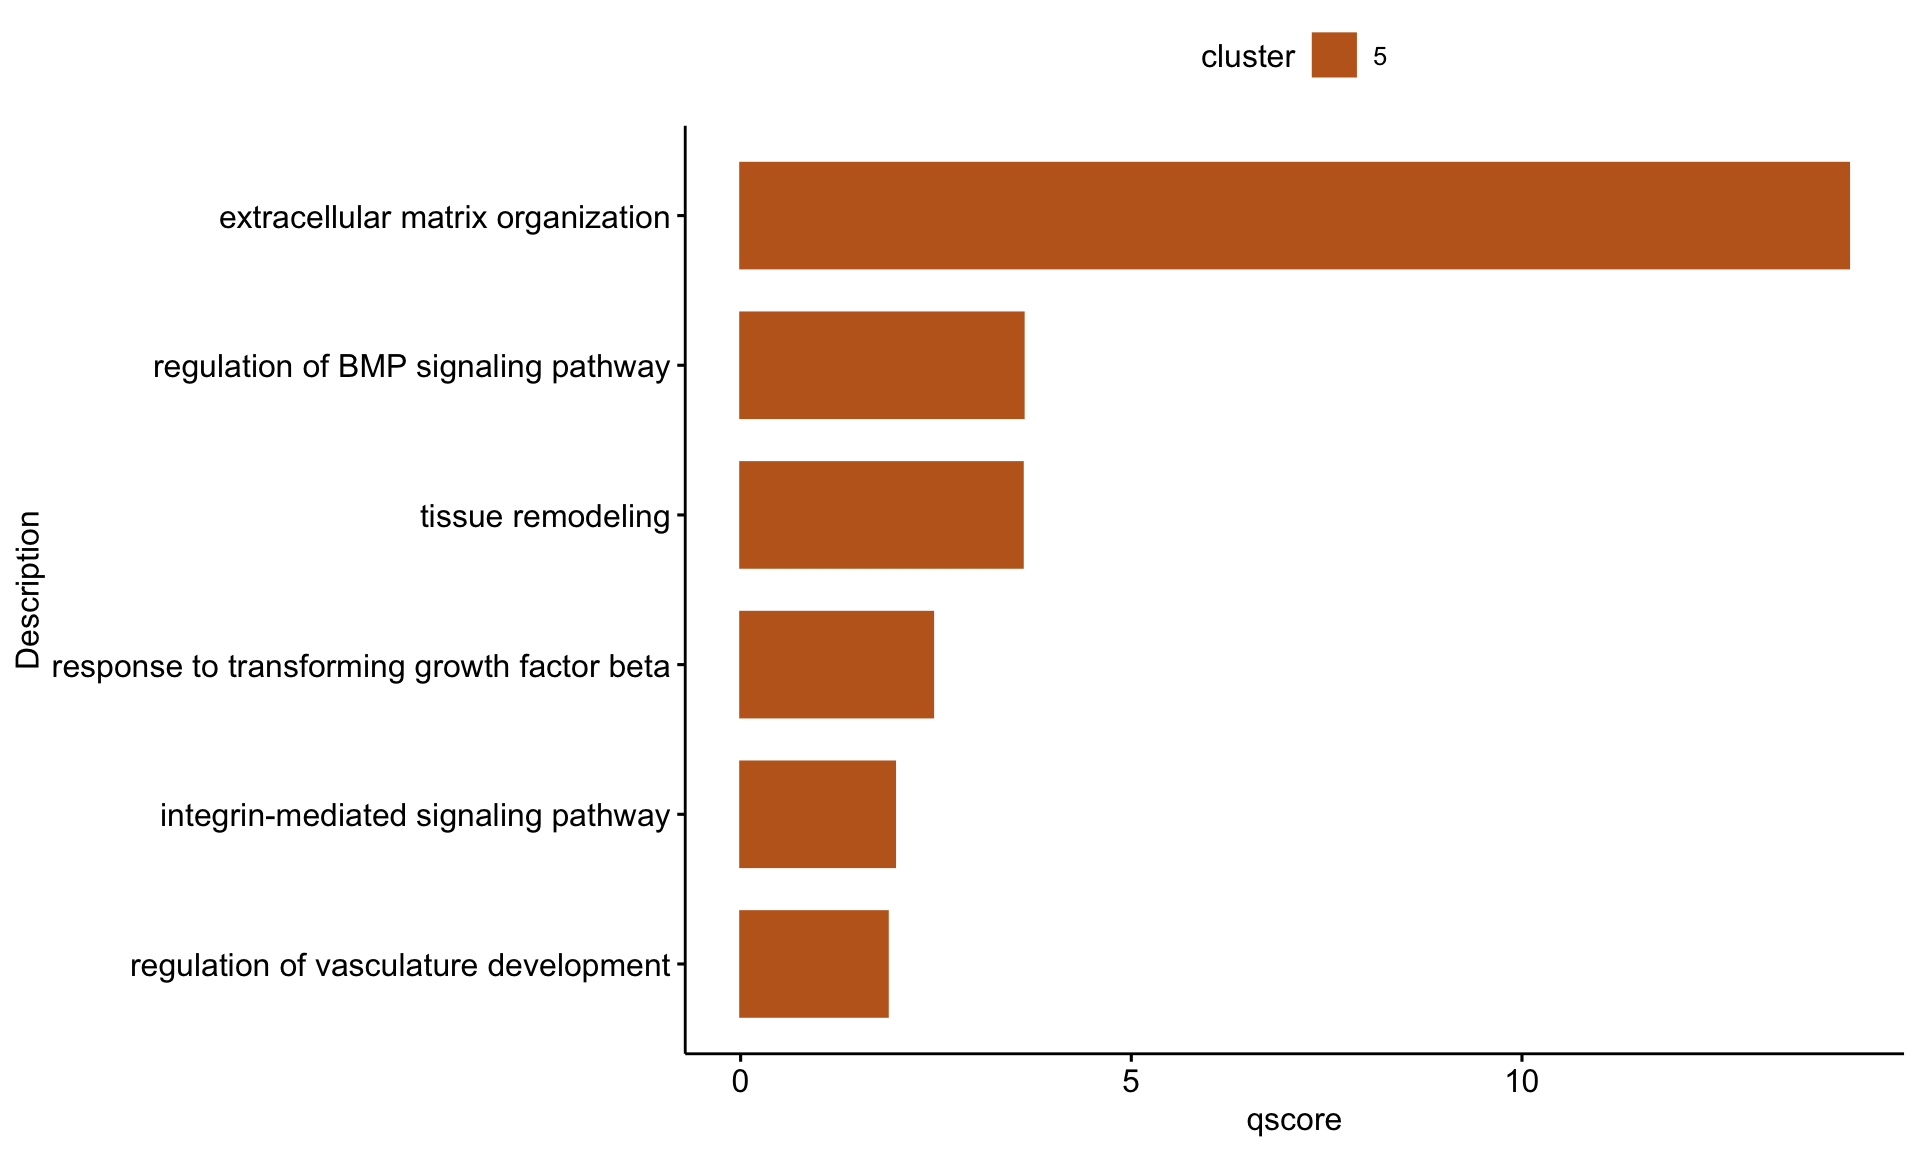
cnetplot sel GO
egoAsub <- egoA
egoAsub@result <- egoAsub@result[which(egoAsub@result$ID %in% selGO),]
p <- cnetplot(egoAsub, node_label="all", showCategory = length(selGO),
              color_category="#C16622FF", color_gene="#dd9c6c",
              shadowtext = "none")
p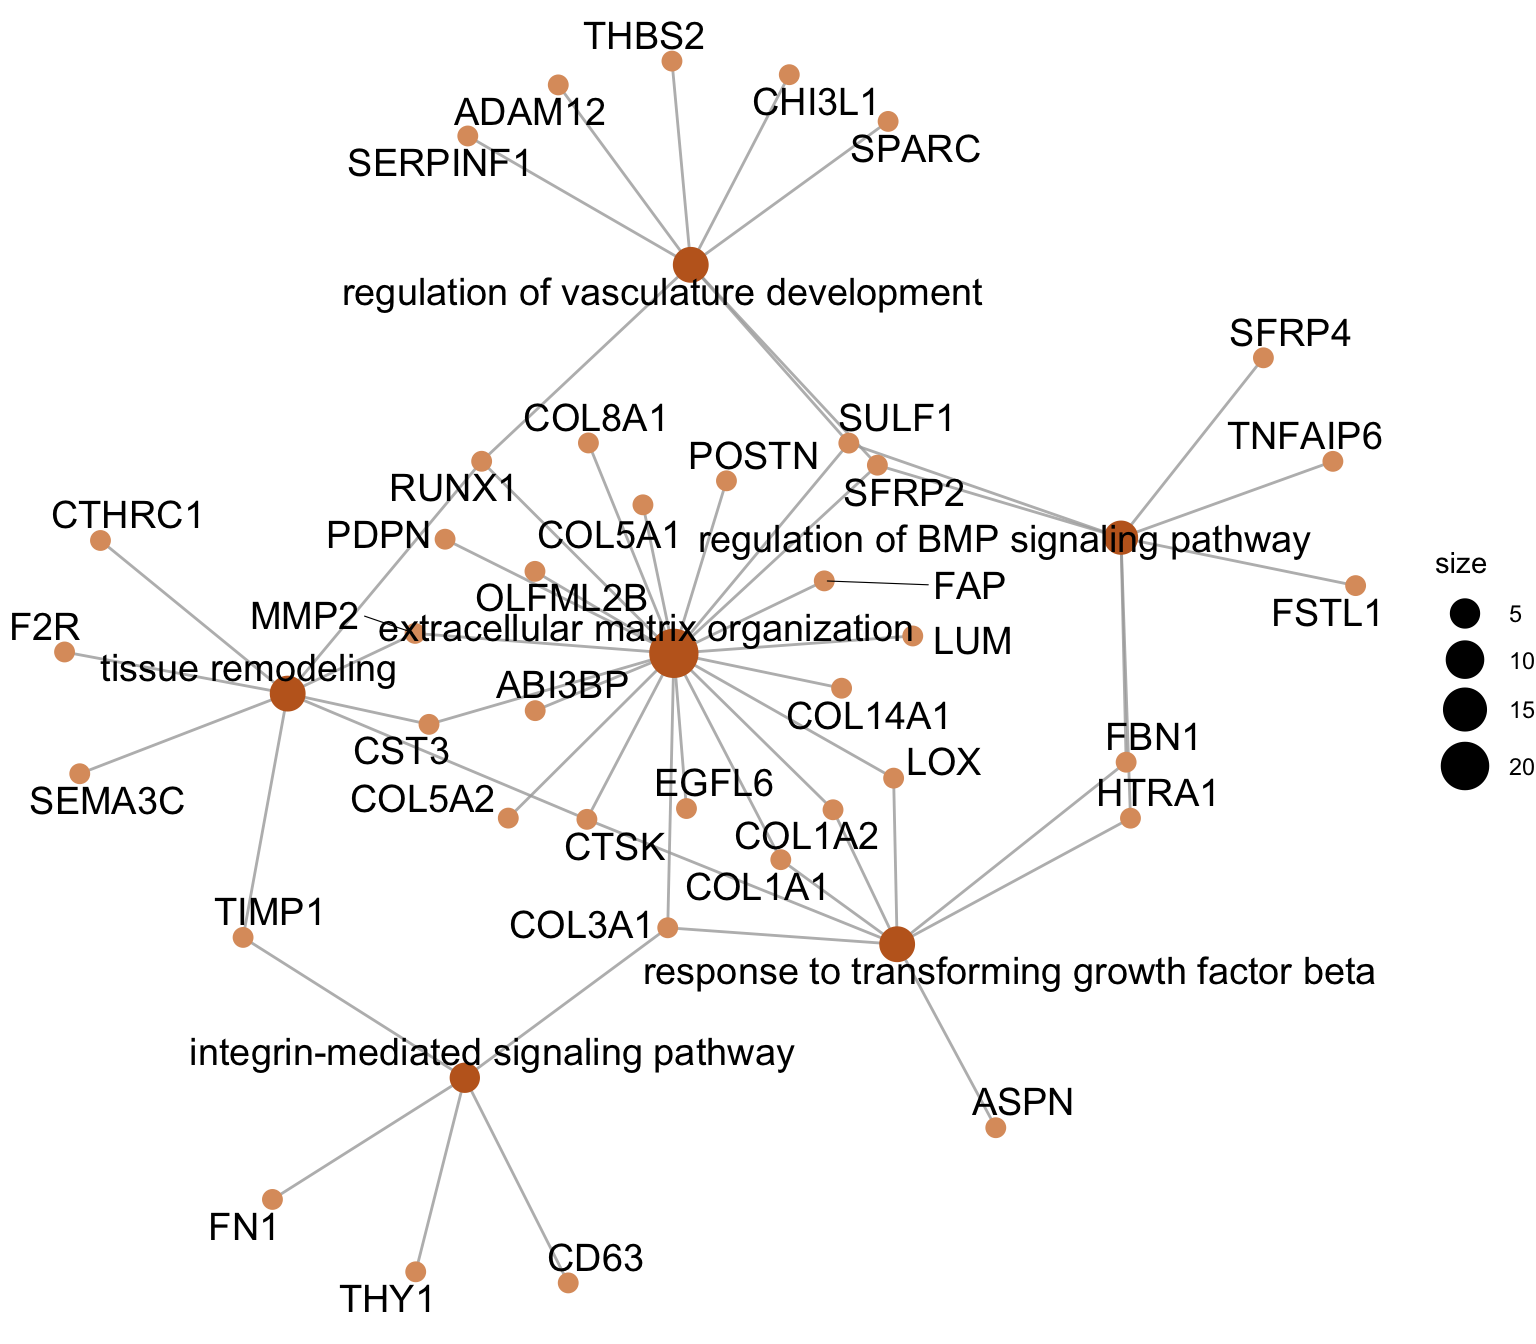
heatplot sel GO
egoAsub <- egoA
egoAsub@result <- egoAsub@result[which(egoAsub@result$ID %in% selGO),]
DEsel <- DEsel %>% mutate(EnsID=gsub("\\..*", "", gene))
foldChange <- DEsel$mean.logFC.cohen
names(foldChange) <- DEsel$EnsID
p <- heatplot(egoAsub, showCategory = length(selGO), foldChange=foldChange) +
  scale_fill_gradient(low="#f3c2c2", high="#971c1c")
p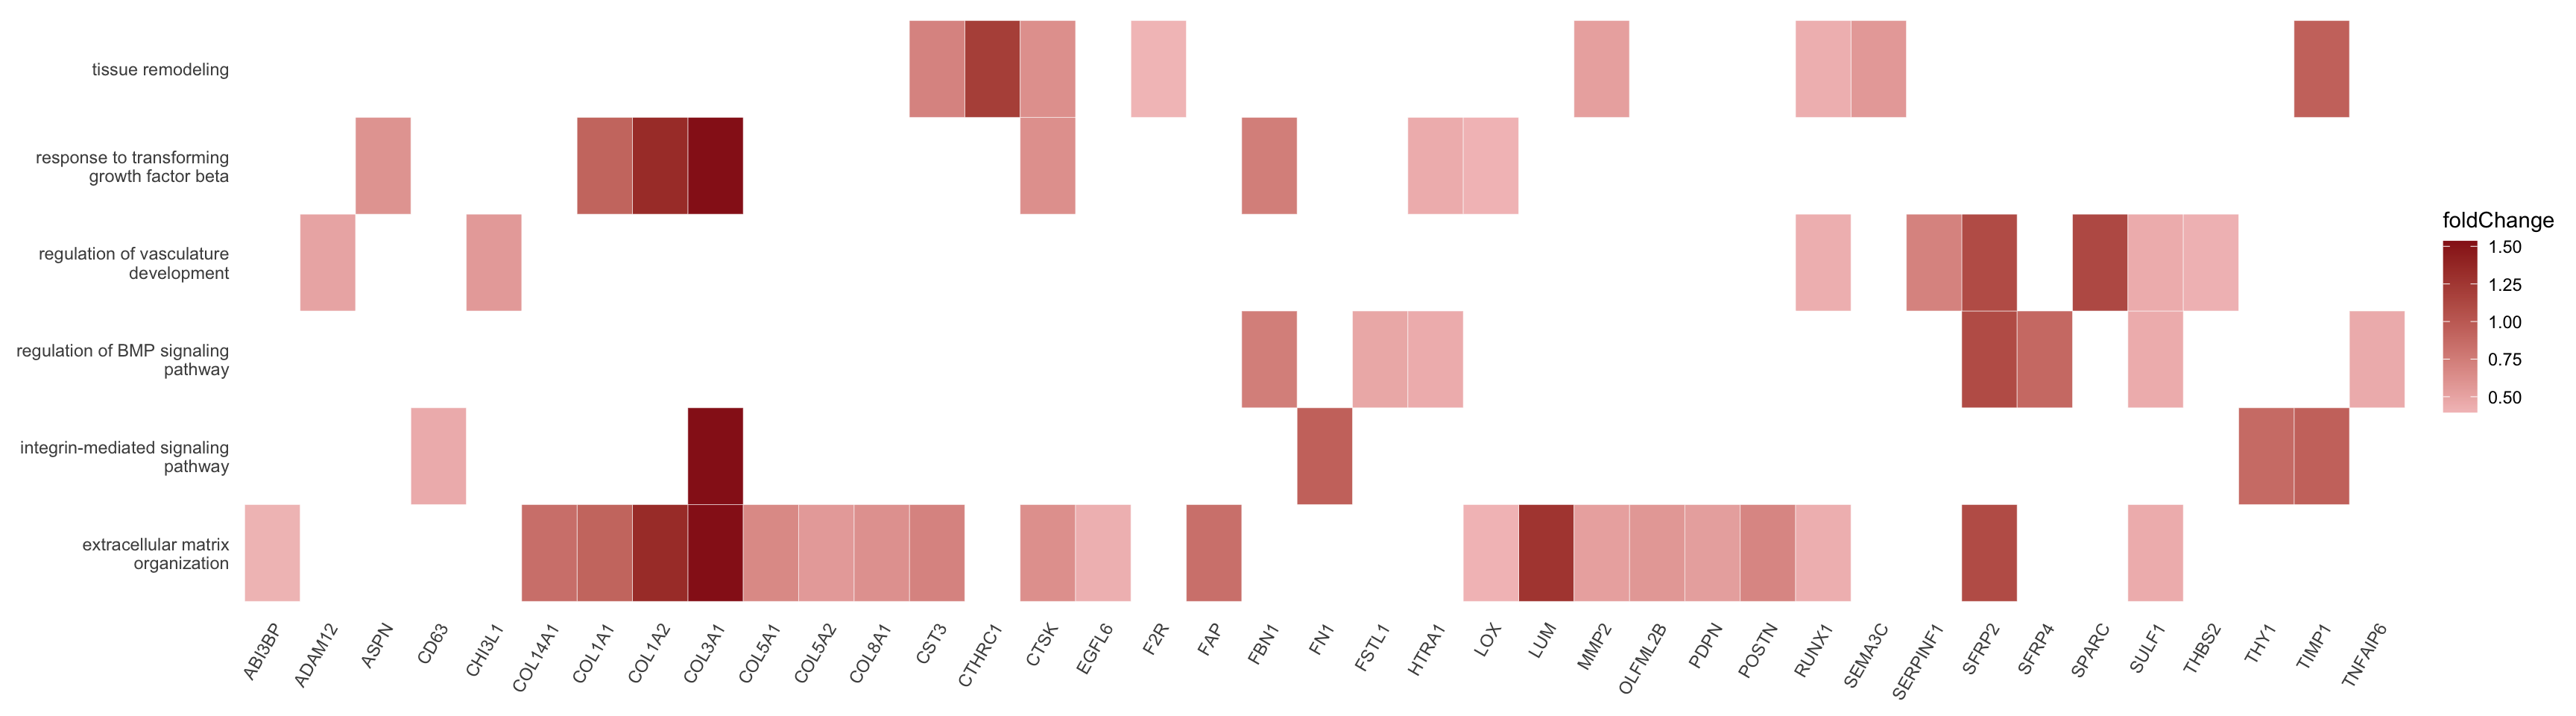
p <- heatplot(egoAsub, showCategory = length(selGO), foldChange=foldChange) +
  scale_fill_gradient(low="#f2c5a4", high="#C16622FF")
p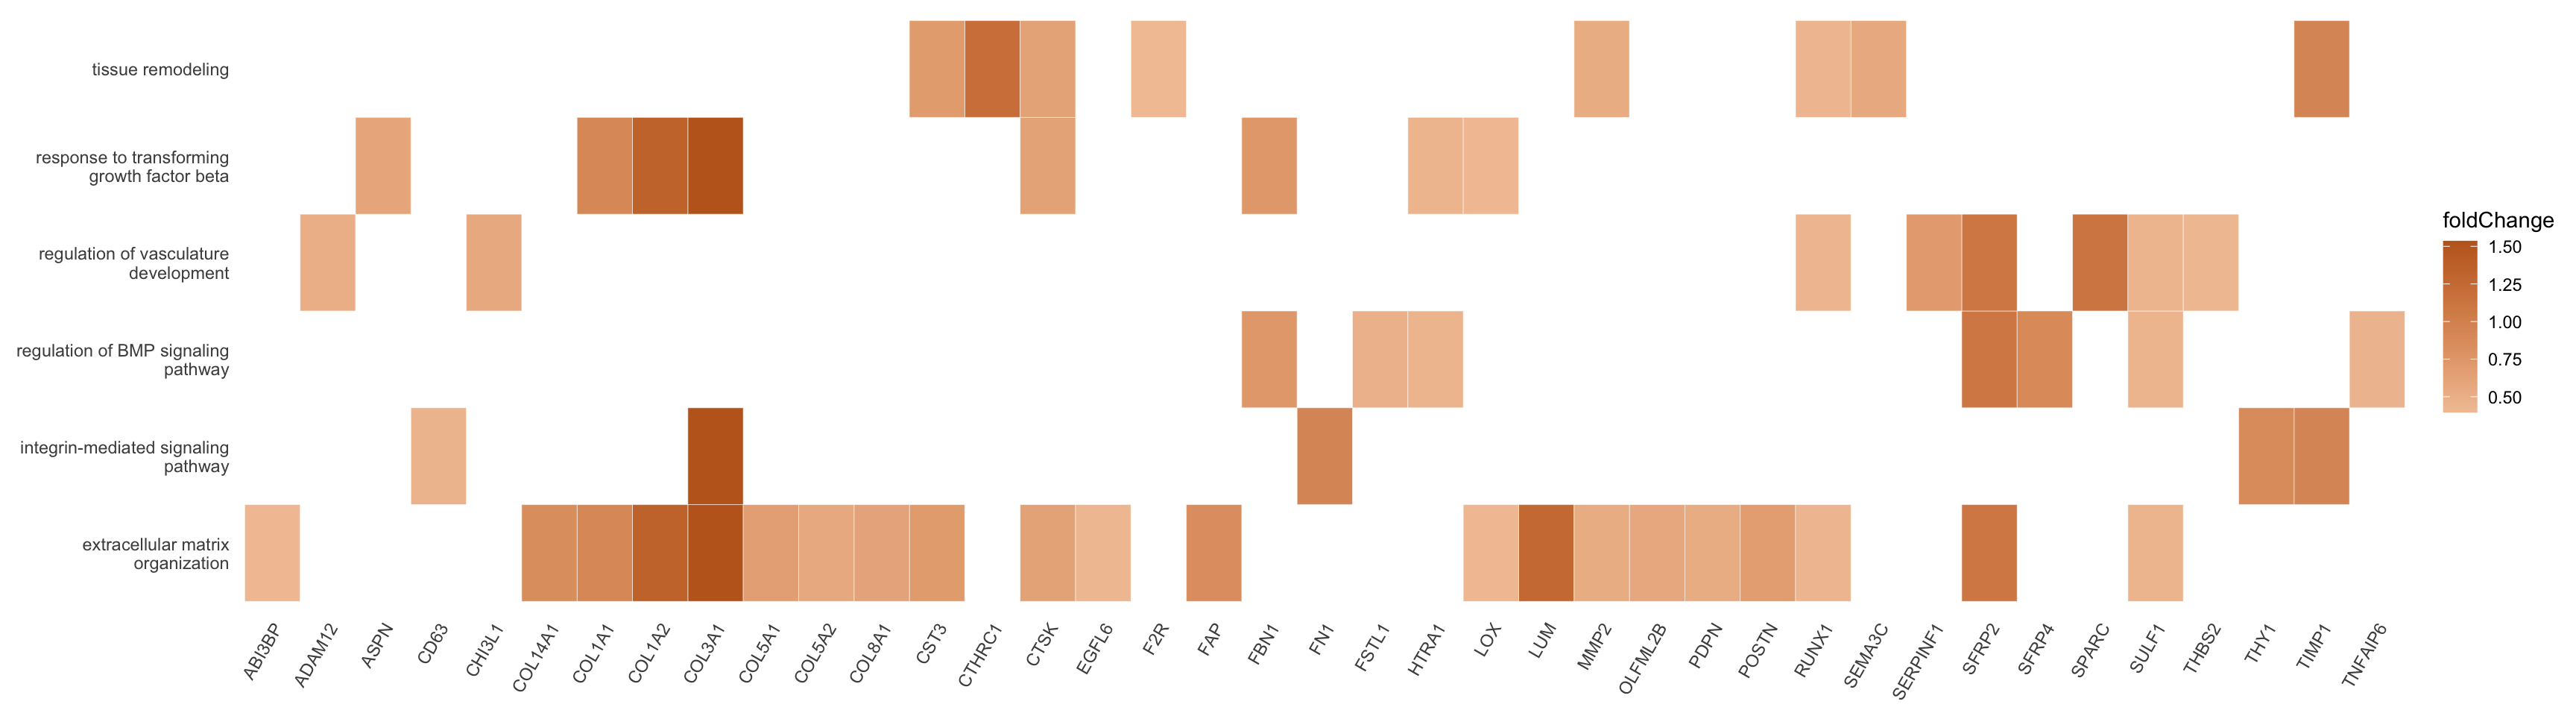
avg heatmap with sel genes of sel GO
genes <- data.frame(gene=rownames(seurat)) %>%
  mutate(geneID=gsub(".*\\.", "", gene))
Idents(seurat) <- seurat$clust_plus_cond
gapVecCol <- seq(2, length(levels(seurat$clust_plus_cond)), by=2)

geneVec <- data.frame(geneID=unique(p$data$Gene)) %>%
    left_join(., genes, by="geneID")

pOut <- avgHeatmap(seurat = seurat, selGenes = geneVec,
                  colVecIdent = colPal,
                  ordVec=levels(seurat),
                  gapVecR=NULL, gapVecC=gapVecCol,cc=FALSE,
                  cr=T, condCol=T, colVecCond = colCond2)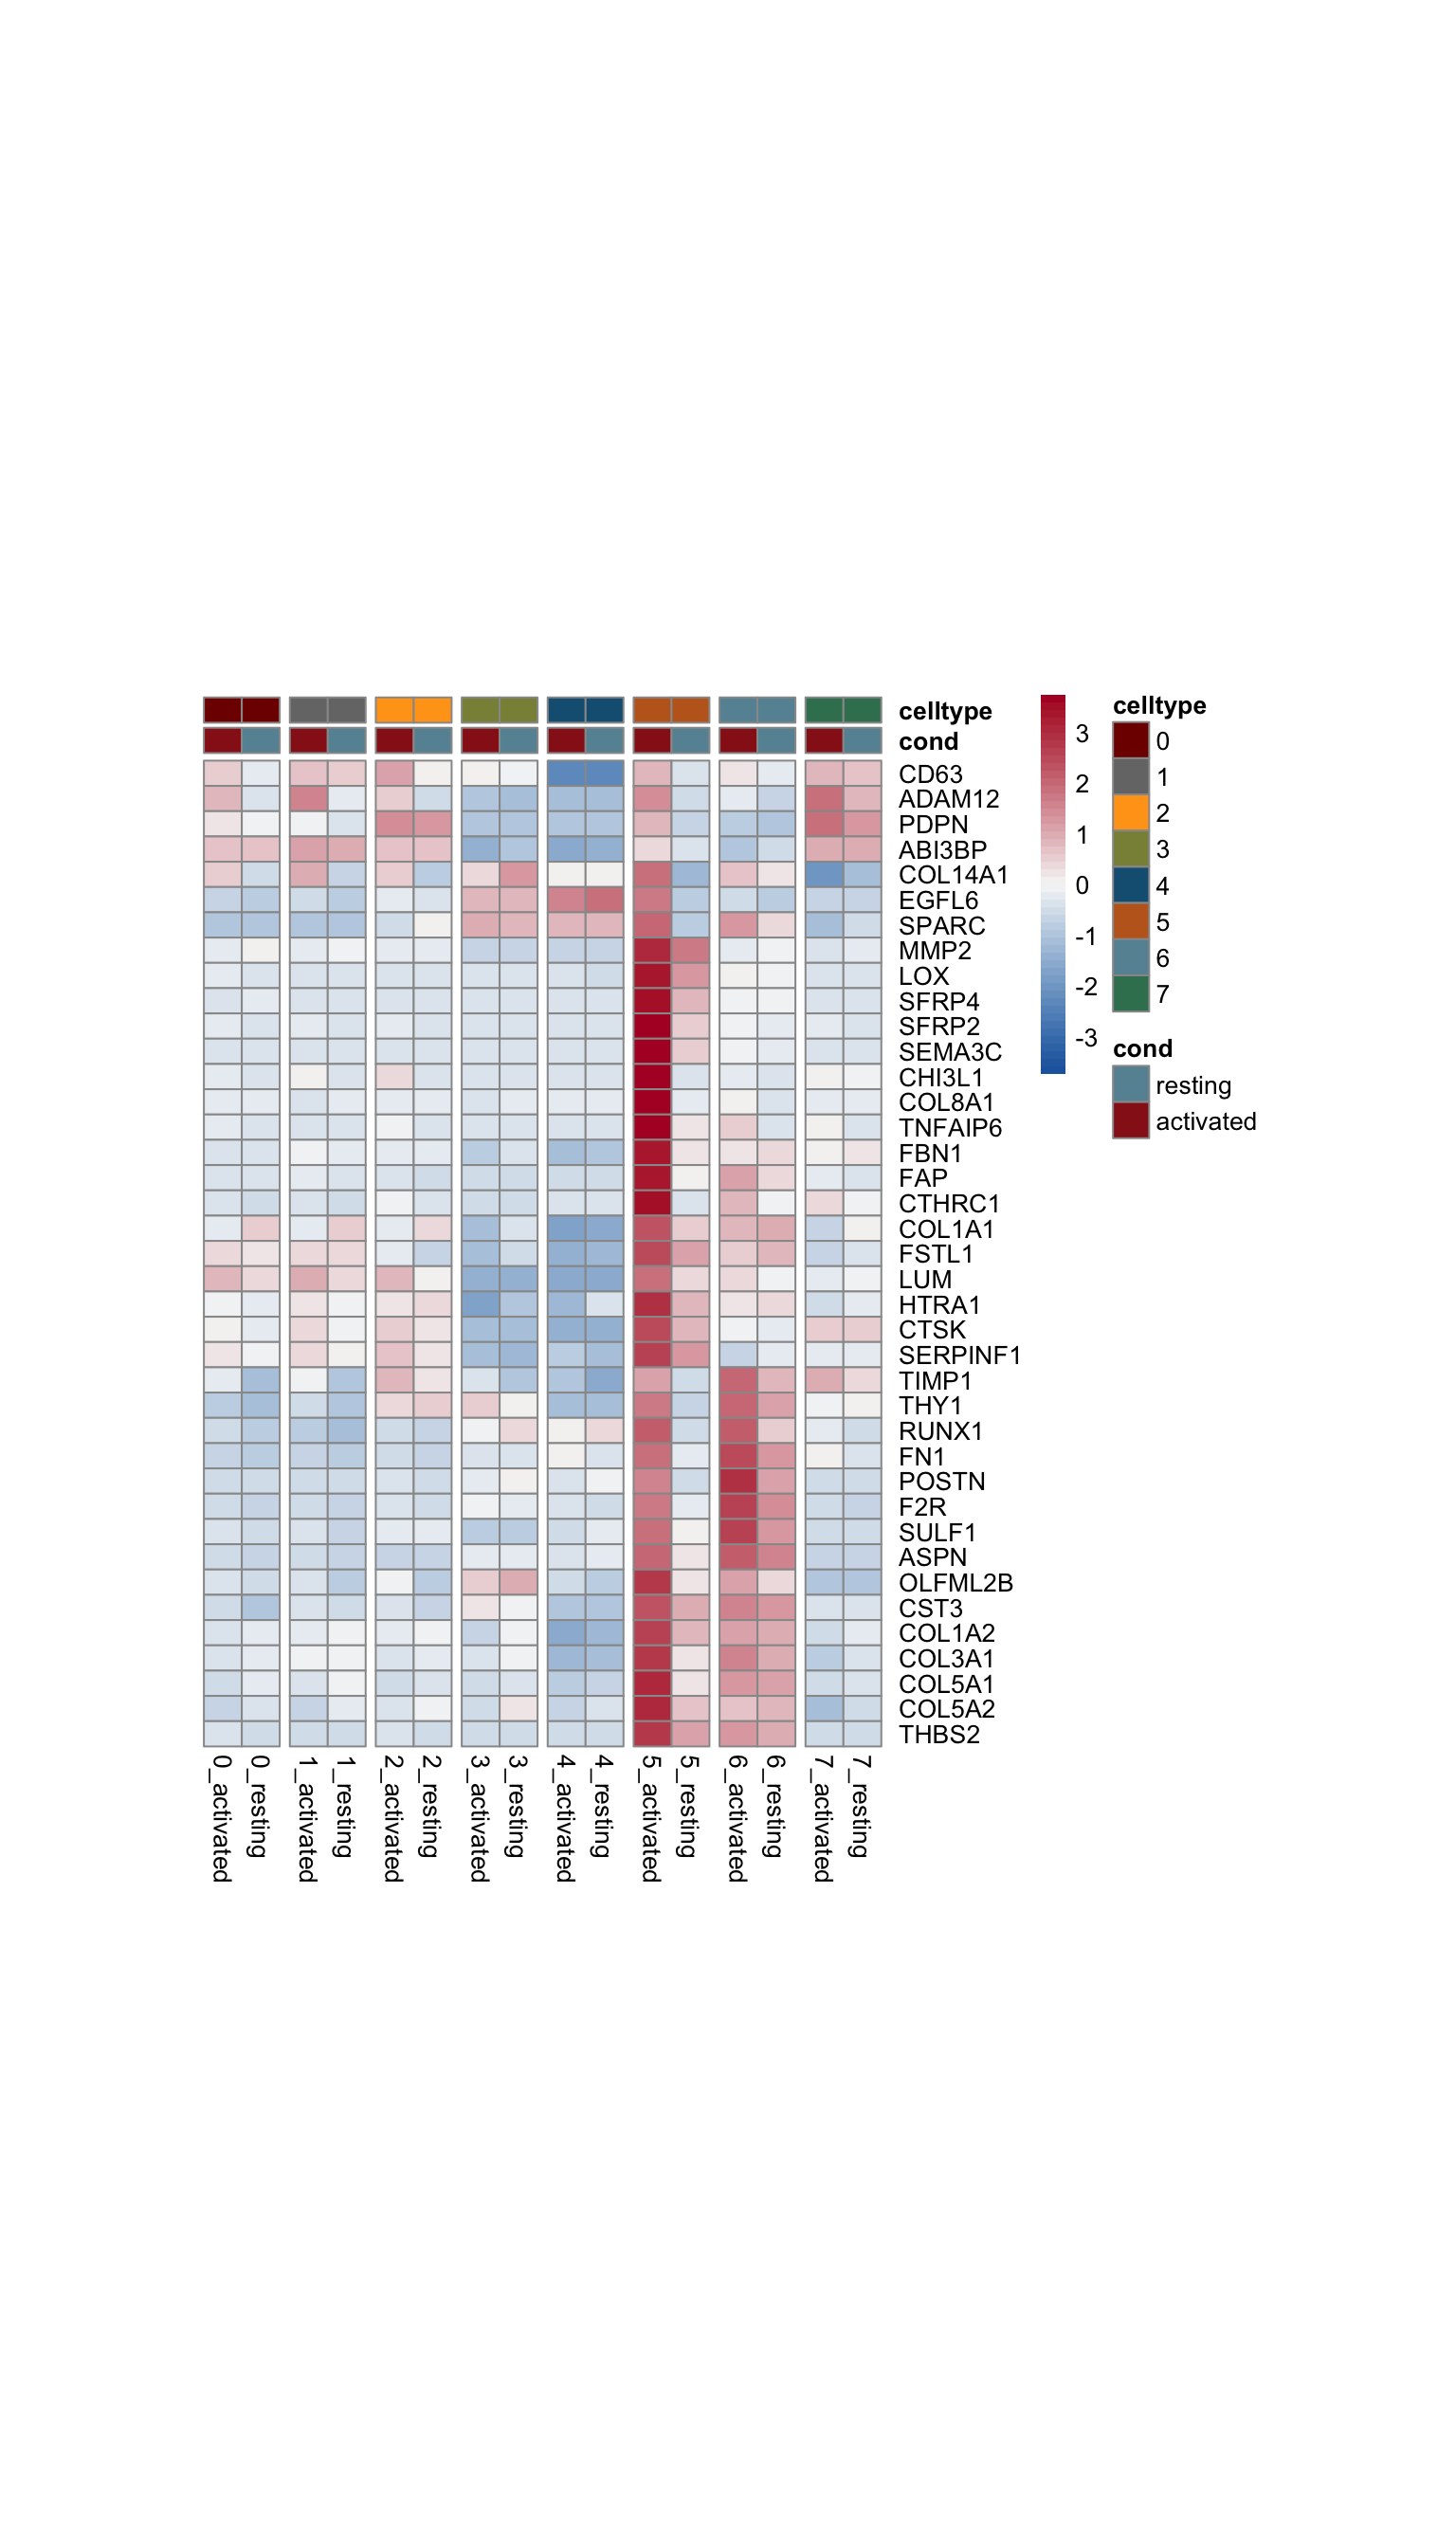
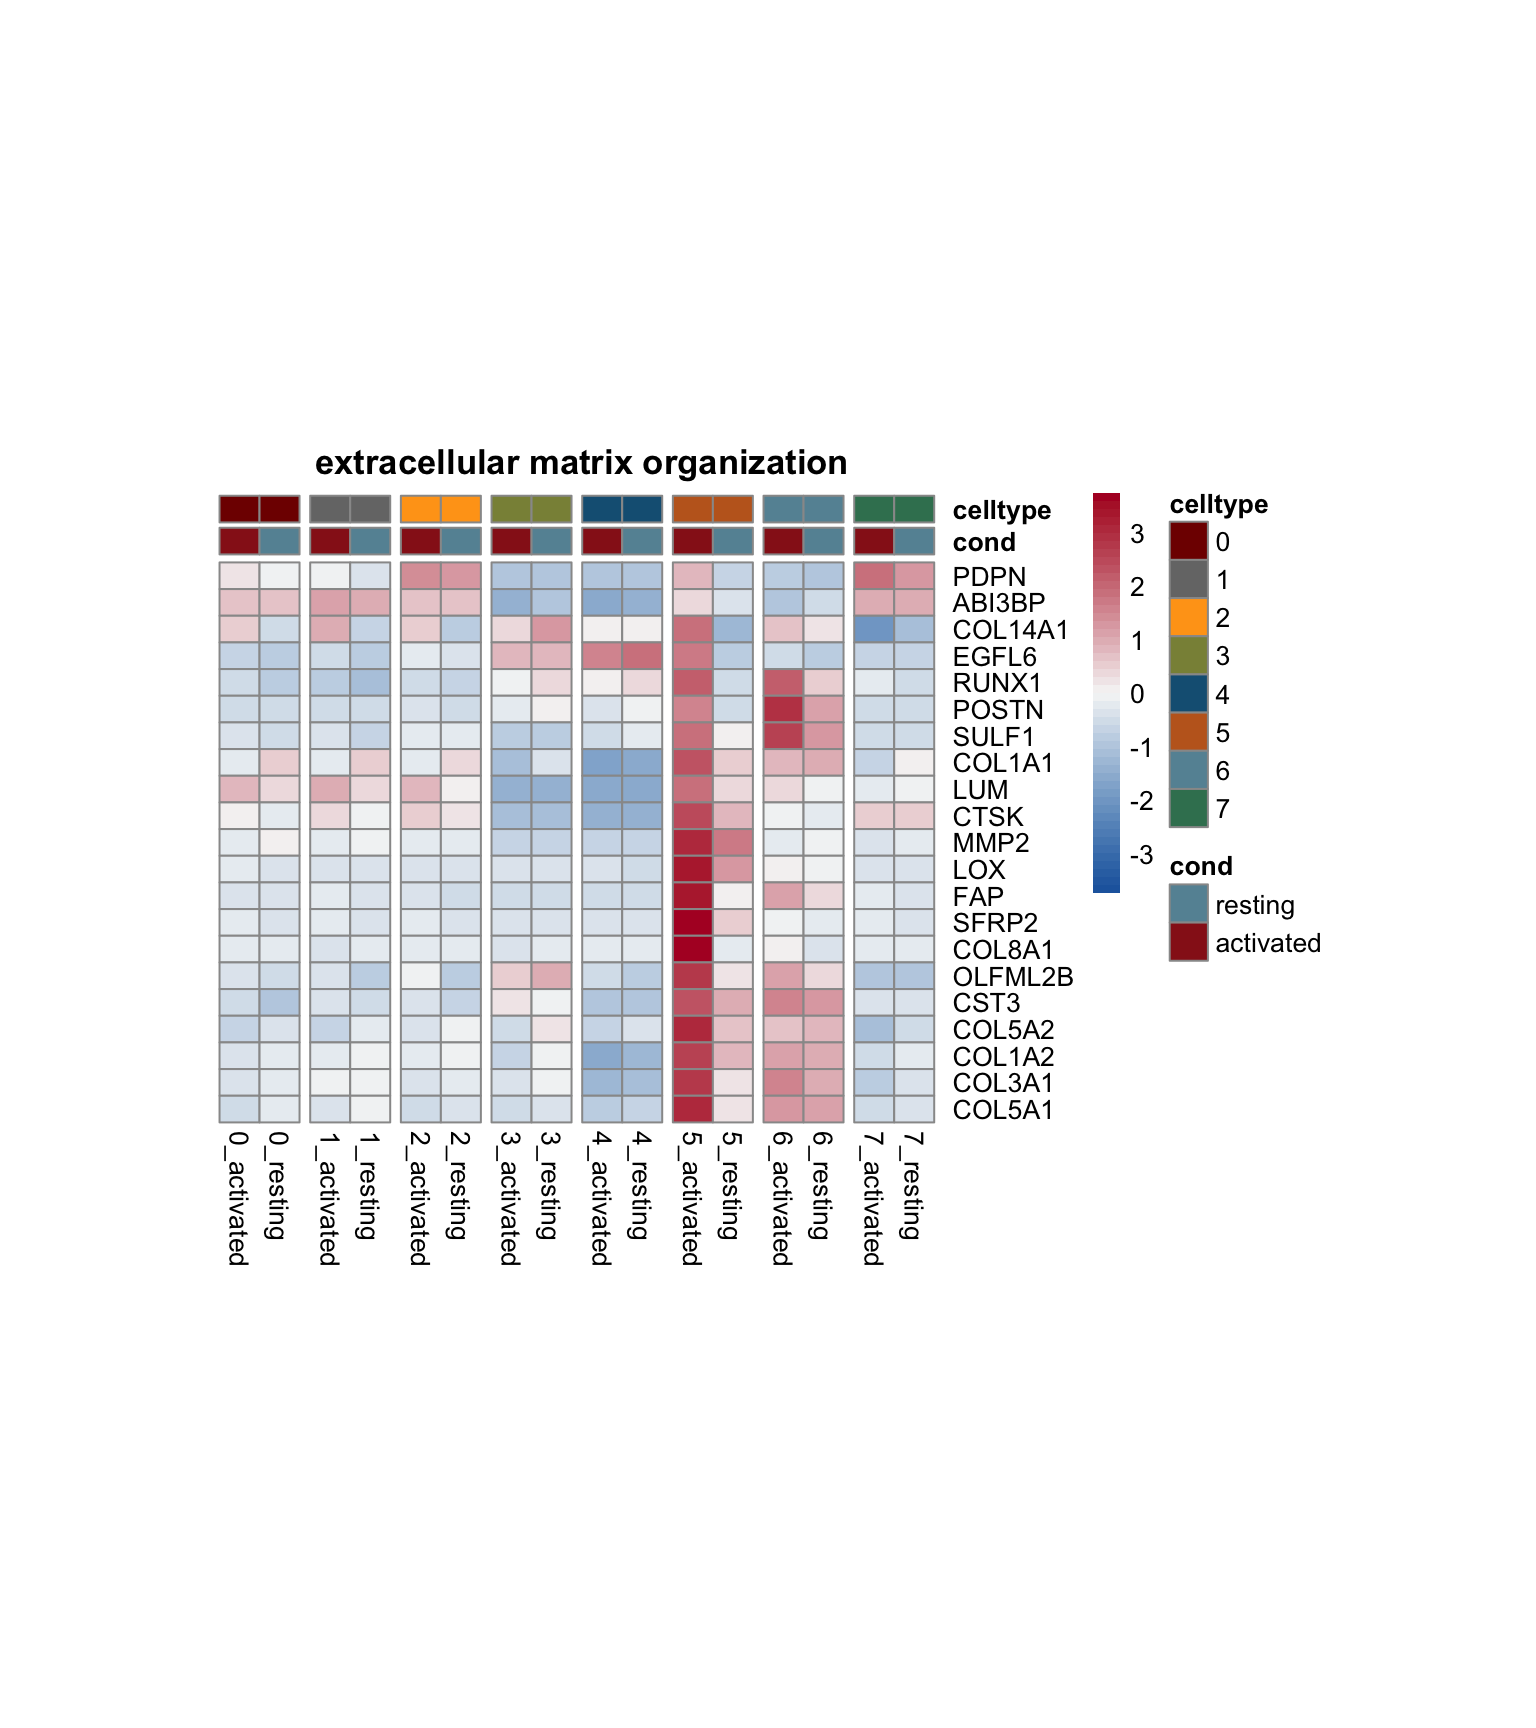
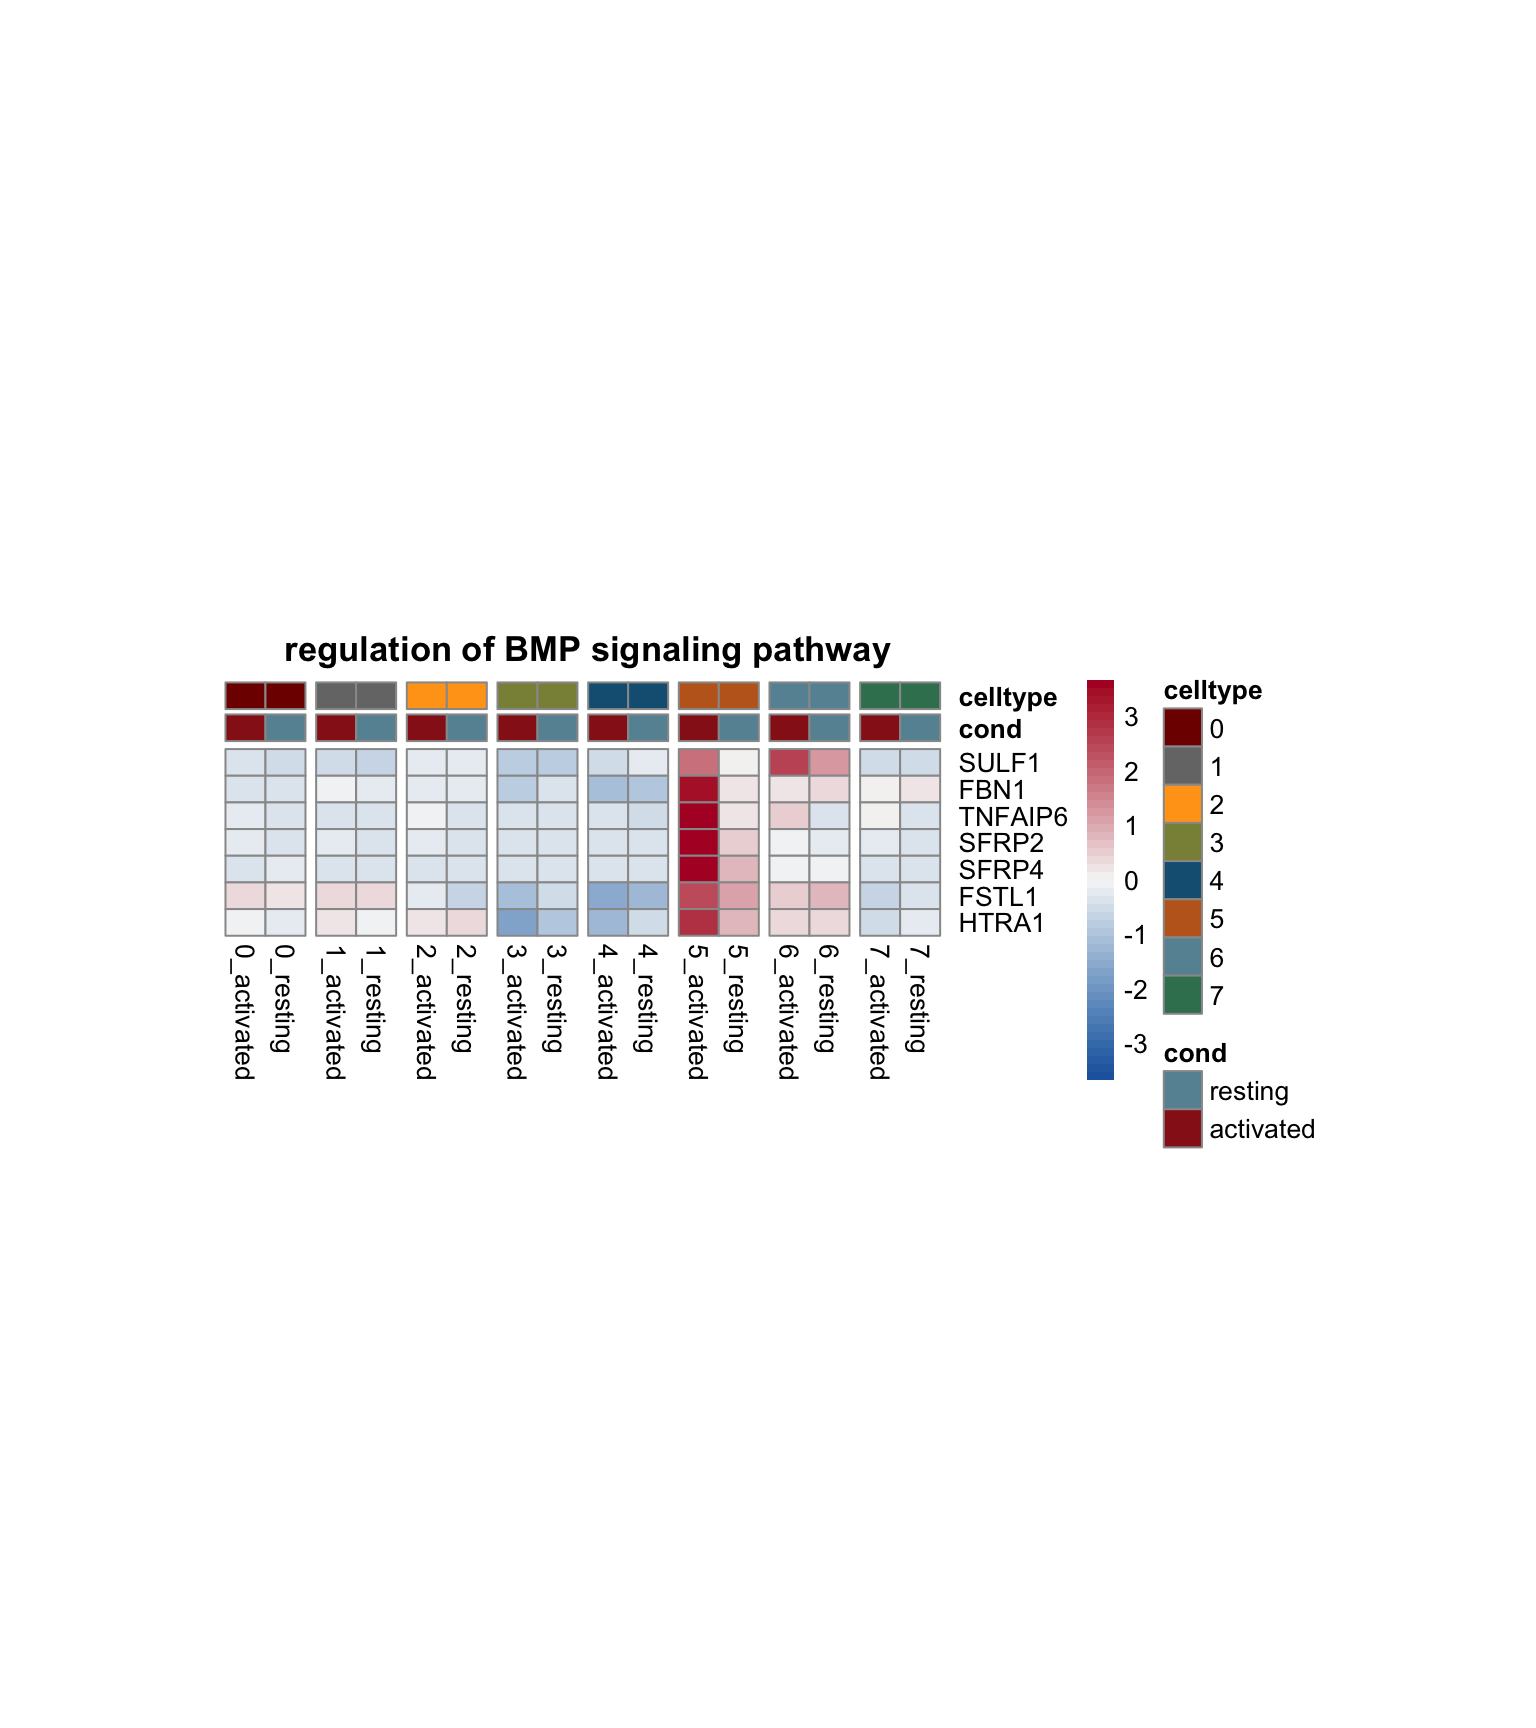
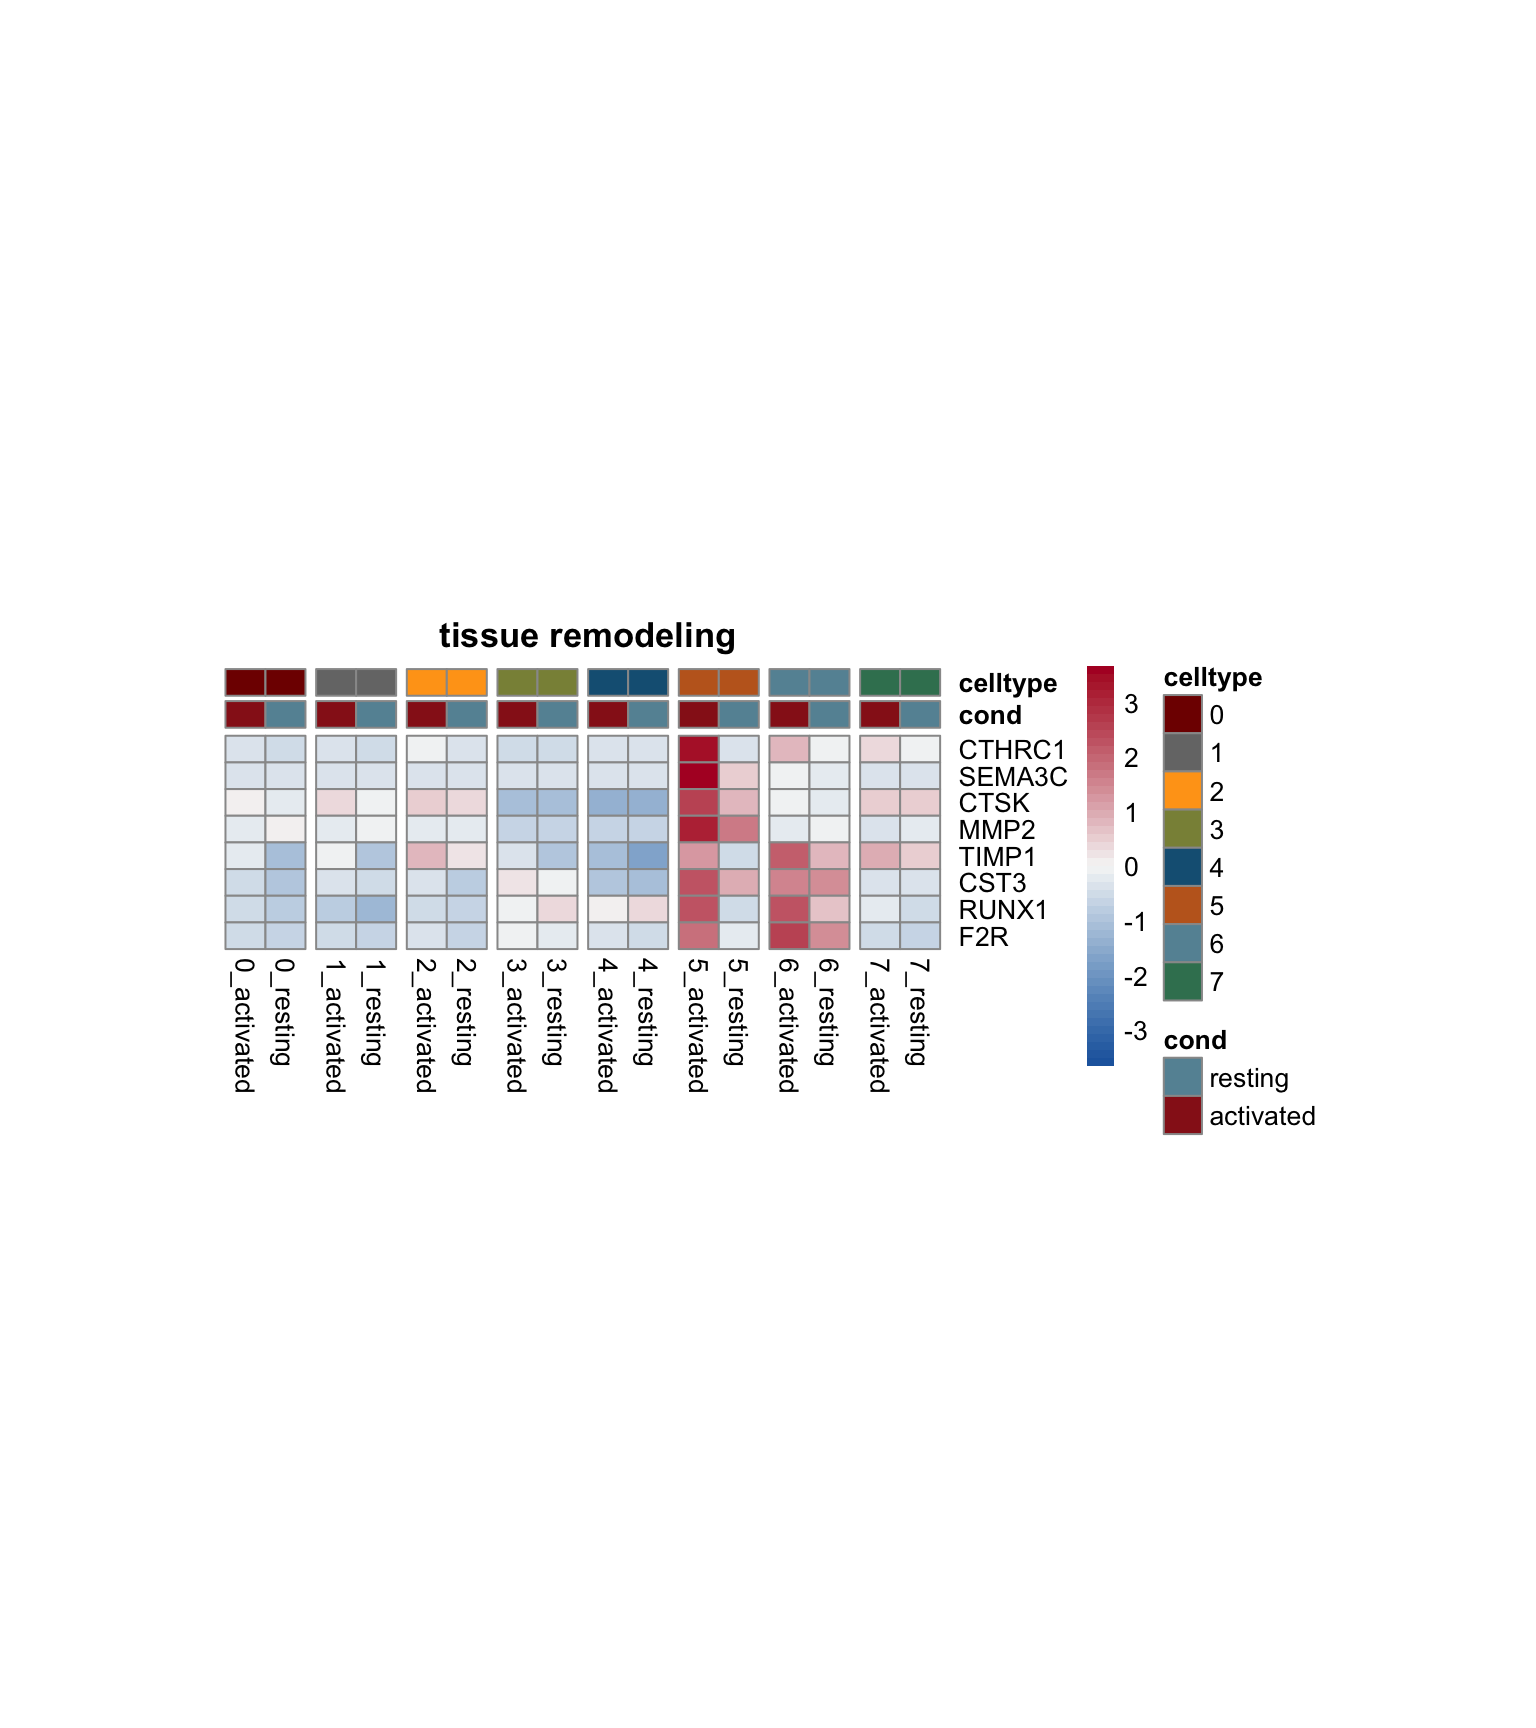
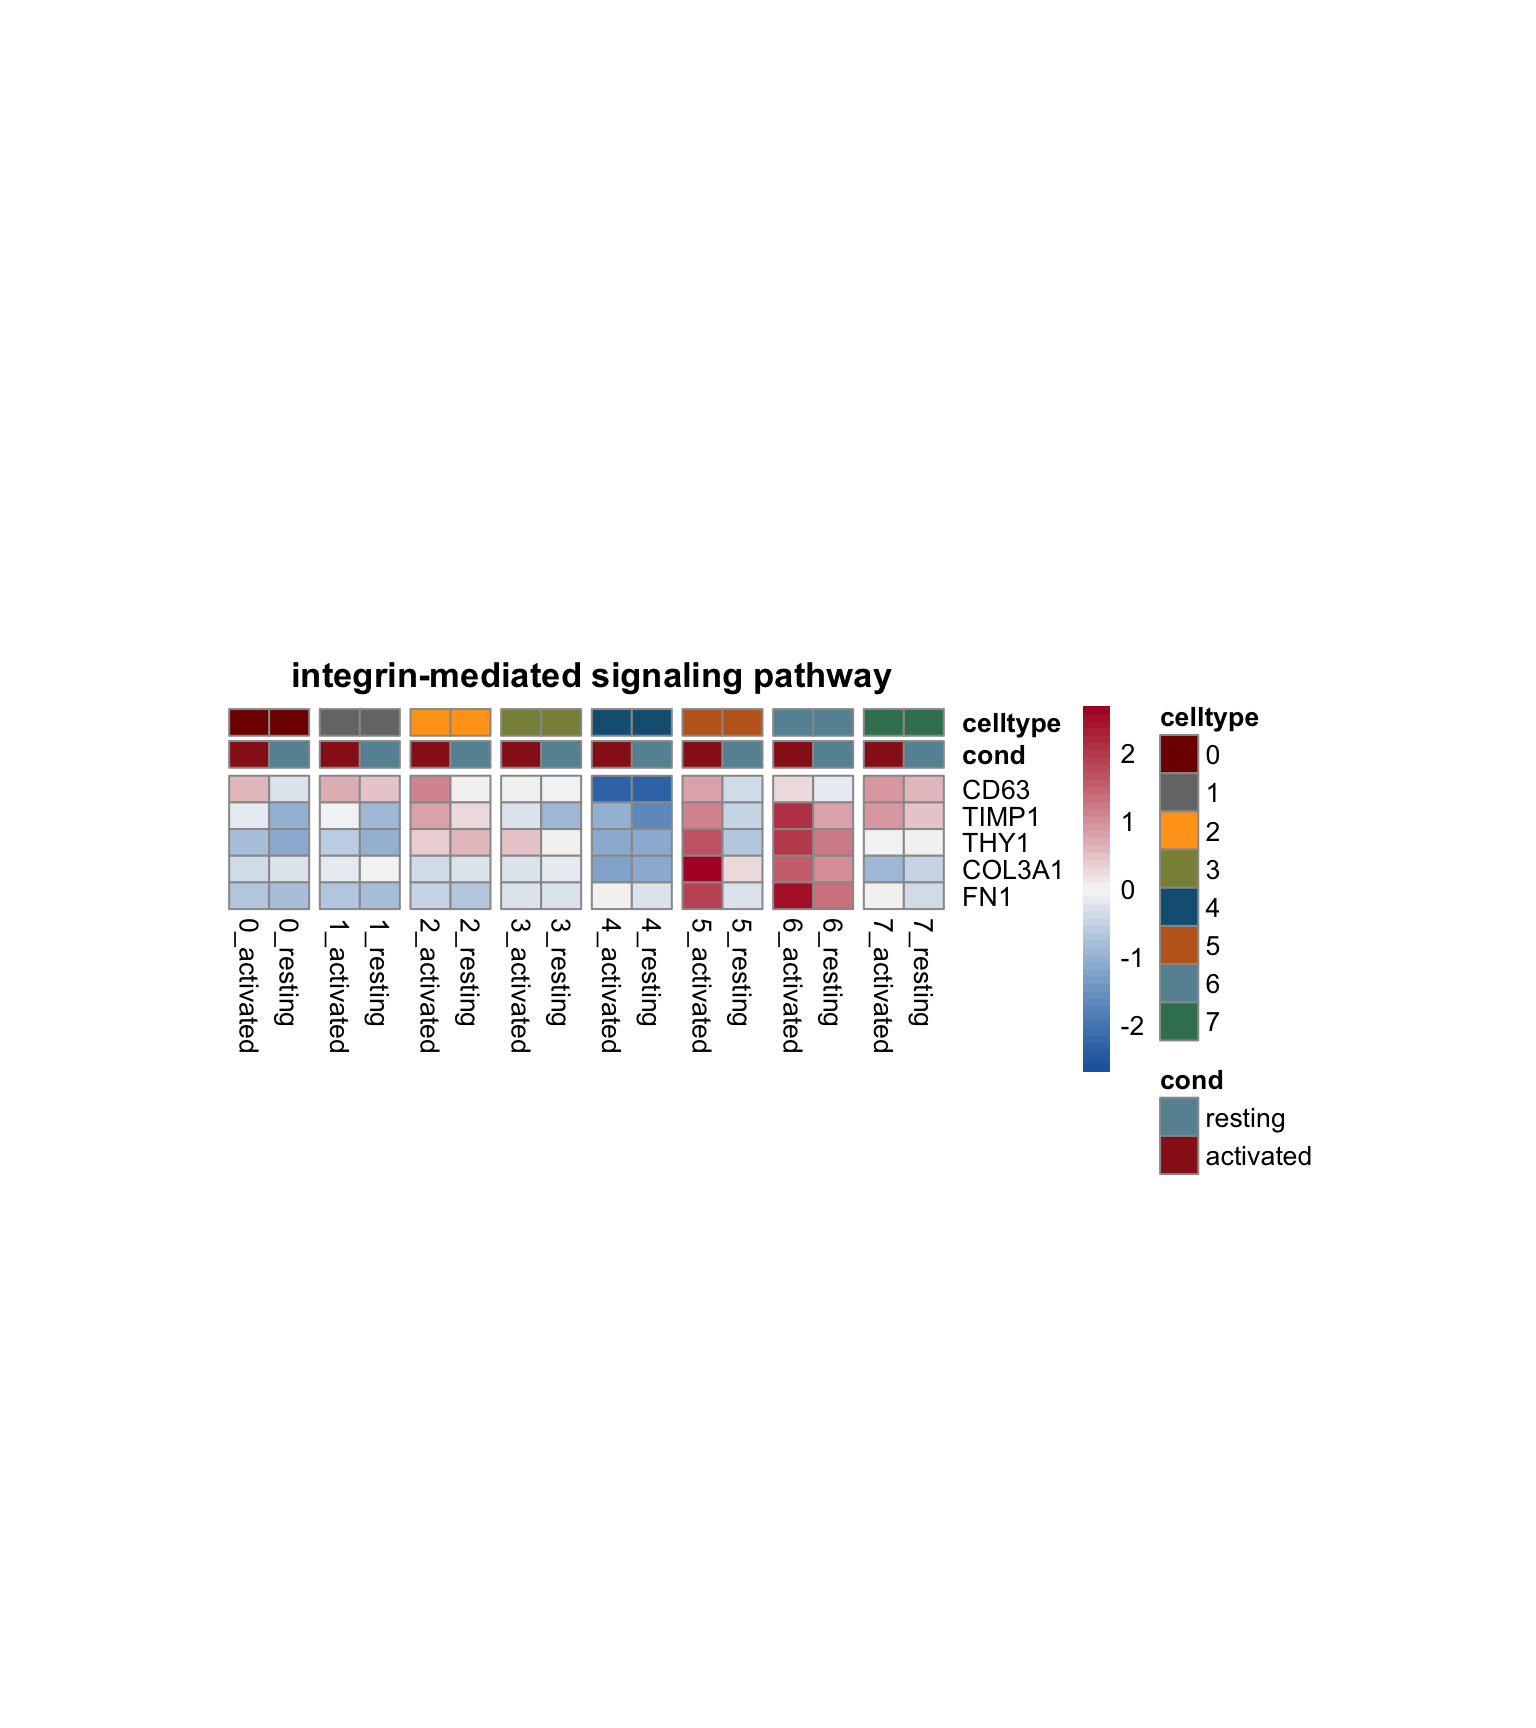
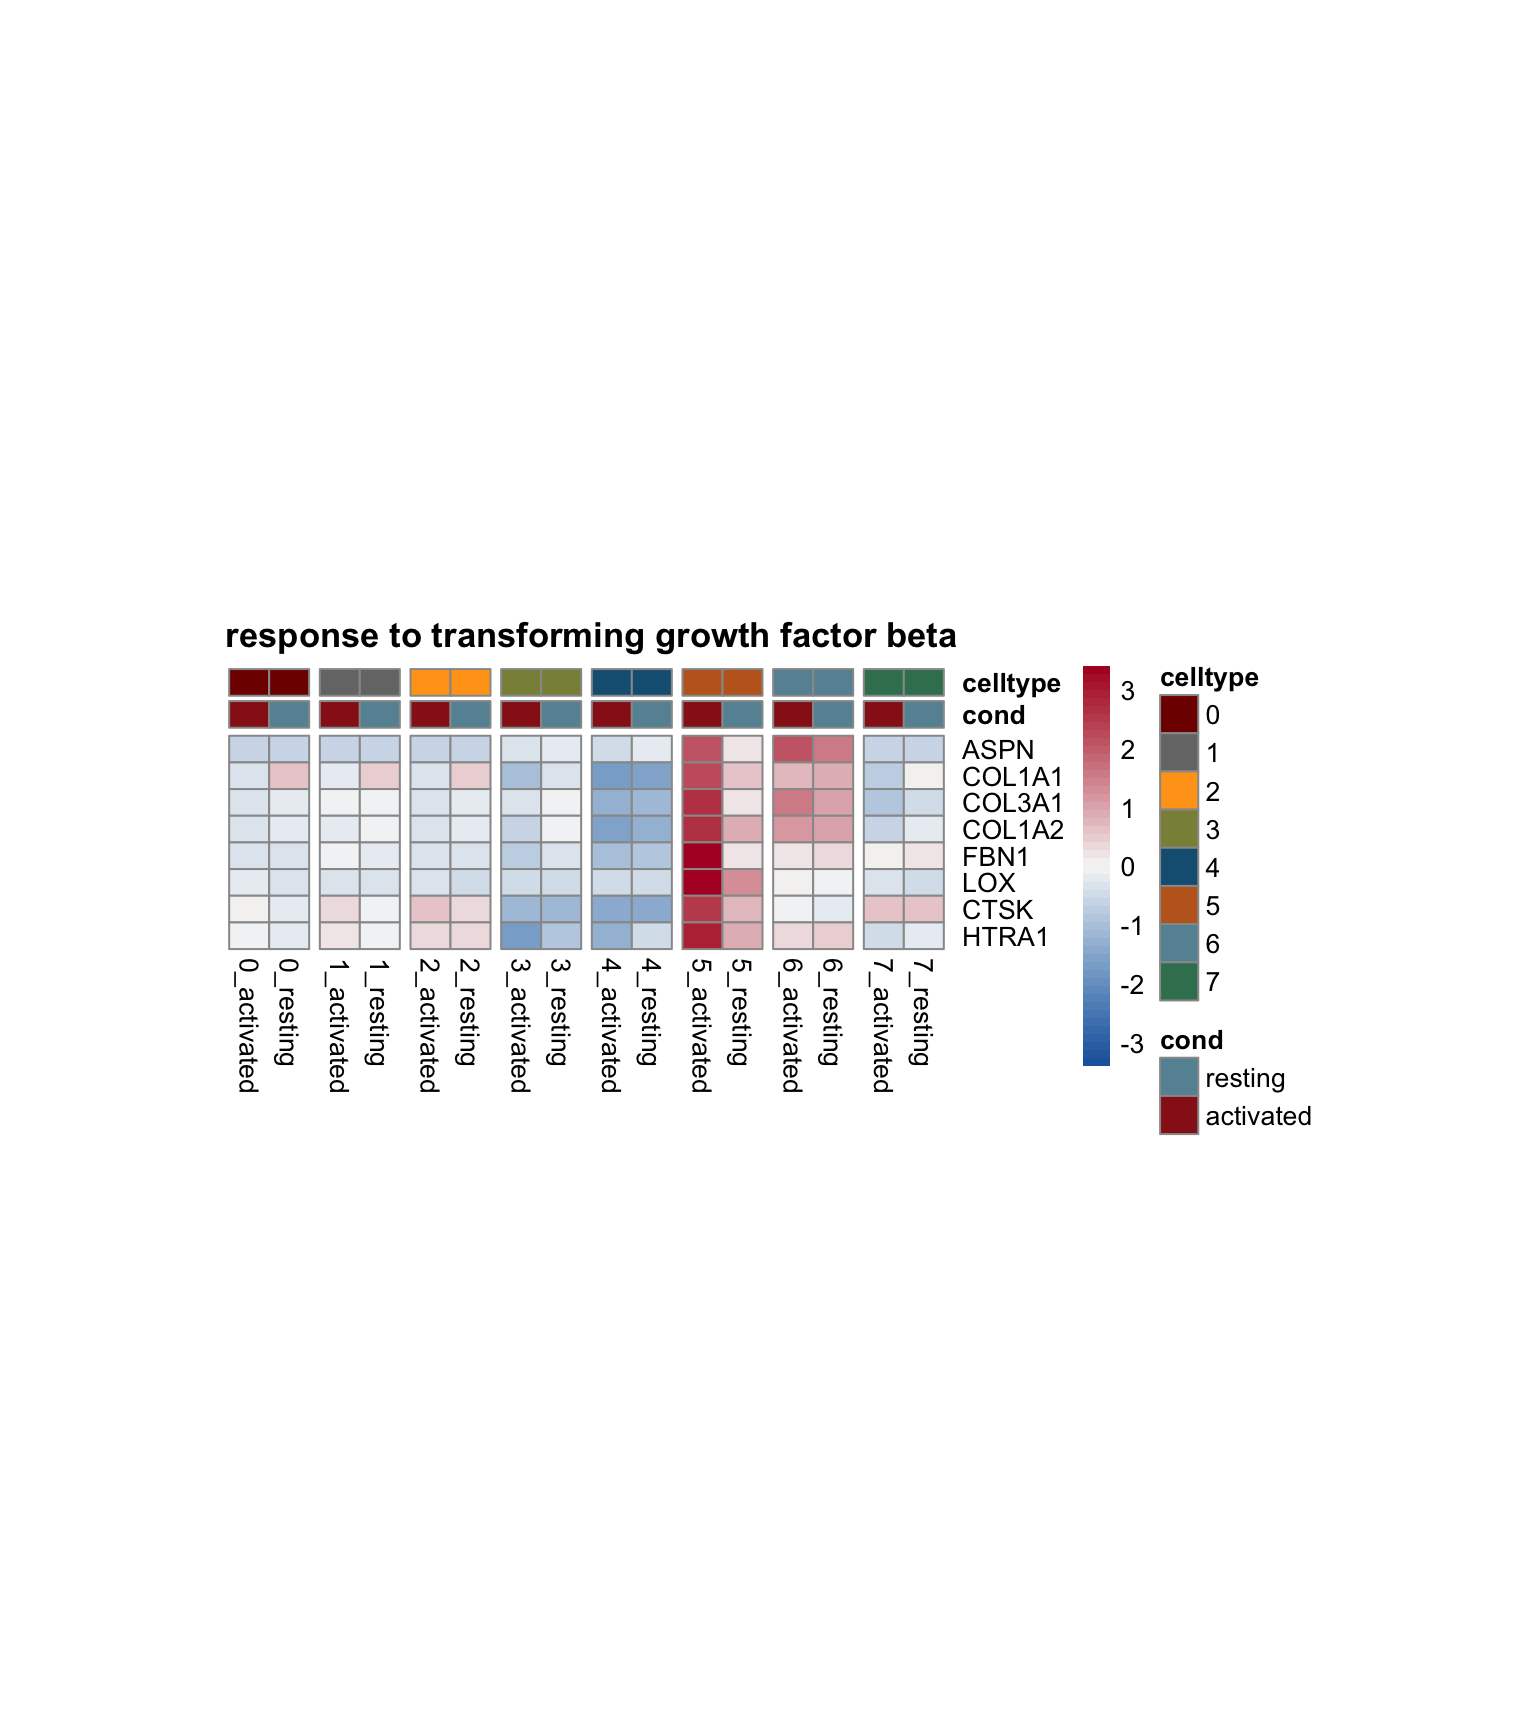
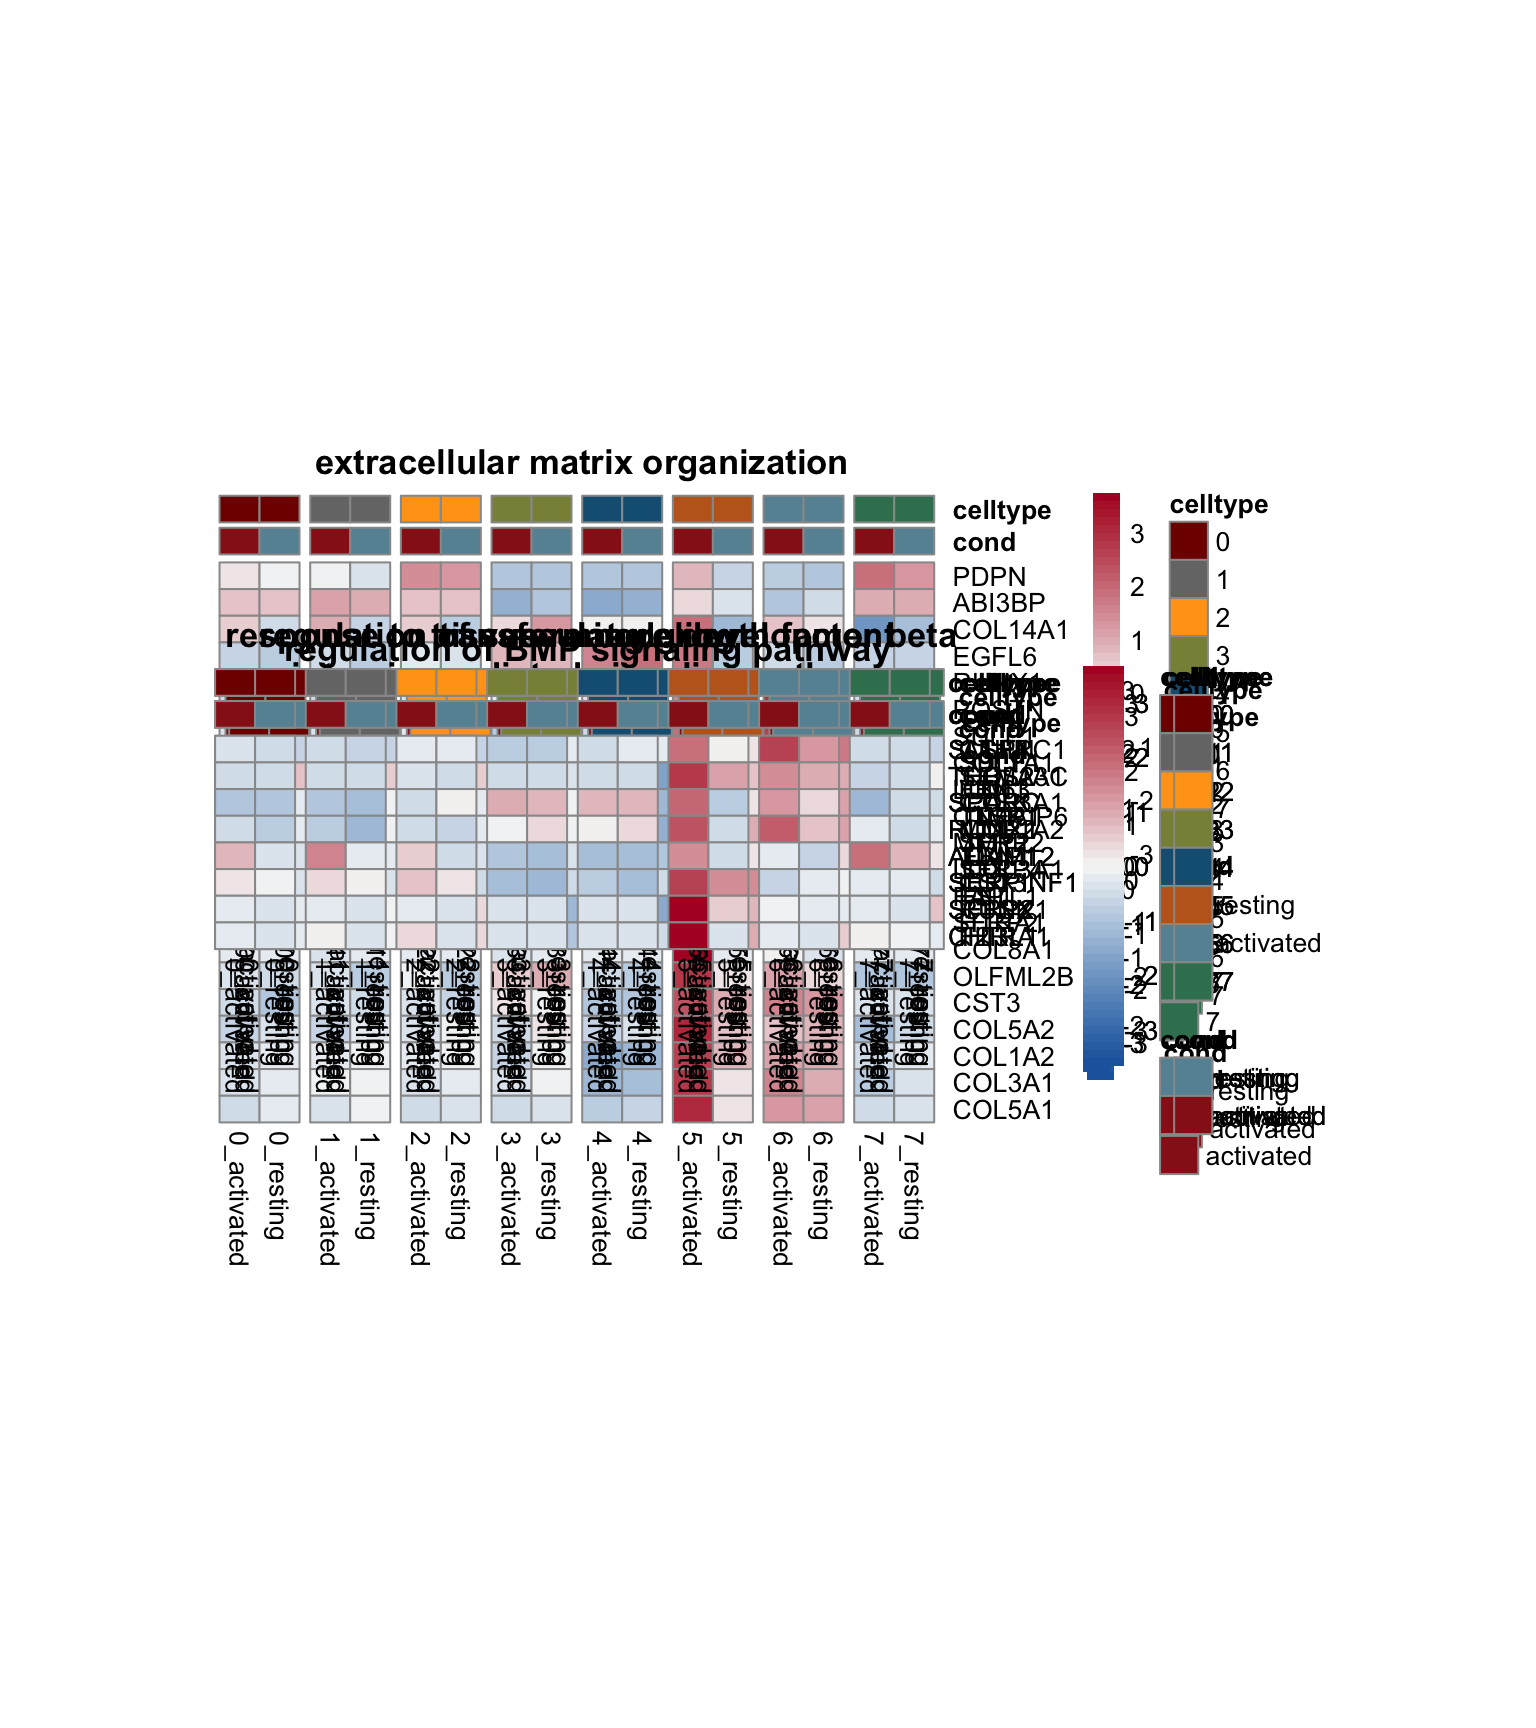
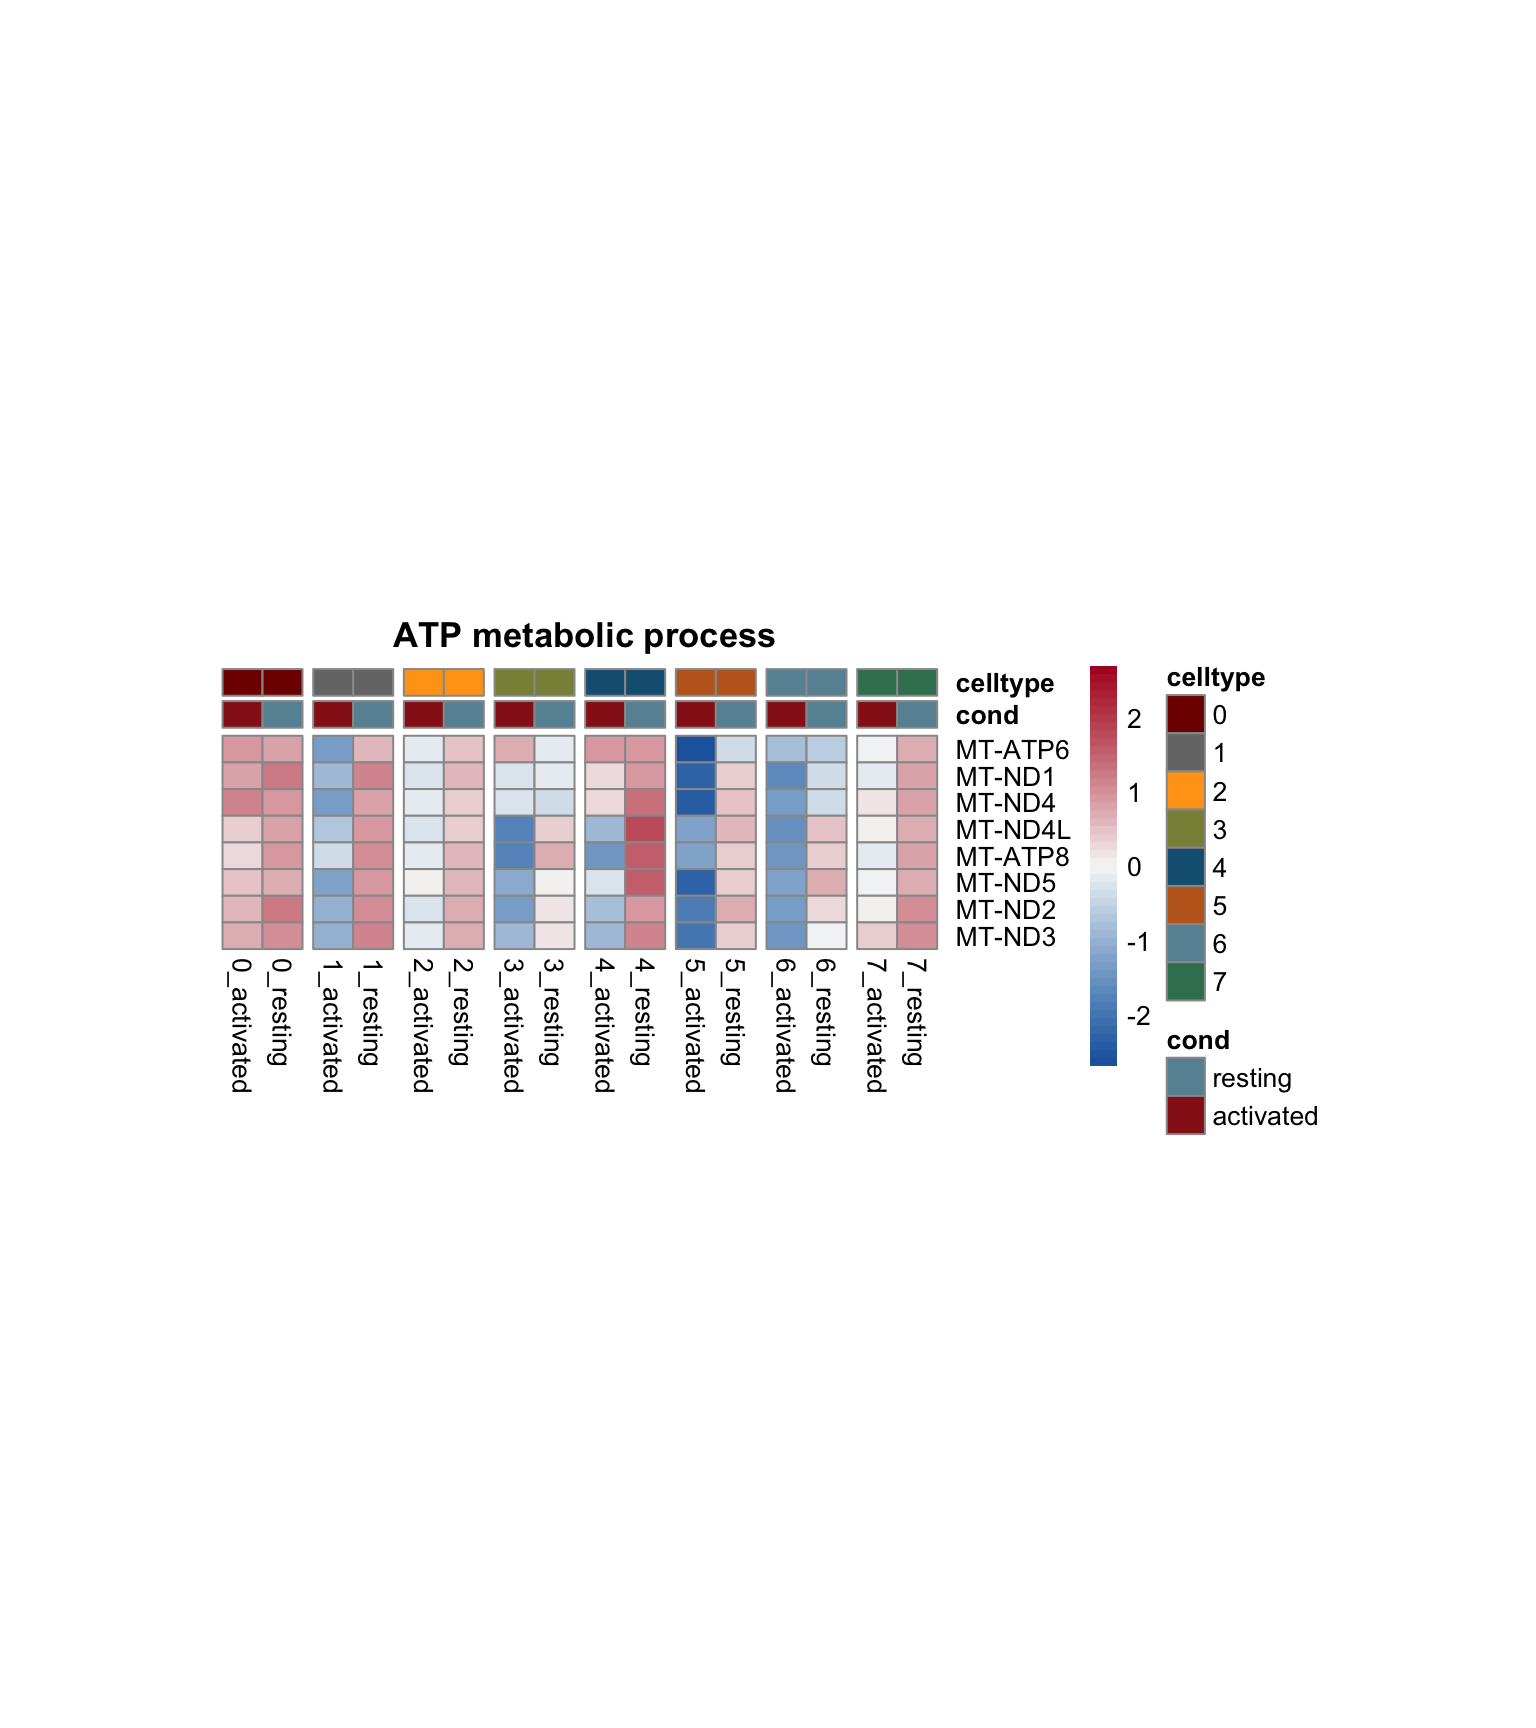
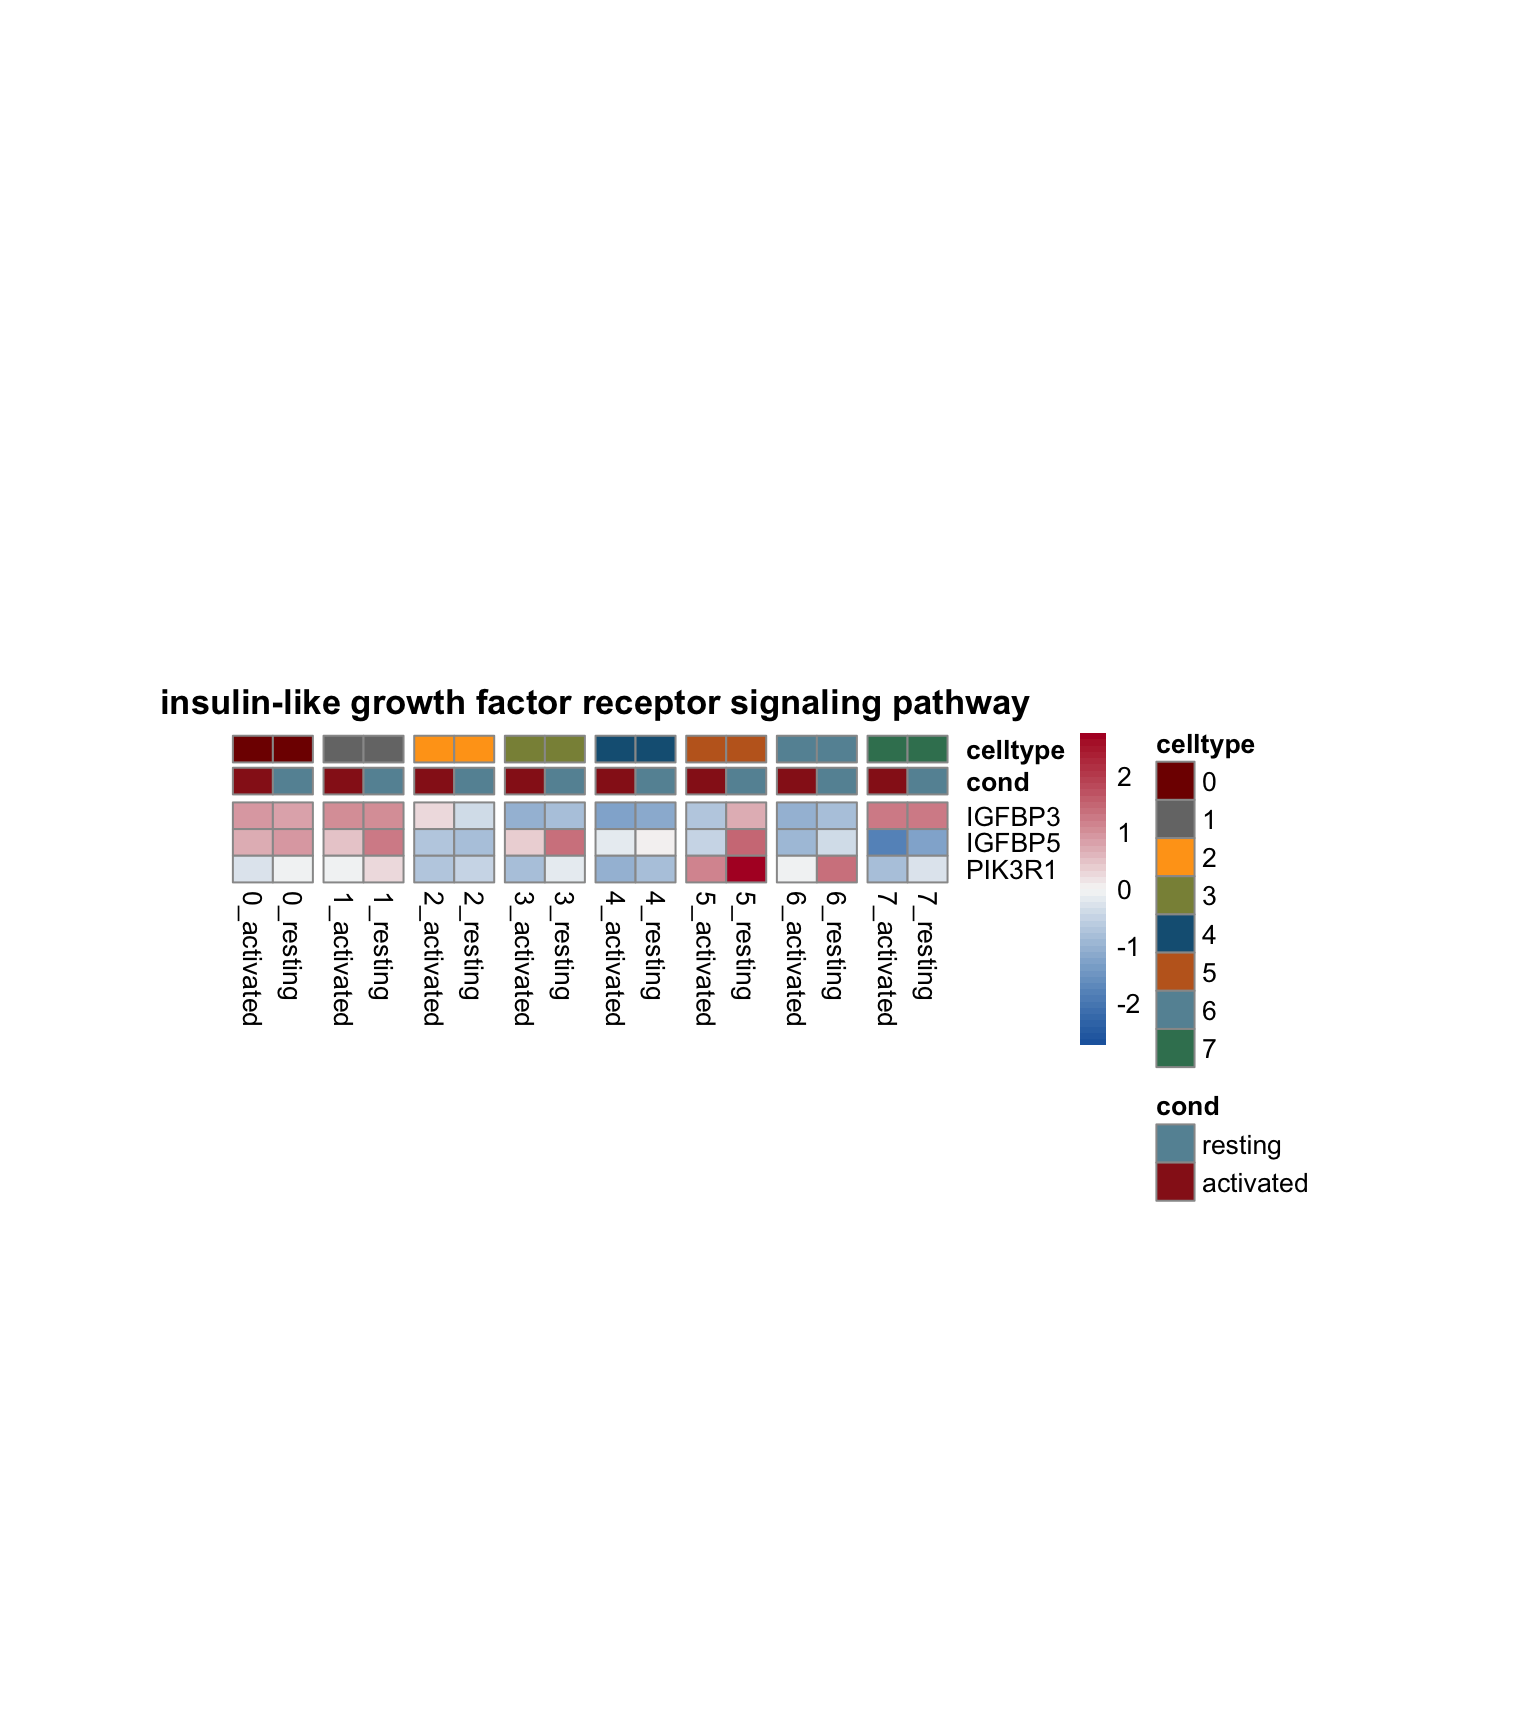
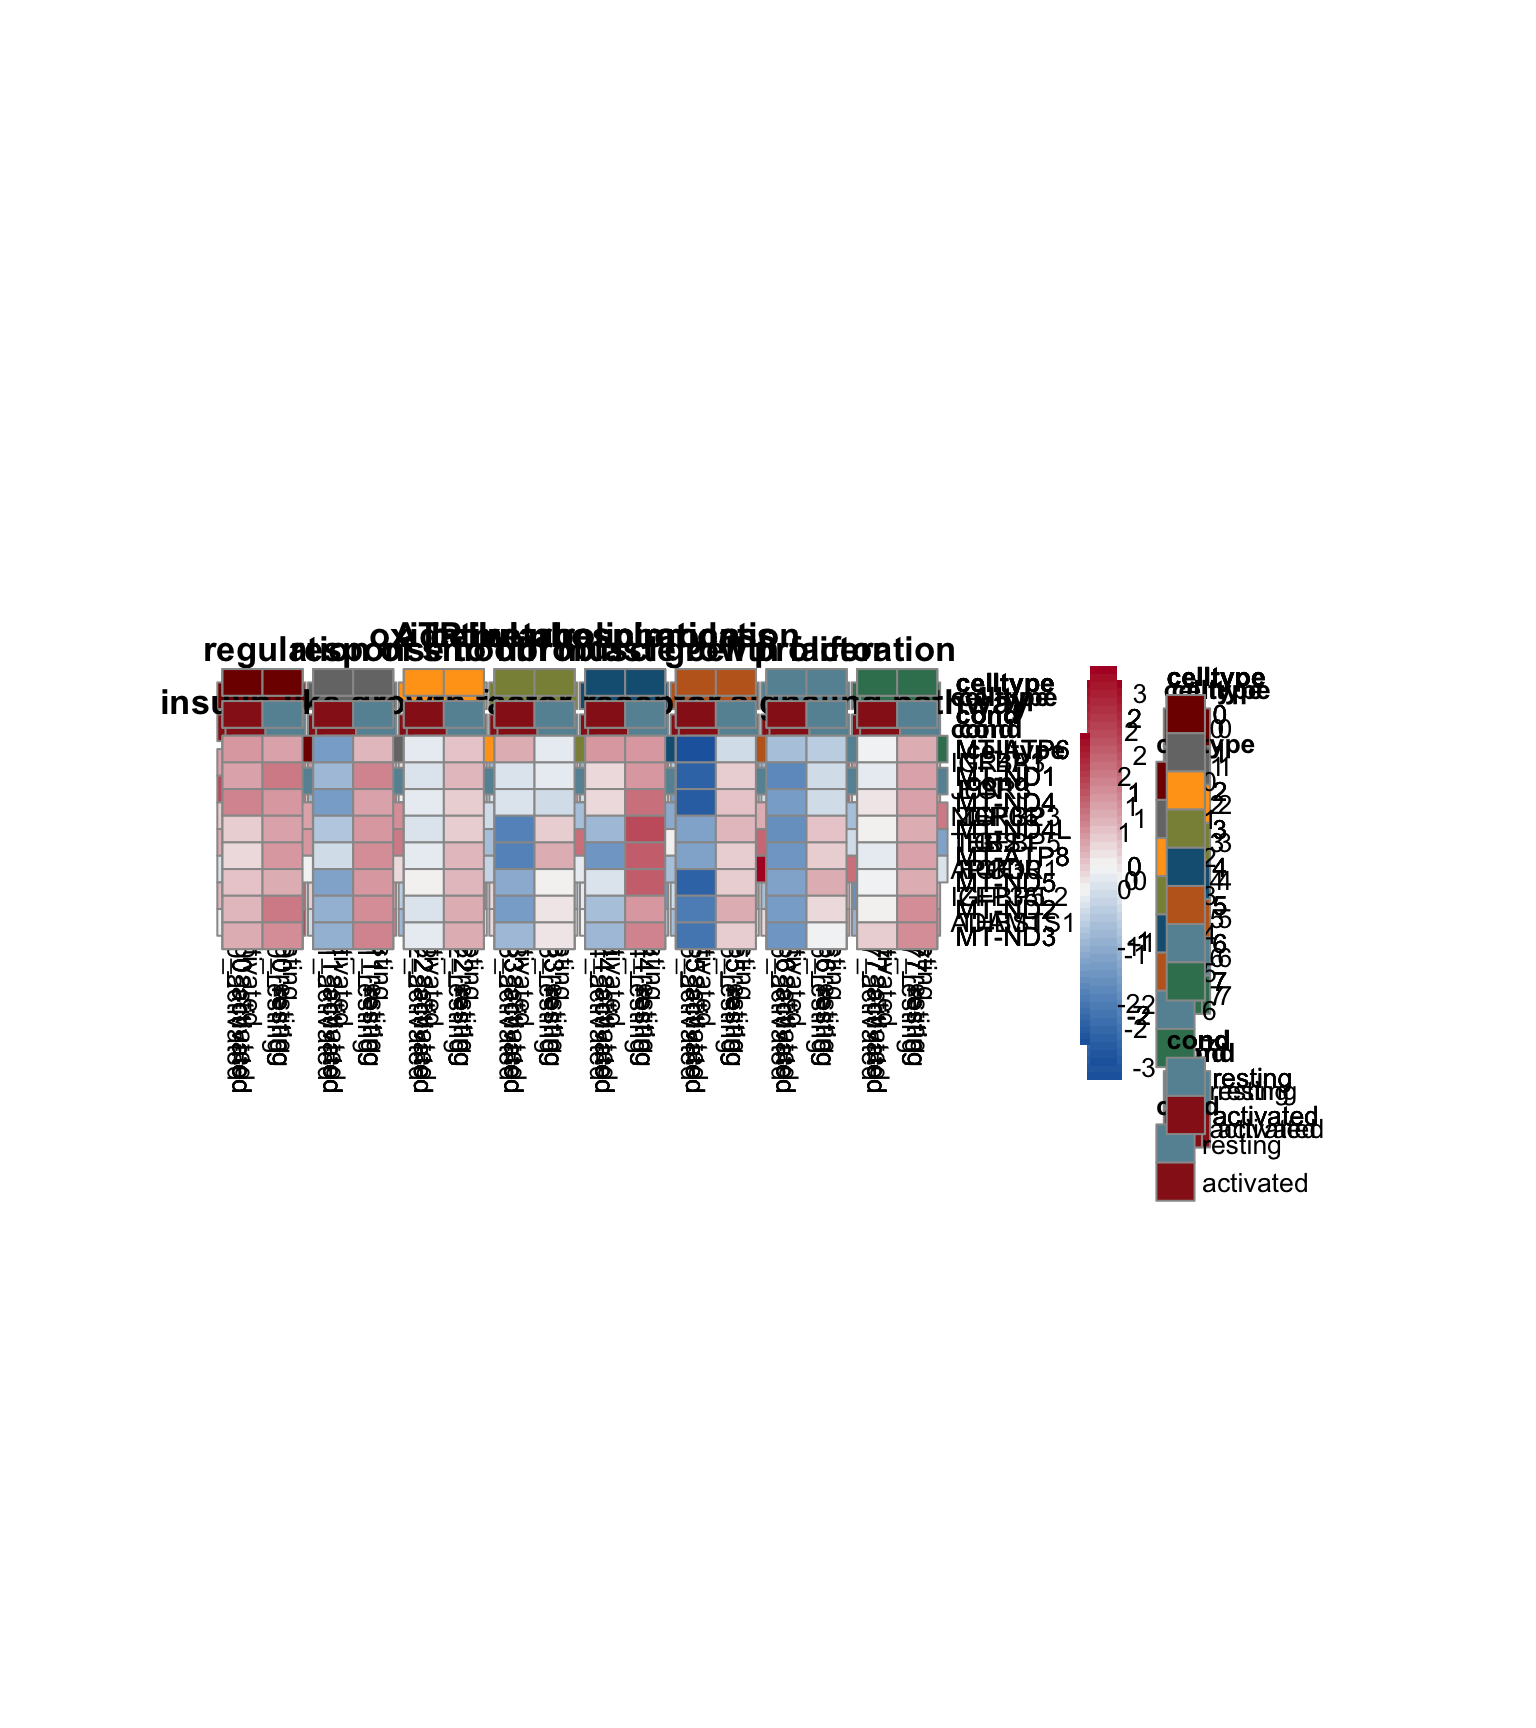
avg heatmap with genes of each sel GO
genes <- data.frame(gene=rownames(seurat)) %>%
  mutate(geneID=gsub(".*\\.", "", gene))
Idents(seurat) <- seurat$clust_plus_cond
gapVecCol <- seq(2, length(levels(seurat$clust_plus_cond)), by=2)

lapply(selGO, function(id){
  geneStr <- egoADat[id,"geneID"]
  geneVec <- data.frame(geneID=unlist(strsplit(geneStr, "/"))) %>%
    left_join(., genes, by="geneID")

  pOut <- avgHeatmap(seurat = seurat, selGenes = geneVec,
                  colVecIdent = colPal,
                  ordVec=levels(seurat),
                  gapVecR=NULL, gapVecC=gapVecCol,cc=FALSE,
                  cr=T, condCol=T, colVecCond = colCond2,
                  main = egoADat[id,"Description"])

})
[[1]]

[[2]]

[[3]]

[[4]]

[[5]]

[[6]]
vis top genes Pi16+RC resting
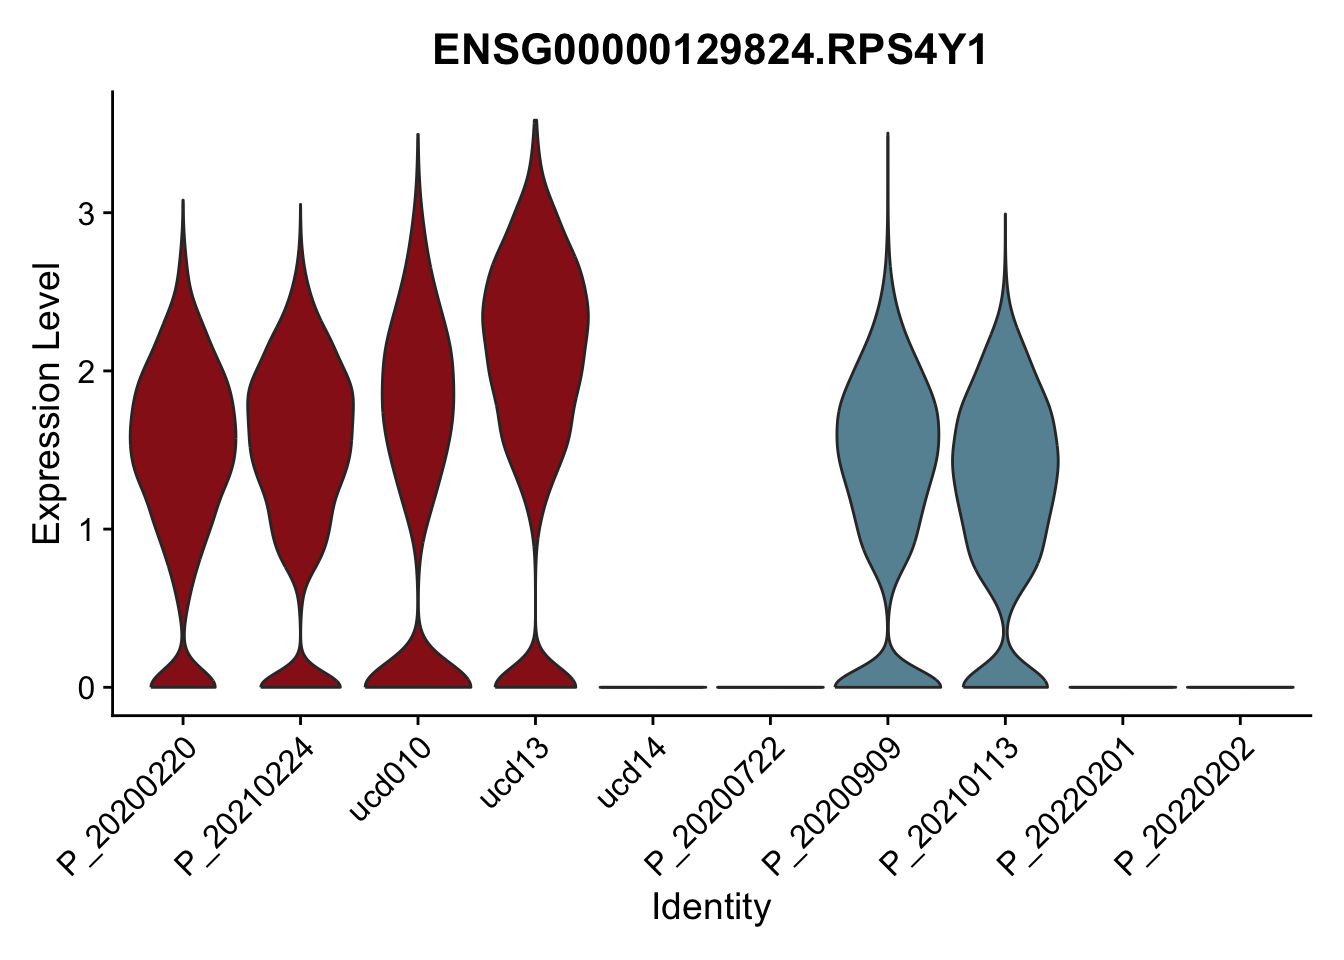
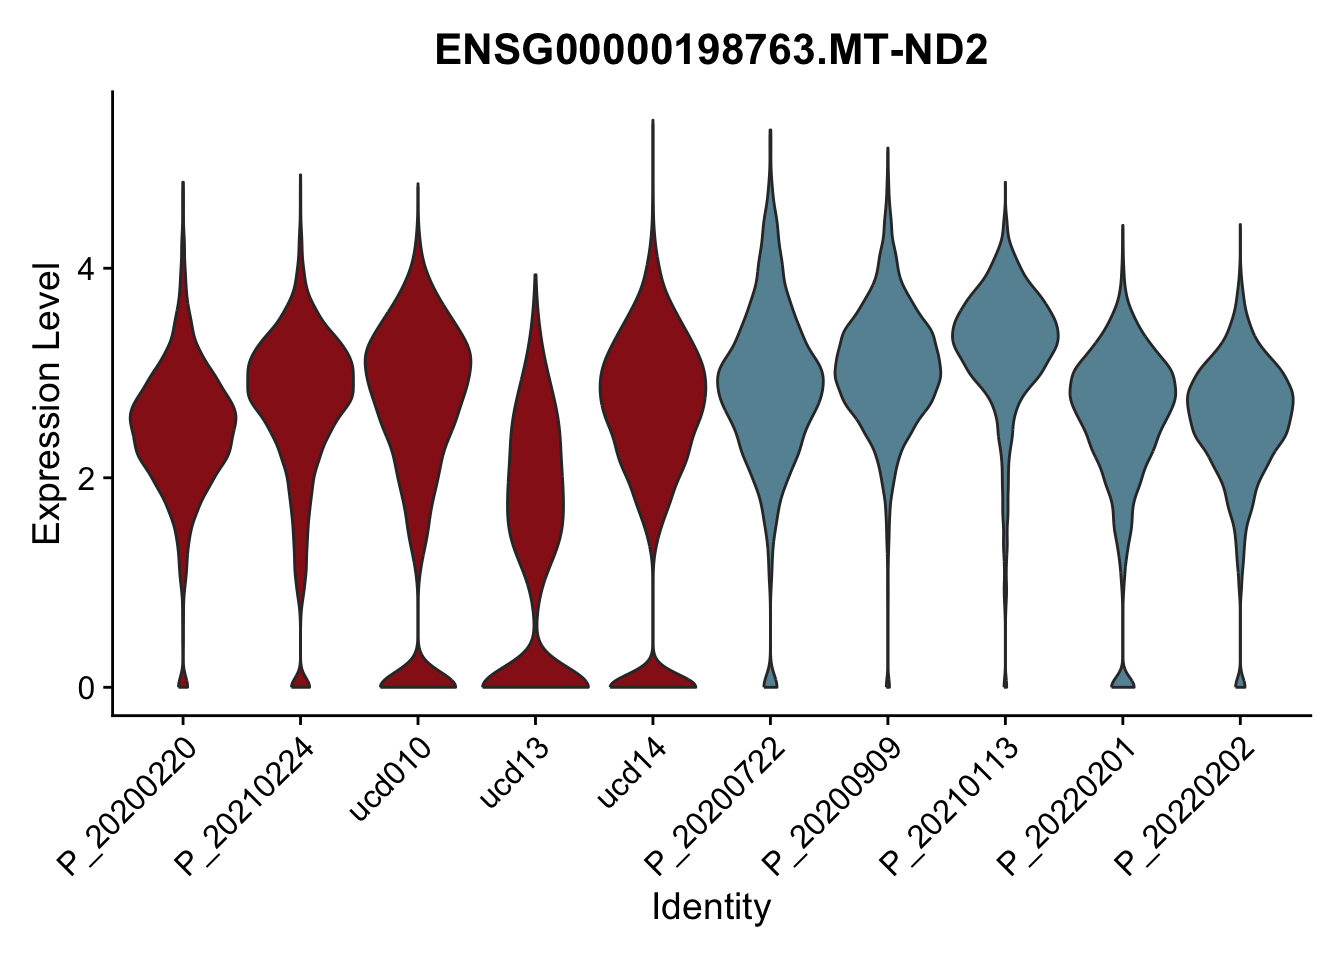
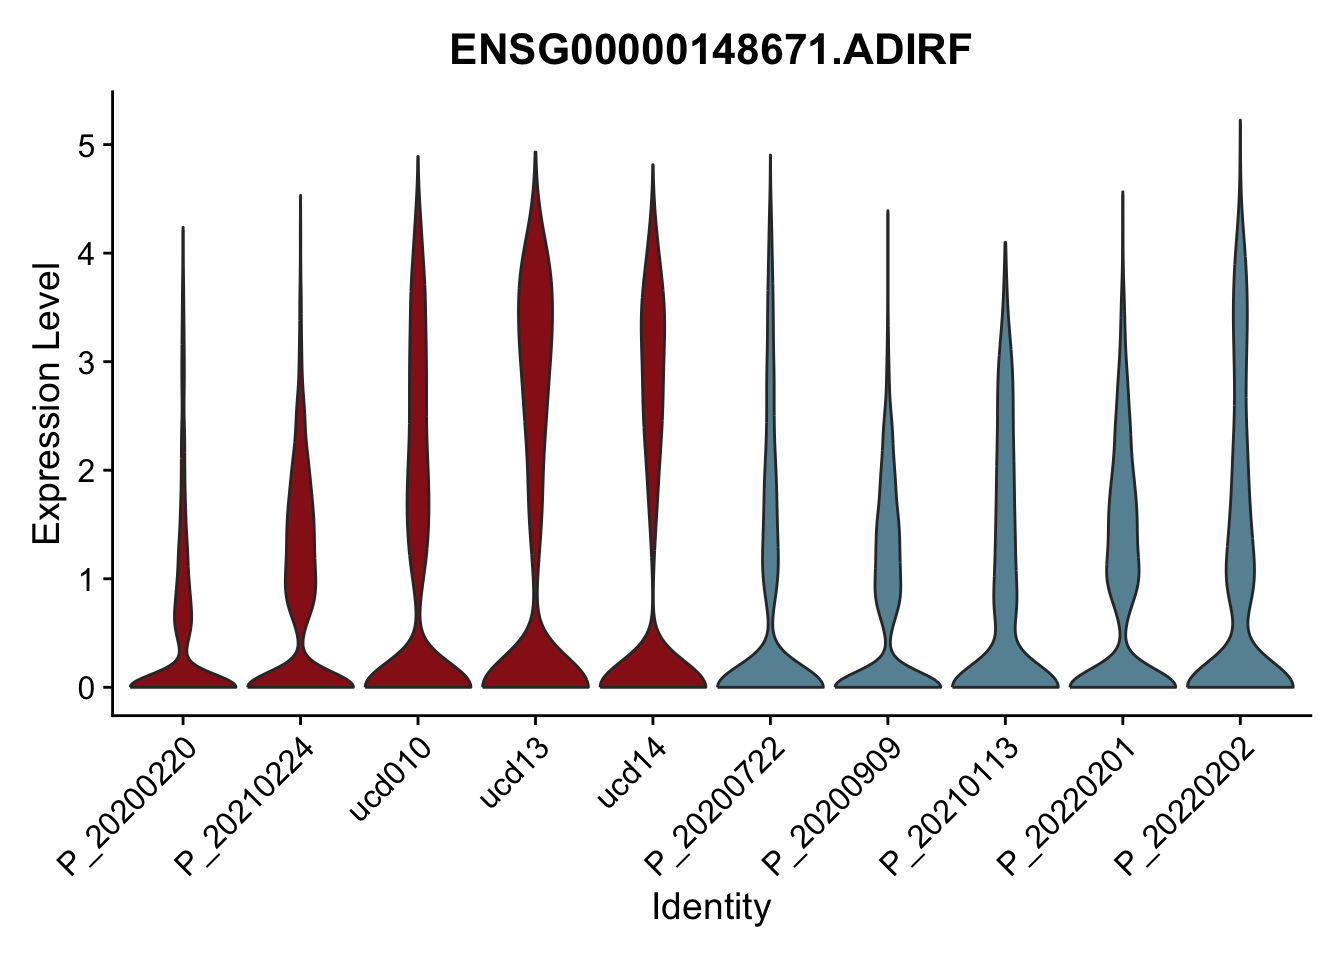
DEsel <- cwDEdat %>% filter(condCl == "resting_5")violinplot across patients
patDat <- data.frame(table(seurat$patient, seurat$cond2)) %>%
  filter(Freq>0) %>%
  mutate(col=ifelse(Var2=="activated",
                    colCond2["activated"],colCond2["resting"]))
colPatCond <- patDat$col
names(colPatCond) <- patDat$Var1
seurat$patient <- factor(seurat$patient, levels = patDat$Var1)

pList <- sapply(DEsel$gene[1:20], function(x){
  p <- VlnPlot(seurat, features = x, pt.size = 0,
               group.by = "patient") +
    scale_fill_manual(values = colPatCond) +
    theme(legend.position = "none")
  plot(p)
})
avg Heatmap
selGenesAll <- DEsel %>%
  slice_max(., order_by=mean.logFC.cohen, n=30)
selGenesAll <- selGenesAll %>% mutate(geneIDval=gsub("^.*\\.", "", gene)) %>% filter(nchar(geneIDval)>1)

seurat$clust_plus_cond <- paste0(seurat$intCluster, "_", seurat$cond2)
seurat$clust_plus_cond <- as.factor(seurat$clust_plus_cond)
Idents(seurat) <- seurat$clust_plus_cond
gapVecCol <- seq(2, length(levels(seurat$clust_plus_cond)), by=2)

pOut <- avgHeatmap(seurat = seurat, selGenes = selGenesAll,
                  colVecIdent = colPal,
                  ordVec=levels(seurat),
                  gapVecR=NULL, gapVecC=gapVecCol,cc=FALSE,
                  cr=T, condCol=T, colVecCond = colCond2)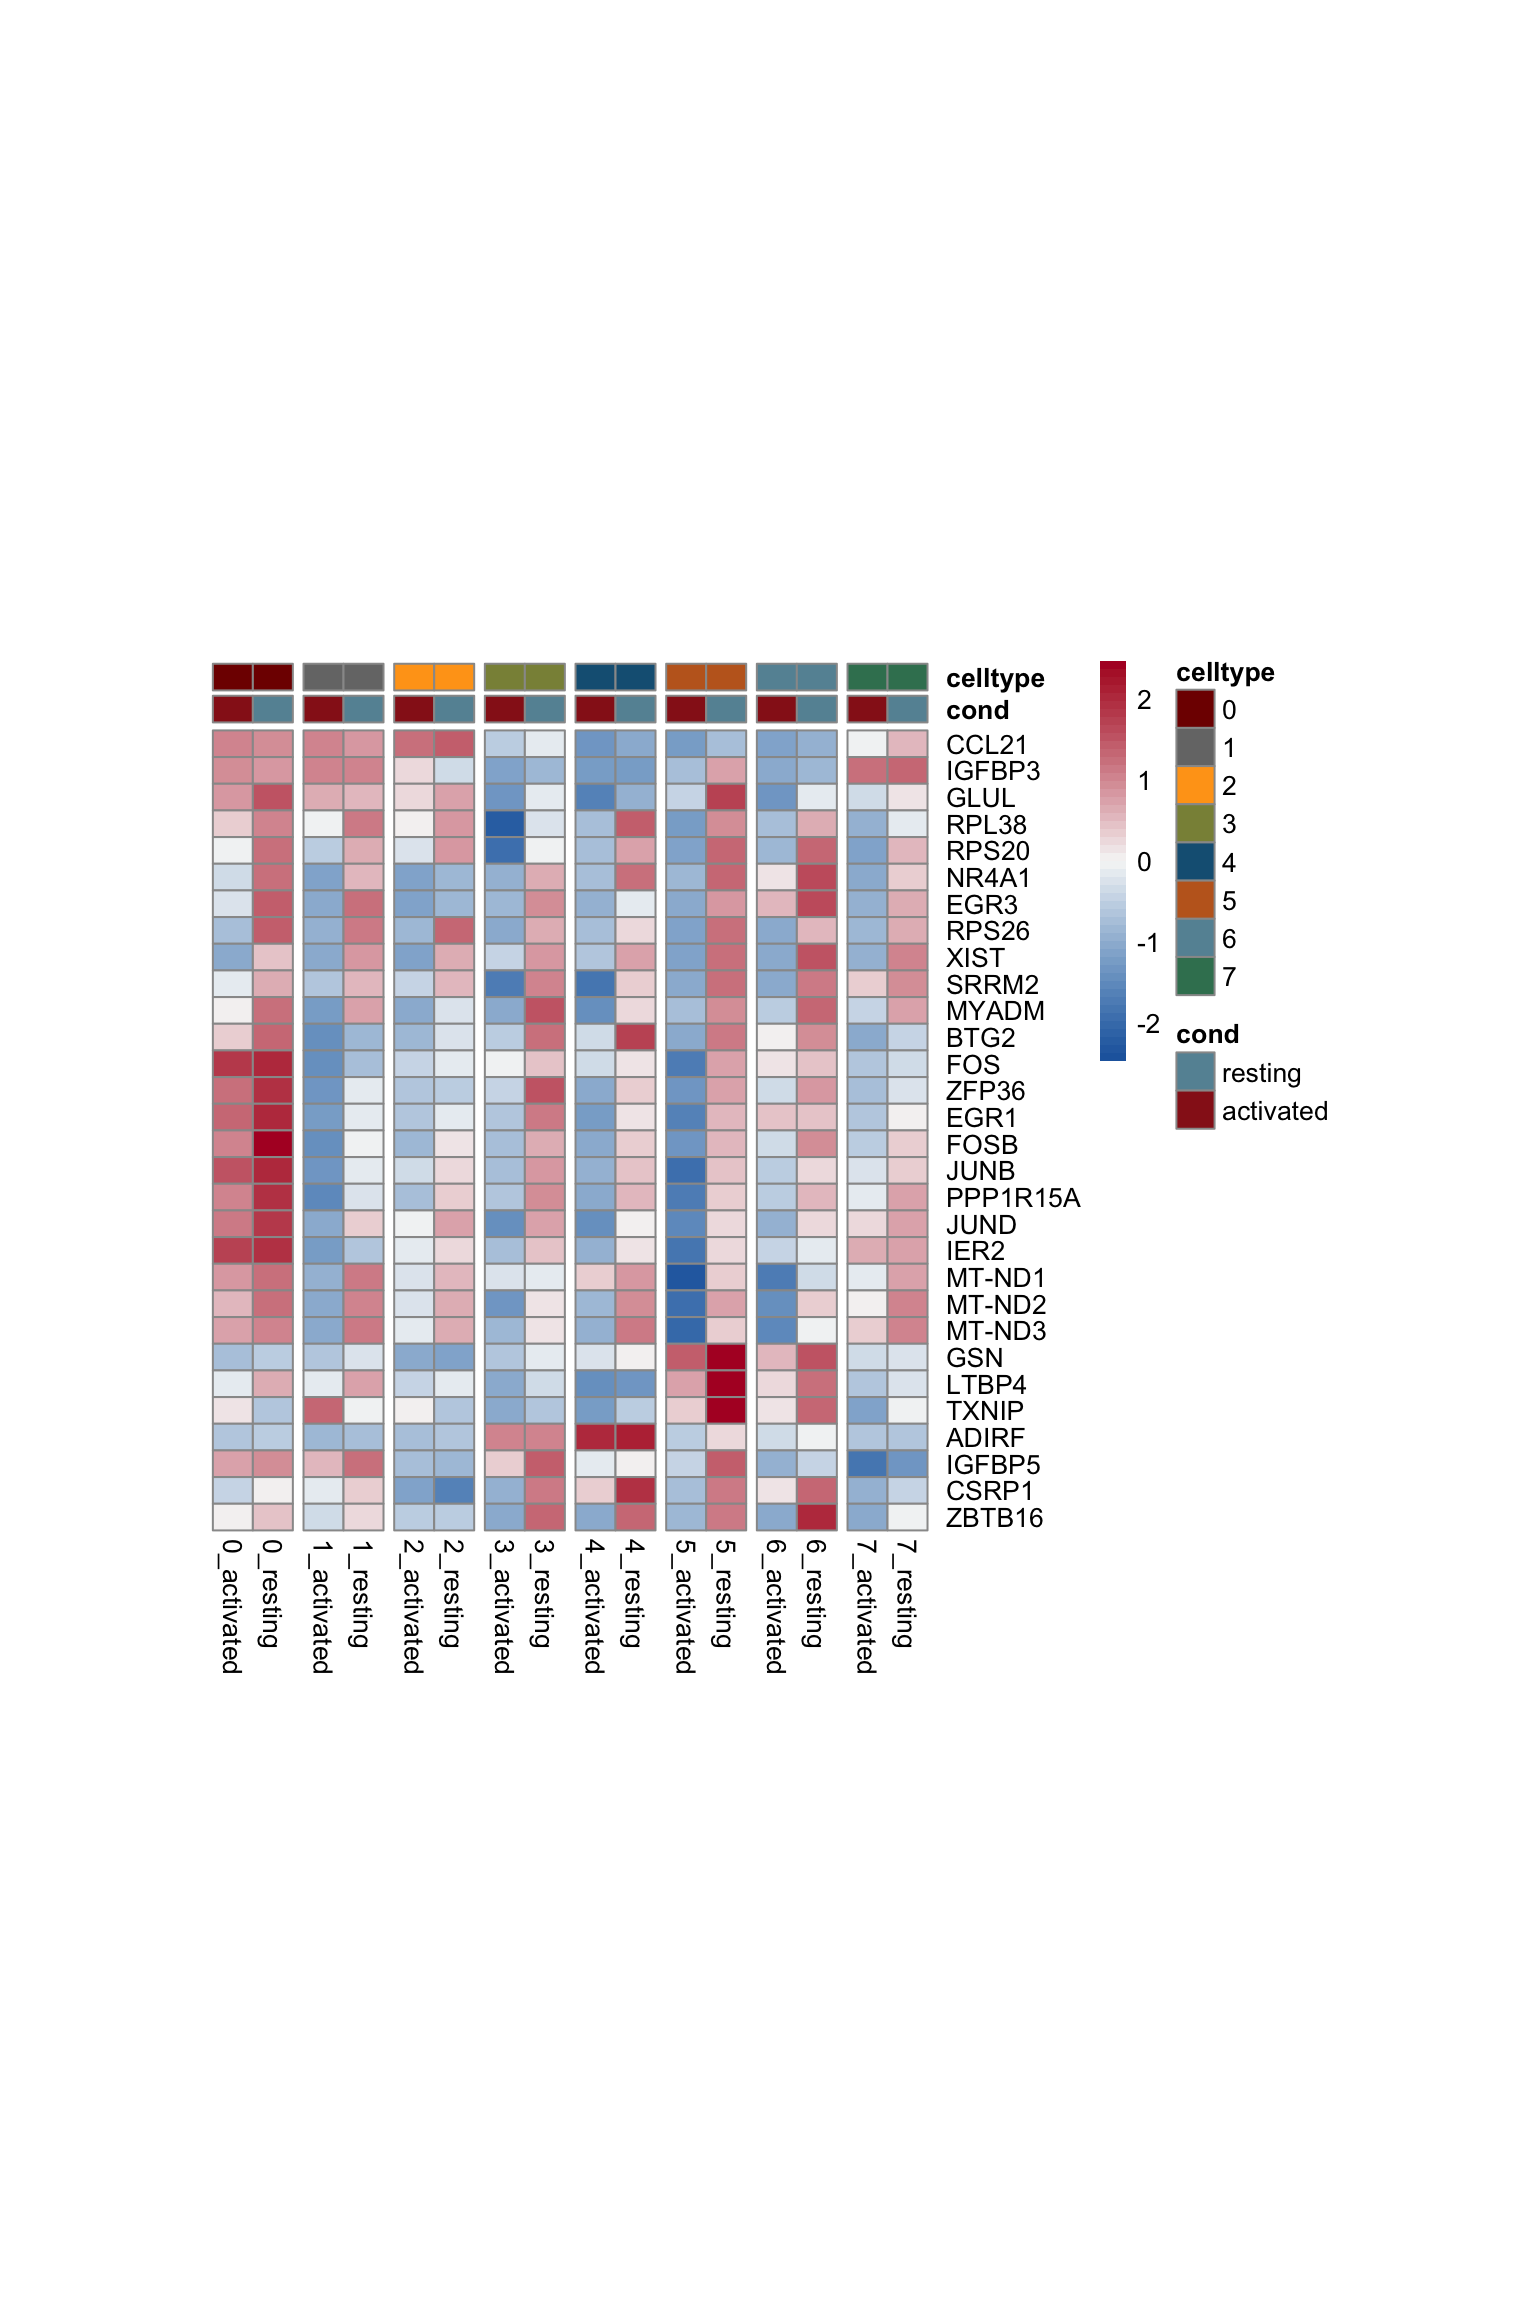
sc Heatmap
DefaultAssay(object = seurat) <- "RNA"
seurat <- ScaleData(seurat, features = rownames(seurat))

colPal2 <- rep(colPal, each=2)
names(colPal2) <- as.vector(t(outer(names(colPal), names(colCond2), paste,
                                    sep="_")))

selFeatures  <- DEsel %>%
  slice_max(., order_by=mean.logFC.cohen, n=30) %>%
  mutate(label=gsub("^.*\\.", "", gene)) %>%
  filter(nchar(label)>1)

DoHeatmap(seurat, features = selFeatures$gene, group.by = "clust_plus_cond",
          group.colors = colPal2, slot = 'scale.data', label = F,
          disp.min = -0.5, disp.max = 1.5) +
  scale_fill_continuous(type = "viridis") +
  scale_y_discrete(breaks=selFeatures$gene, labels=selFeatures$label)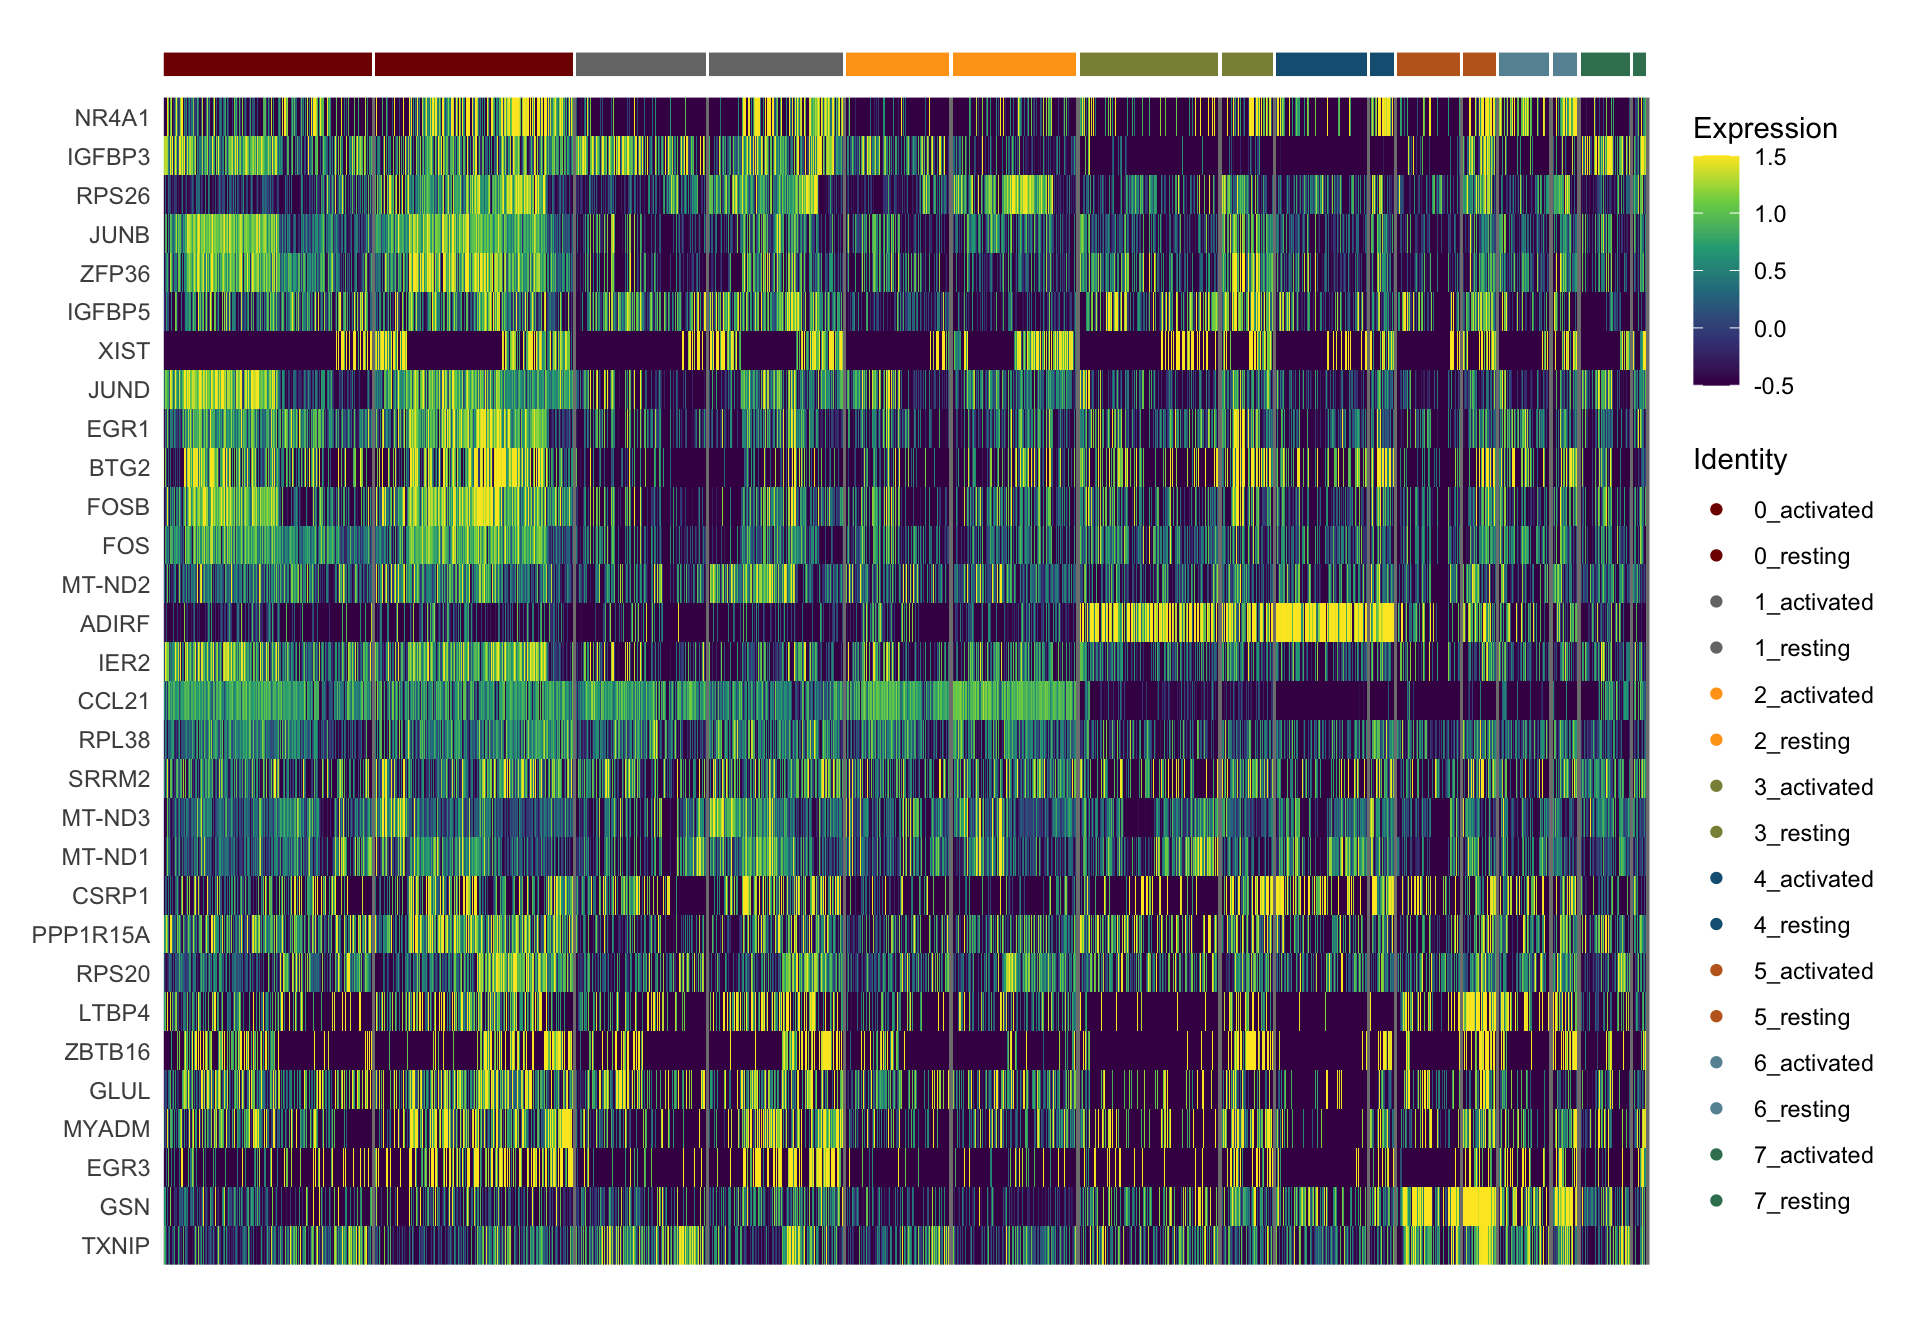
GSEA top genes Pi16+RC resting
orgMarkerDat <- DEsel %>% mutate(EnsID = gsub("\\..*$", "", gene))
egoA <- enrichGO(gene         = unique(orgMarkerDat$EnsID),
                OrgDb         = org.Hs.eg.db,
                keyType       = 'ENSEMBL',
                ont           = "BP",
                pAdjustMethod = "BH",
                pvalueCutoff  = 0.05,
                qvalueCutoff  = 0.05)
egoA <- setReadable(egoA, OrgDb = org.Hs.eg.db)

egoADat <- egoA@result
selGO <- c("GO:0048660", "GO:0006119", "GO:0071774", "GO:0046034",
           "GO:0048009", "GO:0045333")
barplot sel GO
selGODat <- egoADat %>% filter(ID %in% selGO) %>% mutate(cluster="5")
selGODat <- selGODat %>% mutate(qscore=-log(p.adjust, base=10))
p <- ggbarplot(selGODat, x = "Description", y = "qscore",
          fill = "cluster",
          color = "cluster",
          palette = "#6692a3",
          sort.val = "asc",
          sort.by.groups = TRUE
          #x.text.angle = 90
          ) +
  rotate()
p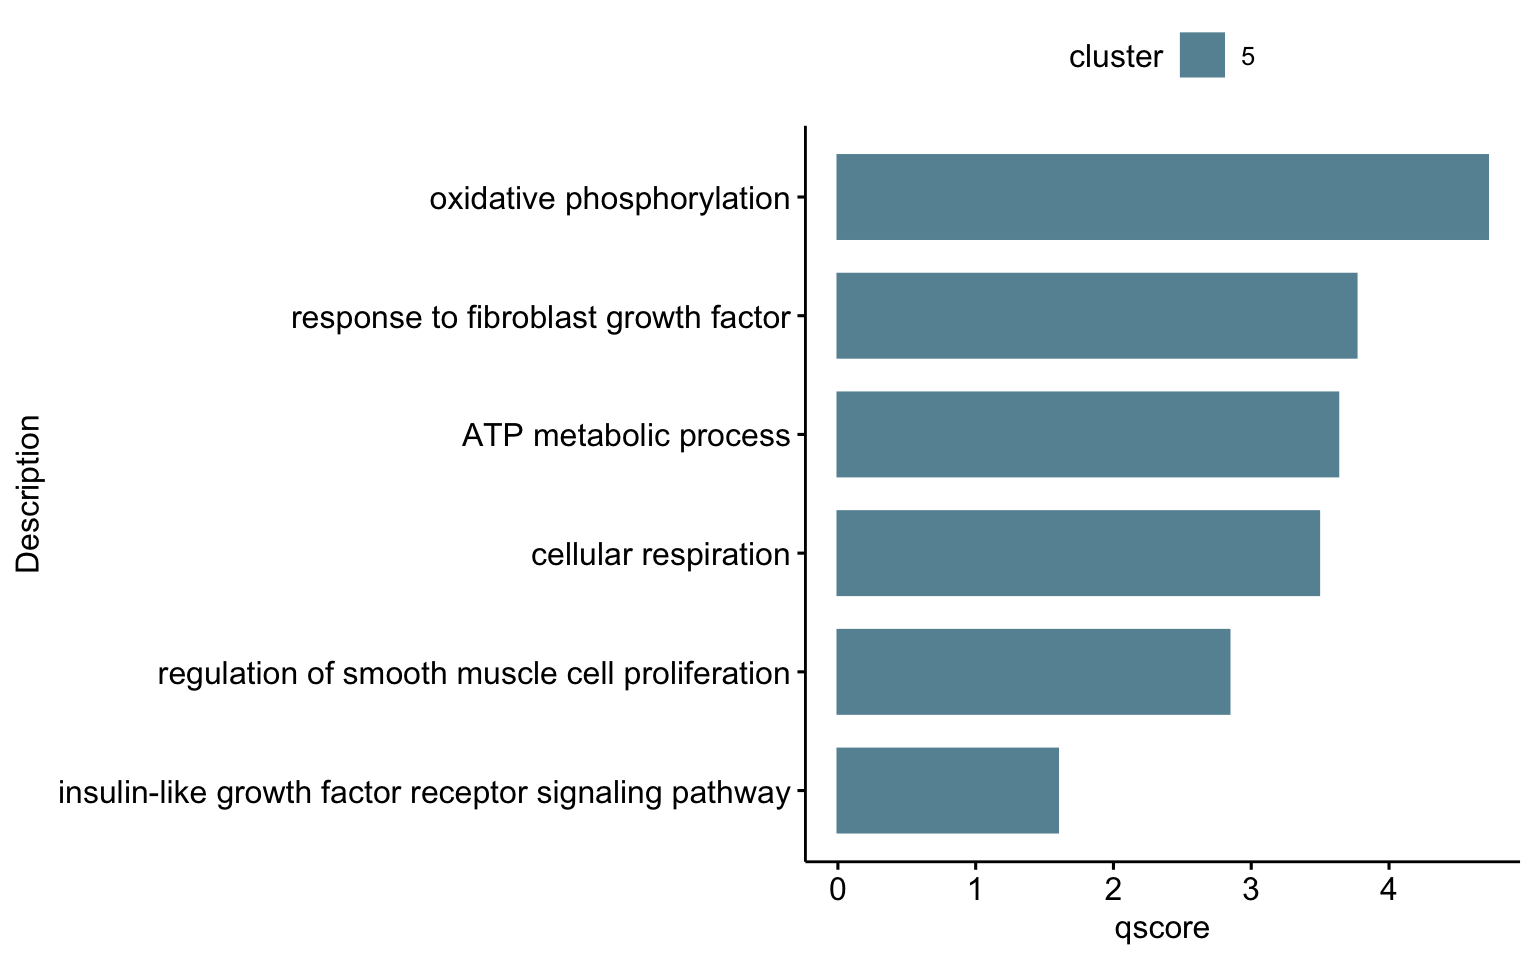
cnetplot sel GO
egoAsub <- egoA
egoAsub@result <- egoAsub@result[which(egoAsub@result$ID %in% selGO),]
p <- cnetplot(egoAsub, node_label="all", showCategory = length(selGO),
              color_category="#6692a3", color_gene="#a3c5d2",
              shadowtext = "none")
p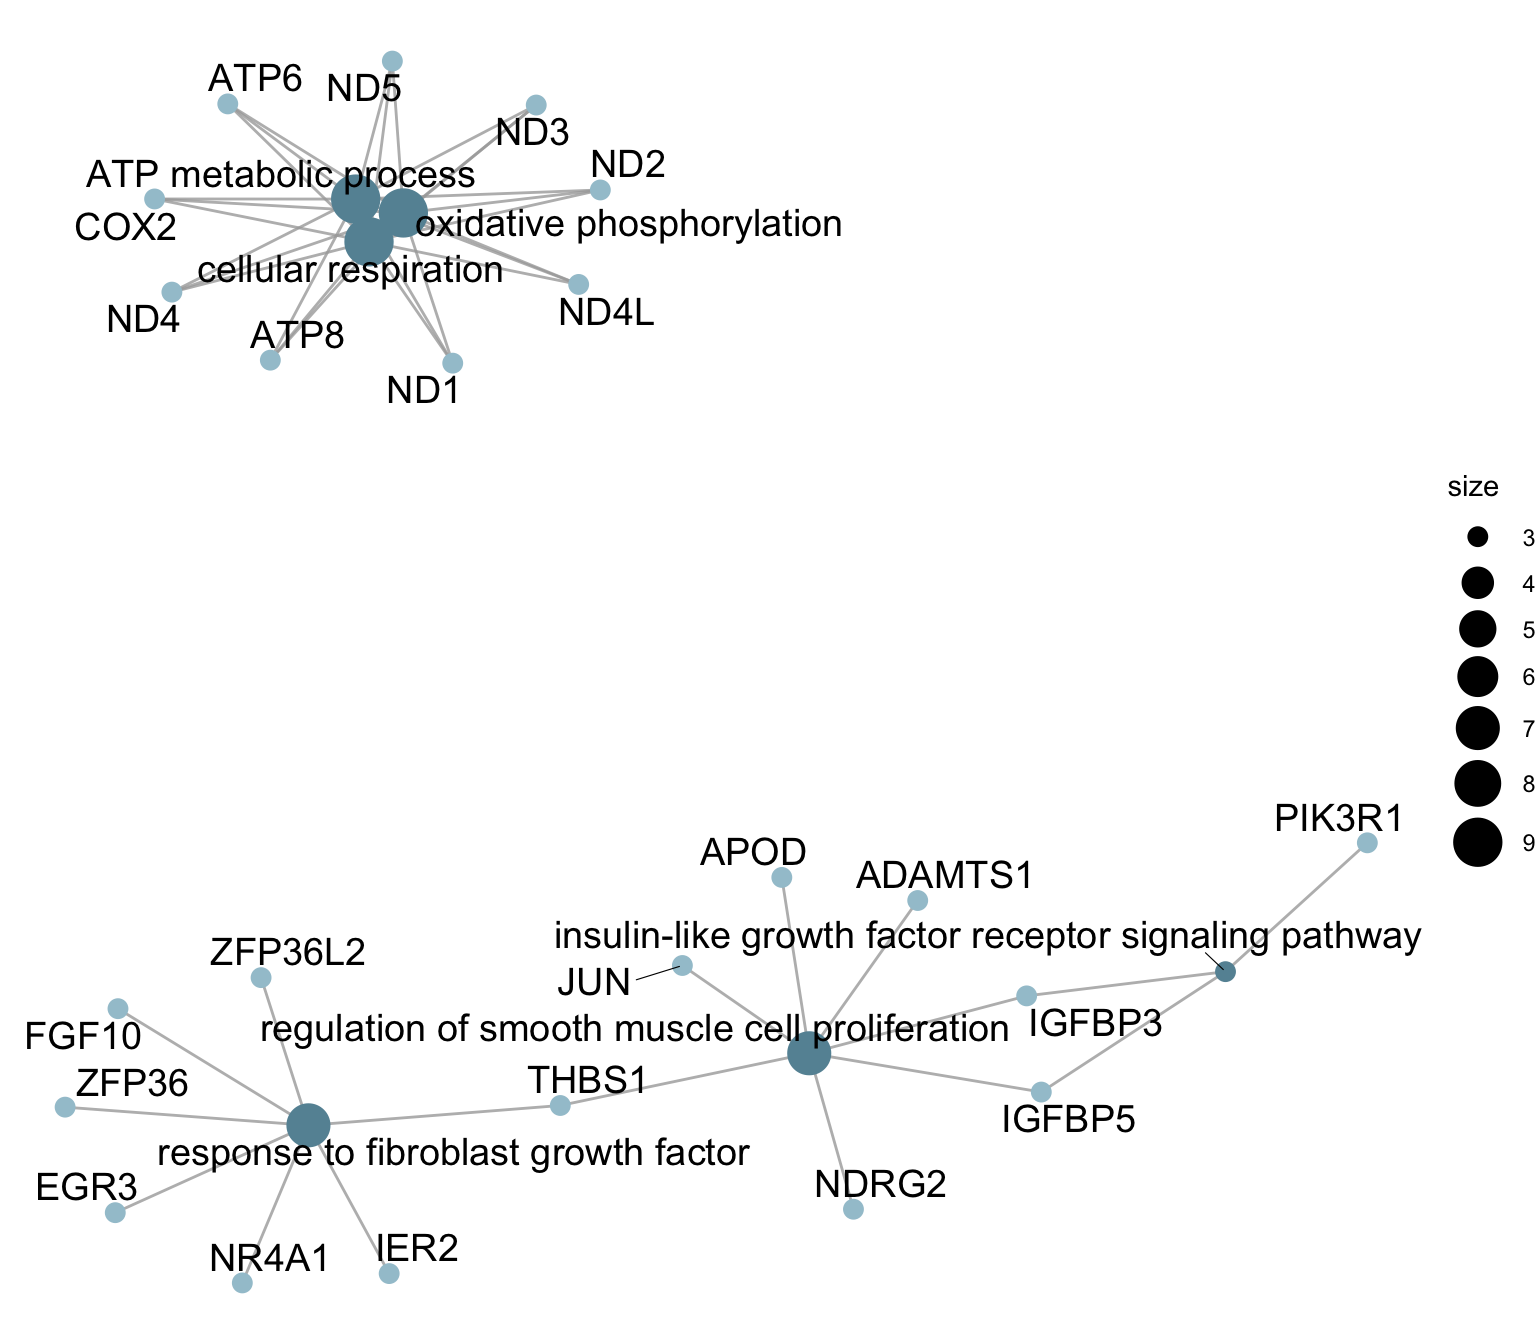
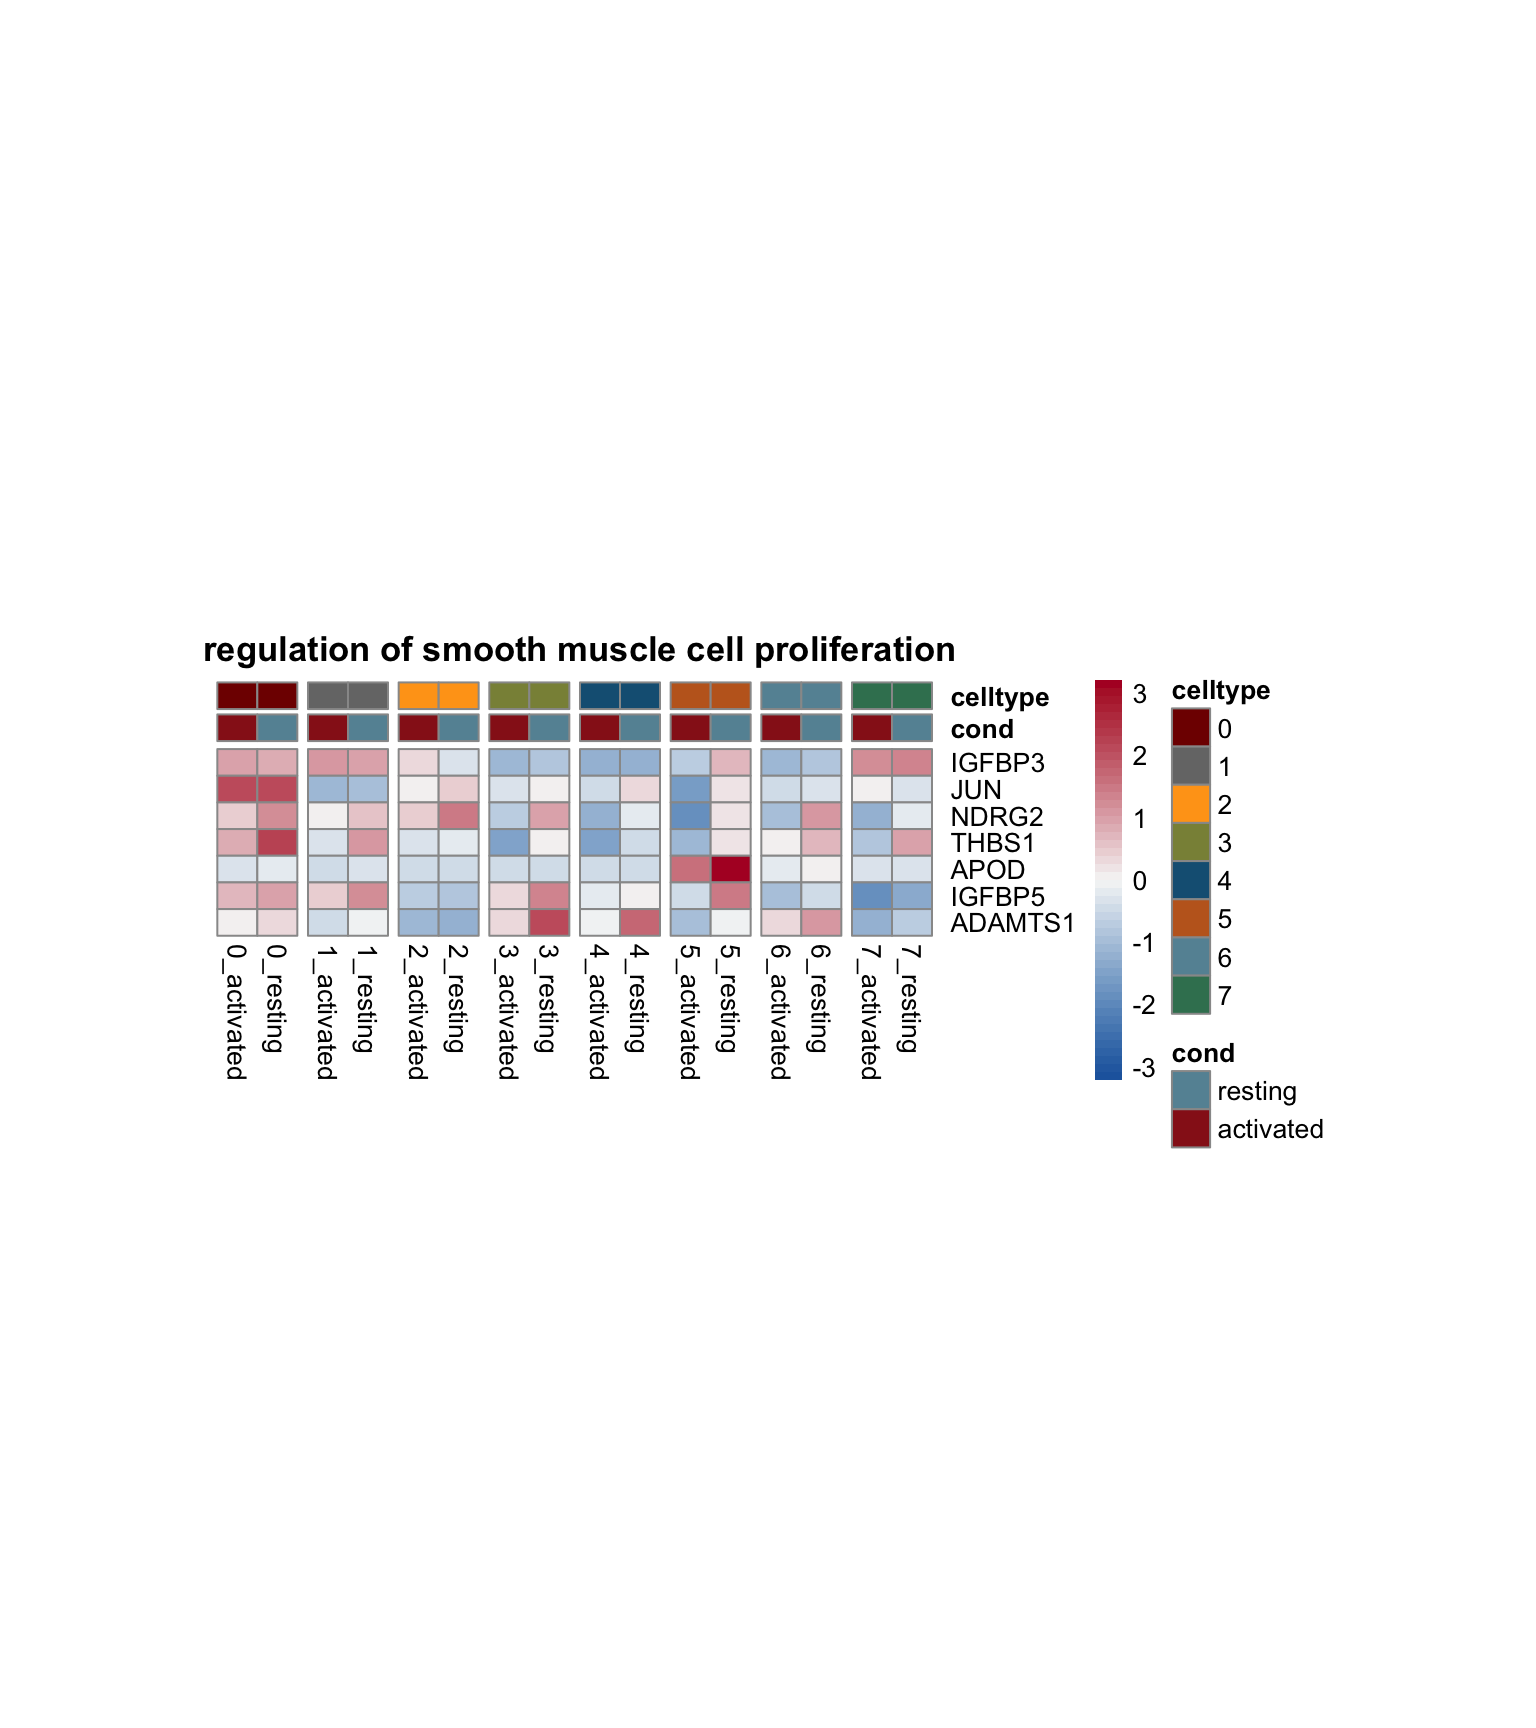
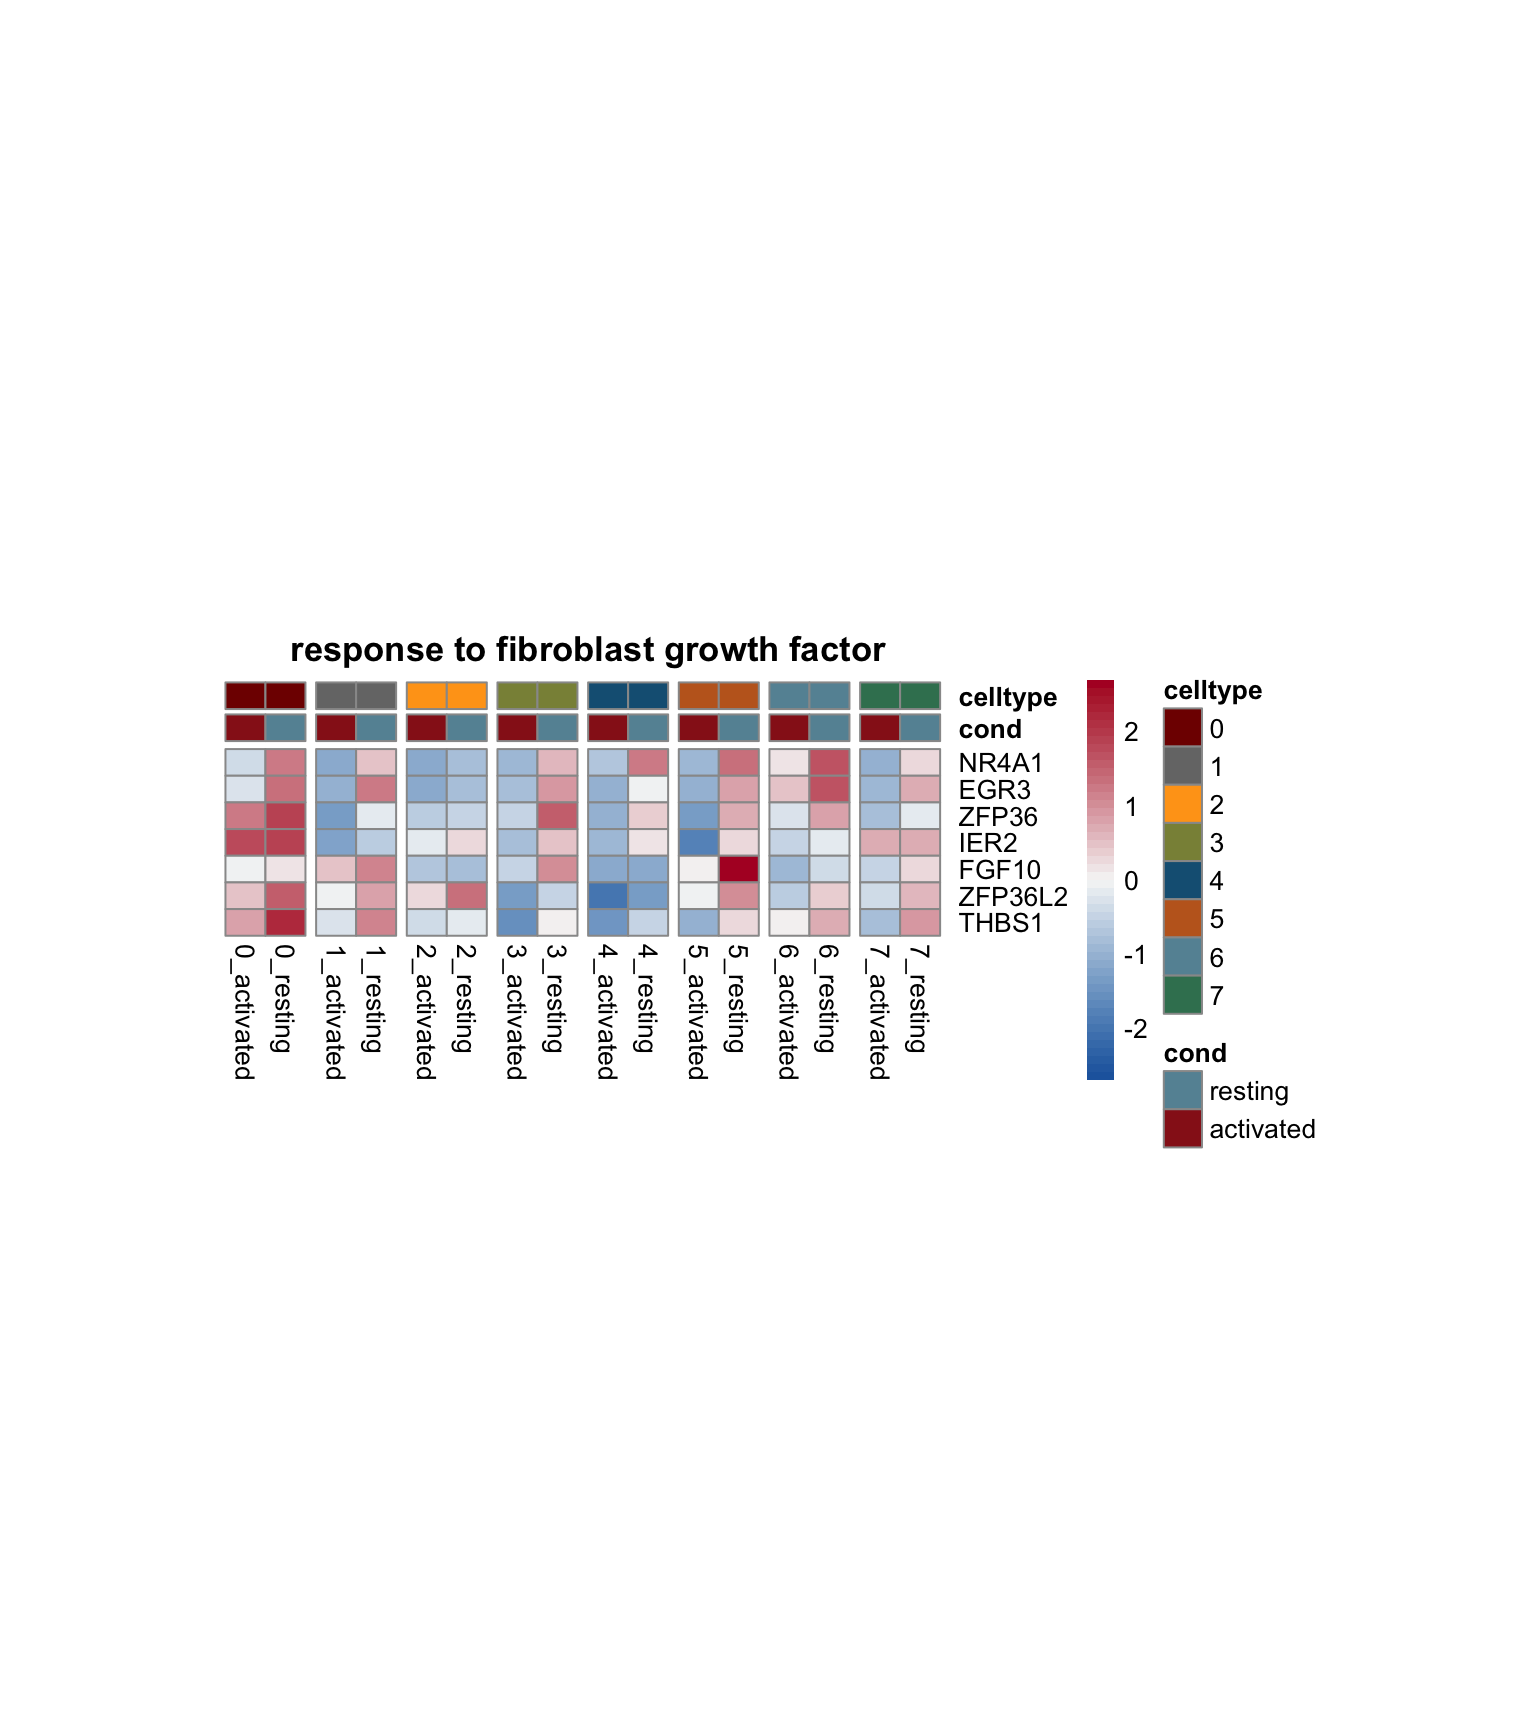
avg heatmap with genes of each sel GO
genes <- data.frame(gene=rownames(seurat)) %>%
  mutate(geneID=gsub(".*\\.", "", gene))
Idents(seurat) <- seurat$clust_plus_cond
gapVecCol <- seq(2, length(levels(seurat$clust_plus_cond)), by=2)

lapply(selGO, function(id){
  geneStr <- egoADat[id,"geneID"]
  geneVec <- data.frame(geneID=unlist(strsplit(geneStr, "/"))) %>%
    left_join(., genes, by="geneID")
  if(length(which(is.na(geneVec$gene))) > 0){
      geneVec$geneID[which(is.na(geneVec$gene))] <- paste0("MT-",
                      geneVec$geneID[which(is.na(geneVec$gene))])
      geneVec <- geneVec %>% dplyr::select(-gene) %>%
        left_join(., genes, by="geneID") %>%
        filter(!is.na(gene))
  }

  pOut <- avgHeatmap(seurat = seurat, selGenes = geneVec,
                  colVecIdent = colPal,
                  ordVec=levels(seurat),
                  gapVecR=NULL, gapVecC=gapVecCol,cc=FALSE,
                  cr=T, condCol=T, colVecCond = colCond2,
                  main = egoADat[id,"Description"])

})

[[1]]

[[2]]

[[3]]

[[4]]

[[5]]

[[6]]
session info
sessionInfo()R version 4.3.0 (2023-04-21)
Platform: x86_64-apple-darwin20 (64-bit)
Running under: macOS Ventura 13.4.1
Matrix products: default
BLAS: /Library/Frameworks/R.framework/Versions/4.3-x86_64/Resources/lib/libRblas.0.dylib
LAPACK: /Library/Frameworks/R.framework/Versions/4.3-x86_64/Resources/lib/libRlapack.dylib; LAPACK version 3.11.0
locale:
[1] en_US.UTF-8/en_US.UTF-8/en_US.UTF-8/C/en_US.UTF-8/en_US.UTF-8
time zone: Europe/Berlin
tzcode source: internal
attached base packages:
[1] stats4 stats graphics grDevices utils datasets methods base
other attached packages:
[1] Matrix_1.6-5 enrichplot_1.20.3 DOSE_3.26.2
[4] org.Hs.eg.db_3.17.0 AnnotationDbi_1.62.2 clusterProfiler_4.8.3
[7] scran_1.28.2 scater_1.28.0 scuttle_1.10.3
[10] SingleCellExperiment_1.22.0 SummarizedExperiment_1.30.2 Biobase_2.60.0
[13] GenomicRanges_1.52.1 GenomeInfoDb_1.36.4 IRanges_2.36.0
[16] S4Vectors_0.40.1 BiocGenerics_0.48.0 MatrixGenerics_1.12.3
[19] matrixStats_1.2.0 pheatmap_1.0.12 ggsci_3.0.1
[22] here_1.0.1 runSeurat3_0.1.0 ggpubr_0.6.0
[25] lubridate_1.9.3 forcats_1.0.0 stringr_1.5.1
[28] readr_2.1.5 tidyr_1.3.1 tibble_3.2.1
[31] tidyverse_2.0.0 Seurat_5.0.2 SeuratObject_5.0.1
[34] sp_2.1-3 purrr_1.0.2 ggplot2_3.5.0
[37] reshape2_1.4.4 dplyr_1.1.4
loaded via a namespace (and not attached):
[1] fs_1.6.3 spatstat.sparse_3.0-3 bitops_1.0-7
[4] HDO.db_0.99.1 httr_1.4.7 RColorBrewer_1.1-3
[7] tools_4.3.0 sctransform_0.4.1 backports_1.4.1
[10] utf8_1.2.4 R6_2.5.1 lazyeval_0.2.2
[13] uwot_0.1.16 withr_3.0.0 gridExtra_2.3
[16] progressr_0.14.0 cli_3.6.2 spatstat.explore_3.2-6
[19] fastDummies_1.7.3 scatterpie_0.2.1 labeling_0.4.3
[22] spatstat.data_3.0-4 ggridges_0.5.6 pbapply_1.7-2
[25] yulab.utils_0.1.4 gson_0.1.0 parallelly_1.37.1
[28] limma_3.56.2 rstudioapi_0.15.0 RSQLite_2.3.5
[31] gridGraphics_0.5-1 generics_0.1.3 ica_1.0-3
[34] spatstat.random_3.2-3 car_3.1-2 GO.db_3.17.0
[37] ggbeeswarm_0.7.2 fansi_1.0.6 abind_1.4-5
[40] lifecycle_1.0.4 yaml_2.3.8 edgeR_3.42.4
[43] carData_3.0-5 qvalue_2.32.0 Rtsne_0.17
[46] grid_4.3.0 blob_1.2.4 promises_1.2.1
[49] dqrng_0.3.2 crayon_1.5.2 miniUI_0.1.1.1
[52] lattice_0.22-5 beachmat_2.16.0 cowplot_1.1.3
[55] KEGGREST_1.40.1 pillar_1.9.0 knitr_1.45
[58] metapod_1.8.0 fgsea_1.26.0 future.apply_1.11.1
[61] codetools_0.2-19 fastmatch_1.1-4 leiden_0.4.3.1
[64] glue_1.7.0 ggfun_0.1.4 downloader_0.4
[67] data.table_1.15.2 treeio_1.24.3 vctrs_0.6.5
[70] png_0.1-8 spam_2.10-0 gtable_0.3.4
[73] cachem_1.0.8 xfun_0.42 S4Arrays_1.0.6
[76] mime_0.12 tidygraph_1.3.1 survival_3.5-8
[79] statmod_1.5.0 bluster_1.10.0 ellipsis_0.3.2
[82] fitdistrplus_1.1-11 ROCR_1.0-11 nlme_3.1-164
[85] ggtree_3.8.2 bit64_4.0.5 RcppAnnoy_0.0.22
[88] rprojroot_2.0.4 irlba_2.3.5.1 vipor_0.4.7
[91] KernSmooth_2.23-22 colorspace_2.1-0 DBI_1.2.2
[94] ggrastr_1.0.2 tidyselect_1.2.0 bit_4.0.5
[97] compiler_4.3.0 BiocNeighbors_1.18.0 DelayedArray_0.26.7
[100] plotly_4.10.4 shadowtext_0.1.3 scales_1.3.0
[103] lmtest_0.9-40 digest_0.6.34 goftest_1.2-3
[106] spatstat.utils_3.0-4 rmarkdown_2.26 XVector_0.40.0
[109] htmltools_0.5.7 pkgconfig_2.0.3 sparseMatrixStats_1.12.2
[112] fastmap_1.1.1 rlang_1.1.3 htmlwidgets_1.6.4
[115] shiny_1.8.0 DelayedMatrixStats_1.22.6 farver_2.1.1
[118] zoo_1.8-12 jsonlite_1.8.8 BiocParallel_1.34.2
[121] GOSemSim_2.26.1 BiocSingular_1.16.0 RCurl_1.98-1.14
[124] magrittr_2.0.3 ggplotify_0.1.2 GenomeInfoDbData_1.2.10
[127] dotCall64_1.1-1 patchwork_1.2.0 munsell_0.5.0
[130] Rcpp_1.0.12 ape_5.7-1 viridis_0.6.5
[133] reticulate_1.35.0 stringi_1.8.3 ggraph_2.2.0
[136] zlibbioc_1.46.0 MASS_7.3-60.0.1 plyr_1.8.9
[139] parallel_4.3.0 listenv_0.9.1 ggrepel_0.9.5
[142] deldir_2.0-4 graphlayouts_1.1.0 Biostrings_2.68.1
[145] splines_4.3.0 tensor_1.5 hms_1.1.3
[148] locfit_1.5-9.9 igraph_2.0.2 spatstat.geom_3.2-9
[151] ggsignif_0.6.4 RcppHNSW_0.6.0 ScaledMatrix_1.8.1
[154] evaluate_0.23 tweenr_2.0.3 tzdb_0.4.0
[157] httpuv_1.6.14 RANN_2.6.1 polyclip_1.10-6
[160] future_1.33.1 scattermore_1.2 ggforce_0.4.2
[163] rsvd_1.0.5 broom_1.0.5 xtable_1.8-4
[166] tidytree_0.4.6 RSpectra_0.16-1 rstatix_0.7.2
[169] later_1.3.2 viridisLite_0.4.2 aplot_0.2.2
[172] memoise_2.0.1 beeswarm_0.4.0 cluster_2.1.6
[175] timechange_0.3.0 globals_0.16.2 date()[1] "Wed Mar 13 19:01:37 2024"