Subset BECs human lymph nodes
Load packages
## load packages
suppressPackageStartupMessages({
  library(dplyr)
  library(reshape2)
  library(ggplot2)
  library(cowplot)
  library(purrr)
  library(Seurat)
  library(tidyverse)
  library(ggpubr)
  library(runSeurat3)
  library(here)
  library(ggsci)
  library(pheatmap)
  library(scater)
})
load seurat object
basedir <- here()

## load seurat object from previous analysis
seurat <- readRDS(file=paste0(basedir, "/data/AllPatWithoutCM_LNFSCMerged_seurat.rds"))

colPal <- c(pal_nejm()(7),pal_futurama()(12))[1:length(levels(seurat))]
names(colPal) <- levels(seurat)

## all activated in one grp
seurat$cond2 <- seurat$cond
seurat$cond2[which(seurat$cond %in% c("chronic", "acute"))] <- "activated"

colCond2 <- c("#6692a3","#971c1c")
names(colCond2) <- c("resting", "activated")
visualize data
clustering
## visualize input data
DimPlot(seurat, reduction = "umap", cols=colPal)+
  theme_bw() +
  theme(axis.text = element_blank(), axis.ticks = element_blank(),
        panel.grid.minor = element_blank()) +
  xlab("UMAP1") +
  ylab("UMAP2")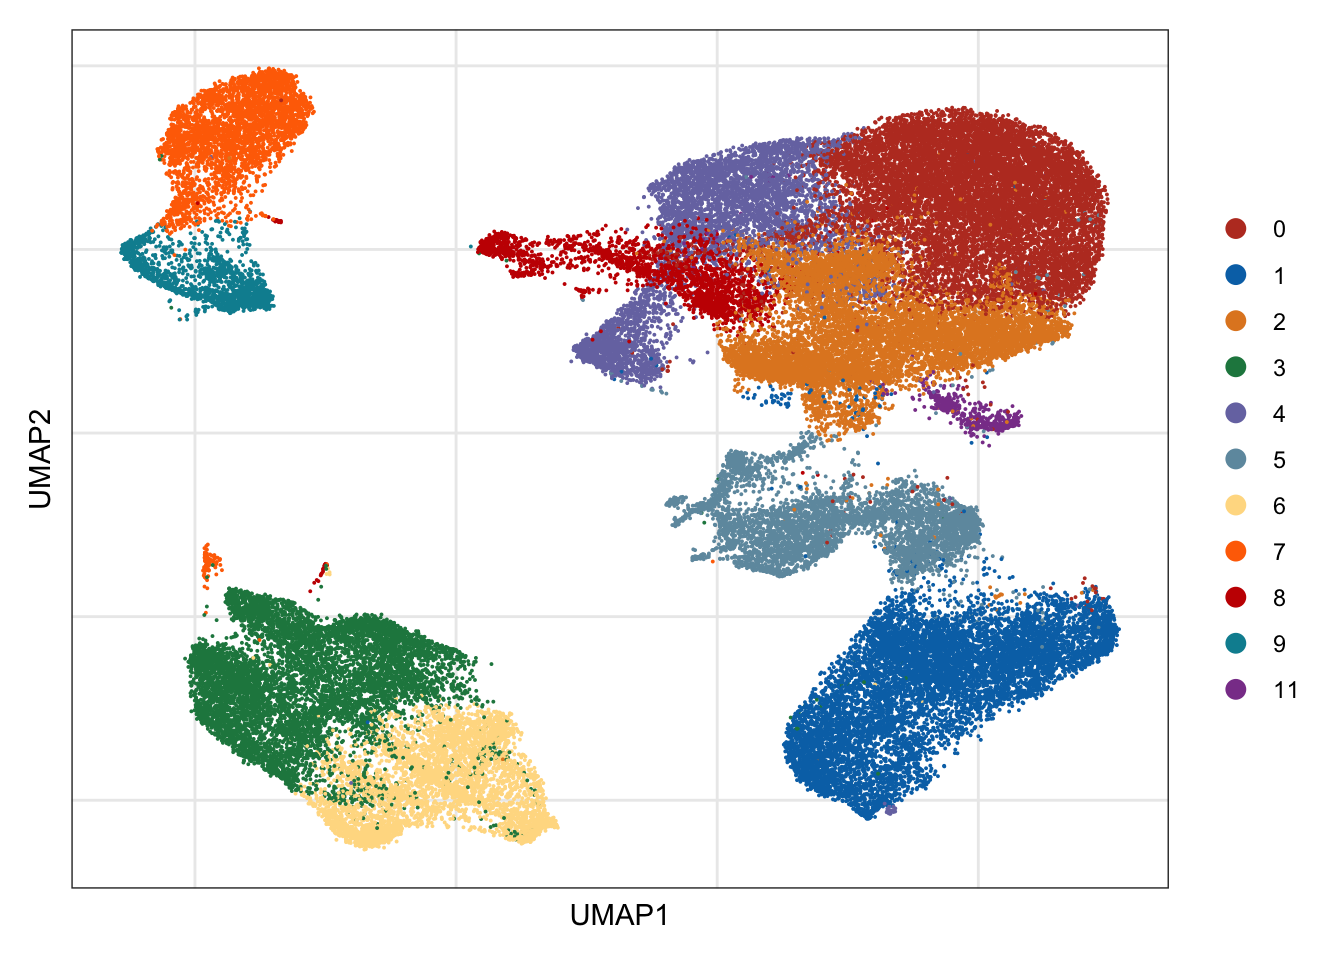
patient
colPat <- c(pal_jco()(10),pal_futurama()(12))[1:length(unique(seurat$patient))]
names(colPat) <- unique(seurat$patient)

## visualize input data
DimPlot(seurat, reduction = "umap", cols=colPat, group.by = "patient")+
  theme_bw() +
  theme(axis.text = element_blank(), axis.ticks = element_blank(),
        panel.grid.minor = element_blank()) +
  xlab("UMAP1") +
  ylab("UMAP2")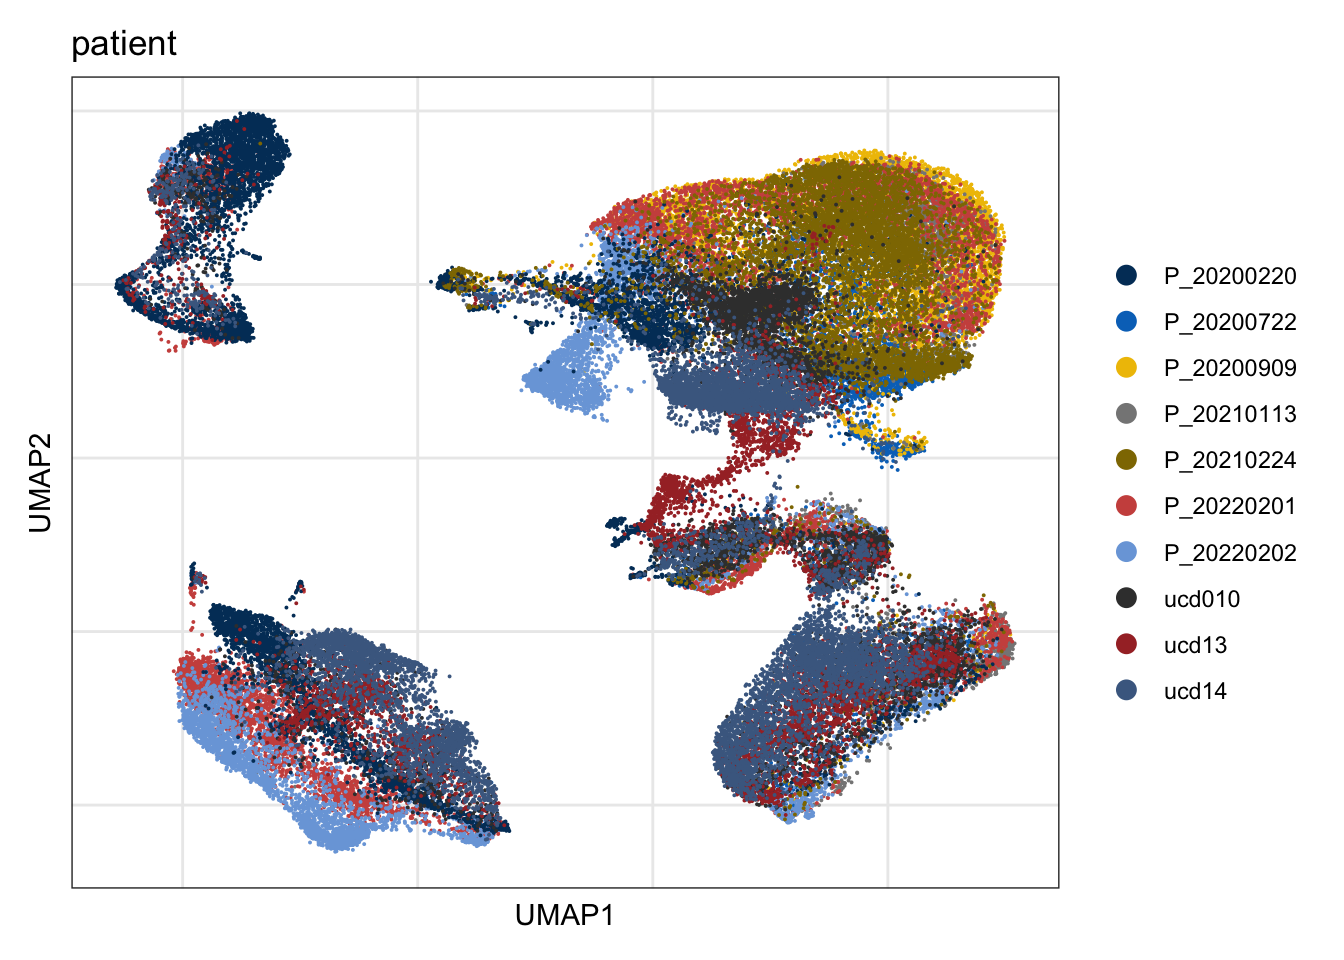
cond2
## visualize input data
DimPlot(seurat, reduction = "umap", cols=colCond2, group.by = "cond2")+
  theme_bw() +
  theme(axis.text = element_blank(), axis.ticks = element_blank(),
        panel.grid.minor = element_blank()) +
  xlab("UMAP1") +
  ylab("UMAP2")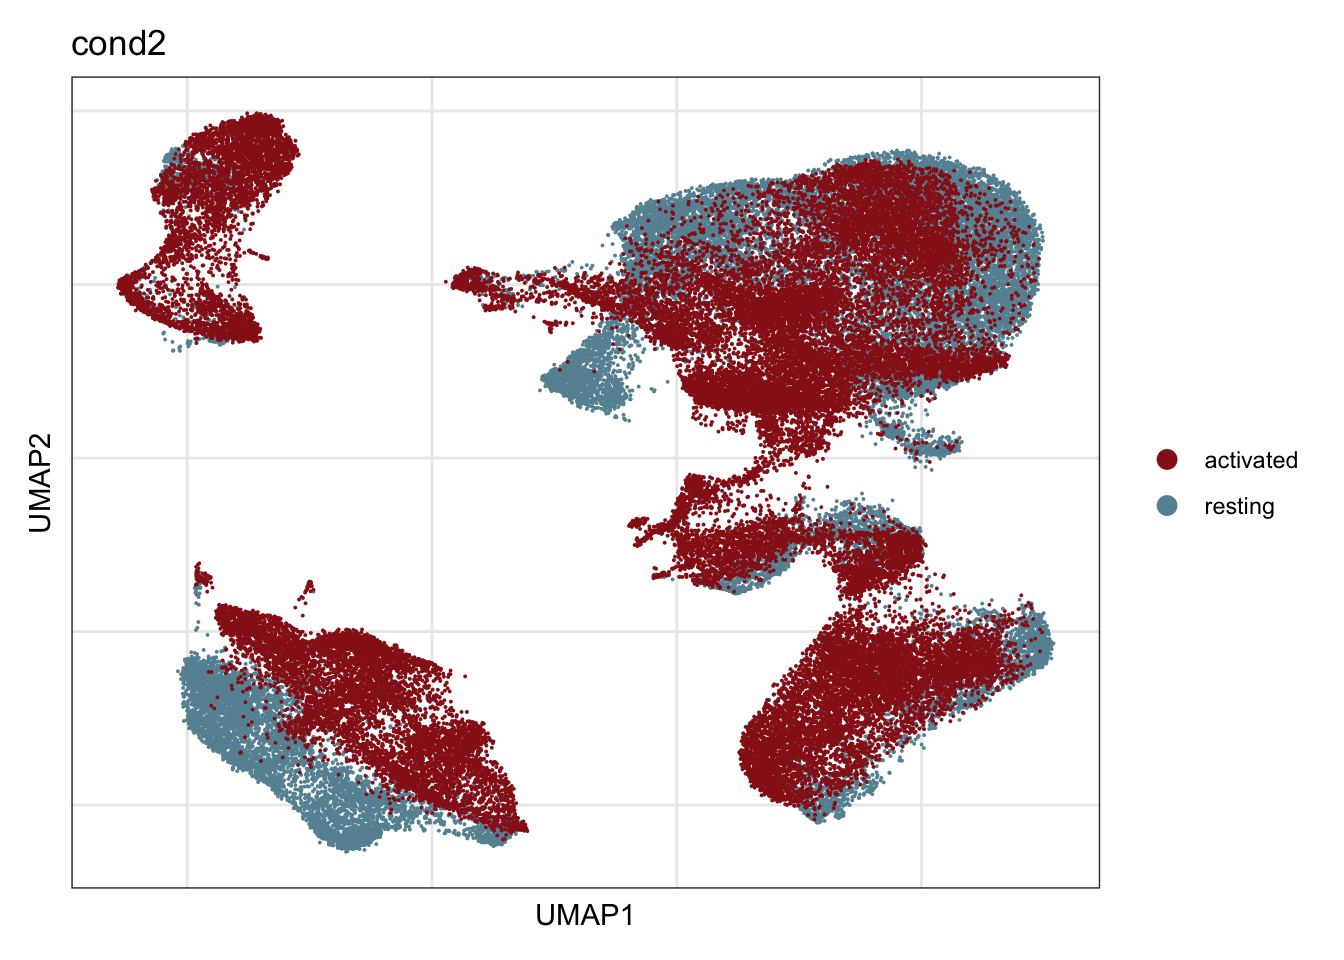
grp
colGrp <- pal_uchicago()(length(unique(seurat$grp)))
names(colGrp) <- unique(seurat$grp)

## visualize input data
DimPlot(seurat, reduction = "umap", cols=colGrp, group.by = "grp")+
  theme_bw() +
  theme(axis.text = element_blank(), axis.ticks = element_blank(),
        panel.grid.minor = element_blank()) +
  xlab("UMAP1") +
  ylab("UMAP2")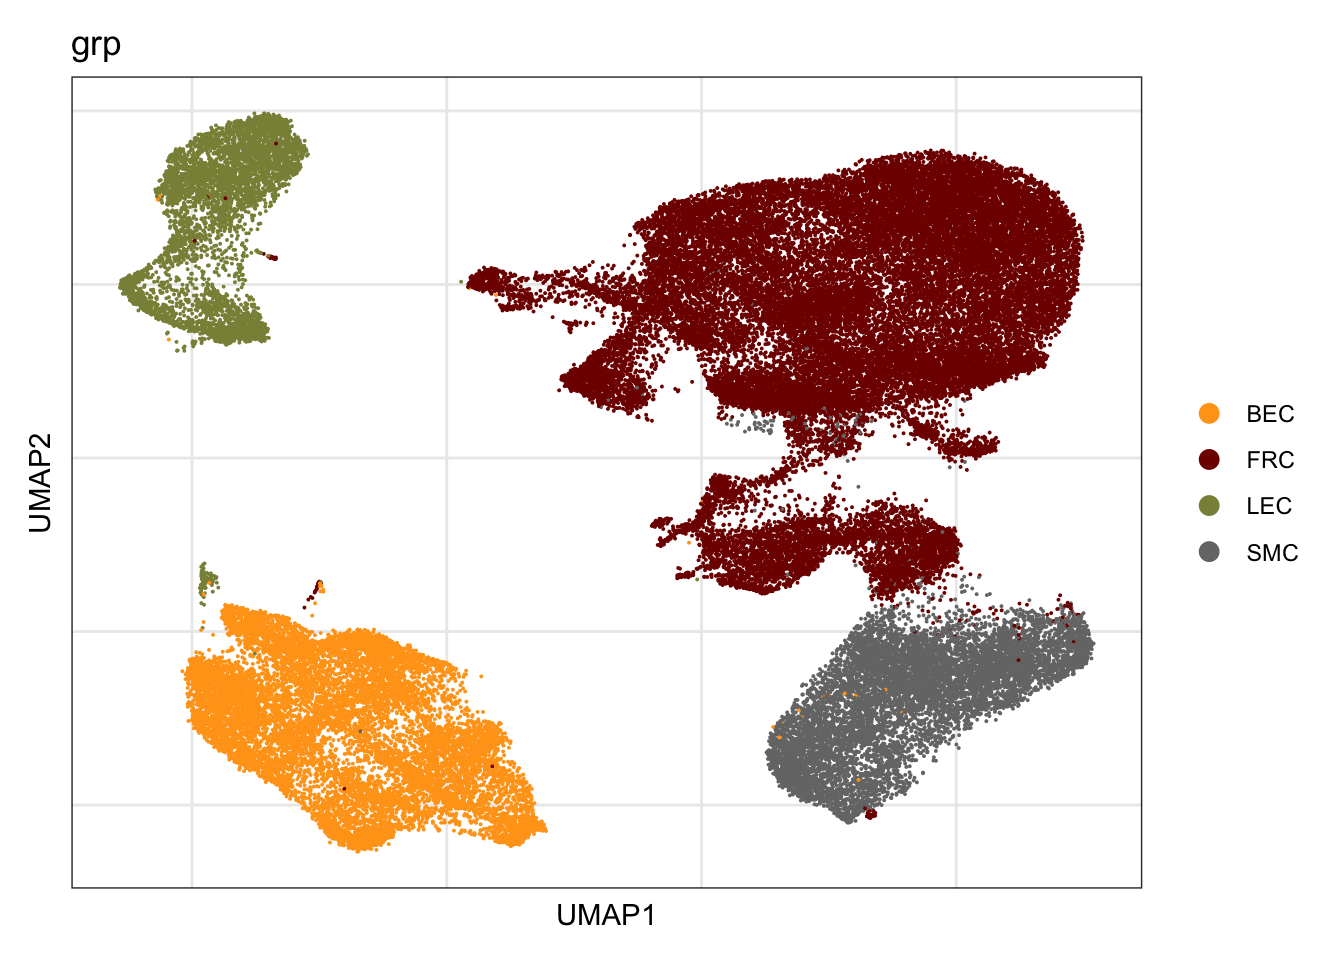
origin
colOri <- pal_npg()(length(unique(seurat$origin)))
names(colOri) <- unique(seurat$origin)

## visualize input data
DimPlot(seurat, reduction = "umap", cols=colOri, group.by = "origin")+
  theme_bw() +
  theme(axis.text = element_blank(), axis.ticks = element_blank(),
        panel.grid.minor = element_blank()) +
  xlab("UMAP1") +
  ylab("UMAP2")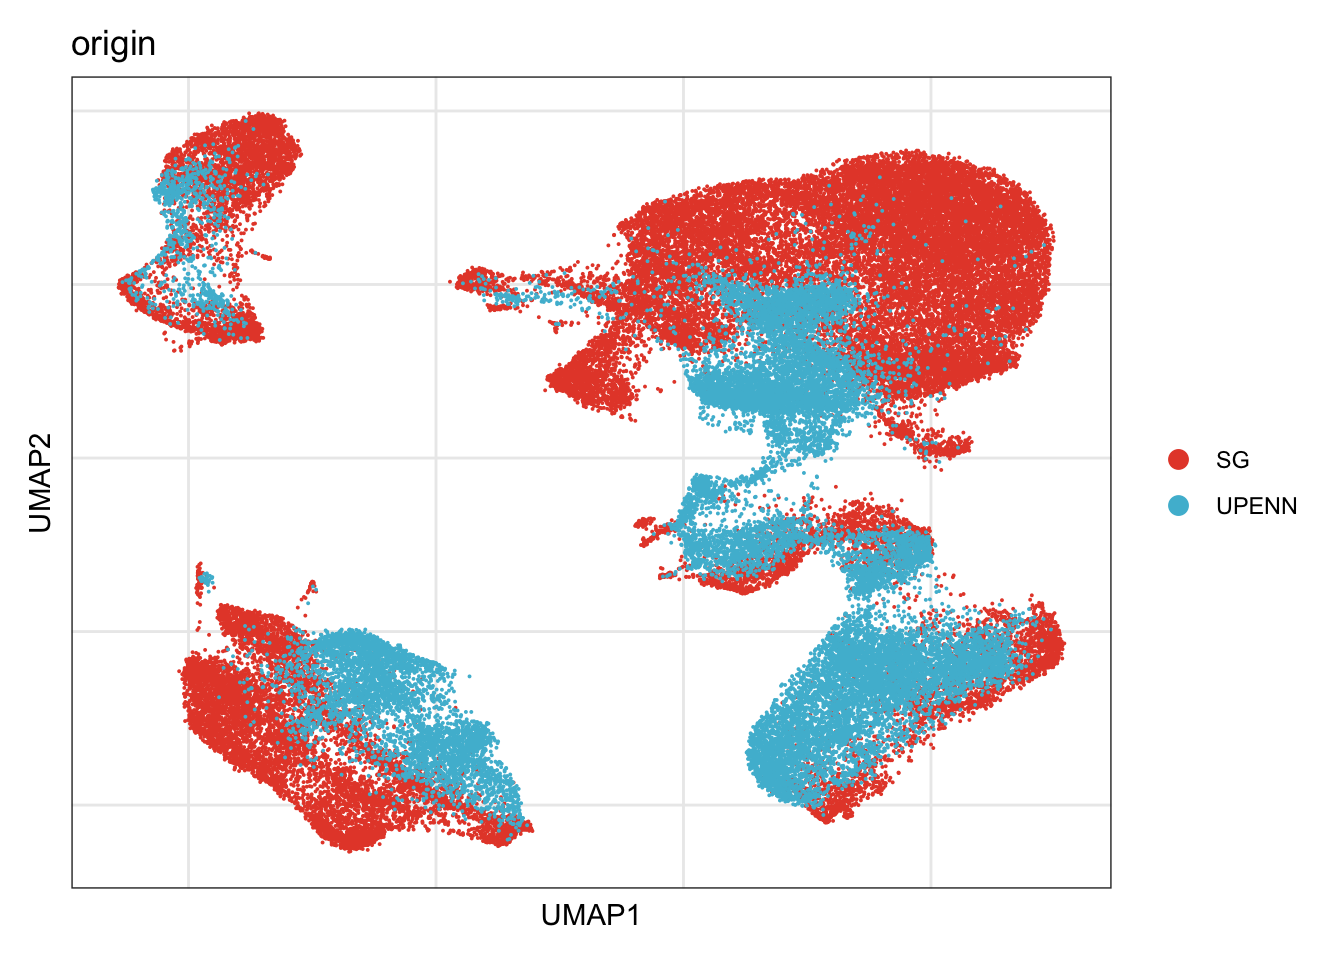
subset on LEC
dim(seurat)[1] 36098 61459seurat <- subset(seurat, grp %in% c("BEC"))
dim(seurat)[1] 36098 12379## reprocess
res <- c(0.8,0.6,0.4,0.25)
seurat <- NormalizeData(object = seurat)
seurat <- FindVariableFeatures(object = seurat)
seurat <- ScaleData(object = seurat, verbose = FALSE)
seurat <- RunPCA(object = seurat, npcs = 30, verbose = FALSE)
seurat <- RunTSNE(object = seurat, reduction = "pca", dims = 1:20)
seurat <- RunUMAP(object = seurat, reduction = "pca", dims = 1:20)
seurat <- FindNeighbors(object = seurat, reduction = "pca",
dims = 1:20)
for (i in 1:length(res)) {
seurat <- FindClusters(object = seurat, resolution = res[i],
random.seed = 1234)
}Modularity Optimizer version 1.3.0 by Ludo Waltman and Nees Jan van Eck
Number of nodes: 12379
Number of edges: 433943
Running Louvain algorithm...
Maximum modularity in 10 random starts: 0.8830
Number of communities: 15
Elapsed time: 1 seconds
Modularity Optimizer version 1.3.0 by Ludo Waltman and Nees Jan van Eck
Number of nodes: 12379
Number of edges: 433943
Running Louvain algorithm...
Maximum modularity in 10 random starts: 0.8993
Number of communities: 13
Elapsed time: 1 seconds
Modularity Optimizer version 1.3.0 by Ludo Waltman and Nees Jan van Eck
Number of nodes: 12379
Number of edges: 433943
Running Louvain algorithm...
Maximum modularity in 10 random starts: 0.9177
Number of communities: 12
Elapsed time: 1 seconds
Modularity Optimizer version 1.3.0 by Ludo Waltman and Nees Jan van Eck
Number of nodes: 12379
Number of edges: 433943
Running Louvain algorithm...
Maximum modularity in 10 random starts: 0.9337
Number of communities: 8
Elapsed time: 1 secondsvisualize data
clustering
## visualize input data
DimPlot(seurat, reduction = "umap", cols=colPal)+
  theme_bw() +
  theme(axis.text = element_blank(), axis.ticks = element_blank(),
        panel.grid.minor = element_blank()) +
  xlab("UMAP1") +
  ylab("UMAP2")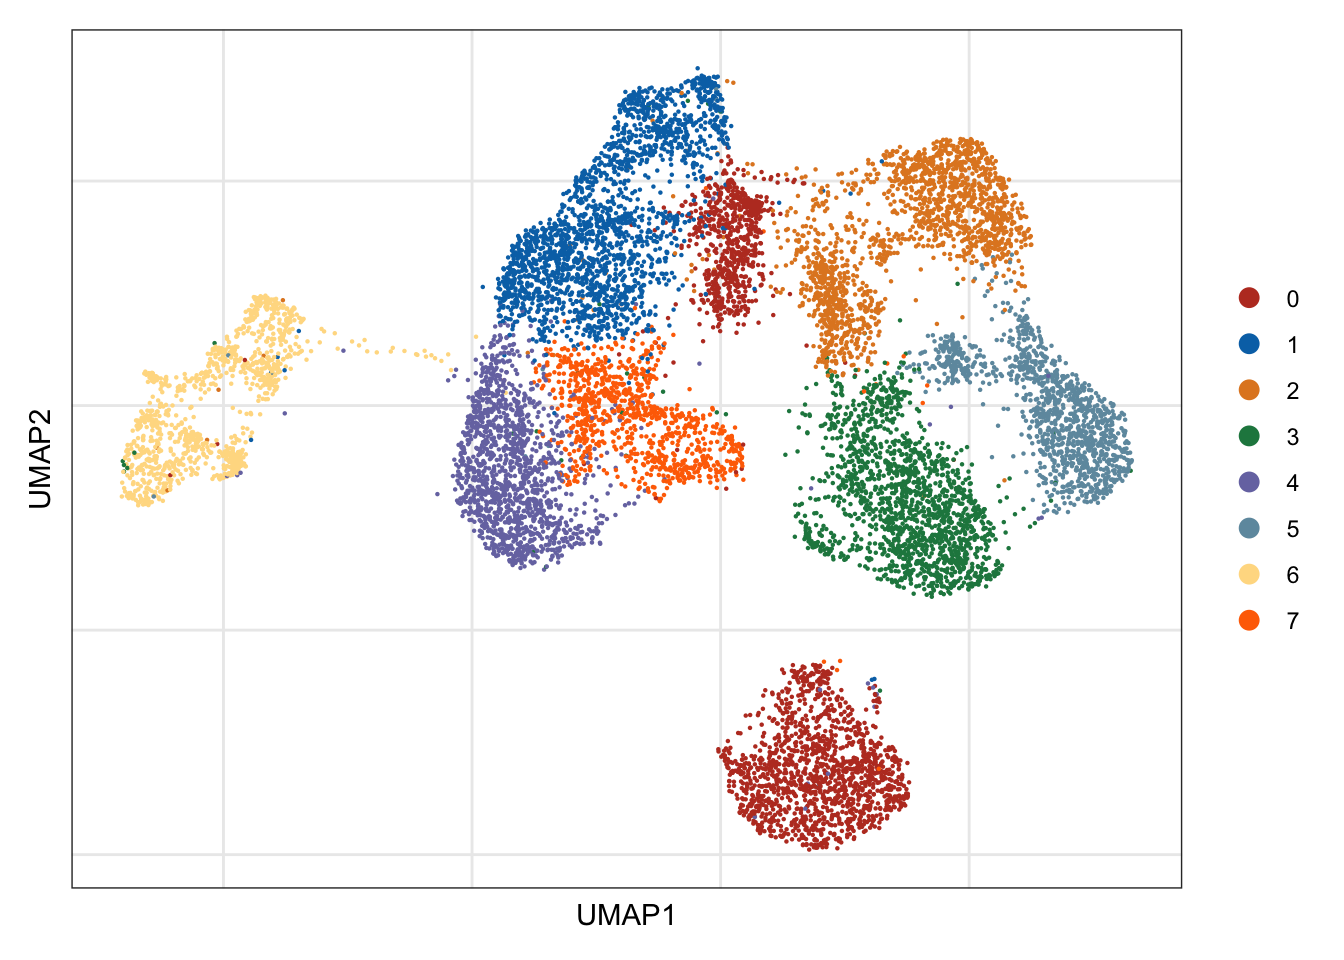
patient
DimPlot(seurat, reduction = "umap", cols=colPat, group.by = "patient",
        shuffle = T)+
  theme_bw() +
  theme(axis.text = element_blank(), axis.ticks = element_blank(),
        panel.grid.minor = element_blank()) +
  xlab("UMAP1") +
  ylab("UMAP2")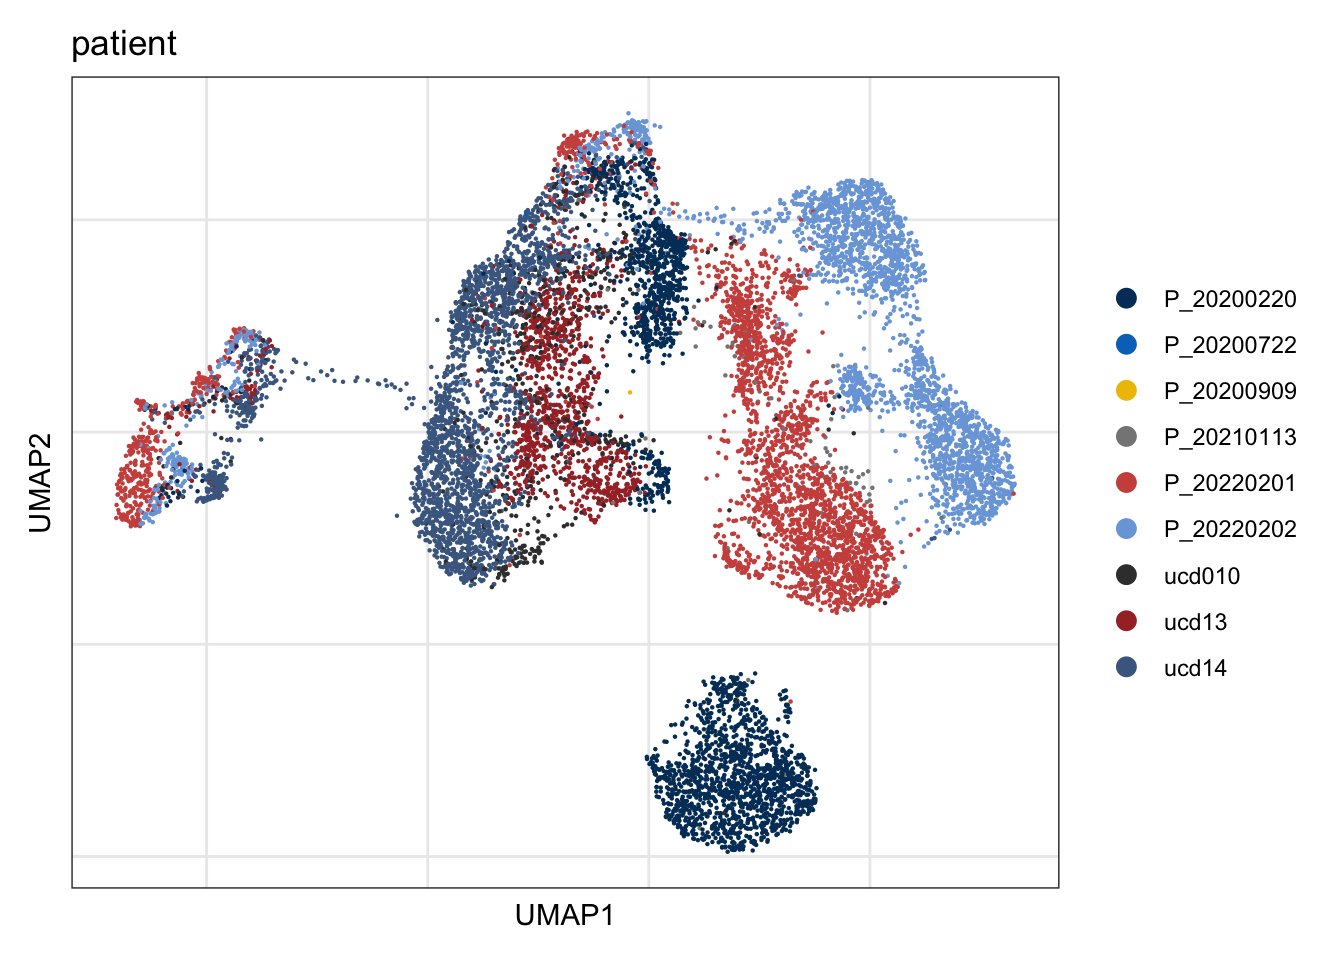
cond2
## visualize input data
DimPlot(seurat, reduction = "umap", cols=colCond2, group.by = "cond2")+
  theme_bw() +
  theme(axis.text = element_blank(), axis.ticks = element_blank(),
        panel.grid.minor = element_blank()) +
  xlab("UMAP1") +
  ylab("UMAP2")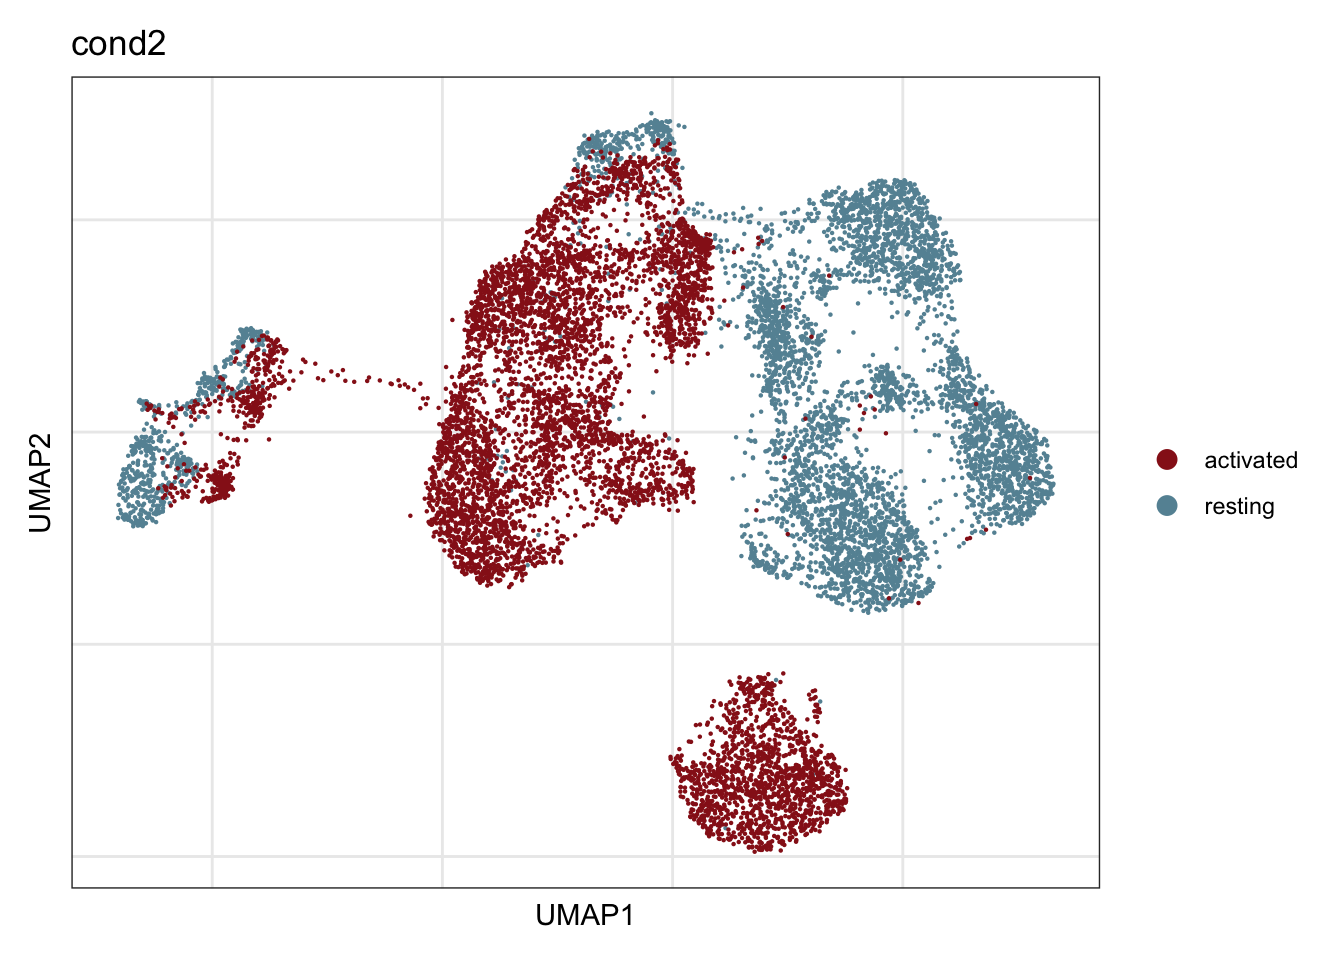
grp
DimPlot(seurat, reduction = "umap", cols=colGrp, group.by = "grp")+
  theme_bw() +
  theme(axis.text = element_blank(), axis.ticks = element_blank(),
        panel.grid.minor = element_blank()) +
  xlab("UMAP1") +
  ylab("UMAP2")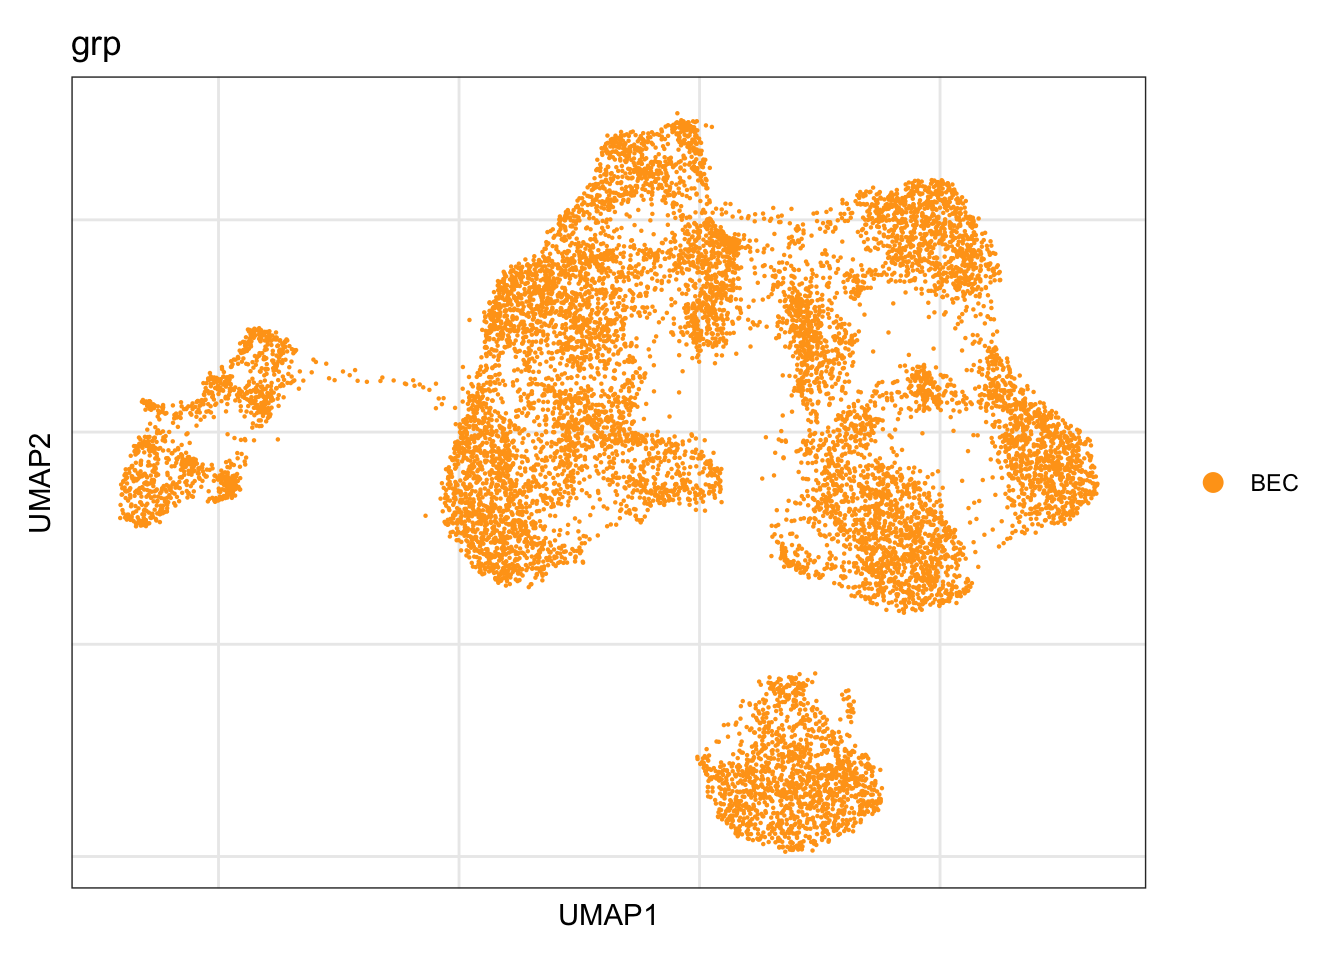
origin
DimPlot(seurat, reduction = "umap", cols=colOri, group.by = "origin",
        shuffle = T)+
  theme_bw() +
  theme(axis.text = element_blank(), axis.ticks = element_blank(),
        panel.grid.minor = element_blank()) +
  xlab("UMAP1") +
  ylab("UMAP2")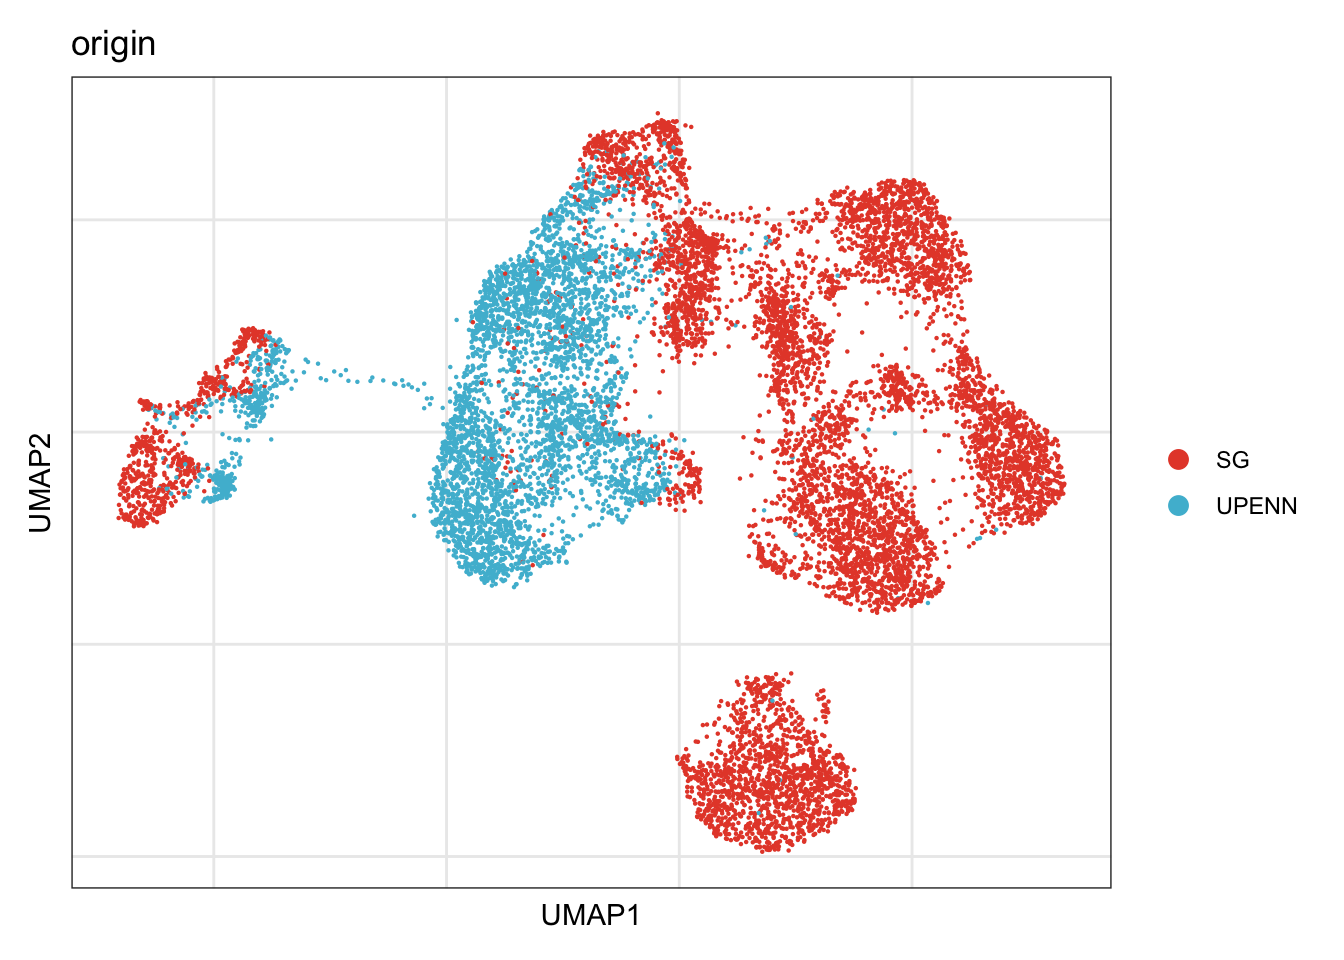
save seurat object
saveRDS(seurat, file=paste0(basedir,"/data/AllPatWithoutCM_BEConly_seurat.rds"))integrate data
patSel <- names(table(seurat$patient))[which(table(seurat$patient)>10)]
seurat <- subset(seurat, patient %in% patSel)
table(seurat$patient)
P_20200220 P_20210113 P_20220201 P_20220202     ucd010      ucd13      ucd14
2463 85 2812 2711 617 1062 2627 Idents(seurat) <- seurat$patient
seurat.list <- SplitObject(object = seurat, split.by = "patient")
for (i in 1:length(x = seurat.list)) {
seurat.list[[i]] <- NormalizeData(object = seurat.list[[i]],
verbose = FALSE)
seurat.list[[i]] <- FindVariableFeatures(object = seurat.list[[i]],
selection.method = "vst", nfeatures = 2000, verbose = FALSE)
}
seurat.anchors <- FindIntegrationAnchors(object.list = seurat.list, dims = 1:15)
seurat.int <- IntegrateData(anchorset = seurat.anchors, dims = 1:15,
k.weight = min(table(seurat$patient)))
DefaultAssay(object = seurat.int) <- "integrated"
# rerun seurat
seurat.int <- ScaleData(object = seurat.int, verbose = FALSE,
features = rownames(seurat.int))
seurat.int <- RunPCA(object = seurat.int, npcs = 20, verbose = FALSE)
seurat.int <- RunTSNE(object = seurat.int, reduction = "pca", dims = 1:20)
seurat.int <- RunUMAP(object = seurat.int, reduction = "pca", dims = 1:20)
seurat.int <- FindNeighbors(object = seurat.int, reduction = "pca", dims = 1:20)
res <- c(0.6,0.8,0.4,0.25)
for(i in 1:length(res)){
seurat.int <- FindClusters(object = seurat.int, resolution = res[i],
random.seed = 1234)
}Modularity Optimizer version 1.3.0 by Ludo Waltman and Nees Jan van Eck
Number of nodes: 12377
Number of edges: 464260
Running Louvain algorithm...
Maximum modularity in 10 random starts: 0.8576
Number of communities: 12
Elapsed time: 1 seconds
Modularity Optimizer version 1.3.0 by Ludo Waltman and Nees Jan van Eck
Number of nodes: 12377
Number of edges: 464260
Running Louvain algorithm...
Maximum modularity in 10 random starts: 0.8385
Number of communities: 15
Elapsed time: 1 seconds
Modularity Optimizer version 1.3.0 by Ludo Waltman and Nees Jan van Eck
Number of nodes: 12377
Number of edges: 464260
Running Louvain algorithm...
Maximum modularity in 10 random starts: 0.8819
Number of communities: 9
Elapsed time: 1 seconds
Modularity Optimizer version 1.3.0 by Ludo Waltman and Nees Jan van Eck
Number of nodes: 12377
Number of edges: 464260
Running Louvain algorithm...
Maximum modularity in 10 random starts: 0.9059
Number of communities: 7
Elapsed time: 1 secondsremove BEC/FRC cluster
## remove FRC cluster (based on CCL19, PDPN, COL1A1... expression)
## described here: PMID 32732867
seurat.int$intCluster <- seurat.int$integrated_snn_res.0.25
seurat.int <- subset(seurat.int, intCluster %in% c("3"), invert=T)

DefaultAssay(object = seurat.int) <- "integrated"

# rerun seurat
seurat.int <- ScaleData(object = seurat.int, verbose = FALSE,
                        features = rownames(seurat.int))
seurat.int <- RunPCA(object = seurat.int, npcs = 20, verbose = FALSE)
seurat.int <- RunTSNE(object = seurat.int, reduction = "pca", dims = 1:20)
seurat.int <- RunUMAP(object = seurat.int, reduction = "pca", dims = 1:20)
save int object
DefaultAssay(object = seurat.int) <- "RNA"
Idents(seurat.int) <- seurat.int$intCluster

saveRDS(seurat.int,
        file= paste0(basedir,
                     "/data/AllPatWithoutCM_BEConly_intOrig_seurat.rds"))
visualize int data
clustering
colPal <- c(pal_nejm()(8),pal_futurama()(12))[1:length(levels(seurat.int))]
names(colPal) <- levels(seurat.int)

DimPlot(seurat.int, reduction = "umap", cols=colPal)+
  theme_bw() +
  theme(axis.text = element_blank(), axis.ticks = element_blank(),
        panel.grid.minor = element_blank()) +
  xlab("UMAP1") +
  ylab("UMAP2")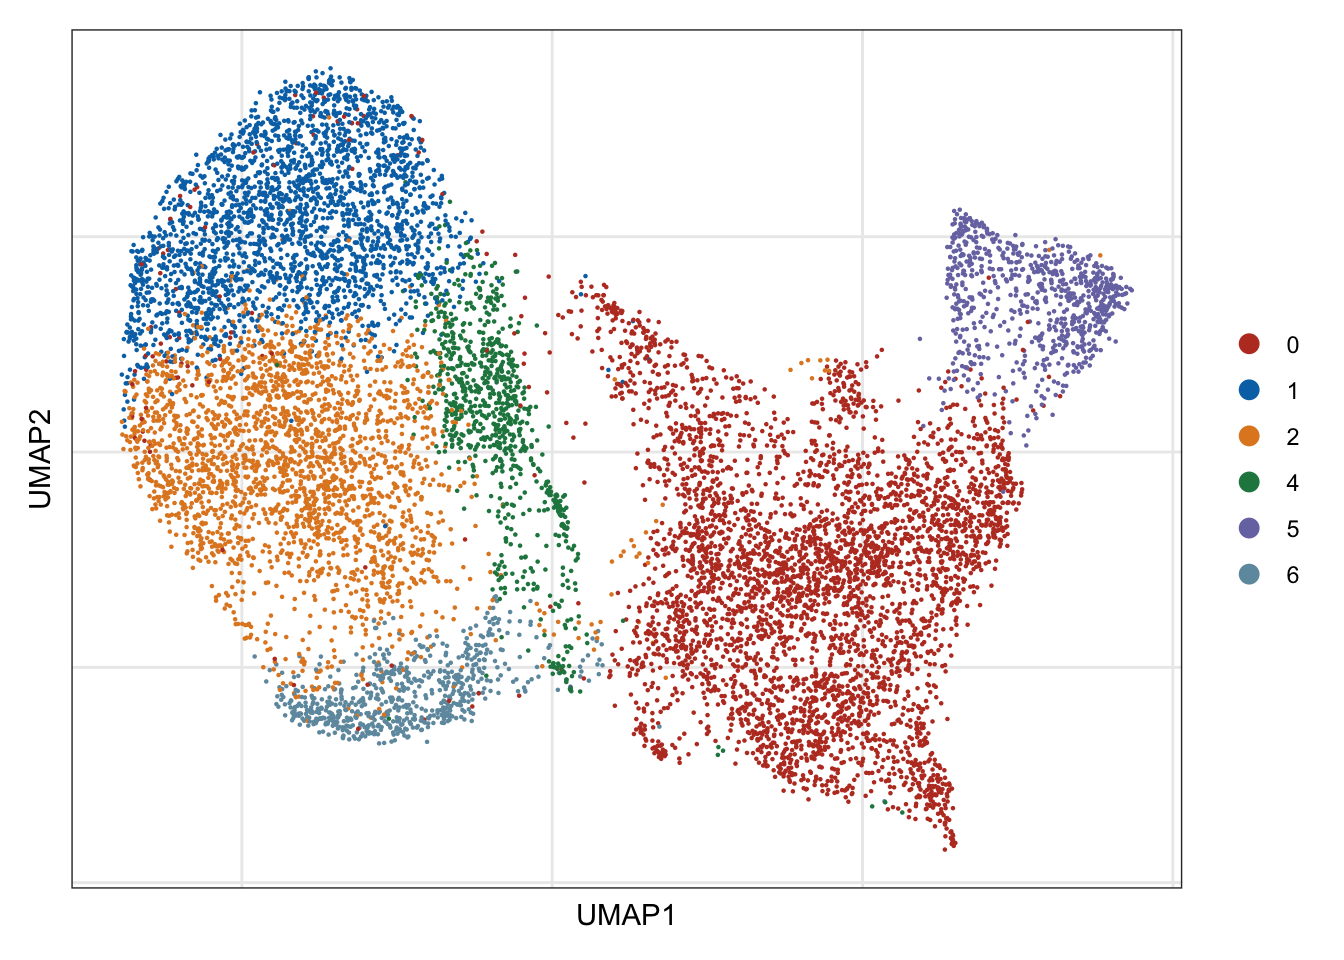
patient
## visualize input data
DimPlot(seurat.int, reduction = "umap", cols=colPat, group.by = "patient")+
  theme_bw() +
  theme(axis.text = element_blank(), axis.ticks = element_blank(),
        panel.grid.minor = element_blank()) +
  xlab("UMAP1") +
  ylab("UMAP2")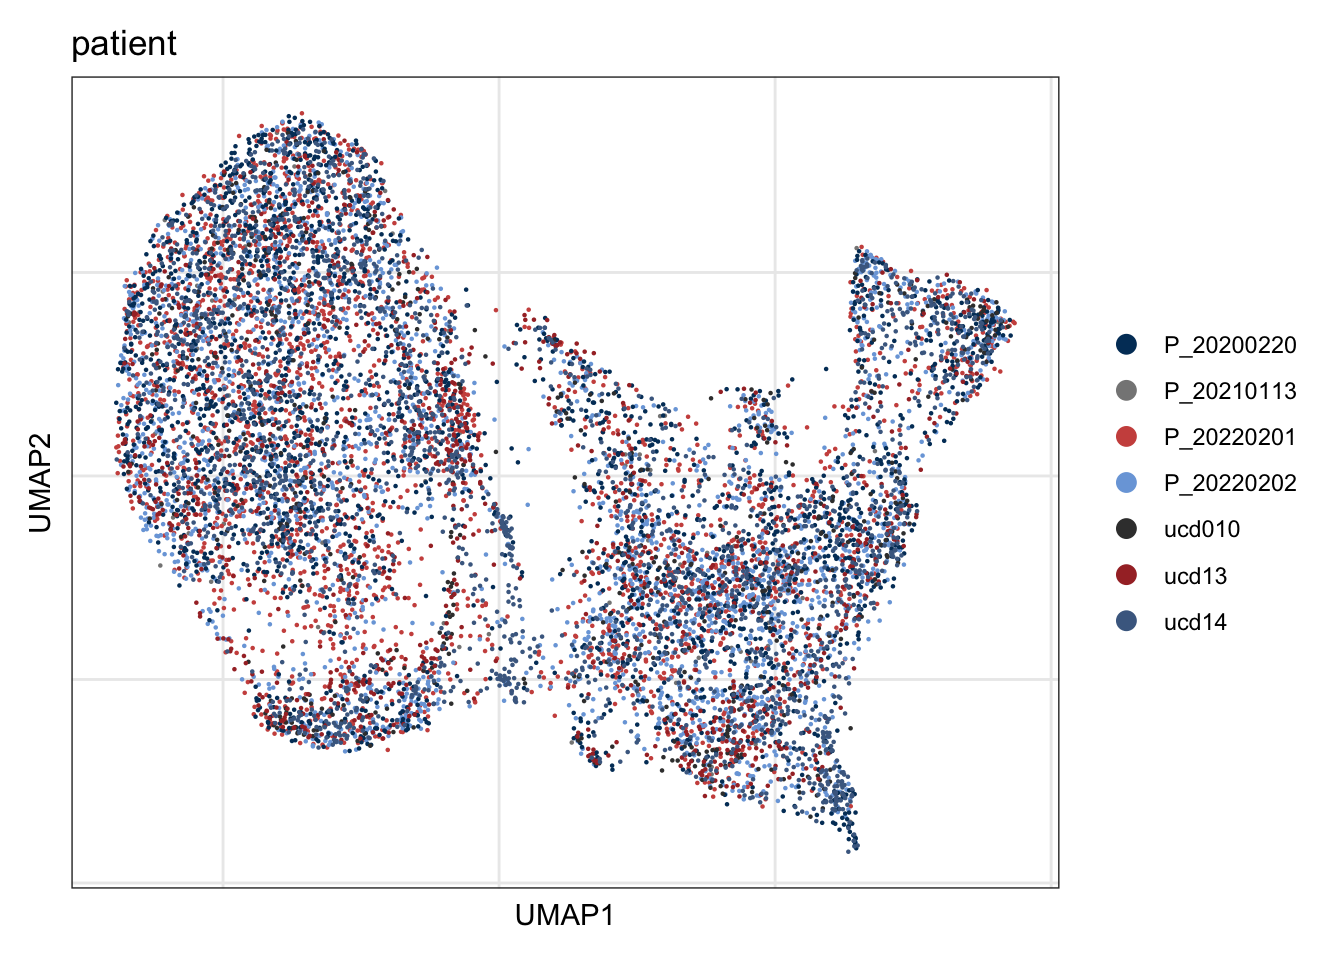
cond
DimPlot(seurat.int, reduction = "umap", cols=colCond2, group.by = "cond2")+
  theme_bw() +
  theme(axis.text = element_blank(), axis.ticks = element_blank(),
        panel.grid.minor = element_blank()) +
  xlab("UMAP1") +
  ylab("UMAP2")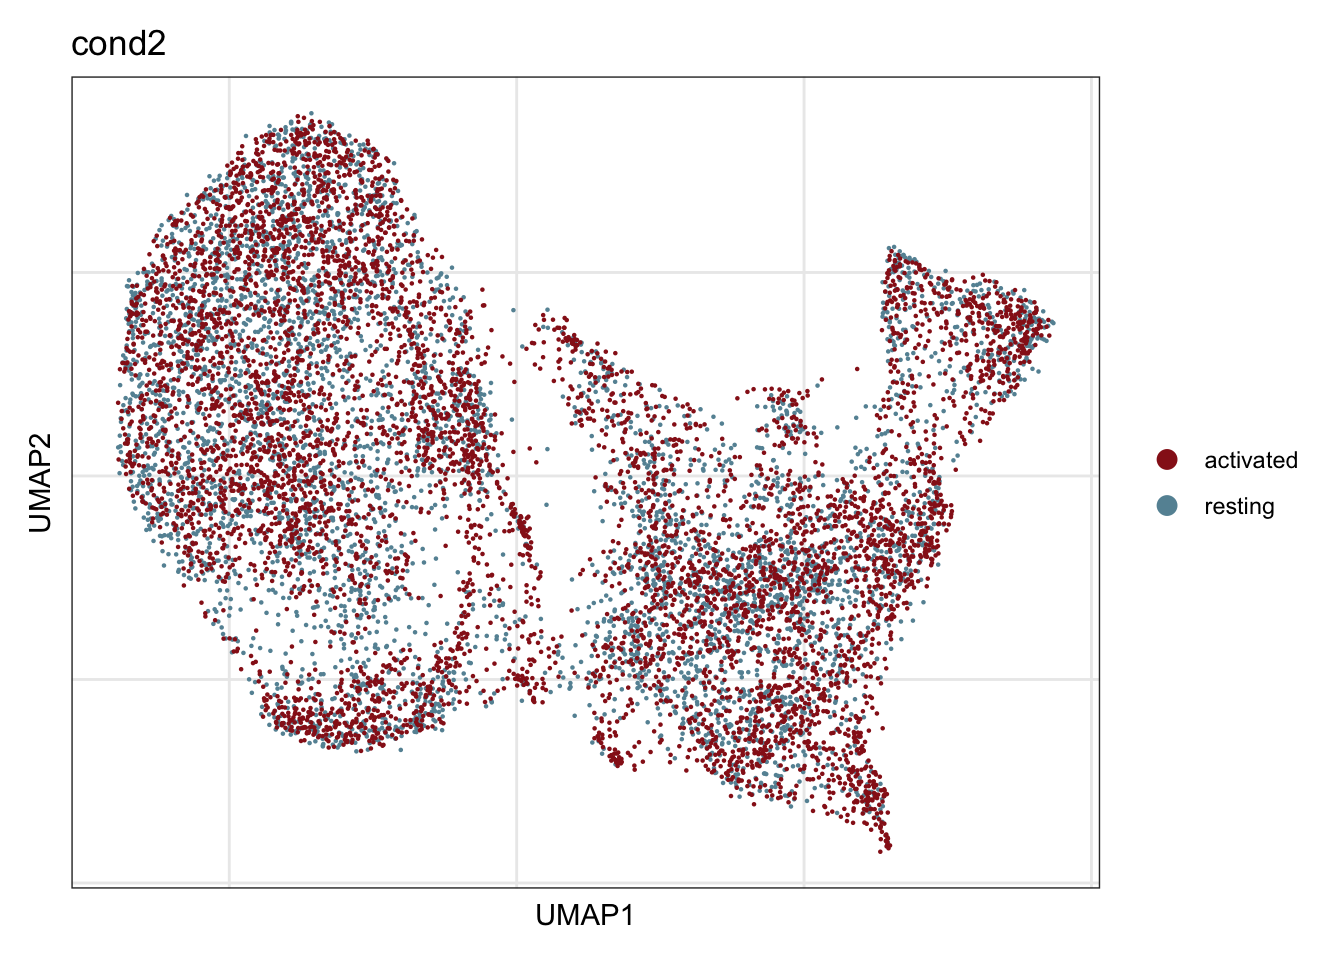
session info
sessionInfo()R version 4.3.0 (2023-04-21)
Platform: x86_64-apple-darwin20 (64-bit)
Running under: macOS Ventura 13.4.1
Matrix products: default
BLAS: /Library/Frameworks/R.framework/Versions/4.3-x86_64/Resources/lib/libRblas.0.dylib
LAPACK: /Library/Frameworks/R.framework/Versions/4.3-x86_64/Resources/lib/libRlapack.dylib; LAPACK version 3.11.0
locale:
[1] en_US.UTF-8/en_US.UTF-8/en_US.UTF-8/C/en_US.UTF-8/en_US.UTF-8
time zone: Europe/Berlin
tzcode source: internal
attached base packages:
[1] stats4 stats graphics grDevices utils datasets methods base
other attached packages:
[1] scater_1.28.0 scuttle_1.10.3 SingleCellExperiment_1.22.0
[4] SummarizedExperiment_1.30.2 Biobase_2.60.0 GenomicRanges_1.52.1
[7] GenomeInfoDb_1.36.4 IRanges_2.36.0 S4Vectors_0.40.1
[10] BiocGenerics_0.48.0 MatrixGenerics_1.12.3 matrixStats_1.2.0
[13] pheatmap_1.0.12 ggsci_3.0.1 here_1.0.1
[16] runSeurat3_0.1.0 ggpubr_0.6.0 lubridate_1.9.3
[19] forcats_1.0.0 stringr_1.5.1 readr_2.1.5
[22] tidyr_1.3.1 tibble_3.2.1 tidyverse_2.0.0
[25] Seurat_5.0.2 SeuratObject_5.0.1 sp_2.1-3
[28] purrr_1.0.2 cowplot_1.1.3 ggplot2_3.5.0
[31] reshape2_1.4.4 dplyr_1.1.4
loaded via a namespace (and not attached):
[1] RcppAnnoy_0.0.22 splines_4.3.0 later_1.3.2
[4] bitops_1.0-7 polyclip_1.10-6 fastDummies_1.7.3
[7] lifecycle_1.0.4 rstatix_0.7.2 rprojroot_2.0.4
[10] globals_0.16.2 lattice_0.22-5 MASS_7.3-60.0.1
[13] backports_1.4.1 magrittr_2.0.3 plotly_4.10.4
[16] rmarkdown_2.26 yaml_2.3.8 httpuv_1.6.14
[19] sctransform_0.4.1 spam_2.10-0 spatstat.sparse_3.0-3
[22] reticulate_1.35.0 pbapply_1.7-2 RColorBrewer_1.1-3
[25] abind_1.4-5 zlibbioc_1.46.0 Rtsne_0.17
[28] RCurl_1.98-1.14 GenomeInfoDbData_1.2.10 ggrepel_0.9.5
[31] irlba_2.3.5.1 listenv_0.9.1 spatstat.utils_3.0-4
[34] goftest_1.2-3 RSpectra_0.16-1 spatstat.random_3.2-3
[37] fitdistrplus_1.1-11 parallelly_1.37.1 DelayedMatrixStats_1.22.6
[40] leiden_0.4.3.1 codetools_0.2-19 DelayedArray_0.26.7
[43] tidyselect_1.2.0 farver_2.1.1 viridis_0.6.5
[46] ScaledMatrix_1.8.1 spatstat.explore_3.2-6 jsonlite_1.8.8
[49] BiocNeighbors_1.18.0 ellipsis_0.3.2 progressr_0.14.0
[52] ggridges_0.5.6 survival_3.5-8 tools_4.3.0
[55] ica_1.0-3 Rcpp_1.0.12 glue_1.7.0
[58] gridExtra_2.3 xfun_0.42 withr_3.0.0
[61] fastmap_1.1.1 fansi_1.0.6 rsvd_1.0.5
[64] digest_0.6.34 timechange_0.3.0 R6_2.5.1
[67] mime_0.12 colorspace_2.1-0 scattermore_1.2
[70] tensor_1.5 spatstat.data_3.0-4 utf8_1.2.4
[73] generics_0.1.3 data.table_1.15.2 httr_1.4.7
[76] htmlwidgets_1.6.4 S4Arrays_1.0.6 uwot_0.1.16
[79] pkgconfig_2.0.3 gtable_0.3.4 lmtest_0.9-40
[82] XVector_0.40.0 htmltools_0.5.7 carData_3.0-5
[85] dotCall64_1.1-1 scales_1.3.0 png_0.1-8
[88] knitr_1.45 rstudioapi_0.15.0 tzdb_0.4.0
[91] nlme_3.1-164 zoo_1.8-12 KernSmooth_2.23-22
[94] vipor_0.4.7 parallel_4.3.0 miniUI_0.1.1.1
[97] pillar_1.9.0 grid_4.3.0 vctrs_0.6.5
[100] RANN_2.6.1 promises_1.2.1 BiocSingular_1.16.0
[103] car_3.1-2 beachmat_2.16.0 xtable_1.8-4
[106] cluster_2.1.6 beeswarm_0.4.0 evaluate_0.23
[109] cli_3.6.2 compiler_4.3.0 rlang_1.1.3
[112] crayon_1.5.2 future.apply_1.11.1 ggsignif_0.6.4
[115] labeling_0.4.3 ggbeeswarm_0.7.2 plyr_1.8.9
[118] stringi_1.8.3 BiocParallel_1.34.2 viridisLite_0.4.2
[121] deldir_2.0-4 munsell_0.5.0 lazyeval_0.2.2
[124] spatstat.geom_3.2-9 Matrix_1.6-5 RcppHNSW_0.6.0
[127] hms_1.1.3 patchwork_1.2.0 sparseMatrixStats_1.12.2
[130] future_1.33.1 shiny_1.8.0 ROCR_1.0-11
[133] igraph_2.0.2 broom_1.0.5 date()[1] "Wed Mar 13 20:04:26 2024"