DE genes FRCs resting versus activated human LN
Load packages
## load packages
suppressPackageStartupMessages({
  library(dplyr)
  library(reshape2)
  library(ggplot2)
  library(purrr)
  library(Seurat)
  library(tidyverse)
  library(ggpubr)
  library(runSeurat3)
  library(here)
  library(ggsci)
  library(pheatmap)
  library(scater)
  library(SingleCellExperiment)
  library(scran)
})
load seurat object
basedir <- here()

seurat <- readRDS(file= paste0(basedir,
                               "/data/AllPatWithoutCM_FRConly_intOrig_seurat.rds"))

DefaultAssay(object = seurat) <- "RNA"
seurat$intCluster <- as.character(seurat$integrated_snn_res.0.25)
Idents(seurat) <- seurat$intCluster


## set col palettes
colPal <- c(pal_uchicago()(6), "#6692a3", "#3b7f60")
names(colPal) <- c("0", "1", "2", "3", "4", "5", "6", "7")
colPat <- c(pal_nejm()(7),pal_futurama()(12))[1:length(unique(seurat$patient))]
names(colPat) <- unique(seurat$patient)
colCond <- c("#6692a3","#971c1c","#d17d67")
names(colCond) <- unique(seurat$cond)
colGrp <- pal_uchicago()(length(unique(seurat$grp)))
names(colGrp) <- unique(seurat$grp)
colOri <- pal_npg()(length(unique(seurat$origin)))
names(colOri) <- unique(seurat$origin)
colTon <- colCond

## all activated in one grp
seurat$cond2 <- seurat$cond
seurat$cond2[which(seurat$cond %in% c("chronic", "acute"))] <- "activated"

colCond2 <- c("#6692a3","#971c1c")
names(colCond2) <- c("resting", "activated")
visualize data
clustering
## visualize input data
DimPlot(seurat, reduction = "umap", cols=colPal)+
  theme_bw() +
  theme(axis.text = element_blank(), axis.ticks = element_blank(),
        panel.grid.minor = element_blank()) +
  xlab("UMAP1") +
  ylab("UMAP2")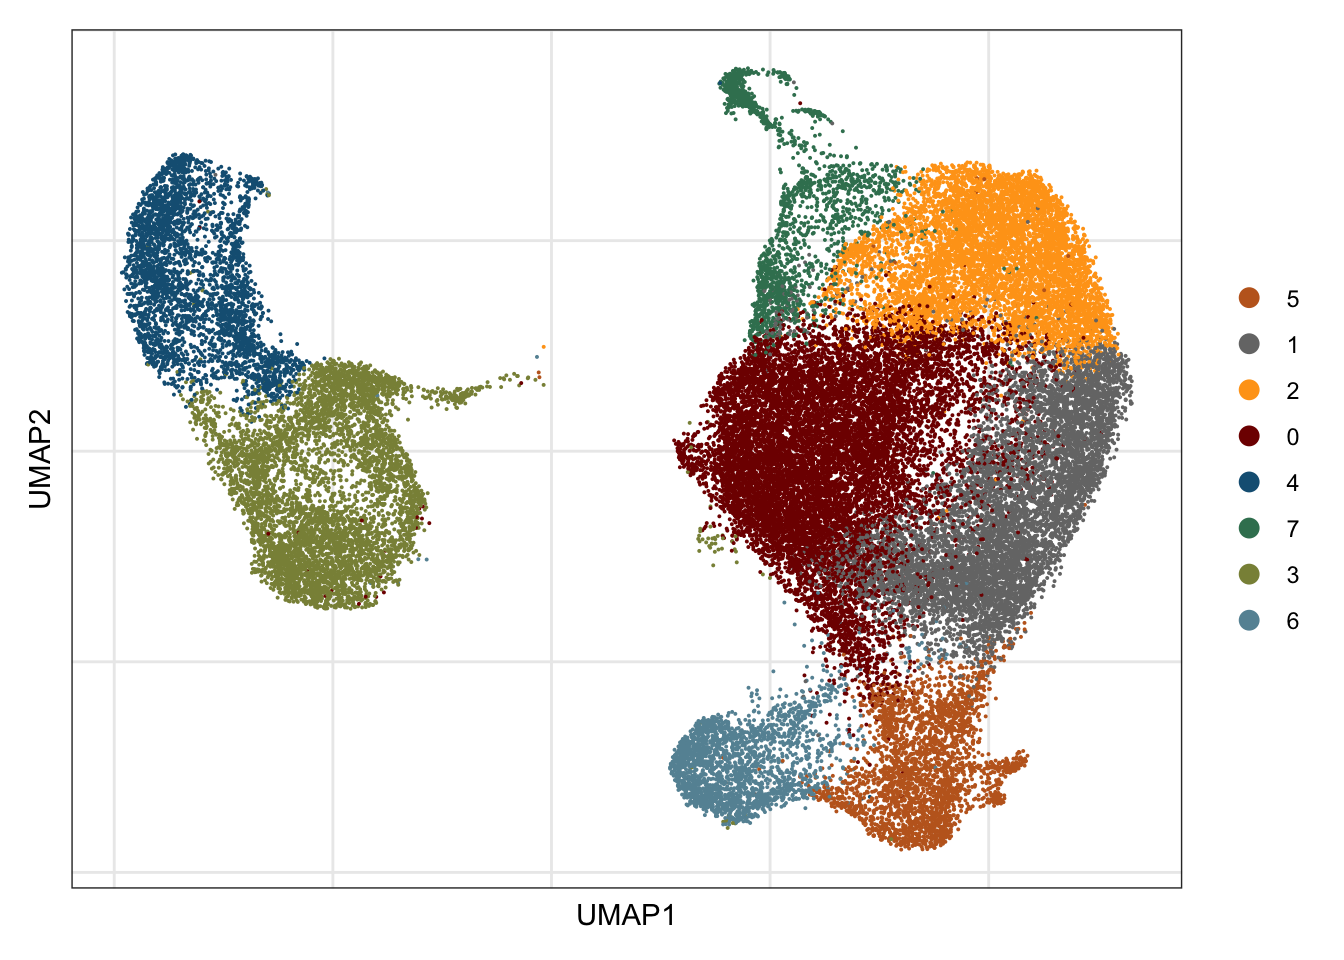
patient
## visualize input data
DimPlot(seurat, reduction = "umap", cols=colPat, group.by = "patient")+
  theme_bw() +
  theme(axis.text = element_blank(), axis.ticks = element_blank(),
        panel.grid.minor = element_blank()) +
  xlab("UMAP1") +
  ylab("UMAP2")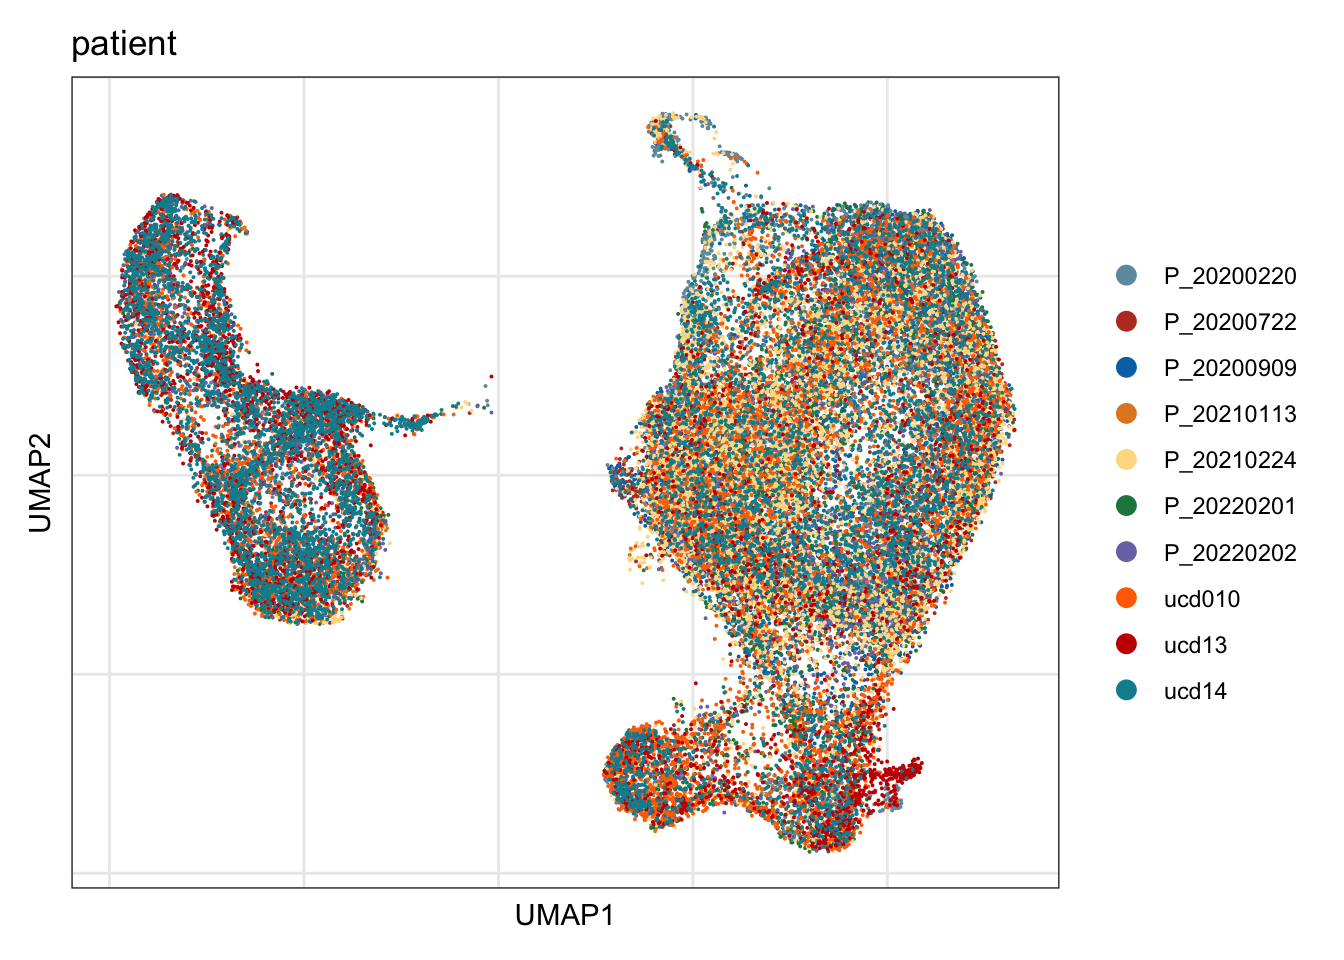
cond2
## visualize input data
DimPlot(seurat, reduction = "umap", cols=colCond2, group.by = "cond2")+
  theme_bw() +
  theme(axis.text = element_blank(), axis.ticks = element_blank(),
        panel.grid.minor = element_blank()) +
  xlab("UMAP1") +
  ylab("UMAP2")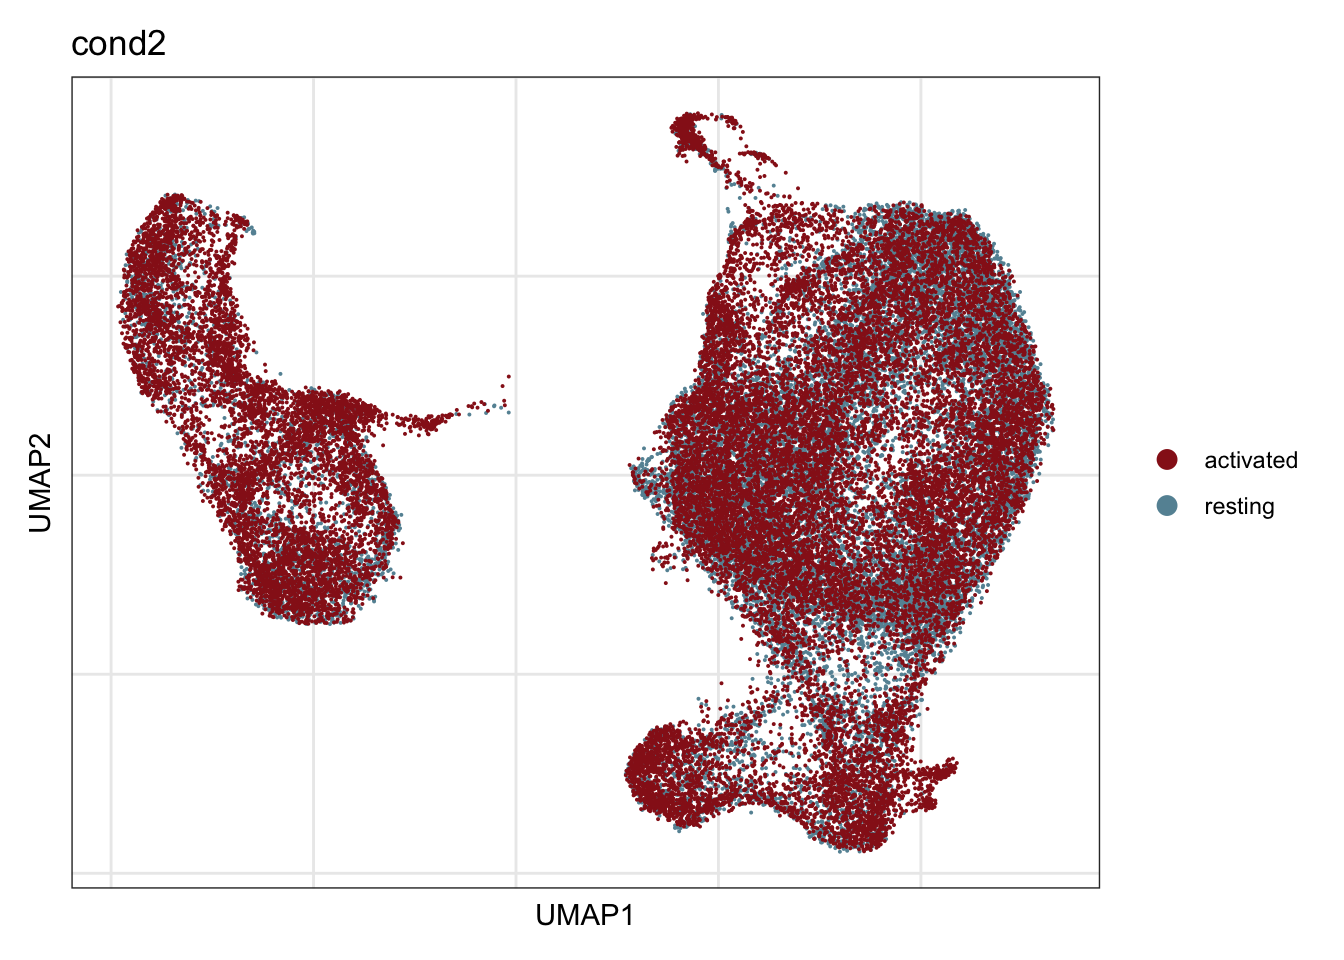
grp
## visualize input data
DimPlot(seurat, reduction = "umap", cols=colGrp, group.by = "grp")+
  theme_bw() +
  theme(axis.text = element_blank(), axis.ticks = element_blank(),
        panel.grid.minor = element_blank()) +
  xlab("UMAP1") +
  ylab("UMAP2")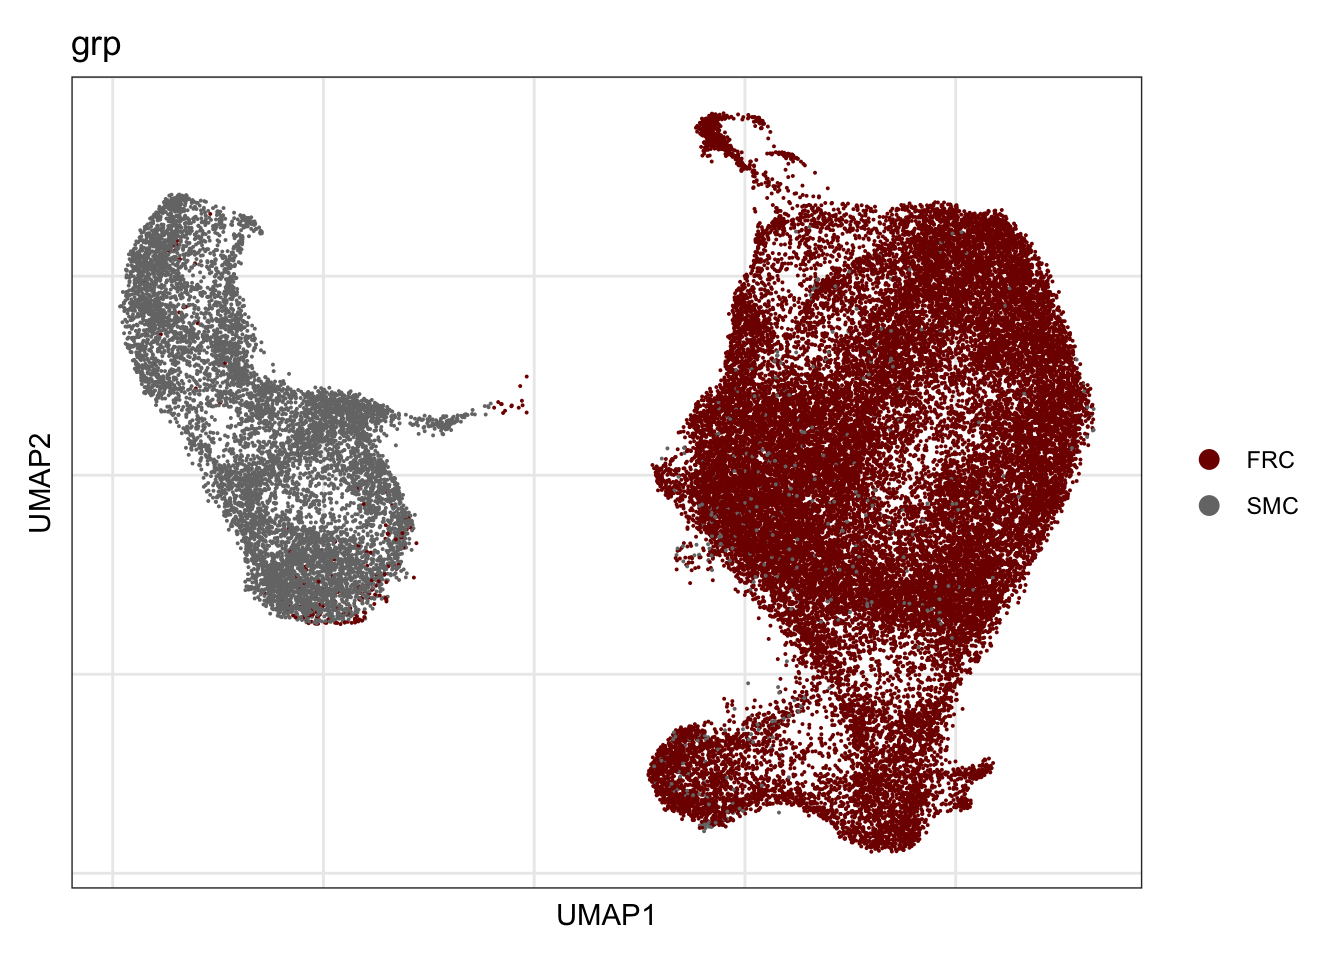
origin
## visualize input data
DimPlot(seurat, reduction = "umap", cols=colOri, group.by = "origin")+
  theme_bw() +
  theme(axis.text = element_blank(), axis.ticks = element_blank(),
        panel.grid.minor = element_blank()) +
  xlab("UMAP1") +
  ylab("UMAP2")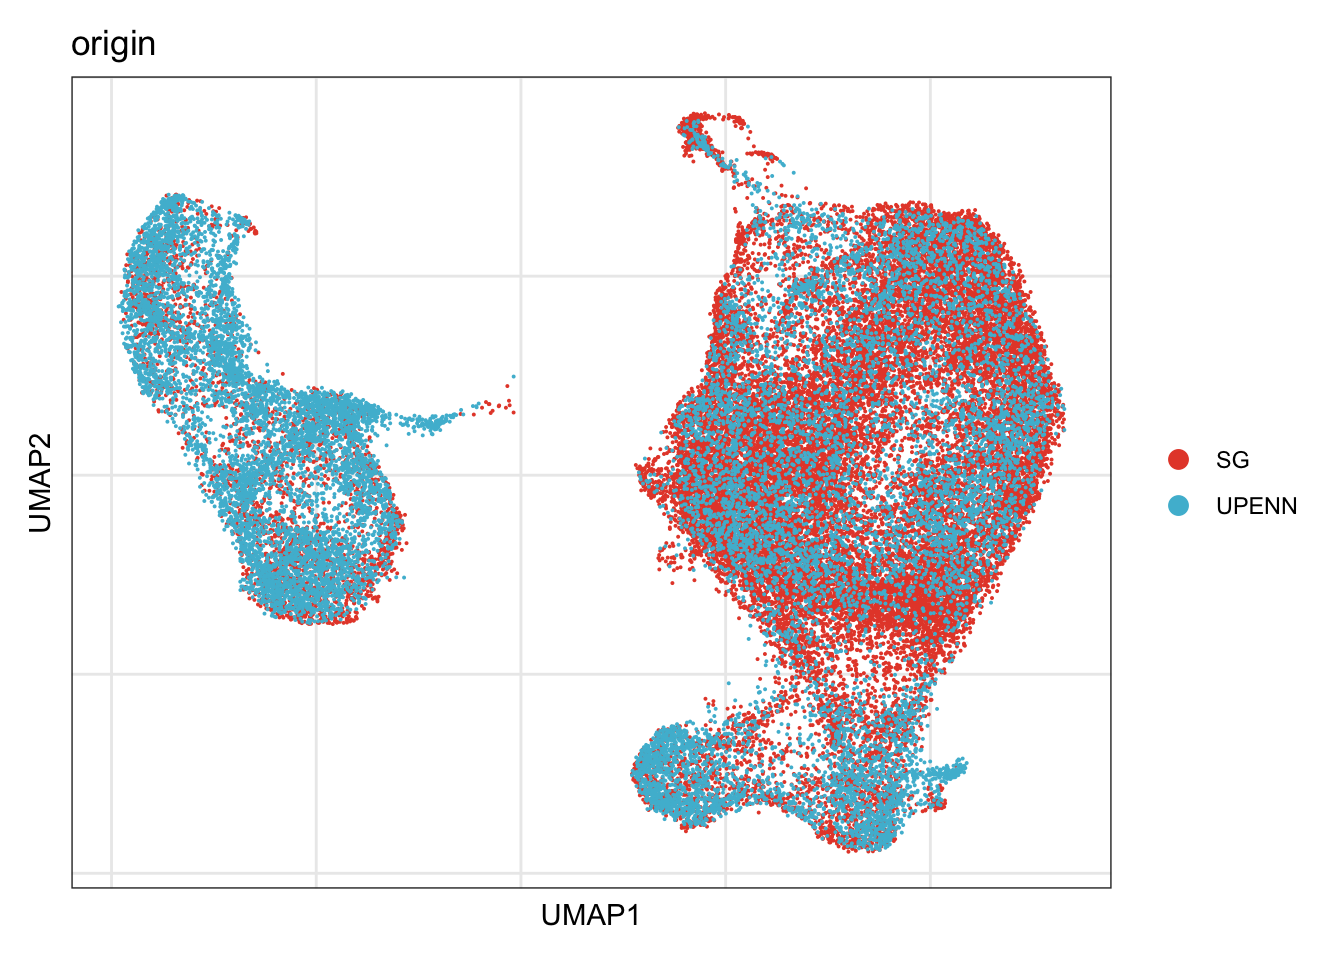
overall DE genes
sce <- as.SingleCellExperiment(seurat)
#m.out <- scoreMarkers(sce, sce$cond2, block=sce$patient)
m.out <- scoreMarkers(sce, sce$cond2)
plot DE genes mean AUC
cluVec <- unique(names(m.out))
lapply(cluVec, function(cl){
  outSub <- data.frame(m.out@listData[[cl]]) %>%
    rownames_to_column(var = "gene") %>%
    slice_max(., order_by=mean.AUC, n=26)
  plotExpression(sce, features=outSub$gene,
    x="patient", colour_by="cond2") +
    scale_color_manual(values = colCond2)
})
[[1]]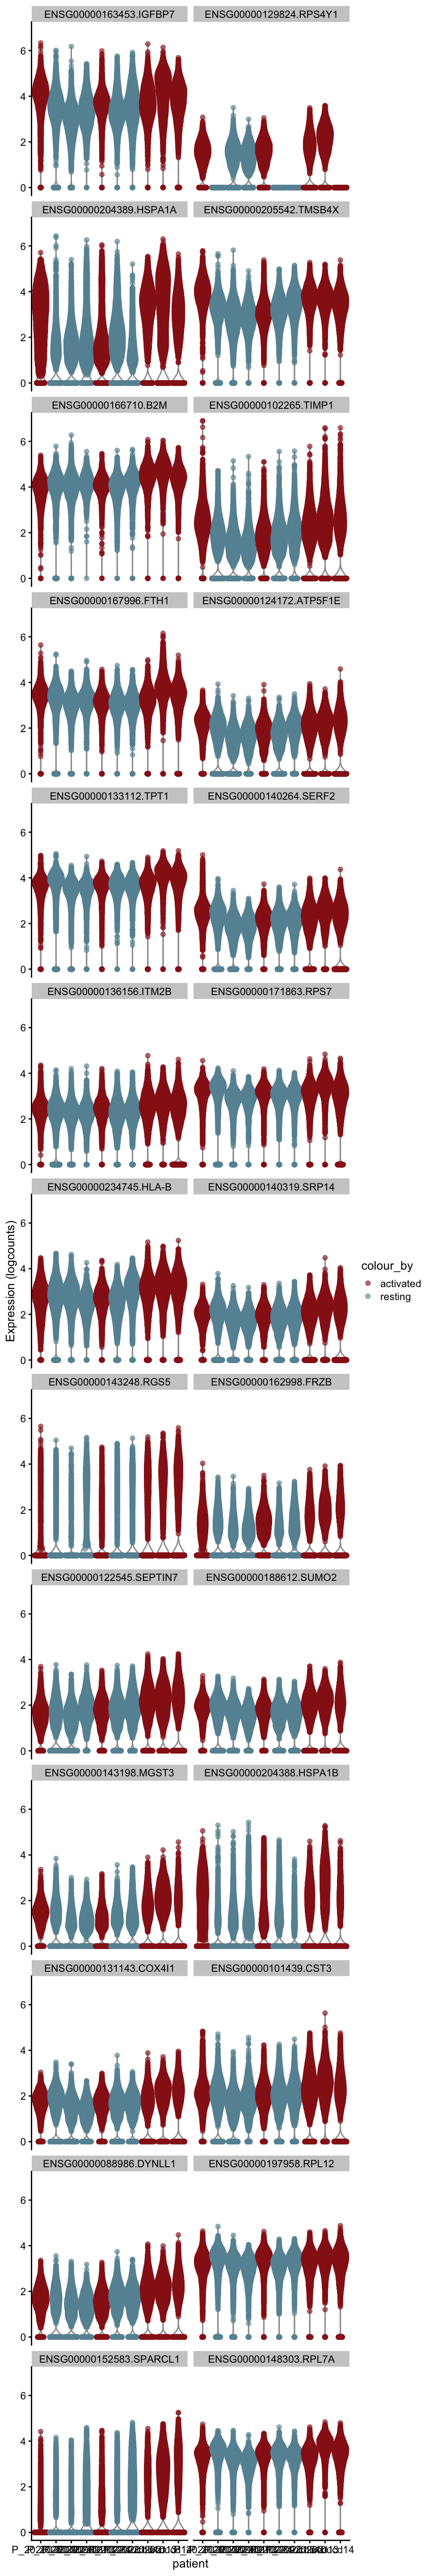
[[2]]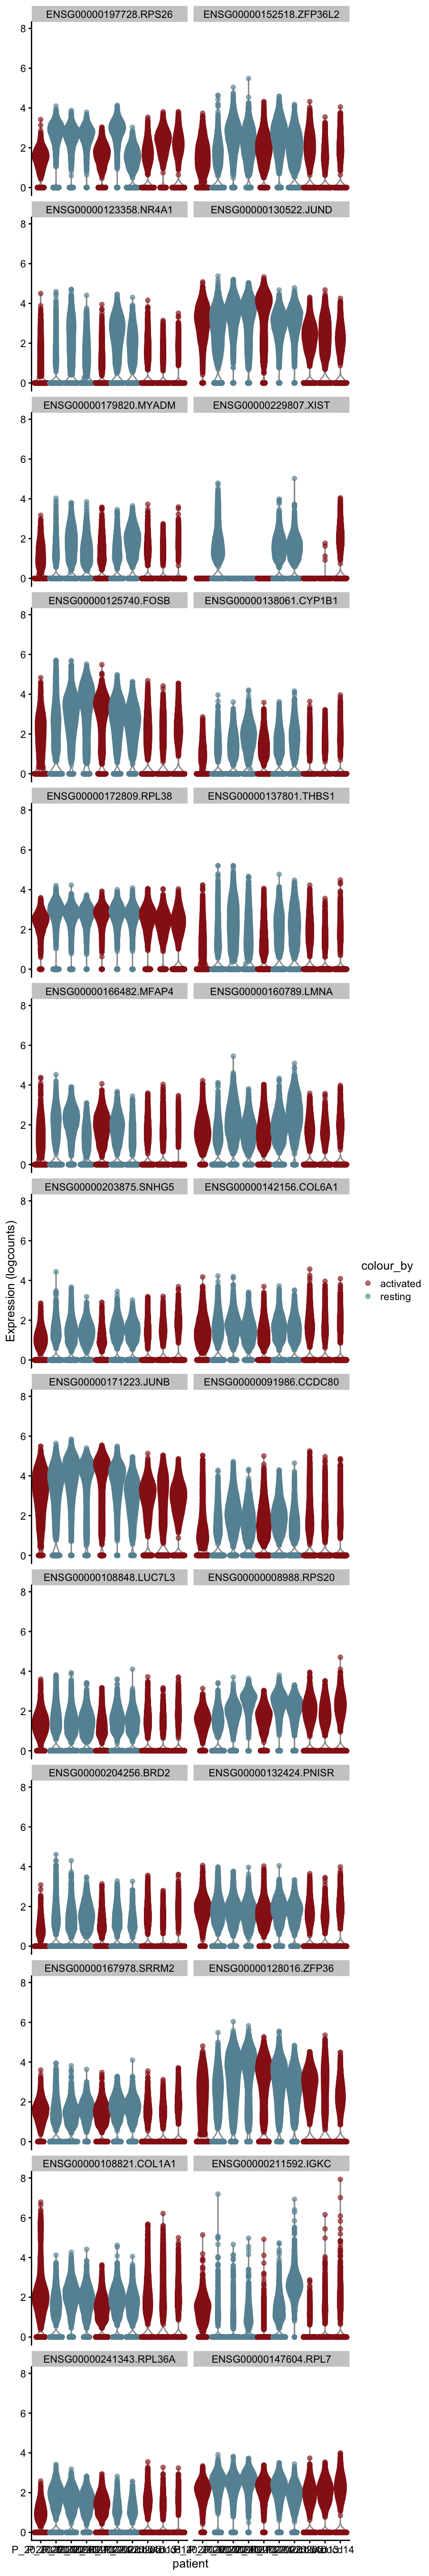
plot DE genes mean.logFC.cohen
cluVec <- unique(names(m.out))
lapply(cluVec, function(cl){
  outSub <- data.frame(m.out@listData[[cl]]) %>%
    rownames_to_column(var = "gene") %>%
    slice_max(., order_by=mean.logFC.cohen, n=26)
  plotExpression(sce, features=outSub$gene,
    x="patient", colour_by="cond2") +
    scale_color_manual(values = colCond2)
})
[[1]]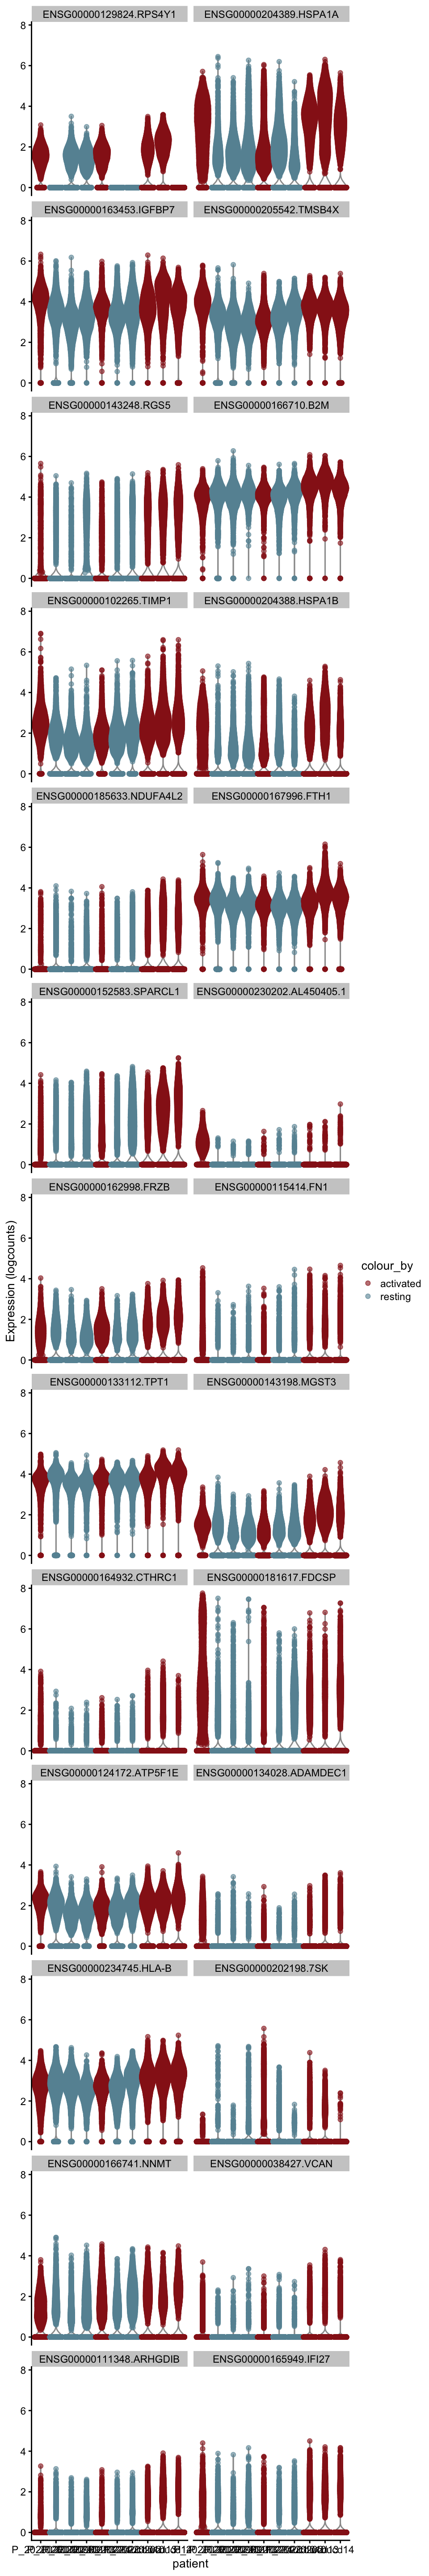
[[2]]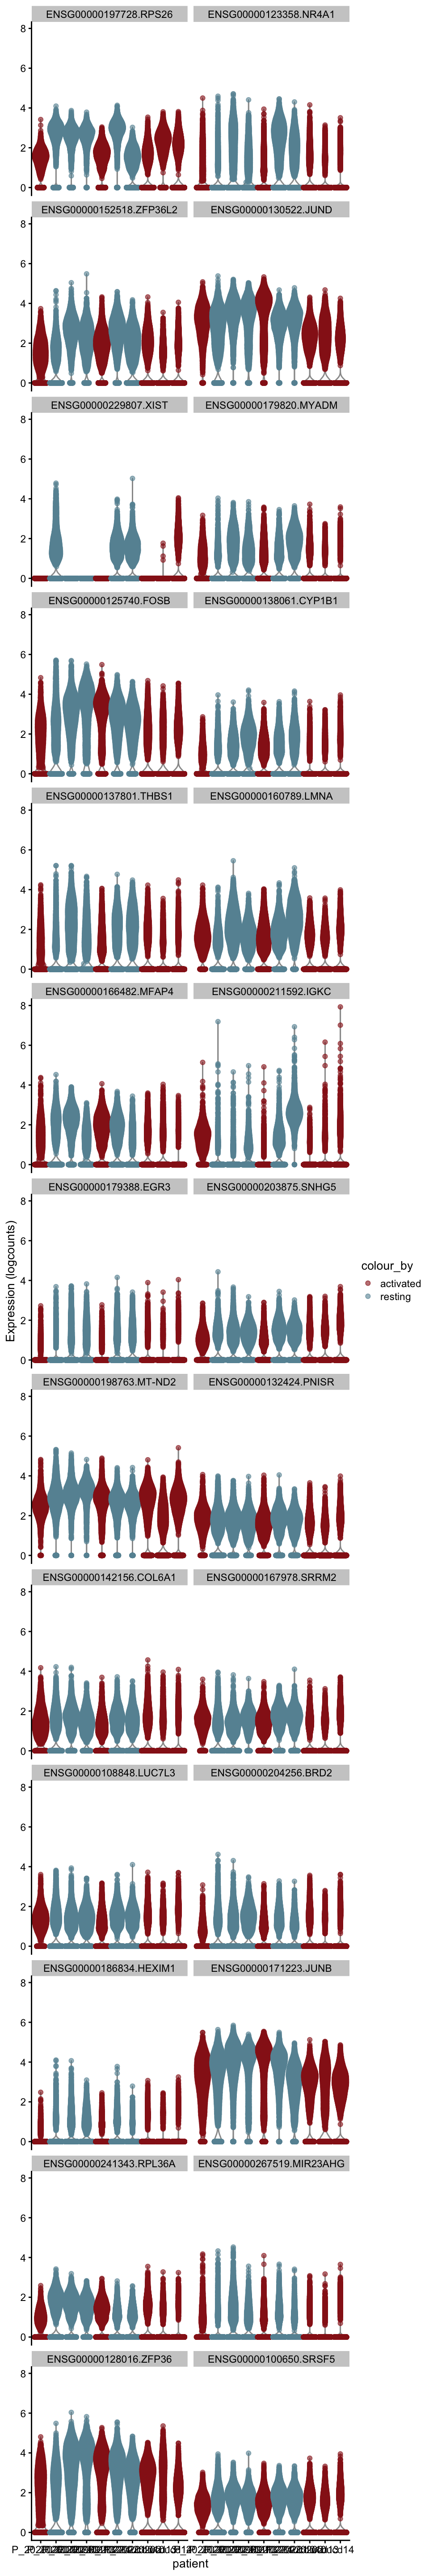
plot DE genes mean.logFC.detected
cluVec <- unique(names(m.out))
lapply(cluVec, function(cl){
  outSub <- data.frame(m.out@listData[[cl]]) %>%
    rownames_to_column(var = "gene") %>%
    slice_max(., order_by=mean.logFC.detected, n=26)
  plotExpression(sce, features=outSub$gene,
    x="patient", colour_by="cond") +
    scale_color_manual(values = colCond2)
})
[[1]]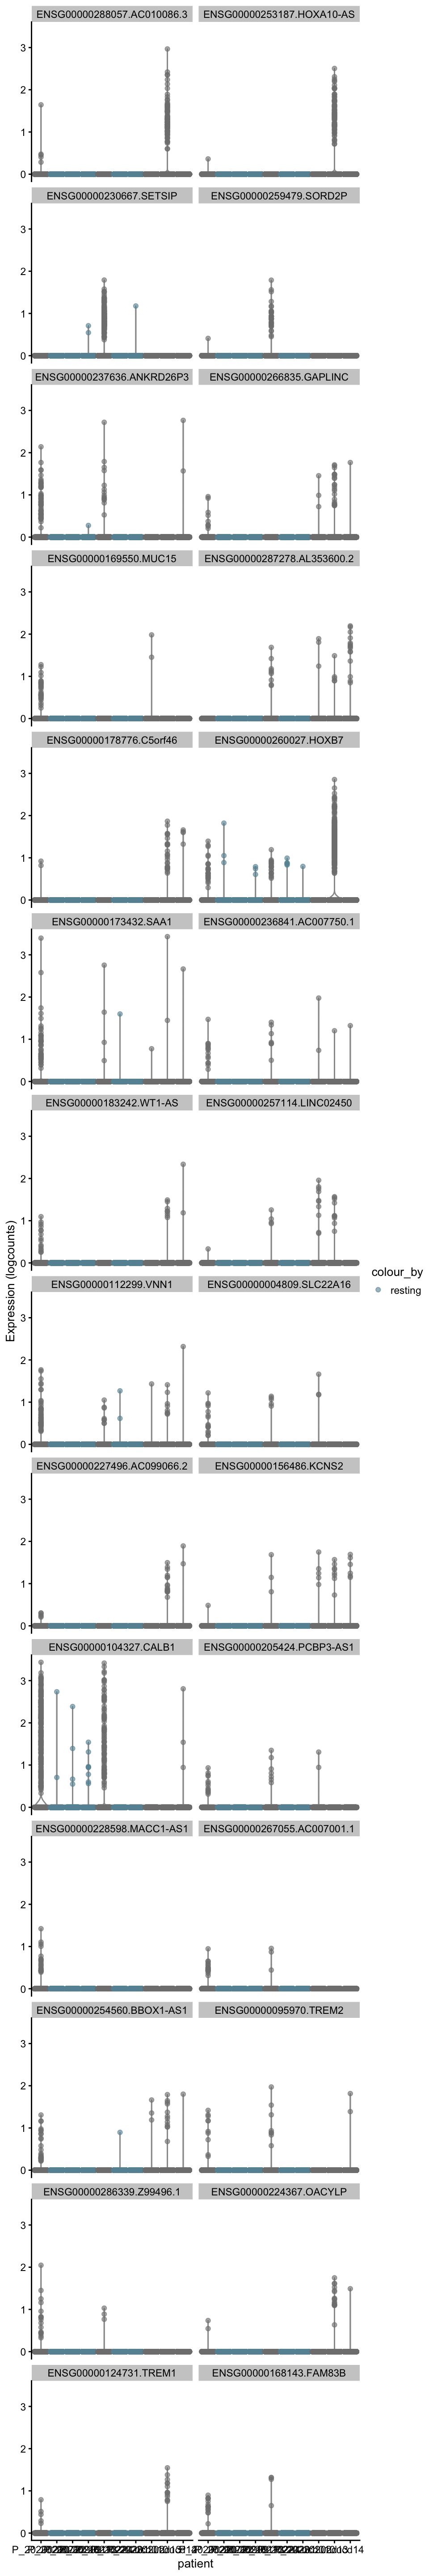
[[2]]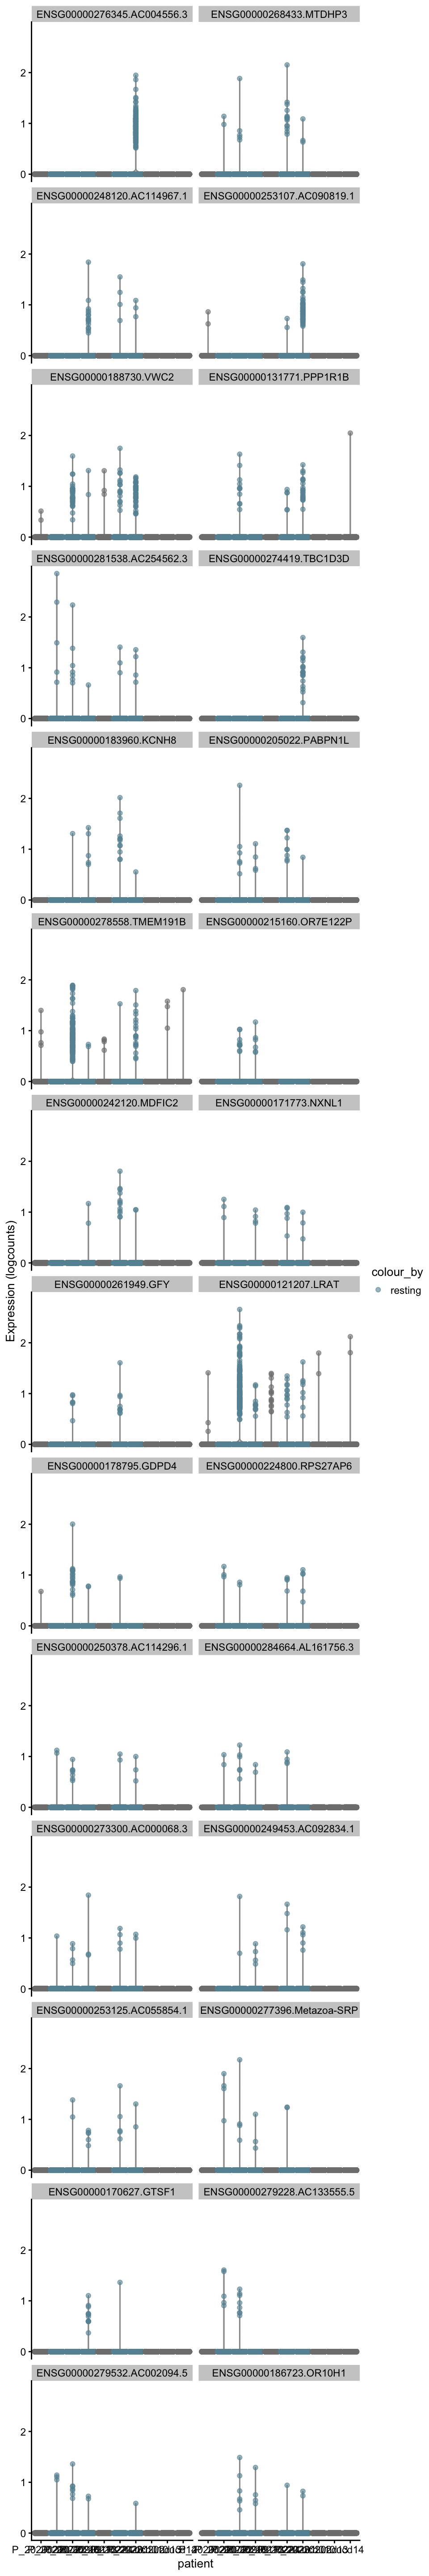
cw DE genes
cluVec <- unique(sce$integrated_snn_res.0.25)
lapply(cluVec, function(cl){
  sceSub <- sce[,which(sce$integrated_snn_res.0.25 == cl)]
  m.out <- scoreMarkers(sceSub, sceSub$cond2)
  condVec <- unique(names(m.out))
  lapply(condVec, function(co){
    outSub <- data.frame(m.out@listData[[co]]) %>%
      rownames_to_column(var = "gene") %>%
      slice_max(., order_by=mean.AUC, n=26)
    plotExpression(sceSub, features=outSub$gene,
      x="patient", colour_by="cond2") +
      scale_color_manual(values = colCond2)
  })
})
[[1]]
[[1]][[1]]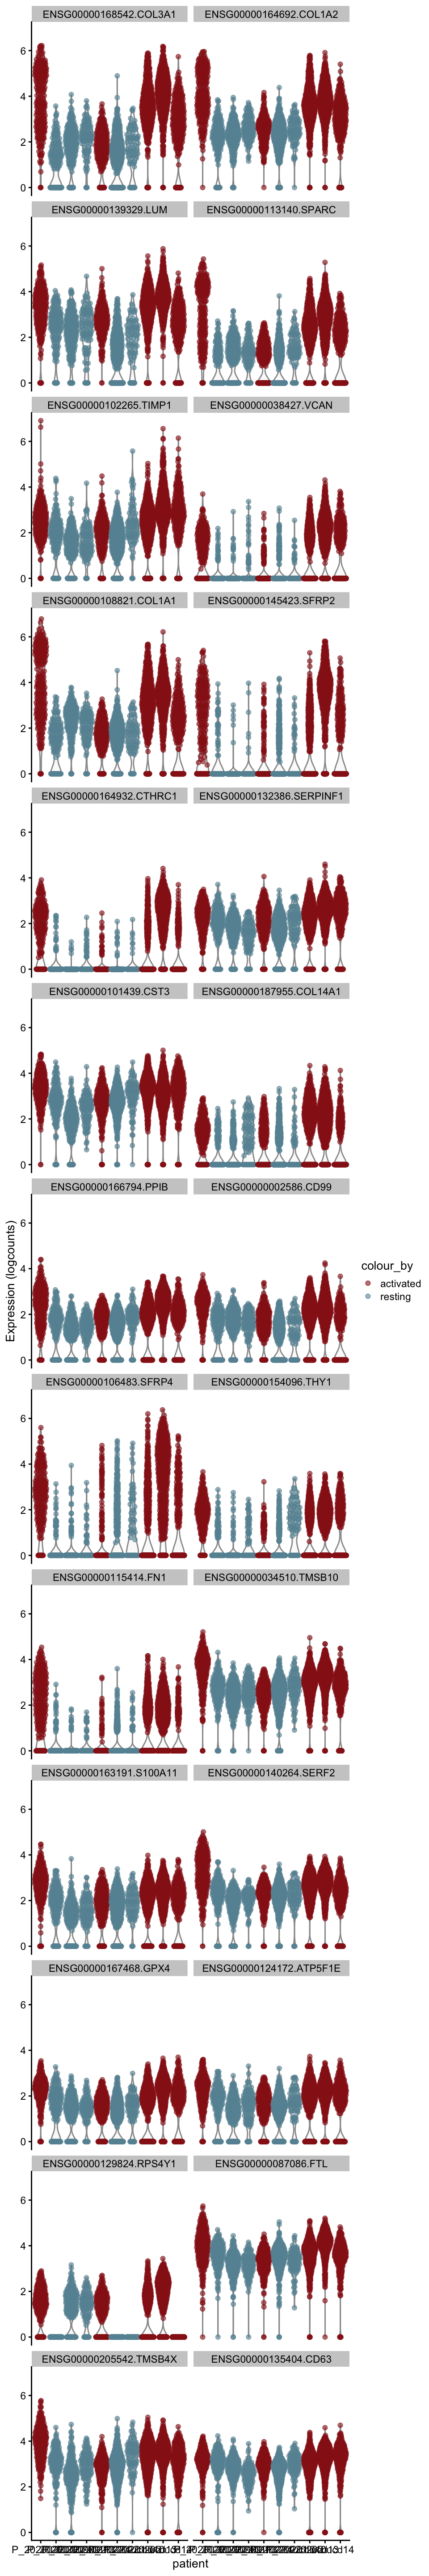
[[1]][[2]]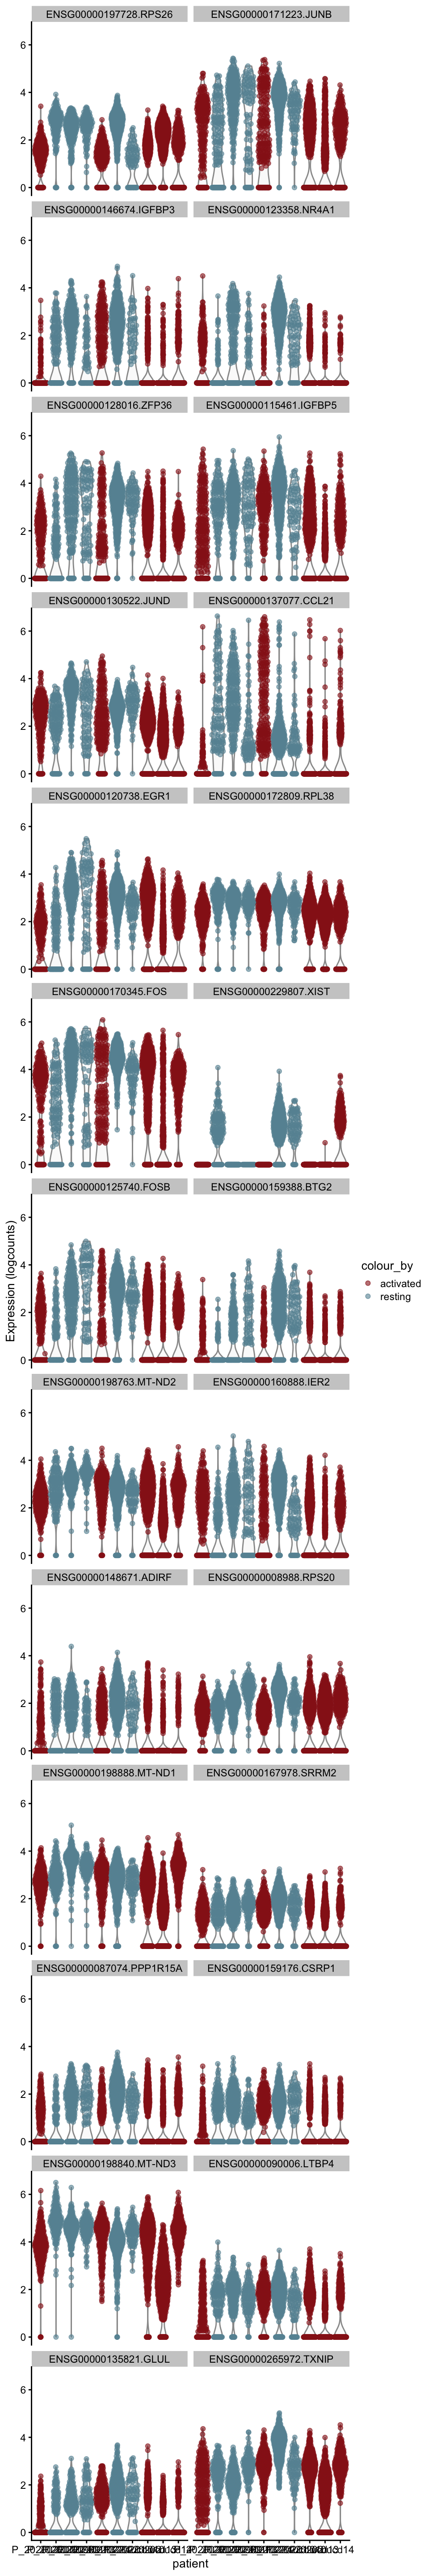
[[2]]
[[2]][[1]]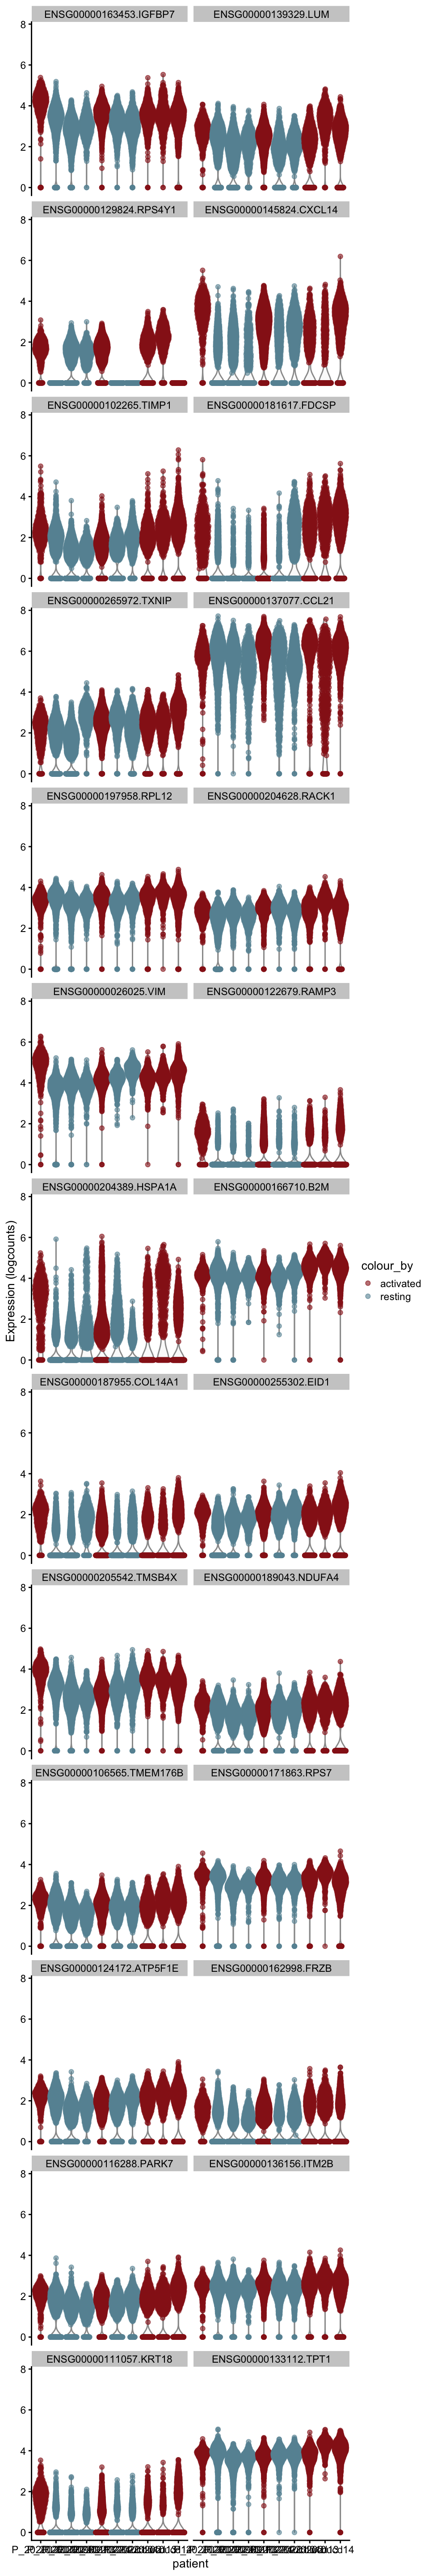
[[2]][[2]]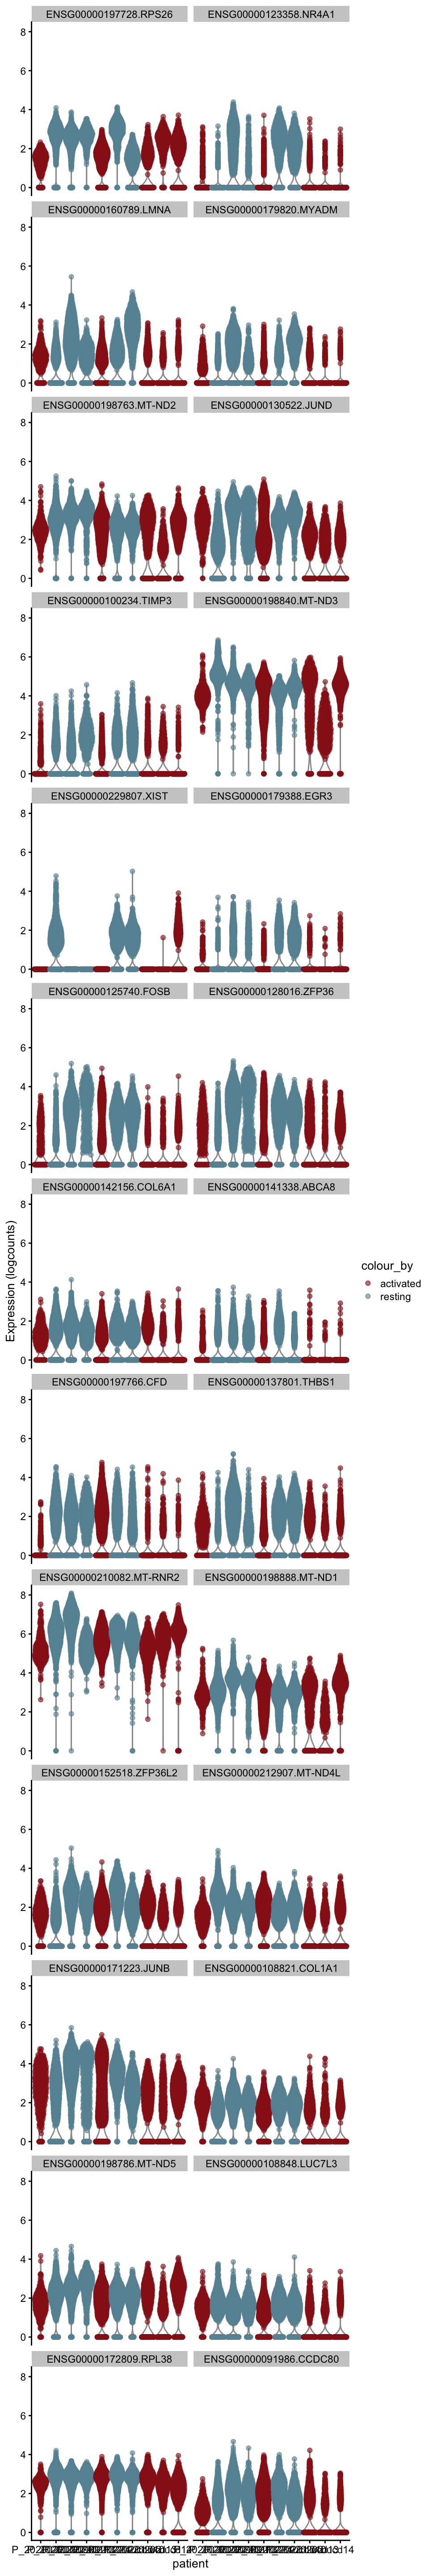
[[3]]
[[3]][[1]]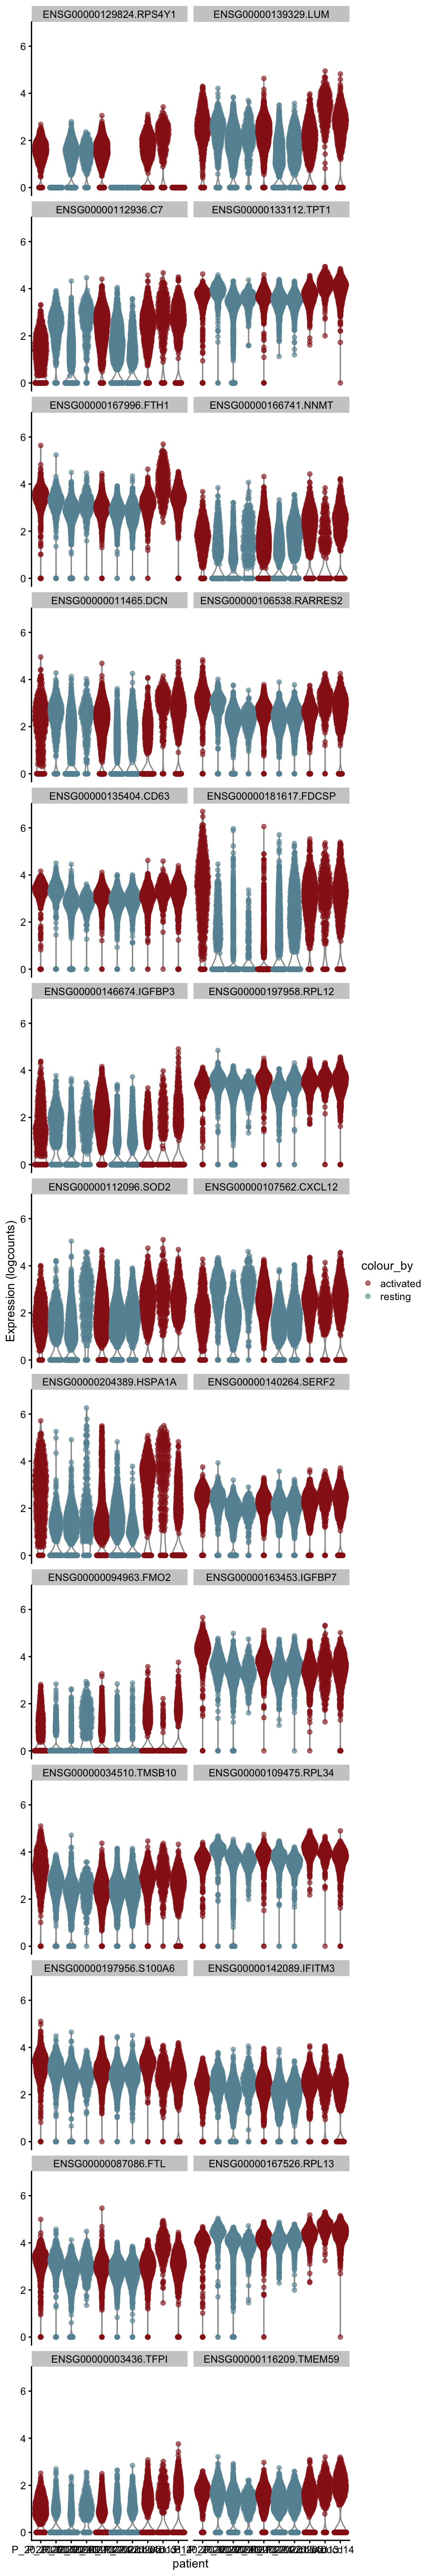
[[3]][[2]]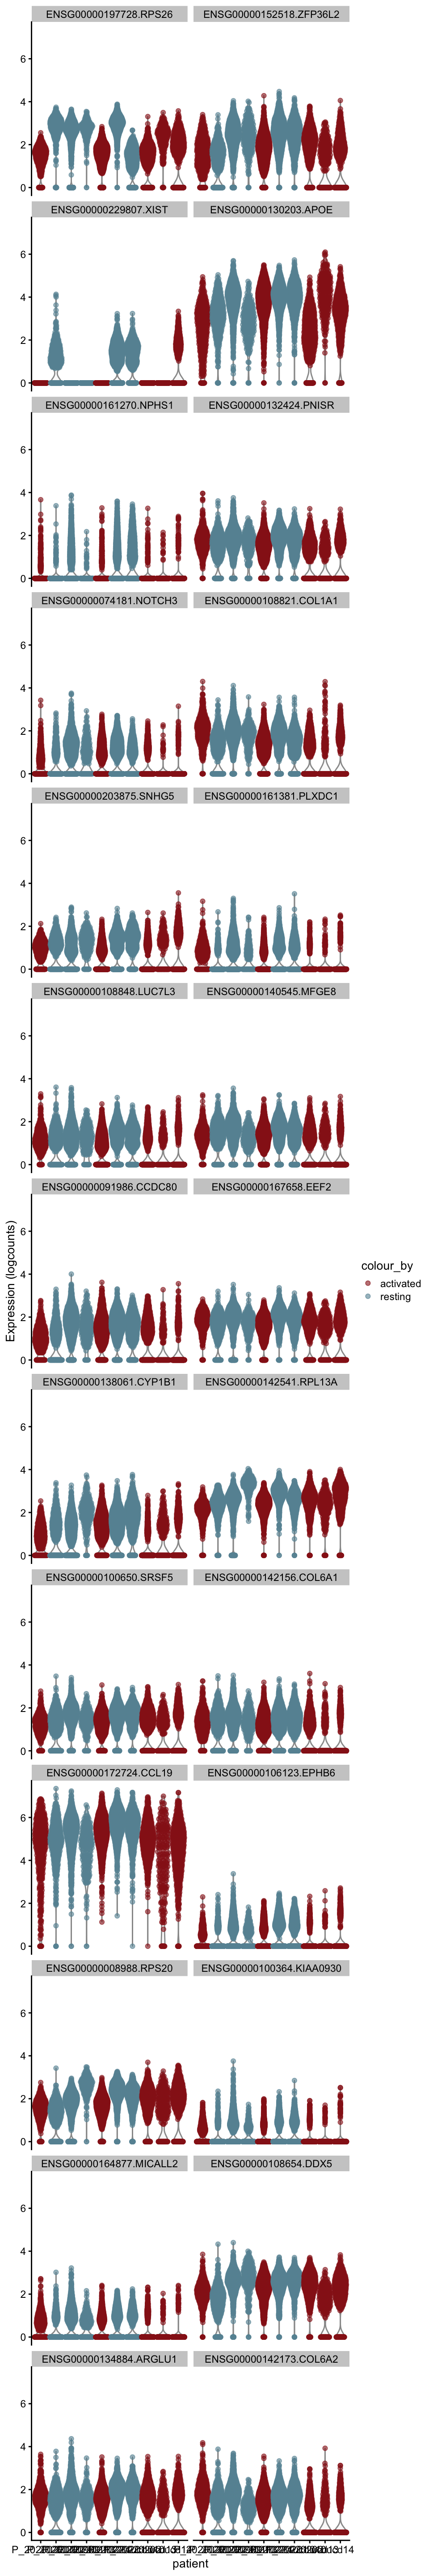
[[4]]
[[4]][[1]]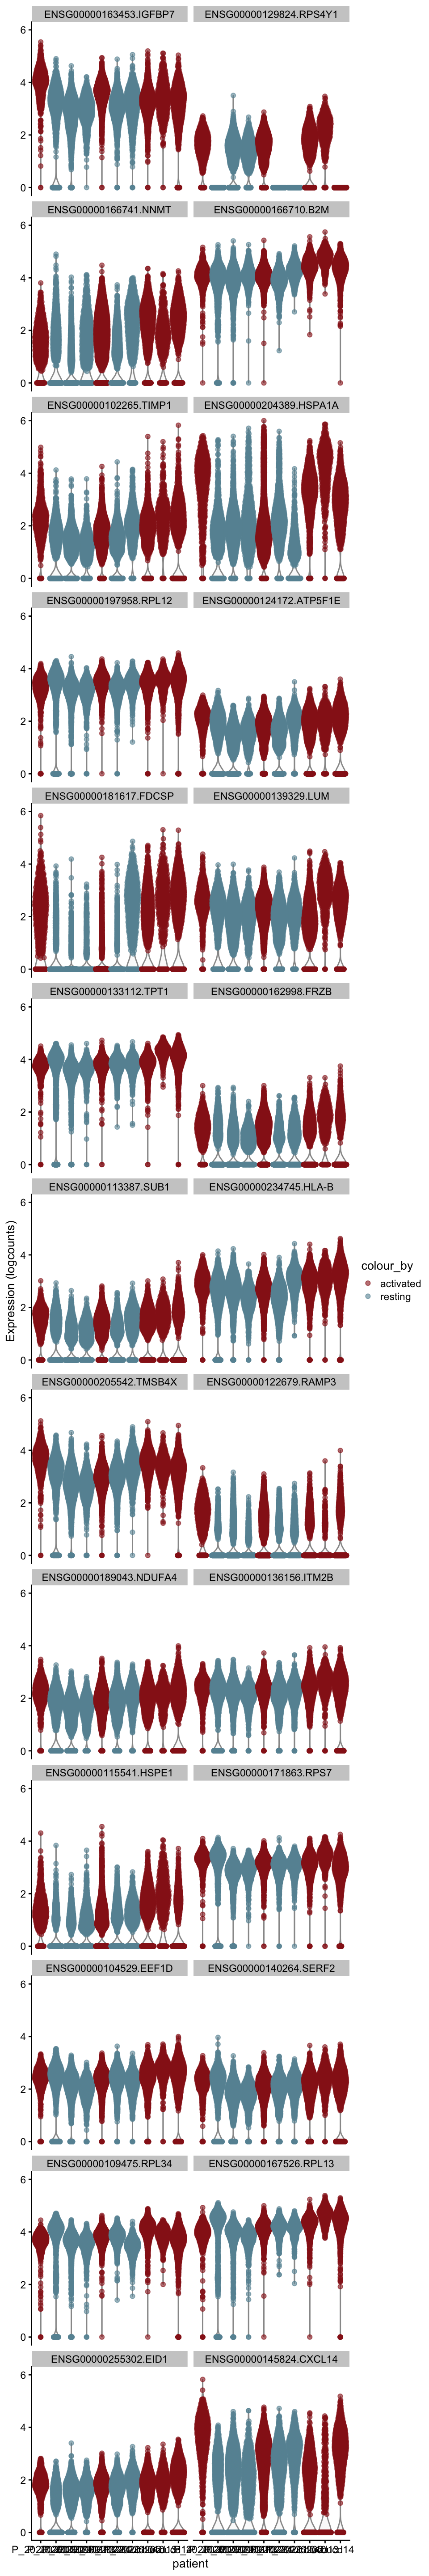
[[4]][[2]]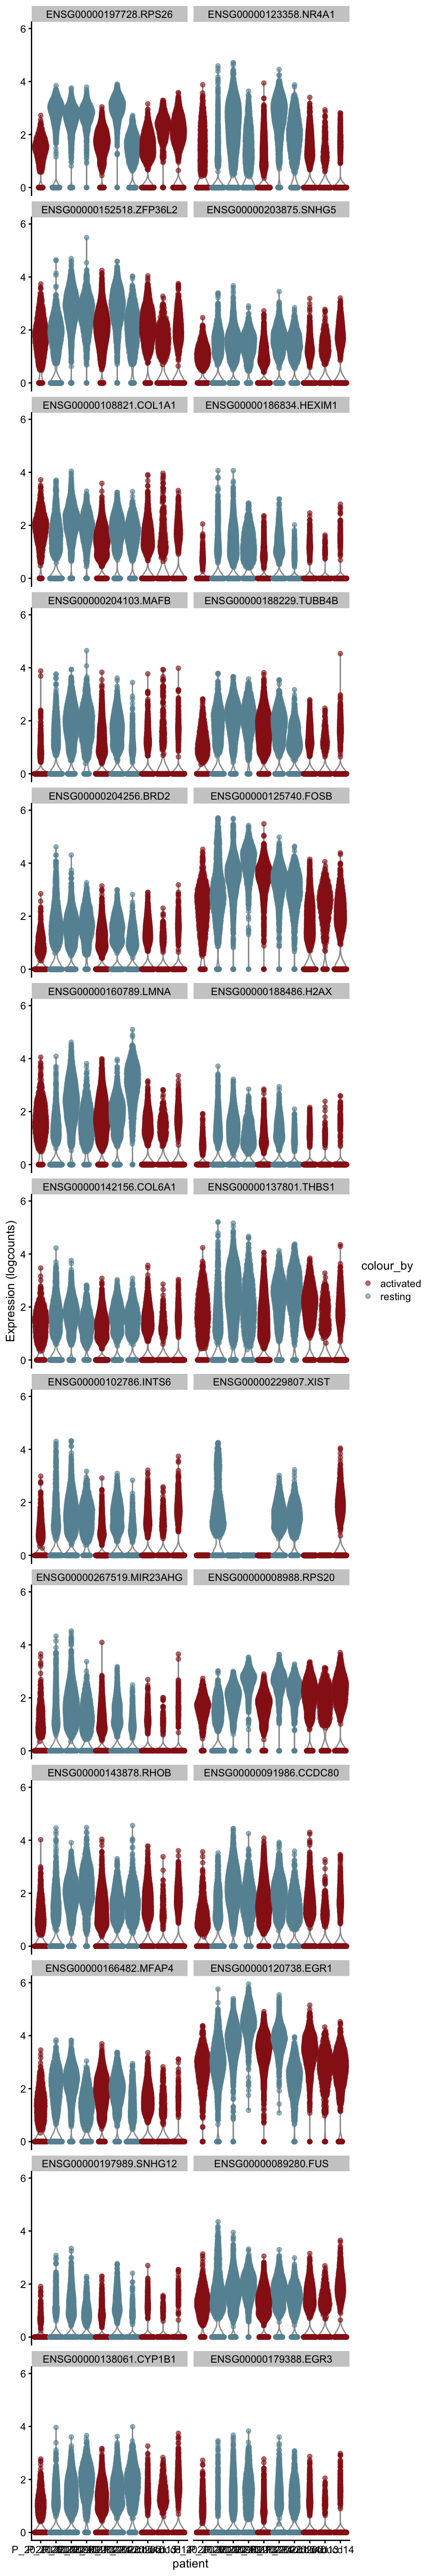
[[5]]
[[5]][[1]]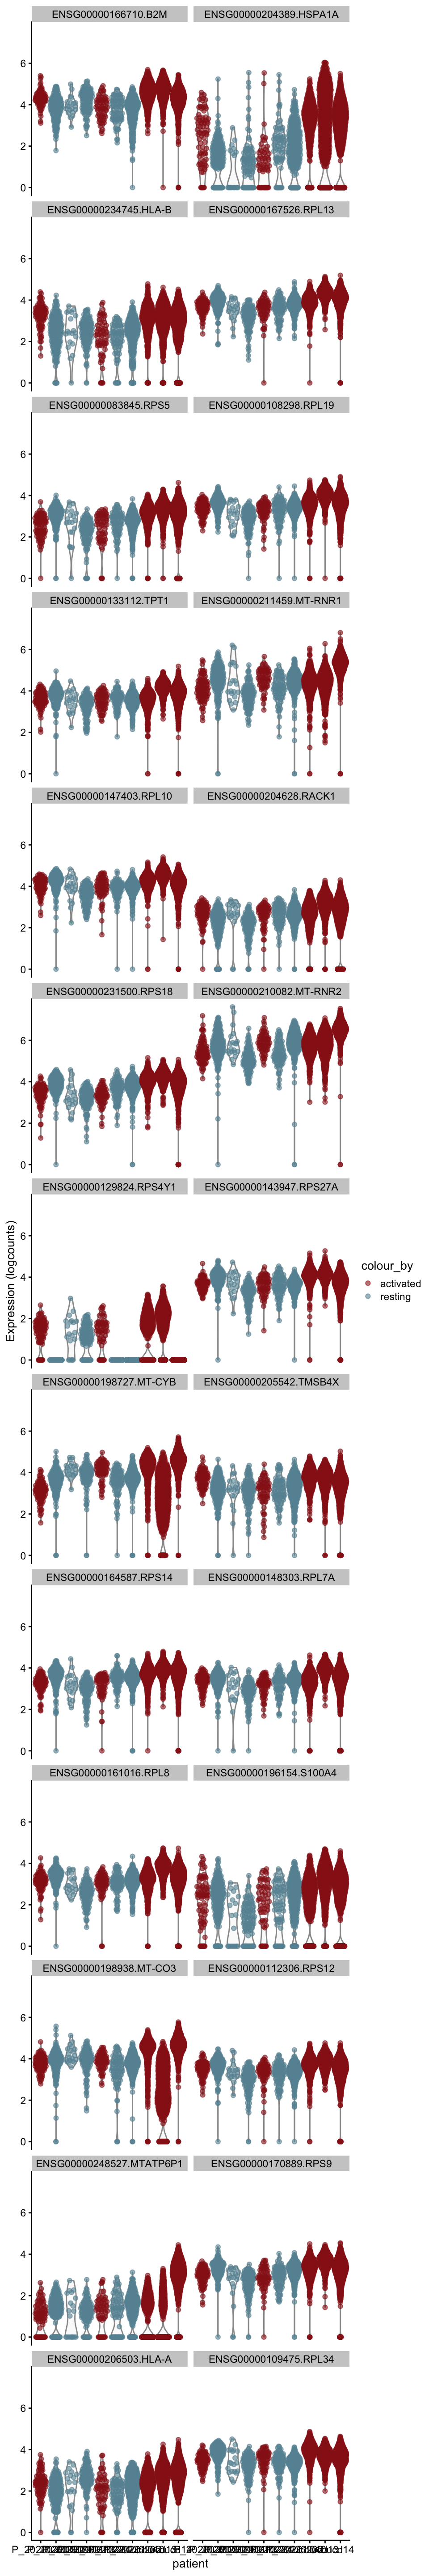
[[5]][[2]]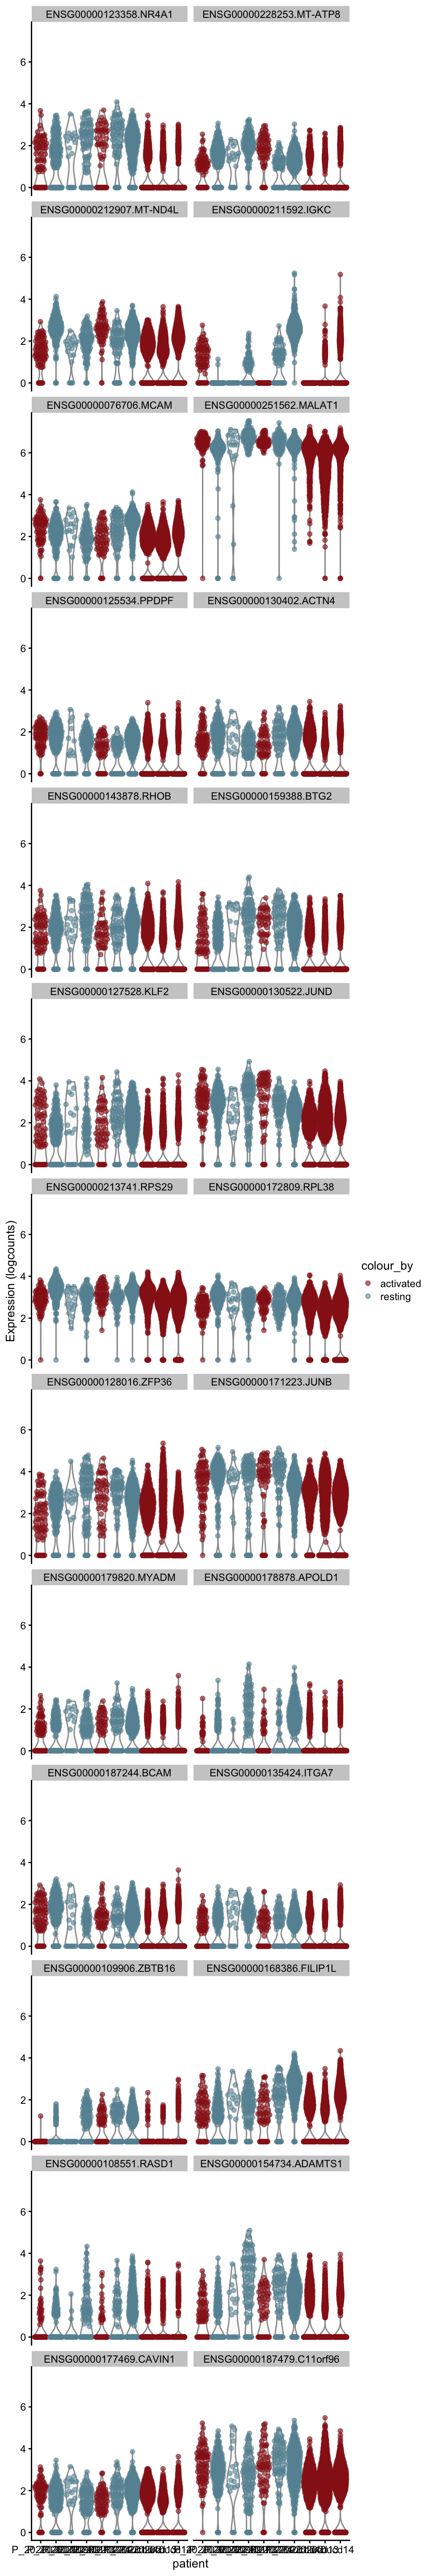
[[6]]
[[6]][[1]]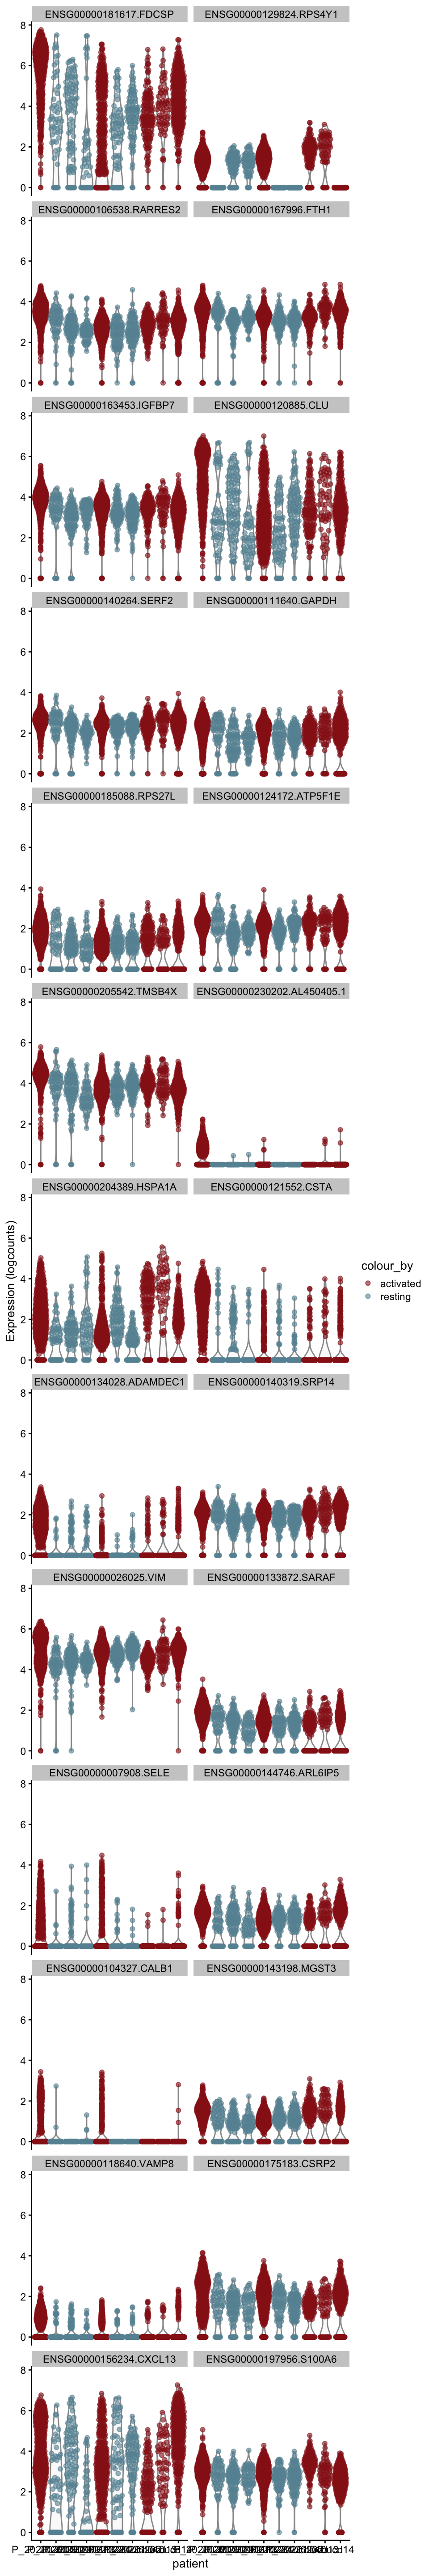
[[6]][[2]]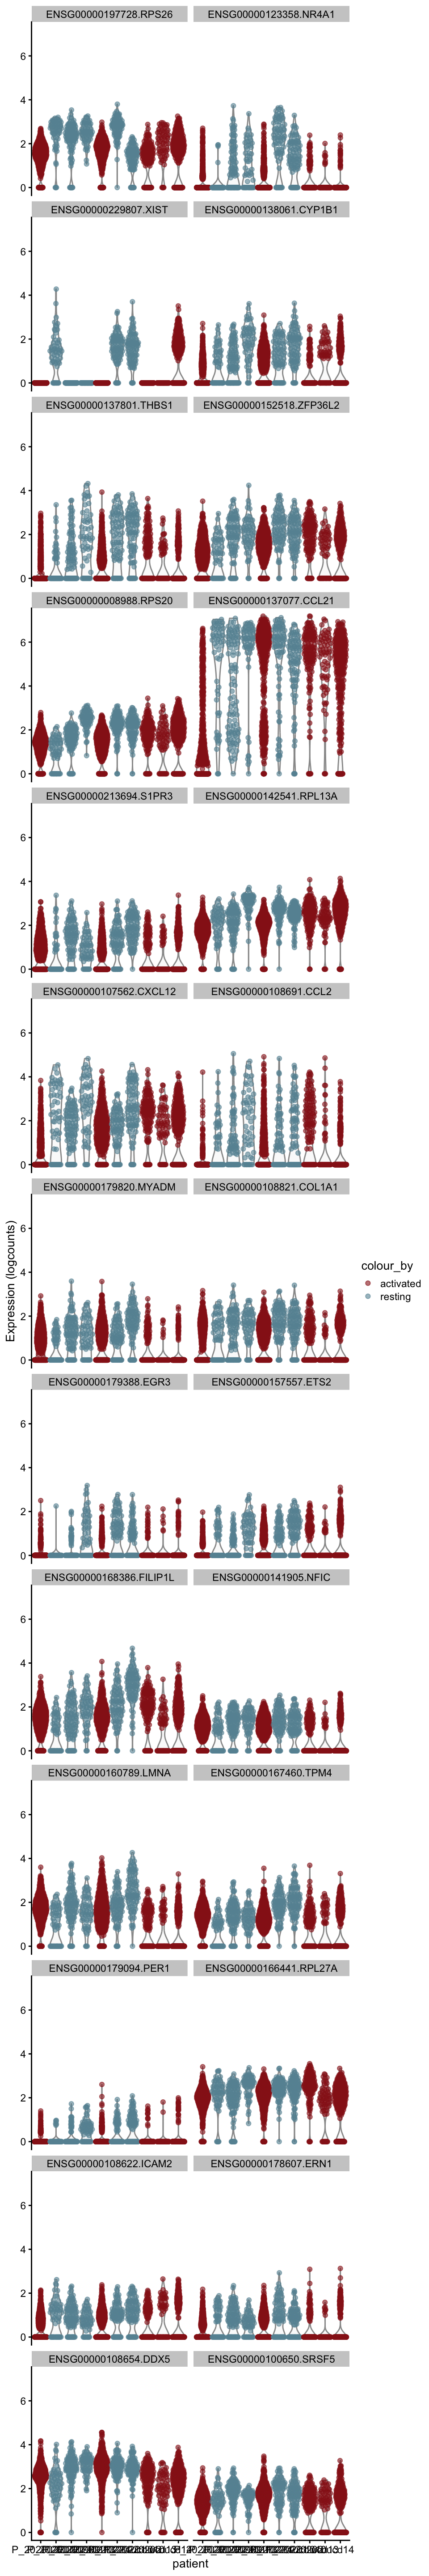
[[7]]
[[7]][[1]]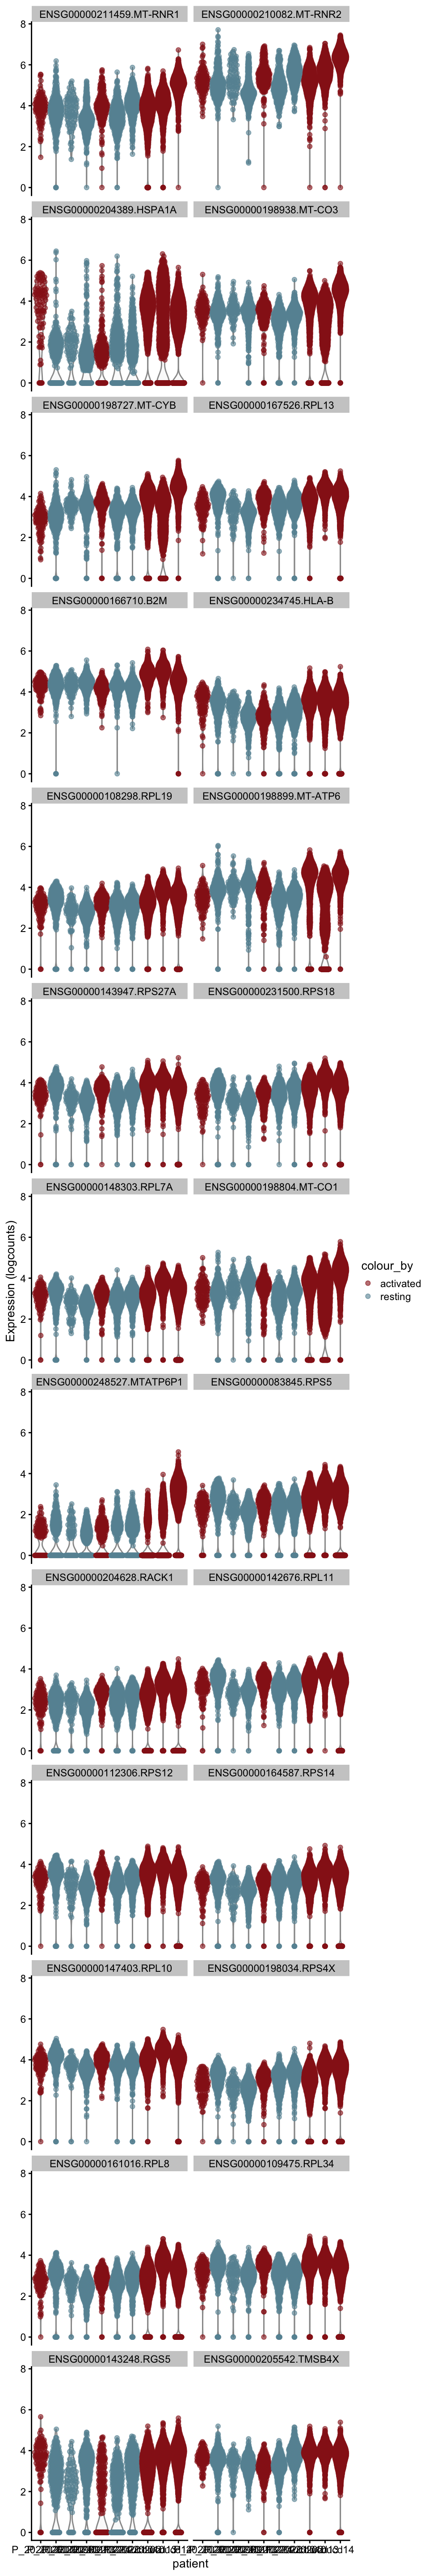
[[7]][[2]]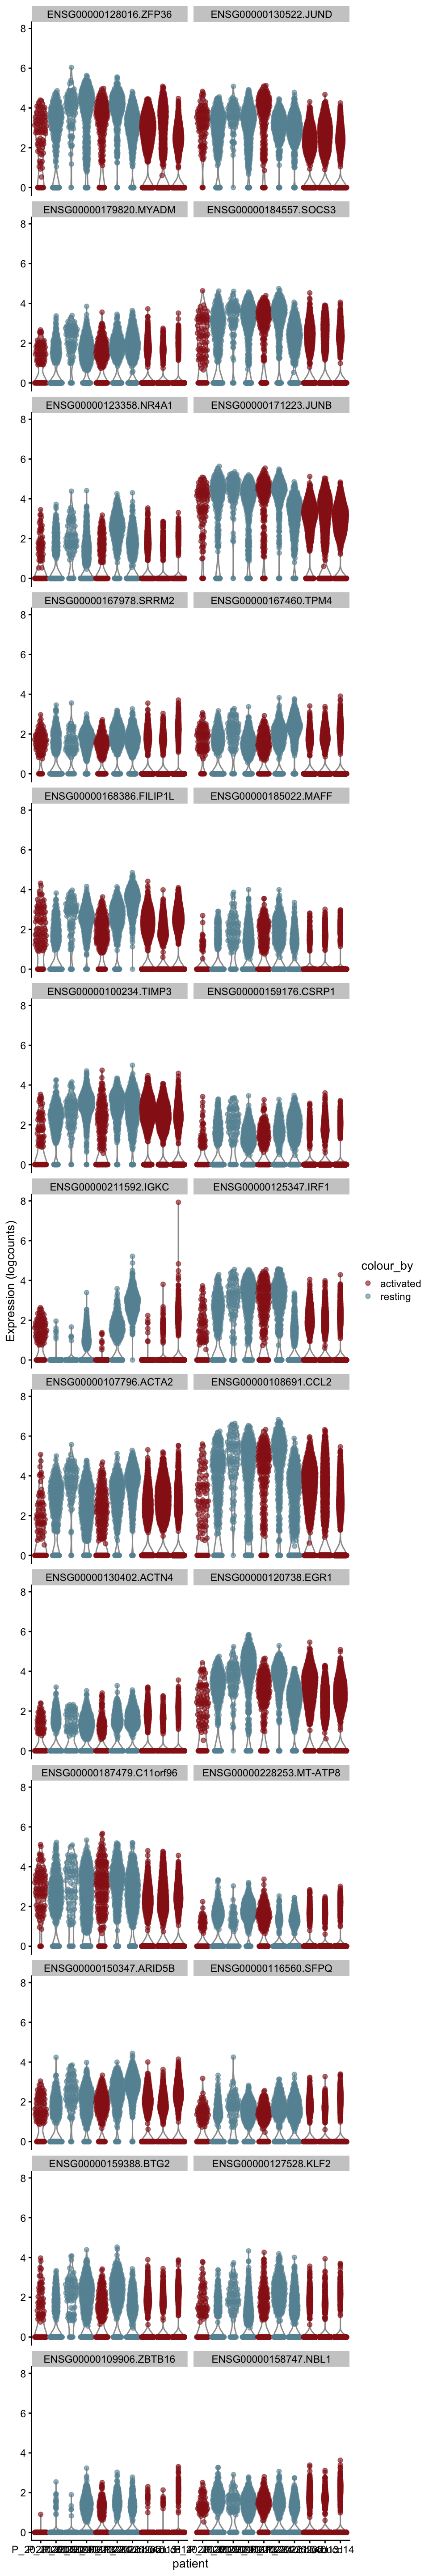
[[8]]
[[8]][[1]]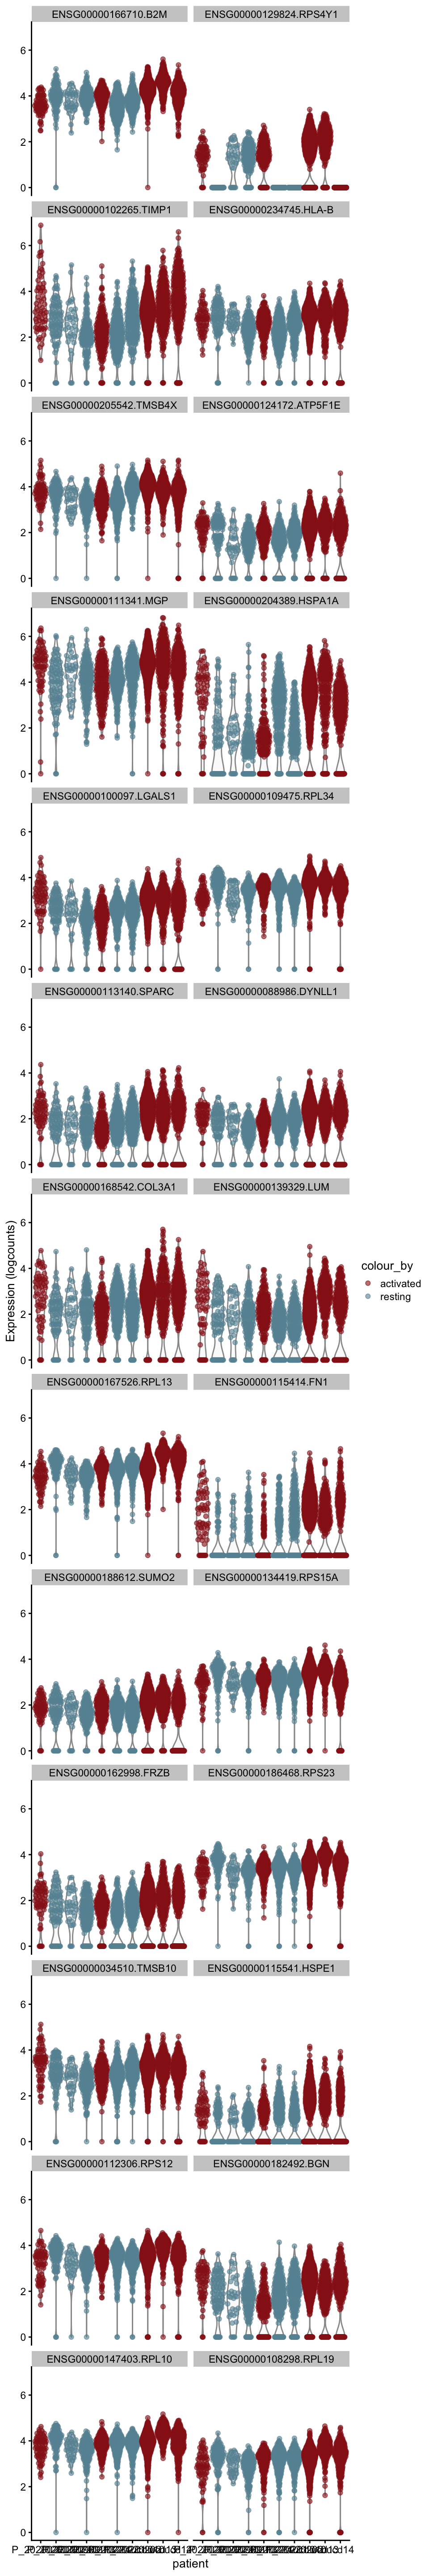
[[8]][[2]]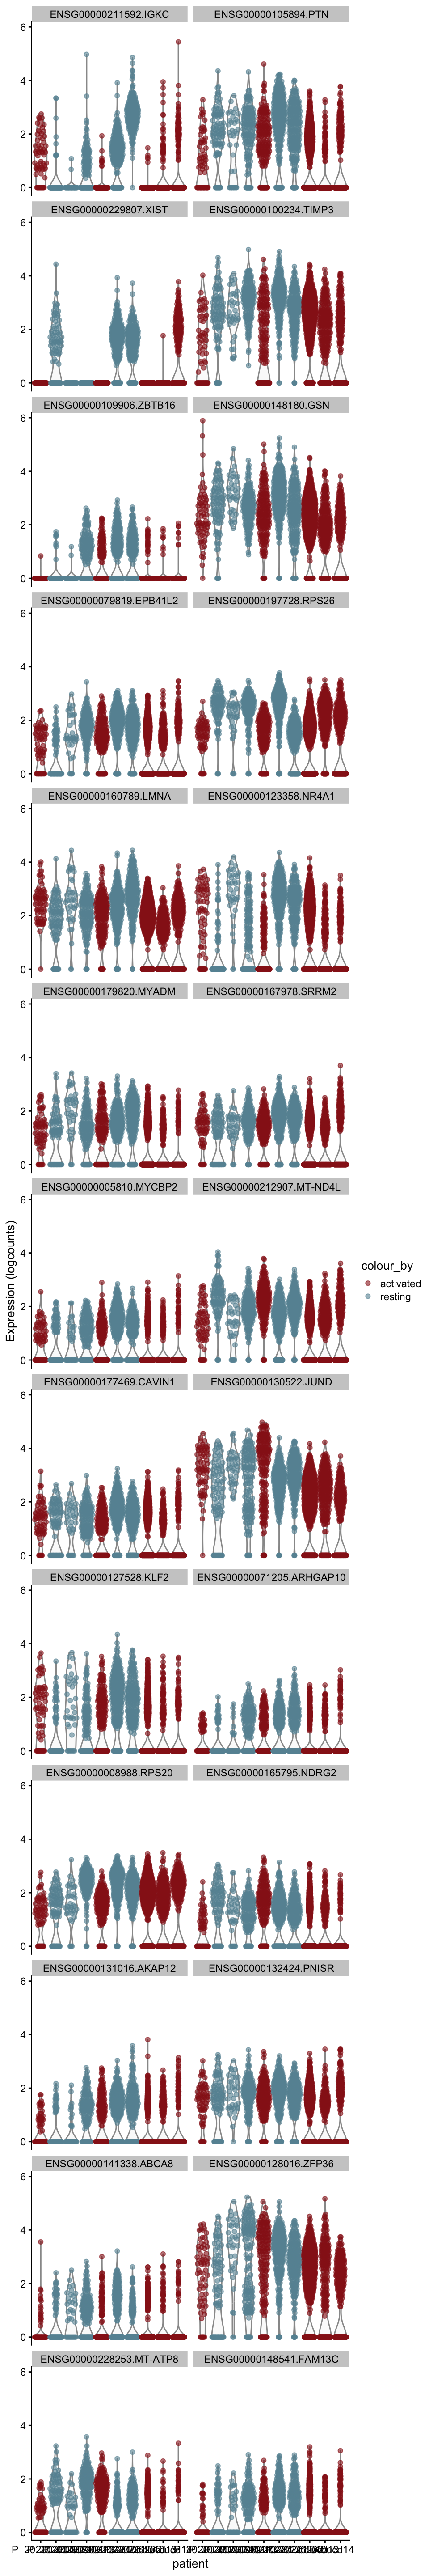
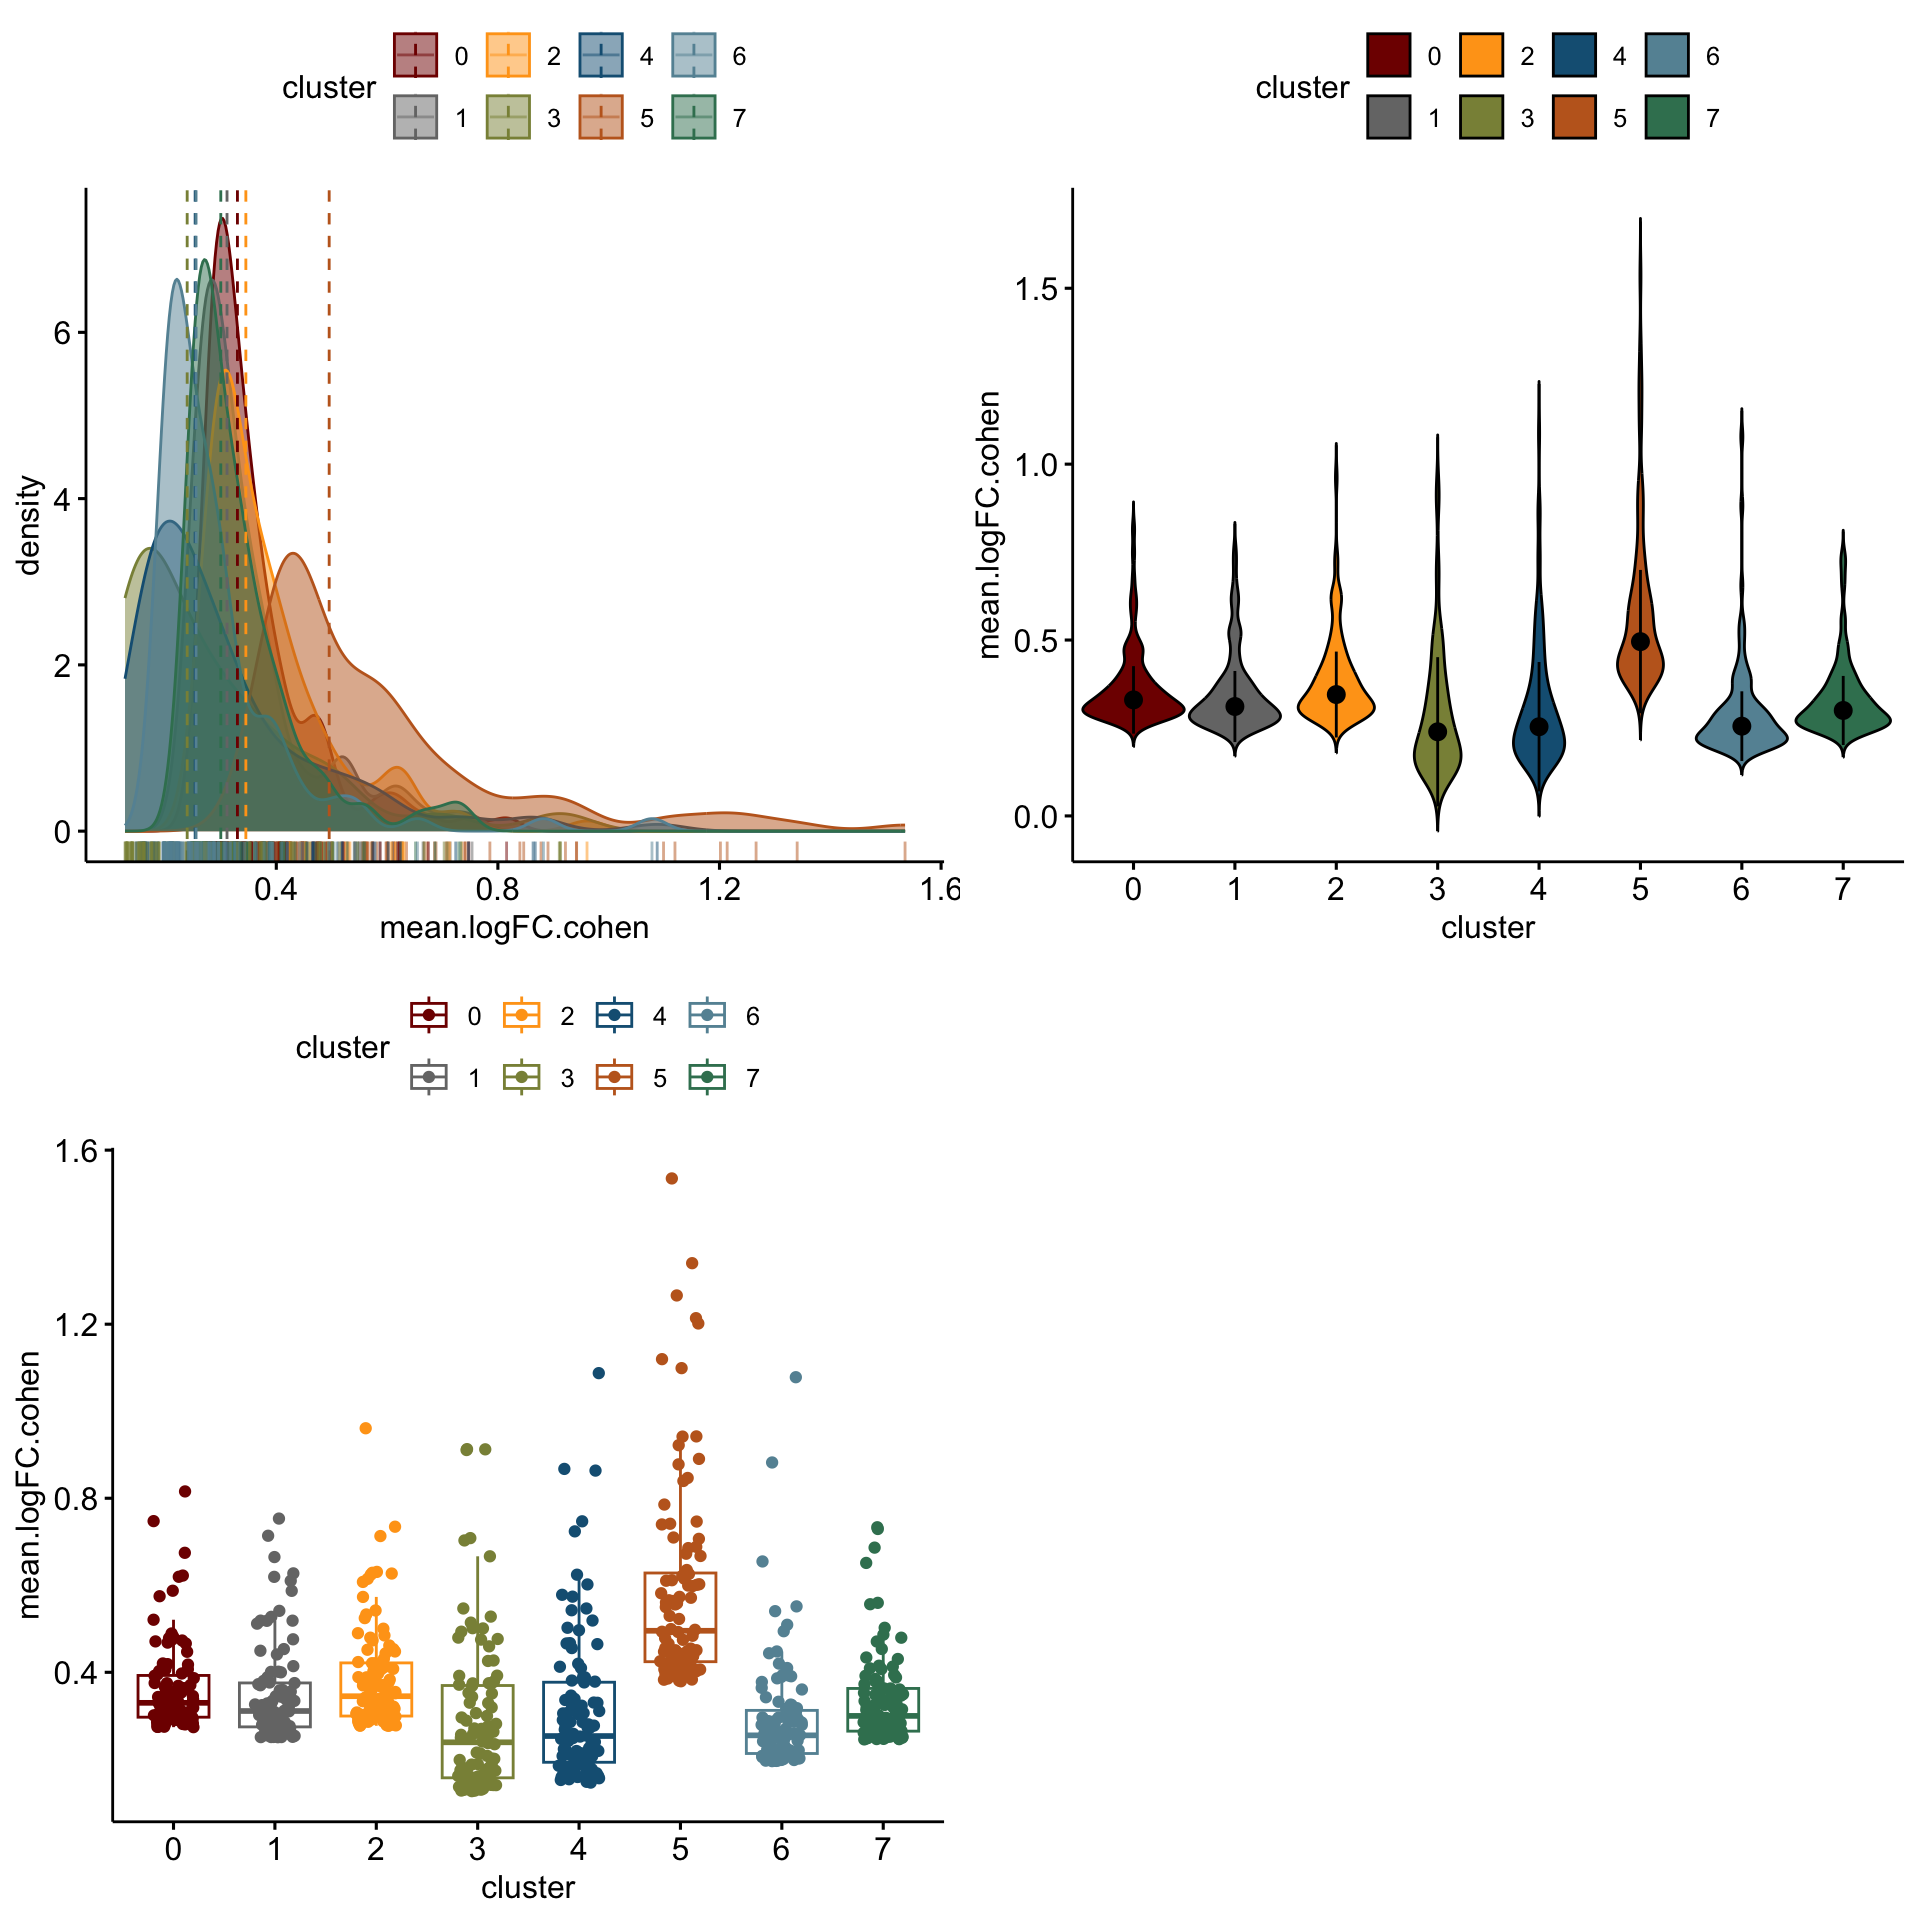
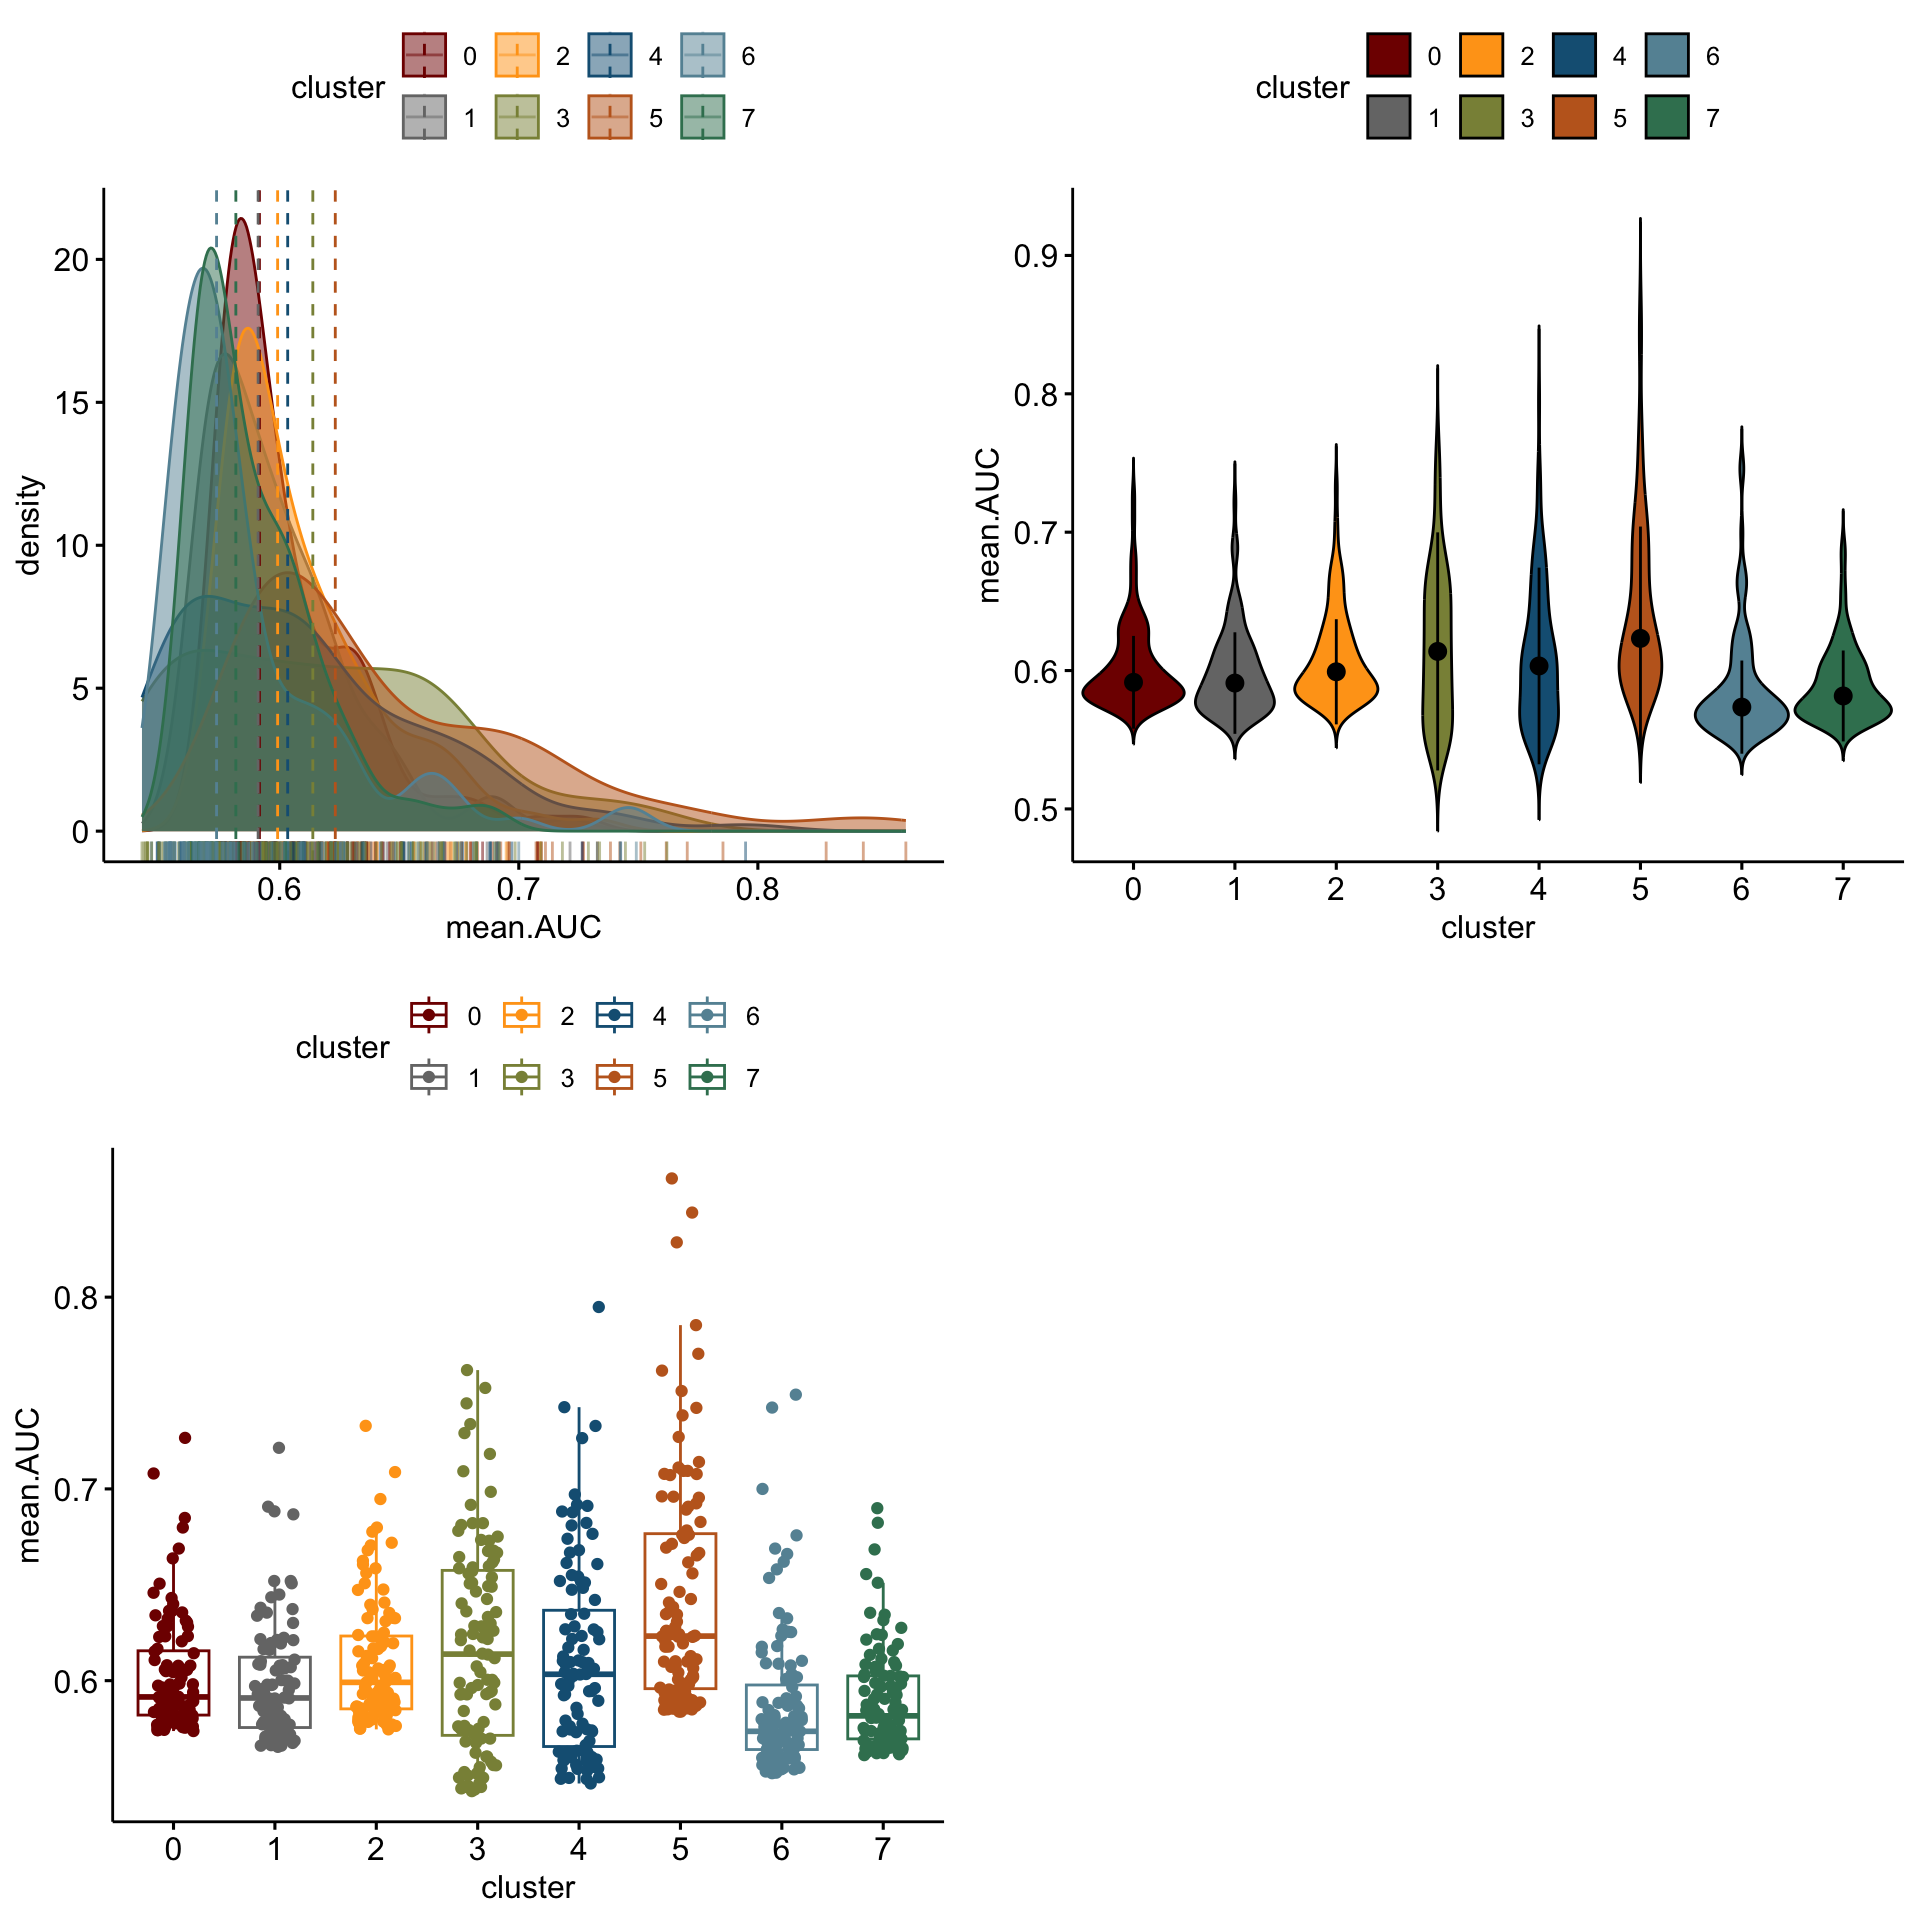
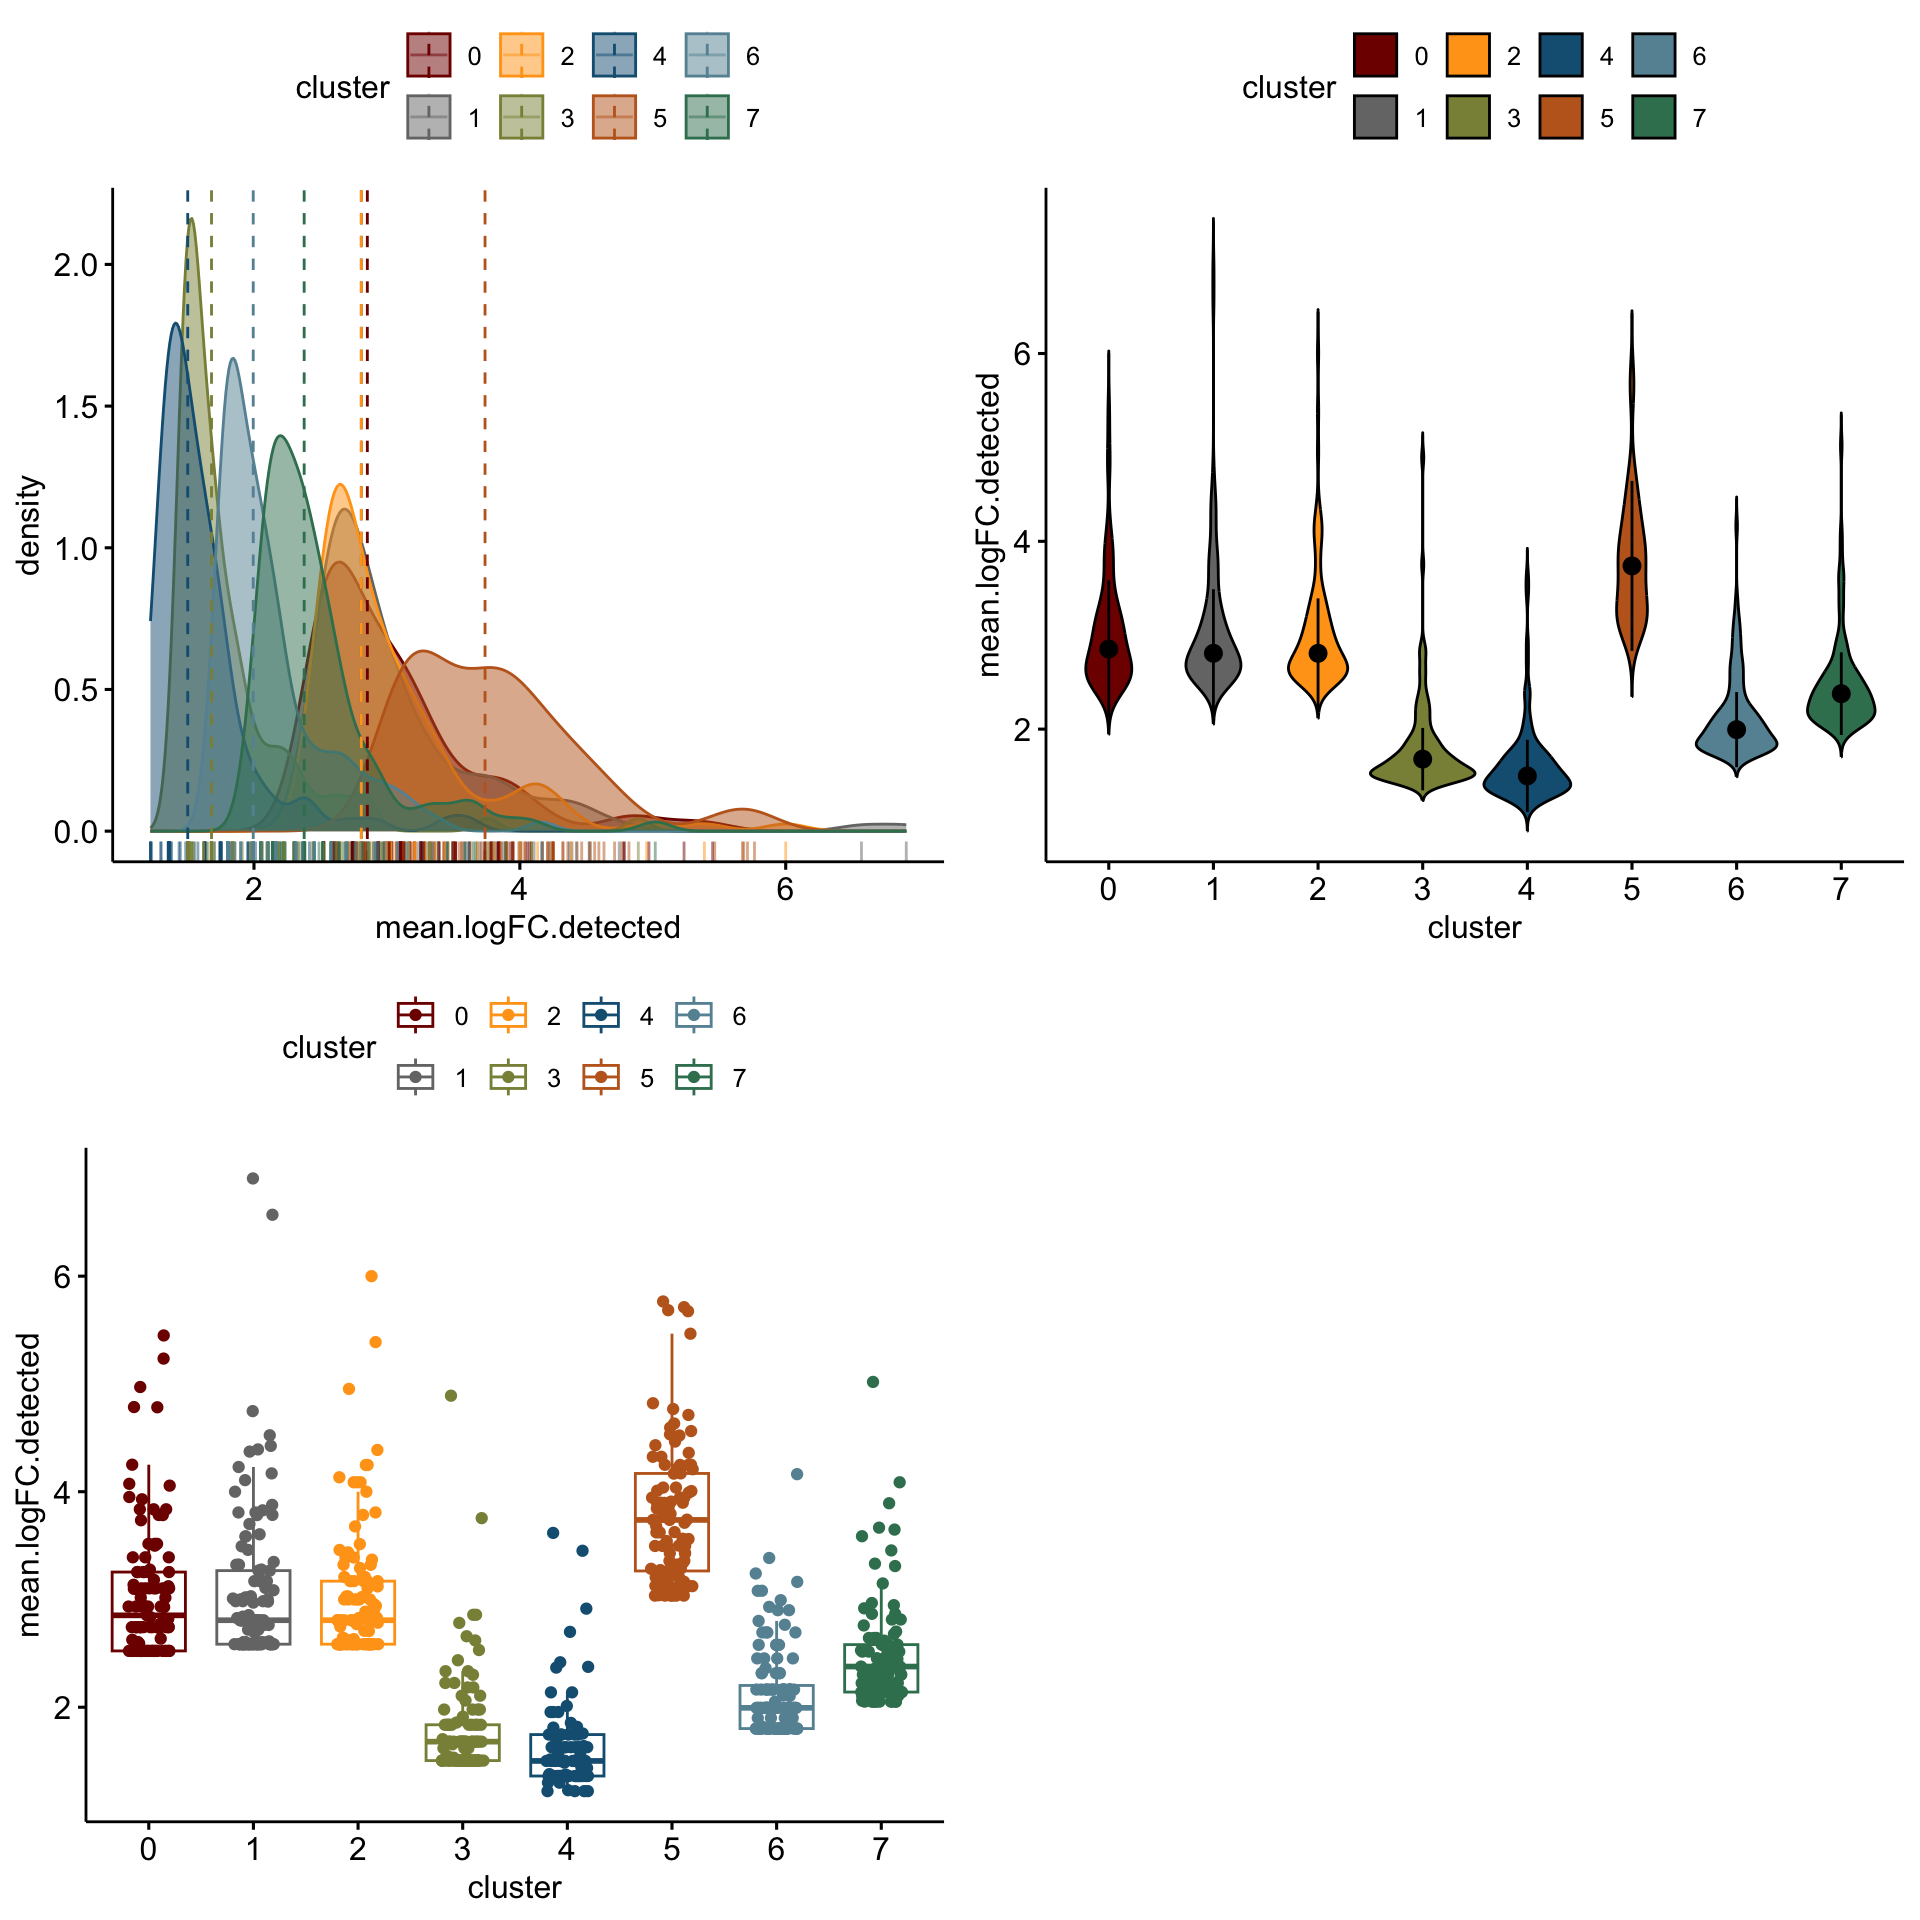
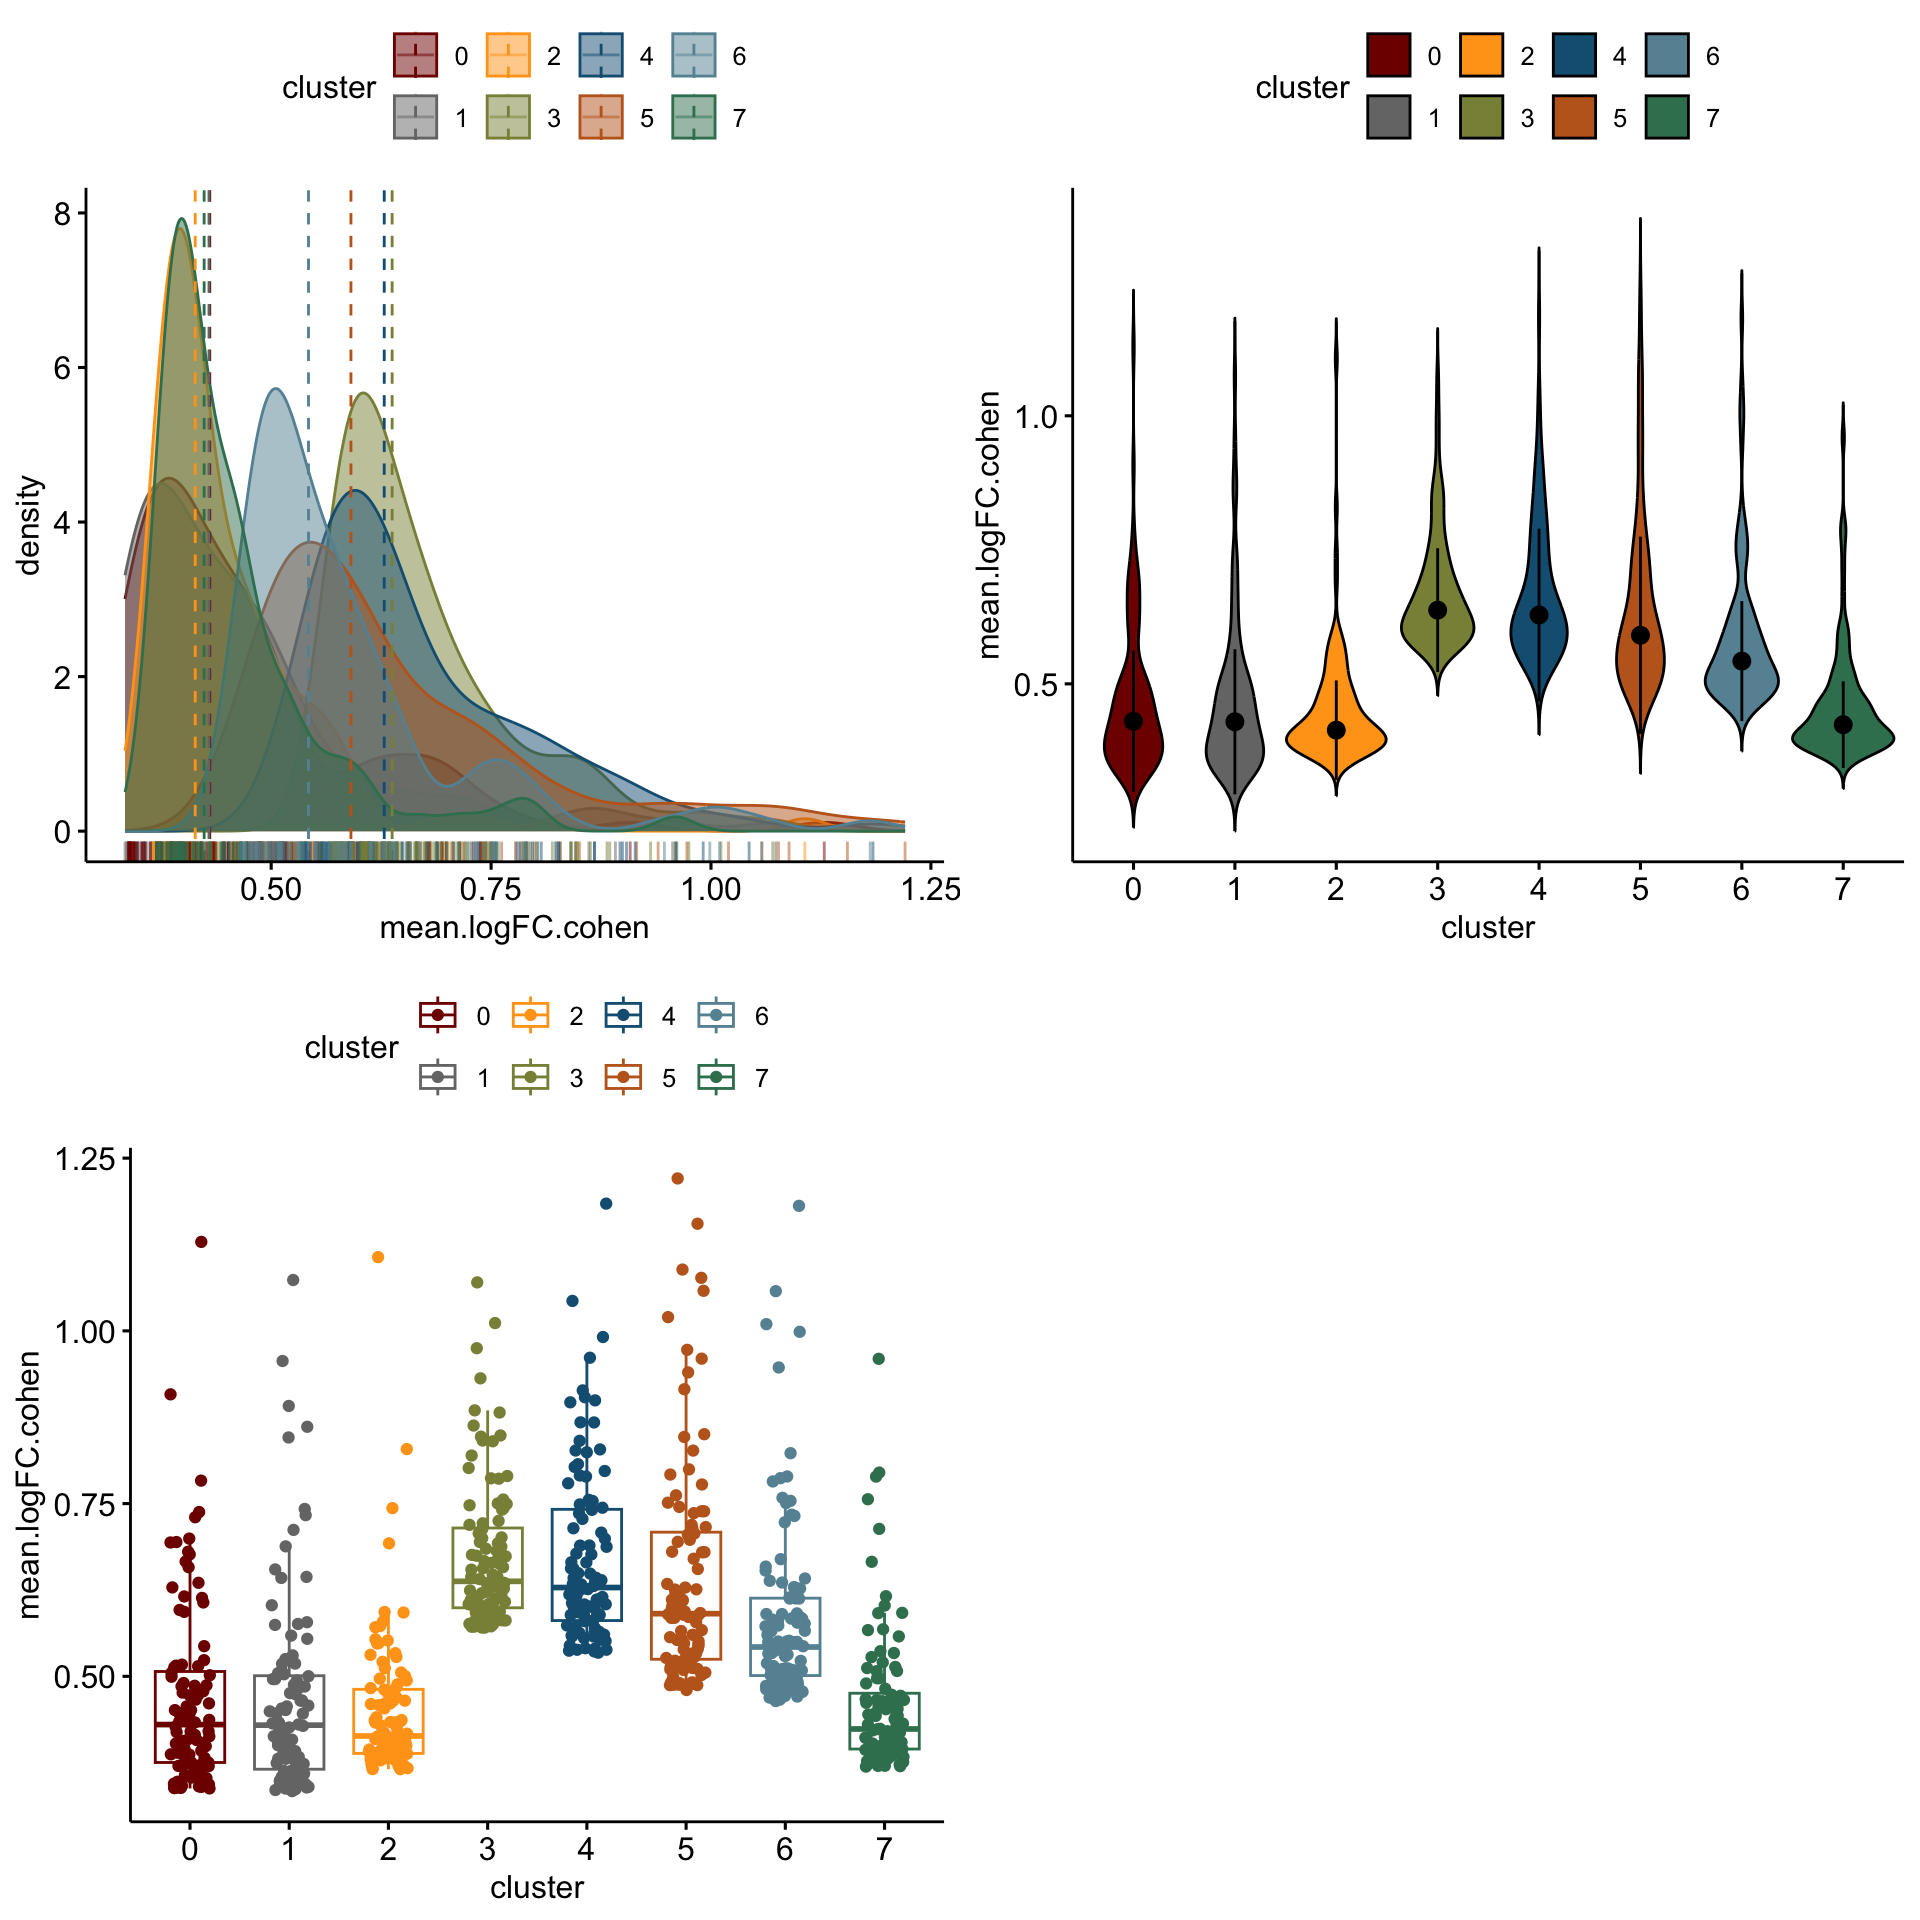
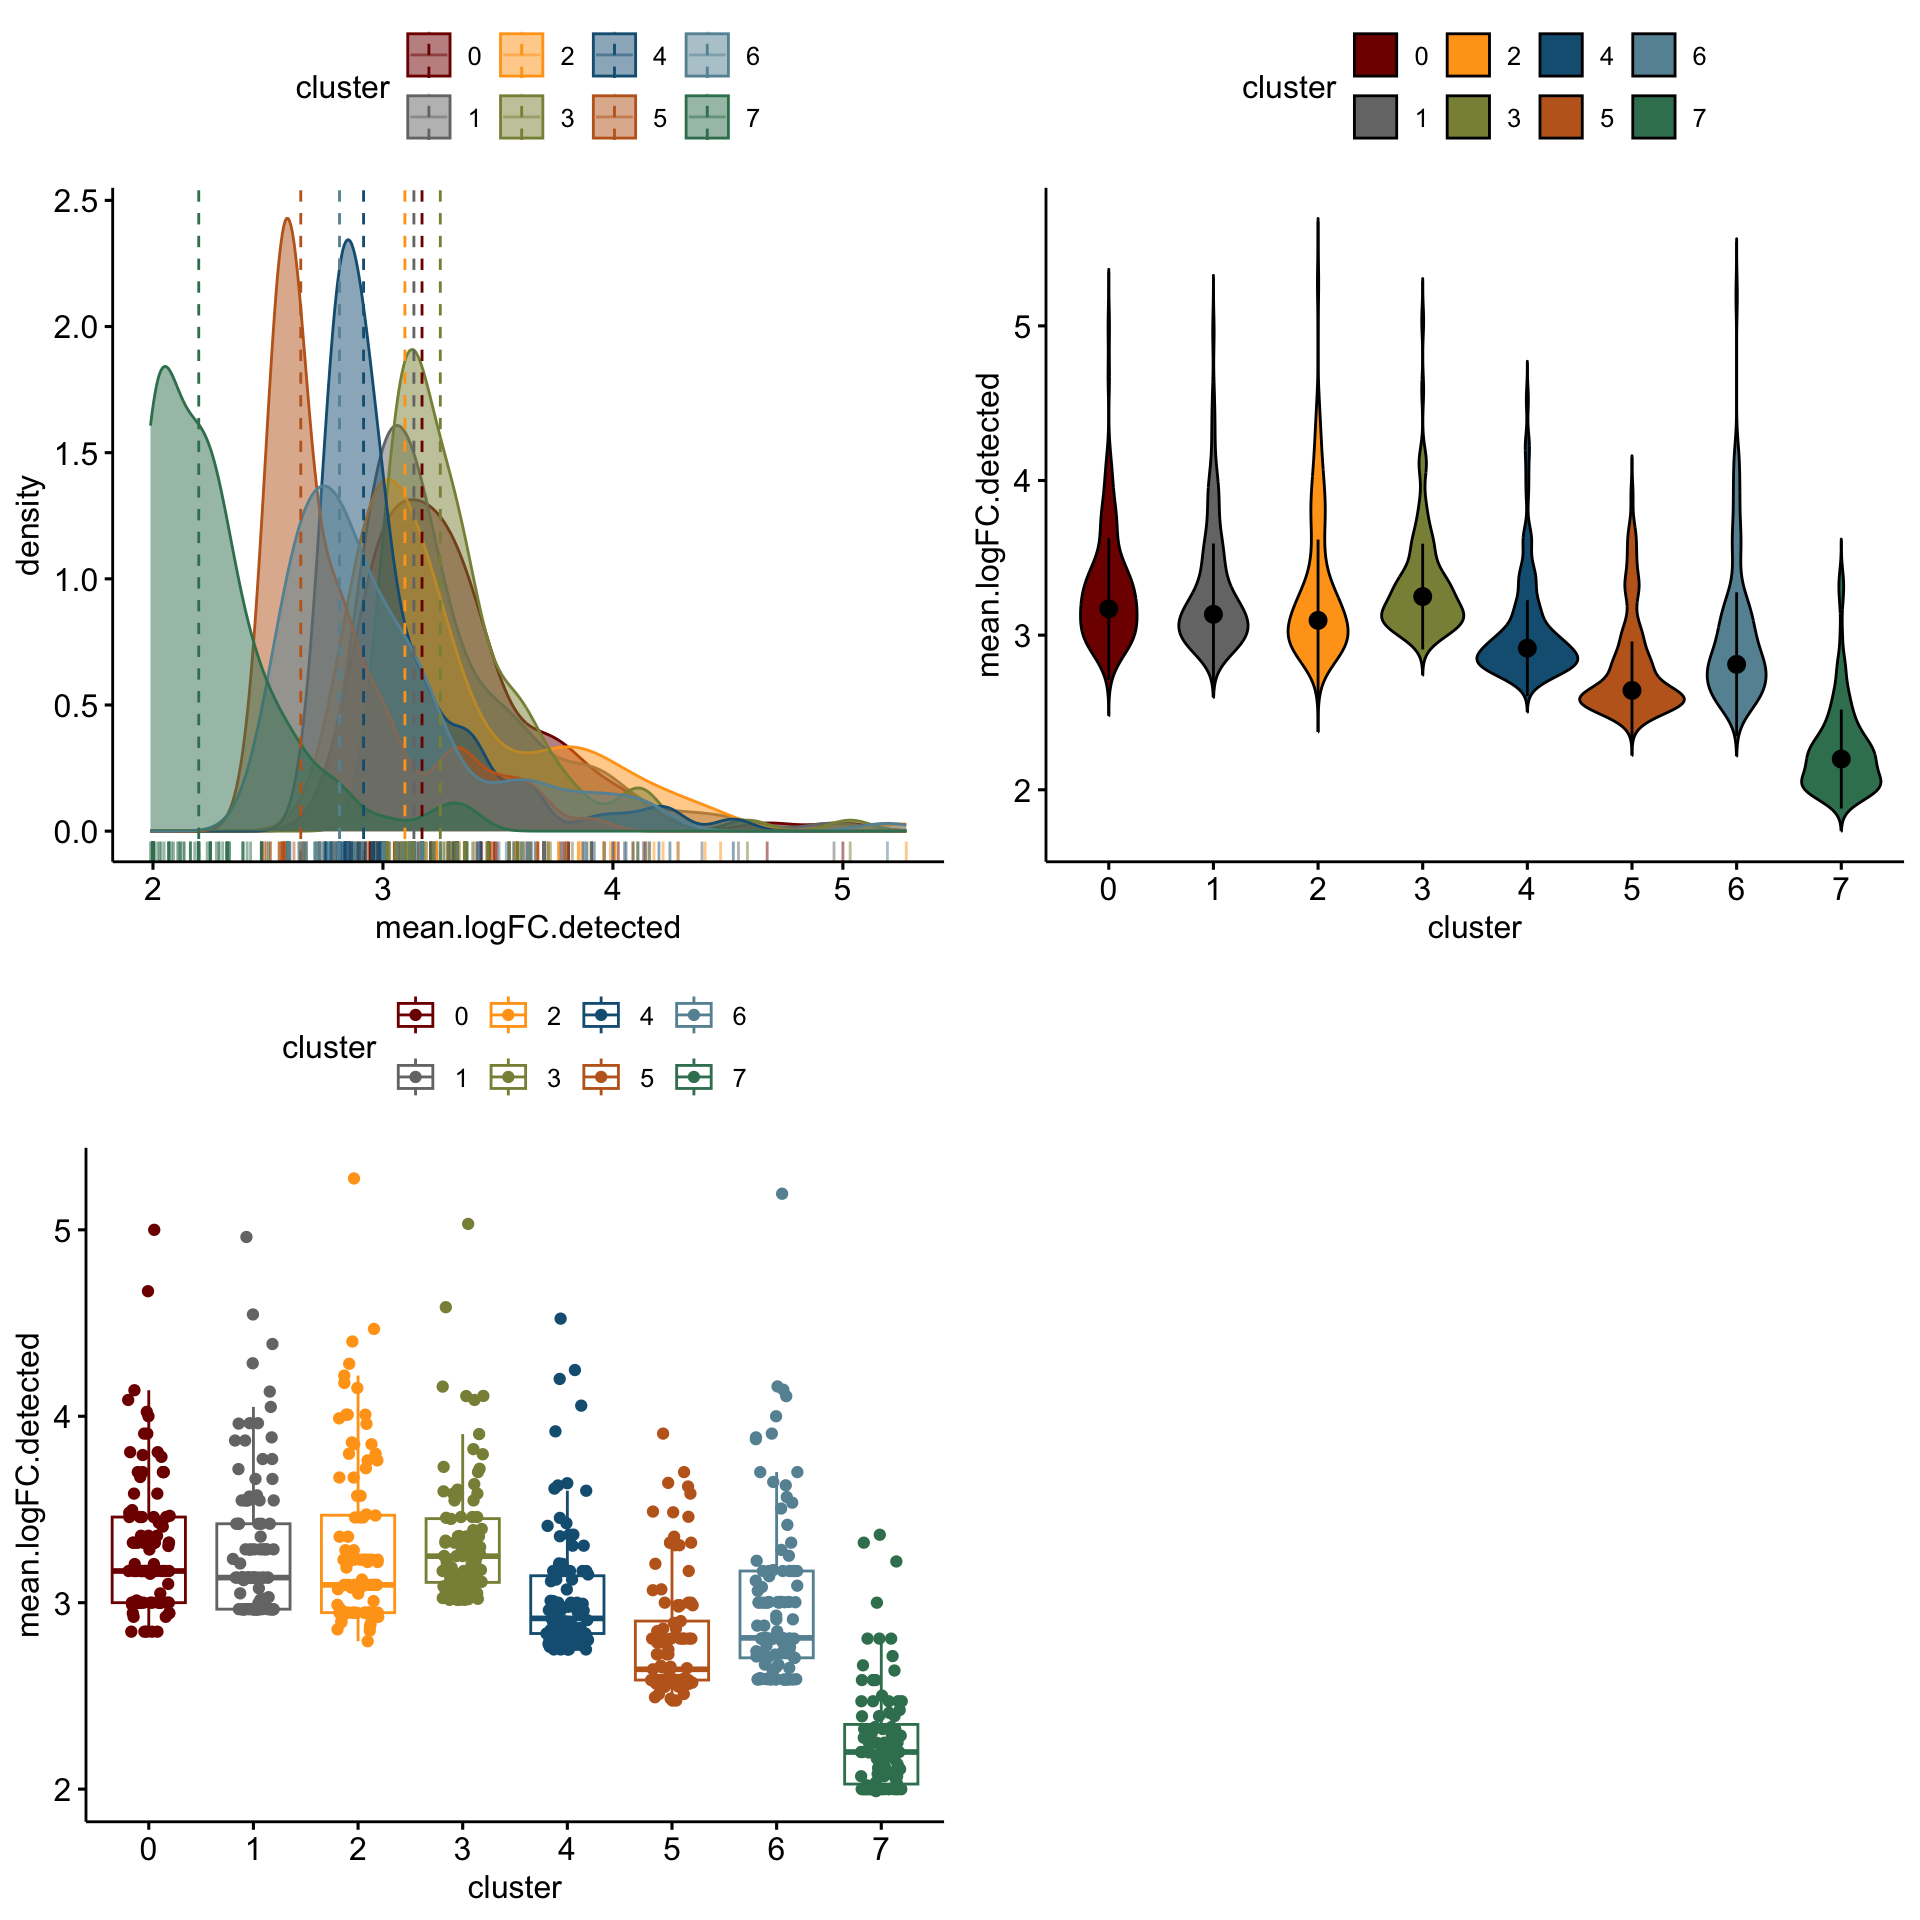
distribution of logFC of top 100 cw DE genes activated
cluVec <- unique(sce$integrated_snn_res.0.25)
logFCgrps <- c("mean.logFC.cohen", "mean.AUC", "mean.logFC.detected")

lapply(logFCgrps, function(lFC){
  outAct <- lapply(cluVec, function(cl){
    sceSub <- sce[,which(sce$integrated_snn_res.0.25 == cl)]
    m.out <- scoreMarkers(sceSub, sceSub$cond2)
    condVec <- unique(names(m.out))
    co <- "activated"
    outSub <- data.frame(m.out@listData[[co]]) %>%
      rownames_to_column(var = "gene") %>%
      slice_max(., order_by=.[[lFC]], n=100)%>%
      mutate(condCl=paste0(co, "_", cl)) %>%
      mutate(cluster=cl)
  })

  outActDat <- do.call("rbind", outAct)

  p1 <-ggdensity(outActDat, x = lFC,
   add = "median", rug = TRUE,
   color = "cluster", fill = "cluster",
   palette = colPal)

  p2 <- ggviolin(outActDat, x = "cluster", y = lFC, fill = "cluster",
          palette = colPal,
          add = "median_iqr")

  p3 <- ggboxplot(outActDat, x = "cluster", y = lFC,
            color = "cluster", palette =colPal,
            add = "jitter")
  gridExtra::grid.arrange(p1, p2, p3, ncol=2)
})
[[1]]
TableGrob (2 x 2) "arrange": 3 grobs
z cells name grob
1 1 (1-1,1-1) arrange gtable[layout]
2 2 (1-1,2-2) arrange gtable[layout]
3 3 (2-2,1-1) arrange gtable[layout]
[[2]]
TableGrob (2 x 2) "arrange": 3 grobs
z cells name grob
1 1 (1-1,1-1) arrange gtable[layout]
2 2 (1-1,2-2) arrange gtable[layout]
3 3 (2-2,1-1) arrange gtable[layout]
[[3]]
TableGrob (2 x 2) "arrange": 3 grobs
z cells name grob
1 1 (1-1,1-1) arrange gtable[layout]
2 2 (1-1,2-2) arrange gtable[layout]
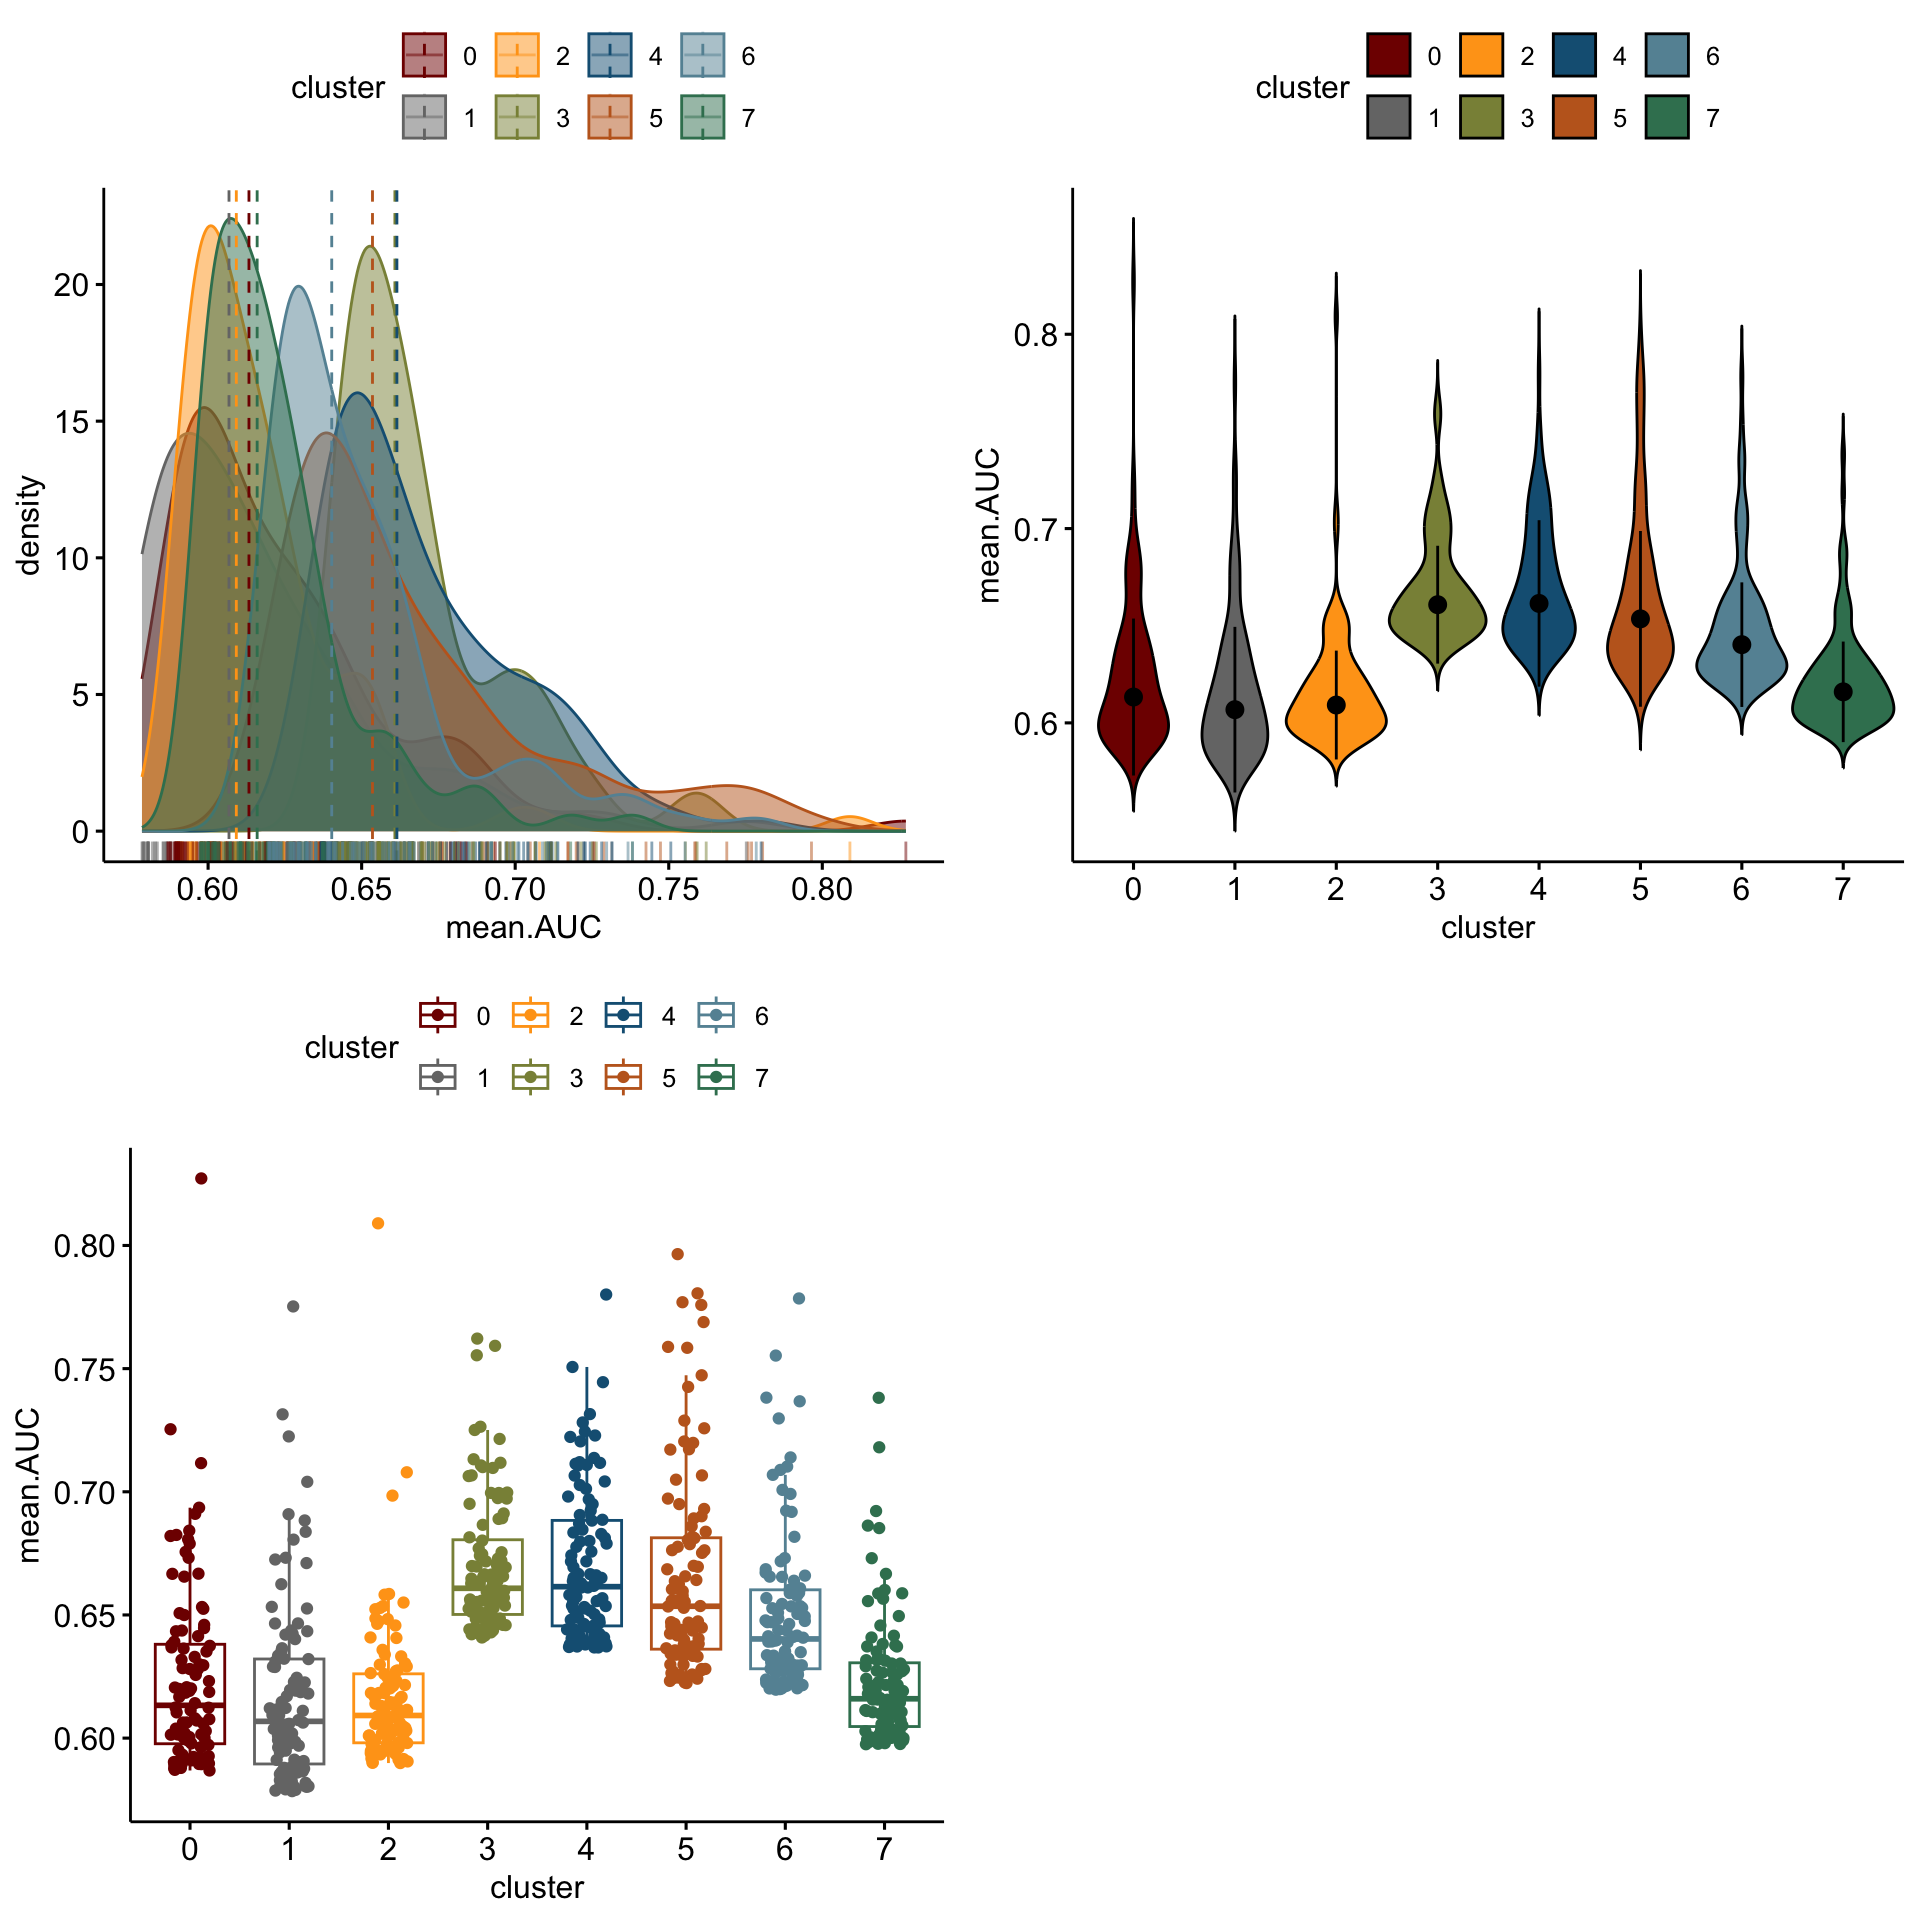
3 3 (2-2,1-1) arrange gtable[layout]distribution of logFC of top 100 cw DE genes resting
cluVec <- unique(sce$integrated_snn_res.0.25)
logFCgrps <- c("mean.logFC.cohen", "mean.AUC", "mean.logFC.detected")

lapply(logFCgrps, function(lFC){
  outAct <- lapply(cluVec, function(cl){
    sceSub <- sce[,which(sce$integrated_snn_res.0.25 == cl)]
    m.out <- scoreMarkers(sceSub, sceSub$cond2)
    condVec <- unique(names(m.out))
    co <- "resting"
    outSub <- data.frame(m.out@listData[[co]]) %>%
      rownames_to_column(var = "gene") %>%
      slice_max(., order_by=.[[lFC]], n=100)%>%
      mutate(condCl=paste0(co, "_", cl)) %>%
      mutate(cluster=cl)
  })

  outActDat <- do.call("rbind", outAct)

  p1 <-ggdensity(outActDat, x = lFC,
   add = "median", rug = TRUE,
   color = "cluster", fill = "cluster",
   palette = colPal)

  p2 <- ggviolin(outActDat, x = "cluster", y = lFC, fill = "cluster",
          palette = colPal,
          add = "median_iqr")

  p3 <- ggboxplot(outActDat, x = "cluster", y = lFC,
            color = "cluster", palette =colPal,
            add = "jitter")
  gridExtra::grid.arrange(p1, p2, p3, ncol=2)
})
[[1]]
TableGrob (2 x 2) "arrange": 3 grobs
  z     cells    name           grob
1 1 (1-1,1-1) arrange gtable[layout]
2 2 (1-1,2-2) arrange gtable[layout]
3 3 (2-2,1-1) arrange gtable[layout]

[[2]]
TableGrob (2 x 2) "arrange": 3 grobs
  z     cells    name           grob
1 1 (1-1,1-1) arrange gtable[layout]
2 2 (1-1,2-2) arrange gtable[layout]
3 3 (2-2,1-1) arrange gtable[layout]

[[3]]
TableGrob (2 x 2) "arrange": 3 grobs
  z     cells    name           grob
1 1 (1-1,1-1) arrange gtable[layout]
2 2 (1-1,2-2) arrange gtable[layout]
3 3 (2-2,1-1) arrange gtable[layout]
session info
sessionInfo()R version 4.3.0 (2023-04-21)
Platform: x86_64-apple-darwin20 (64-bit)
Running under: macOS Ventura 13.4.1
Matrix products: default
BLAS: /Library/Frameworks/R.framework/Versions/4.3-x86_64/Resources/lib/libRblas.0.dylib
LAPACK: /Library/Frameworks/R.framework/Versions/4.3-x86_64/Resources/lib/libRlapack.dylib; LAPACK version 3.11.0
locale:
[1] en_US.UTF-8/en_US.UTF-8/en_US.UTF-8/C/en_US.UTF-8/en_US.UTF-8
time zone: Europe/Berlin
tzcode source: internal
attached base packages:
[1] stats4 stats graphics grDevices utils datasets methods base
other attached packages:
[1] Matrix_1.6-5 scran_1.28.2 scater_1.28.0
[4] scuttle_1.10.3 SingleCellExperiment_1.22.0 SummarizedExperiment_1.30.2
[7] Biobase_2.60.0 GenomicRanges_1.52.1 GenomeInfoDb_1.36.4
[10] IRanges_2.36.0 S4Vectors_0.40.1 BiocGenerics_0.48.0
[13] MatrixGenerics_1.12.3 matrixStats_1.2.0 pheatmap_1.0.12
[16] ggsci_3.0.1 here_1.0.1 runSeurat3_0.1.0
[19] ggpubr_0.6.0 lubridate_1.9.3 forcats_1.0.0
[22] stringr_1.5.1 readr_2.1.5 tidyr_1.3.1
[25] tibble_3.2.1 tidyverse_2.0.0 Seurat_5.0.2
[28] SeuratObject_5.0.1 sp_2.1-3 purrr_1.0.2
[31] ggplot2_3.5.0 reshape2_1.4.4 dplyr_1.1.4
loaded via a namespace (and not attached):
[1] RcppAnnoy_0.0.22 splines_4.3.0 later_1.3.2
[4] bitops_1.0-7 polyclip_1.10-6 fastDummies_1.7.3
[7] lifecycle_1.0.4 rstatix_0.7.2 edgeR_3.42.4
[10] rprojroot_2.0.4 globals_0.16.2 lattice_0.22-5
[13] MASS_7.3-60.0.1 backports_1.4.1 magrittr_2.0.3
[16] limma_3.56.2 plotly_4.10.4 rmarkdown_2.26
[19] yaml_2.3.8 metapod_1.8.0 httpuv_1.6.14
[22] sctransform_0.4.1 spam_2.10-0 spatstat.sparse_3.0-3
[25] reticulate_1.35.0 cowplot_1.1.3 pbapply_1.7-2
[28] RColorBrewer_1.1-3 abind_1.4-5 zlibbioc_1.46.0
[31] Rtsne_0.17 RCurl_1.98-1.14 GenomeInfoDbData_1.2.10
[34] ggrepel_0.9.5 irlba_2.3.5.1 listenv_0.9.1
[37] spatstat.utils_3.0-4 goftest_1.2-3 RSpectra_0.16-1
[40] dqrng_0.3.2 spatstat.random_3.2-3 fitdistrplus_1.1-11
[43] parallelly_1.37.1 DelayedMatrixStats_1.22.6 leiden_0.4.3.1
[46] codetools_0.2-19 DelayedArray_0.26.7 tidyselect_1.2.0
[49] farver_2.1.1 viridis_0.6.5 ScaledMatrix_1.8.1
[52] spatstat.explore_3.2-6 jsonlite_1.8.8 BiocNeighbors_1.18.0
[55] ellipsis_0.3.2 progressr_0.14.0 ggridges_0.5.6
[58] survival_3.5-8 tools_4.3.0 ica_1.0-3
[61] Rcpp_1.0.12 glue_1.7.0 gridExtra_2.3
[64] xfun_0.42 withr_3.0.0 fastmap_1.1.1
[67] bluster_1.10.0 fansi_1.0.6 rsvd_1.0.5
[70] digest_0.6.34 timechange_0.3.0 R6_2.5.1
[73] mime_0.12 colorspace_2.1-0 scattermore_1.2
[76] tensor_1.5 spatstat.data_3.0-4 utf8_1.2.4
[79] generics_0.1.3 data.table_1.15.2 httr_1.4.7
[82] htmlwidgets_1.6.4 S4Arrays_1.0.6 uwot_0.1.16
[85] pkgconfig_2.0.3 gtable_0.3.4 lmtest_0.9-40
[88] XVector_0.40.0 htmltools_0.5.7 carData_3.0-5
[91] dotCall64_1.1-1 scales_1.3.0 png_0.1-8
[94] knitr_1.45 rstudioapi_0.15.0 tzdb_0.4.0
[97] nlme_3.1-164 zoo_1.8-12 KernSmooth_2.23-22
[100] vipor_0.4.7 parallel_4.3.0 miniUI_0.1.1.1
[103] pillar_1.9.0 grid_4.3.0 vctrs_0.6.5
[106] RANN_2.6.1 promises_1.2.1 BiocSingular_1.16.0
[109] car_3.1-2 beachmat_2.16.0 xtable_1.8-4
[112] cluster_2.1.6 beeswarm_0.4.0 evaluate_0.23
[115] locfit_1.5-9.9 cli_3.6.2 compiler_4.3.0
[118] rlang_1.1.3 crayon_1.5.2 future.apply_1.11.1
[121] ggsignif_0.6.4 labeling_0.4.3 ggbeeswarm_0.7.2
[124] plyr_1.8.9 stringi_1.8.3 BiocParallel_1.34.2
[127] viridisLite_0.4.2 deldir_2.0-4 munsell_0.5.0
[130] lazyeval_0.2.2 spatstat.geom_3.2-9 RcppHNSW_0.6.0
[133] hms_1.1.3 patchwork_1.2.0 sparseMatrixStats_1.12.2
[136] future_1.33.1 statmod_1.5.0 shiny_1.8.0
[139] ROCR_1.0-11 igraph_2.0.2 broom_1.0.5 date()[1] "Wed Mar 13 19:52:40 2024"