run cellchat scRNAseq data human LN
Load packages
## load packages
suppressPackageStartupMessages({
  library(dplyr)
  library(reshape2)
  library(ggplot2)
  library(purrr)
  library(Seurat)
  library(tidyverse)
  library(ggpubr)
  library(runSeurat3)
  library(here)
  library(ggsci)
  library(pheatmap)
  library(scater)
  library(SingleCellExperiment)
  library(scran)
  library(CellChat)
  library(patchwork)
  library(ComplexHeatmap)
})
load seurat object
basedir <- here()

seuratFRC <- readRDS(file= paste0(basedir,
                            "/data/AllPatWithoutCM_FRConly_intOrig",
                            "_seurat.rds"))
seuratIMM <- readRDS(file= paste0(basedir,
                            "/data/AllPatWithoutCM_IMMMerged_integrated_label",
                       "_seurat.rds"))

## add label FRCs
seuratFRC$label <- "medRCIFRC"
seuratFRC$label[which(seuratFRC$intCluster == "7")] <- "BRC"
seuratFRC$label[which(seuratFRC$intCluster == "2")] <- "TRC"
seuratFRC$label[which(seuratFRC$intCluster == "3")] <- "ACTA2+PRC"
seuratFRC$label[which(seuratFRC$intCluster == "4")] <- "VSMC"
seuratFRC$label[which(seuratFRC$intCluster == "5")] <- "PI16+RC"
seuratFRC$label[which(seuratFRC$intCluster == "6")] <- "PRC1"

seuratFRC$cond2 <- seuratFRC$cond
seuratFRC$cond2[which(seuratFRC$cond %in% c("acute", "chronic"))] <- "activated"

## group imm cells
seuratIMM$label2 <- seuratIMM$label
seuratIMM$label <- as.character(seuratIMM$label)
seuratIMM$label[which(seuratIMM$label %in% c("naiveCD4-2", "naiveCD4-3",
                                             "naiveCD4-1", "Treg" ))] <- "CD4T"
seuratIMM$label[which(seuratIMM$label %in% c("pDC-2", "pDC-1" ))] <- "pDC"
seuratIMM$label[which(seuratIMM$label %in% c("naiveB", "preB" ))] <- "naiveB"


seurat <- merge(seuratFRC, c(seuratIMM))
seurat$label_plus_cond <- paste0(seurat$label, "_", seurat$cond2)
table(seurat$label_plus_cond)
 ACTA2+PRC_activated    ACTA2+PRC_resting        BRC_activated          BRC_resting
                4244                 1560                 1487                  390
      CD4T_activated         CD4T_resting     CD8Tcm_activated       CD8Tcm_resting
               38543                39380                 6234                 4006
CTL/NKcell_activated   CTL/NKcell_resting        GCB_activated          GCB_resting
                4129                10339                  687                  869
      ILC3_activated         ILC3_resting        MBC_activated          MBC_resting
                  79                 1819                10732                17174
 medRCIFRC_activated    medRCIFRC_resting   Mph/DC-1_activated     Mph/DC-1_resting
               10342                10129                  118                 2952
  Mph/DC-2_activated     Mph/DC-2_resting     naiveB_activated       naiveB_resting
                 157                  980                 8295                14118
       pDC_activated          pDC_resting    PI16+RC_activated      PI16+RC_resting
                 558                 6750                 1917                  986
plasmaCell_activated   plasmaCell_resting       PRC1_activated         PRC1_resting
                  53                  326                 1528                  760
       TRC_activated          TRC_resting       VSMC_activated         VSMC_resting
3164 3773 2767 724 Idents(seurat) <- seurat$label_plus_cond
seurat <- subset(x = seurat, downsample = 500)
table(seurat$label_plus_cond)
 ACTA2+PRC_activated    ACTA2+PRC_resting        BRC_activated          BRC_resting
                 500                  500                  500                  390
      CD4T_activated         CD4T_resting     CD8Tcm_activated       CD8Tcm_resting
                 500                  500                  500                  500
CTL/NKcell_activated   CTL/NKcell_resting        GCB_activated          GCB_resting
                 500                  500                  500                  500
      ILC3_activated         ILC3_resting        MBC_activated          MBC_resting
                  79                  500                  500                  500
 medRCIFRC_activated    medRCIFRC_resting   Mph/DC-1_activated     Mph/DC-1_resting
                 500                  500                  118                  500
  Mph/DC-2_activated     Mph/DC-2_resting     naiveB_activated       naiveB_resting
                 157                  500                  500                  500
       pDC_activated          pDC_resting    PI16+RC_activated      PI16+RC_resting
                 500                  500                  500                  500
plasmaCell_activated   plasmaCell_resting       PRC1_activated         PRC1_resting
                  53                  326                  500                  500
       TRC_activated          TRC_resting       VSMC_activated         VSMC_resting
500 500 500 500 table(seurat$patient)
P_20200220 P_20200722 P_20200909 P_20210113 P_20210224 P_20220201 P_20220202     ucd010      ucd13
      1482        600       1282       1925       1474       2251       2658       1939       1046
     ucd14
1466 dim(seurat)[1] 39642 16123remove(seuratIMM, seuratFRC)
seurat <- NormalizeData(object = seurat)
seurat <- FindVariableFeatures(object = seurat)
seurat <- ScaleData(object = seurat, verbose = FALSE)
seurat <- RunPCA(object = seurat, npcs = 30, verbose = FALSE)
seurat <- RunTSNE(object = seurat, reduction = "pca", dims = 1:20)
seurat <- RunUMAP(object = seurat, reduction = "pca", dims = 1:20)set color palettes
colFRC <- c("#800000FF", "#FFA319FF","#8A9045FF", "#155F83FF",
            "#C16622FF", "#6692a3", "#3b7f60")
names(colFRC) <- c("medRCIFRC", "TRC", "ACTA2+PRC", "VSMC", "PI16+RC", "PRC1",
                   "BRC")


colImm <- c("#0b6647", "#54907e", "#94c78a", "#6f9568",
            "#8f2810", "#d0ac21","#9e9f0b", "#486584",
            "#4b5397", "#8873d3", "#6e3e7a")

names(colImm) <- c("naiveB", "GCB", "MBC", "plasmaCell",
                   "CD4T", "CD8Tcm", "CTL/NKcell", "ILC3", "pDC",
                   "Mph/DC-1", "Mph/DC-2" )

colAll <- c(colFRC, colImm)

colPal <- c(pal_uchicago()(6), "#6692a3", "#3b7f60")
names(colPal) <- c("0", "1", "2", "3", "4", "5", "6", "7")
colPat <- c(pal_nejm()(7),pal_futurama()(12))[1:length(unique(seurat$patient))]
names(colPat) <- unique(seurat$patient)
colCond <- c("#6692a3","#971c1c","#d17d67")
names(colCond) <- unique(seurat$cond)
colOri <- pal_npg()(length(unique(seurat$origin)))
names(colOri) <- unique(seurat$origin)
colCond2 <- c("#6692a3","#971c1c")
names(colCond2) <- c("resting", "activated")
visualize data
label
DimPlot(seurat, reduction = "umap", cols=colAll, group.by = "label")+
  theme_bw() +
  theme(axis.text = element_blank(), axis.ticks = element_blank(),
        panel.grid.minor = element_blank()) +
  xlab("UMAP1") +
  ylab("UMAP2")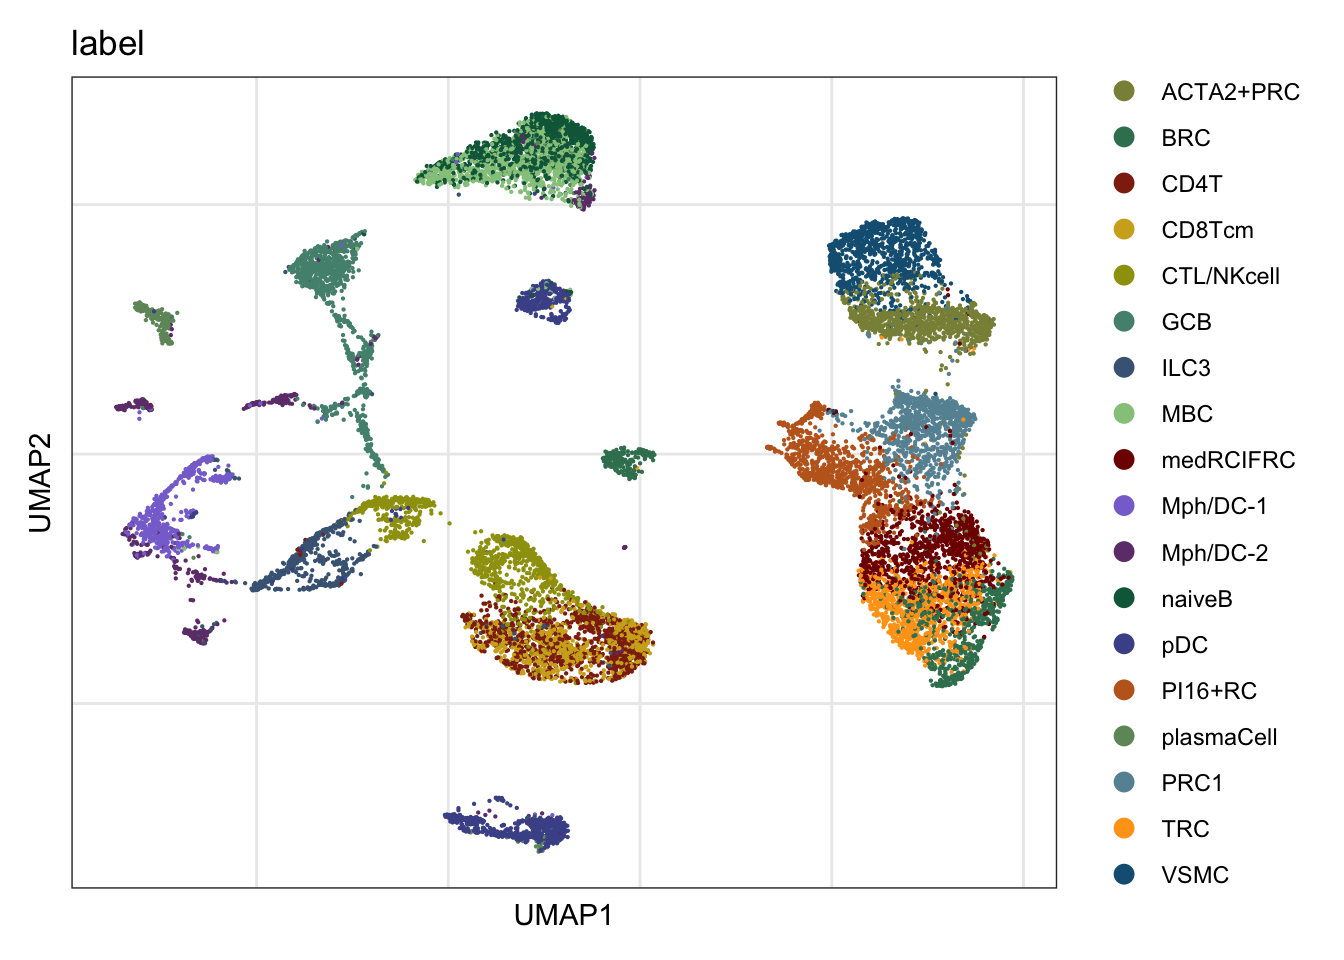
patient
## visualize input data
DimPlot(seurat, reduction = "umap", cols=colPat, group.by = "patient")+
  theme_bw() +
  theme(axis.text = element_blank(), axis.ticks = element_blank(),
        panel.grid.minor = element_blank()) +
  xlab("UMAP1") +
  ylab("UMAP2")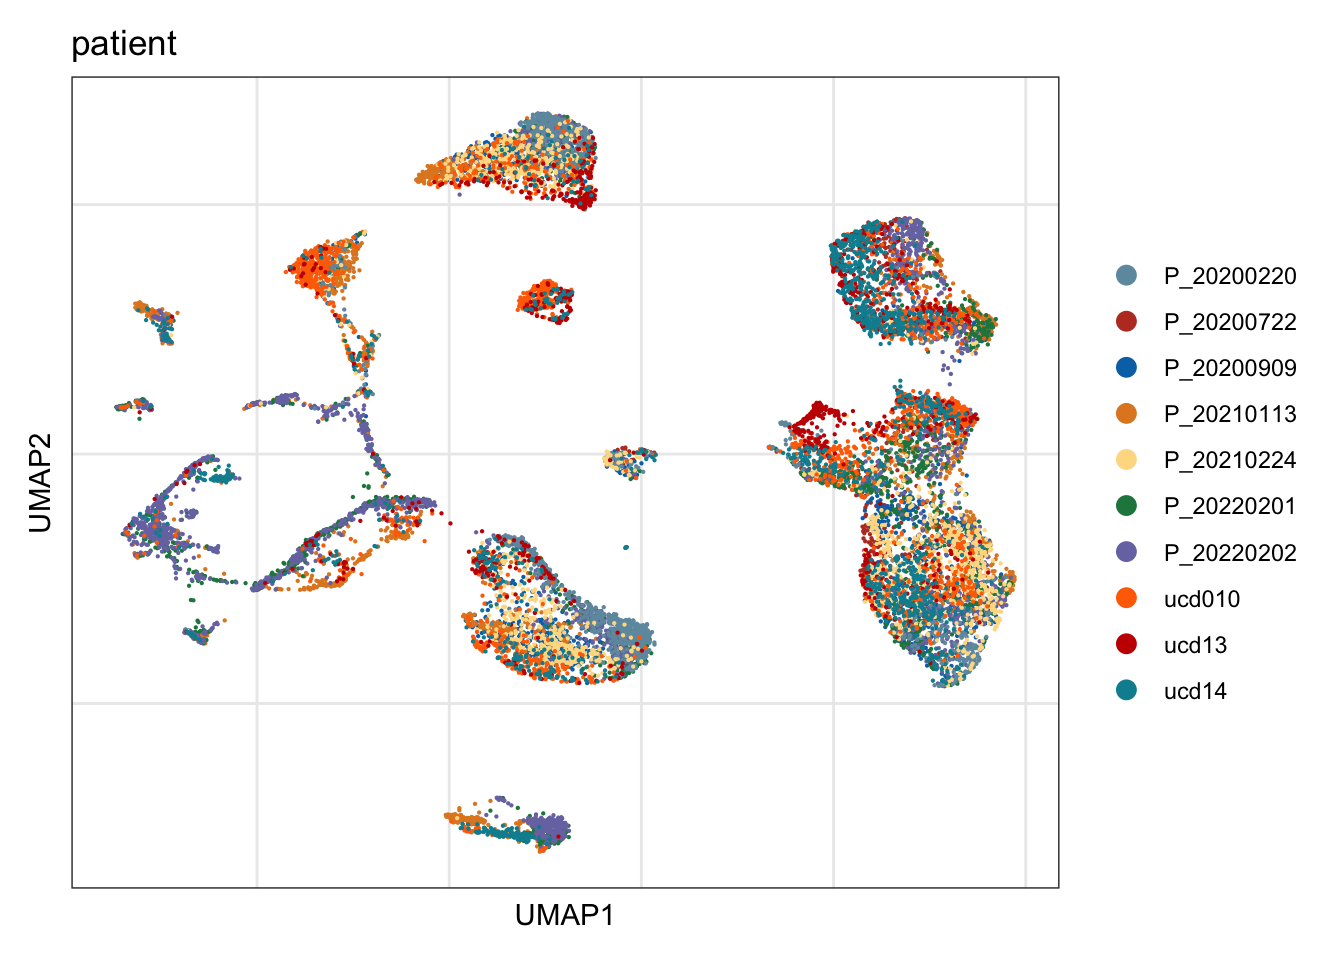
cond2
## visualize input data
DimPlot(seurat, reduction = "umap", cols=colCond2, group.by = "cond2")+
  theme_bw() +
  theme(axis.text = element_blank(), axis.ticks = element_blank(),
        panel.grid.minor = element_blank()) +
  xlab("UMAP1") +
  ylab("UMAP2")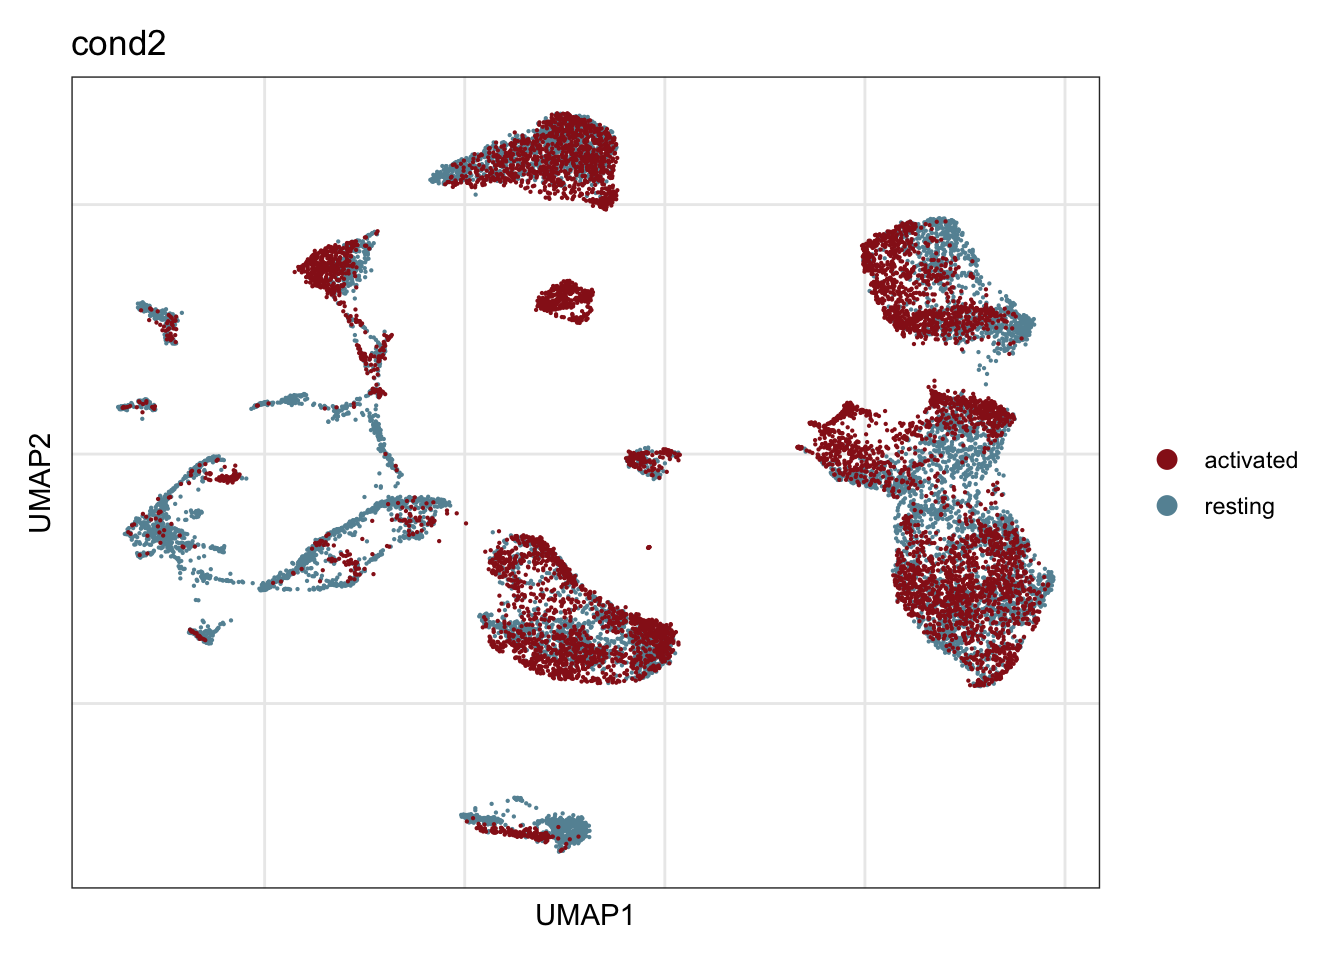
origin
## visualize input data
DimPlot(seurat, reduction = "umap", cols=colOri, group.by = "origin")+
  theme_bw() +
  theme(axis.text = element_blank(), axis.ticks = element_blank(),
        panel.grid.minor = element_blank()) +
  xlab("UMAP1") +
  ylab("UMAP2")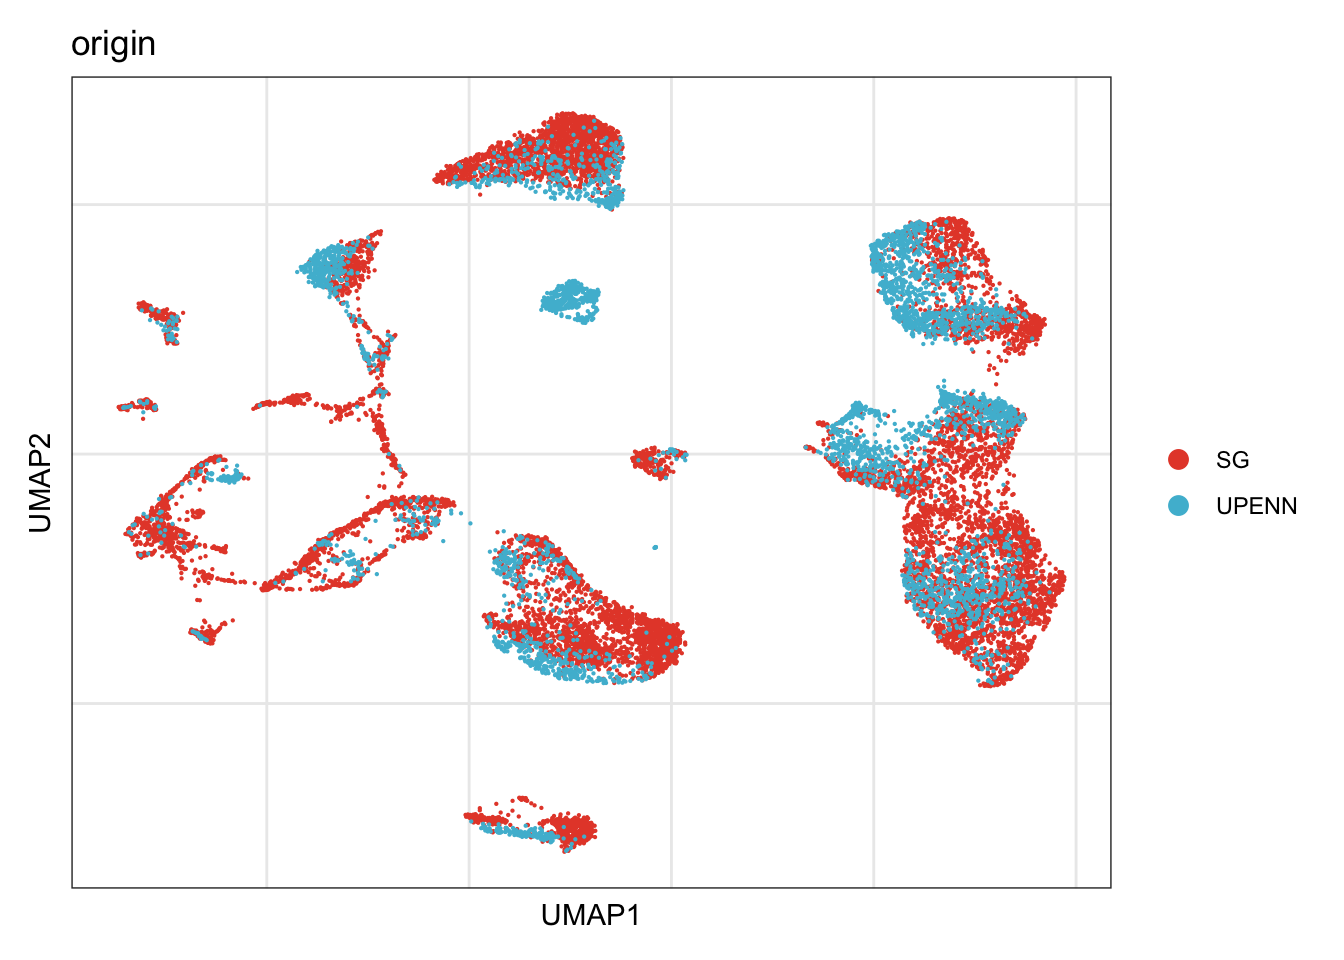
cellchat analysis
create cellchat object
future::plan("multisession", workers = 4)

### --------------- resting LNs ----------------- ###
seurat.res <- subset(seurat, cond2 == "resting")
data.inp.res <- seurat.res@assays$RNA$data
rownames(data.inp.res) <- gsub(".*\\.", "", rownames(data.inp.res))

cellchat.res <- createCellChat(object = data.inp.res, meta = seurat.res@meta.data,
                           group.by = "label")
[1] "Create a CellChat object from a data matrix"
Set cell identities for the new CellChat object
The cell groups used for CellChat analysis are ACTA2+PRC BRC CD4T CD8Tcm CTL/NKcell GCB ILC3 MBC medRCIFRC Mph/DC-1 Mph/DC-2 naiveB pDC PI16+RC plasmaCell PRC1 TRC VSMC CellChatDB <- CellChatDB.human
cellchat.res@DB <- CellChatDB
## preprocessing
cellchat.res <- CellChat::subsetData(cellchat.res)
cellchat.res <- identifyOverExpressedGenes(cellchat.res)
cellchat.res <- identifyOverExpressedInteractions(cellchat.res)
### --------------- activated LNs ----------------- ###
seurat.act <- subset(seurat, cond2 == "activated")
data.inp.act <- seurat.act@assays$RNA$data
rownames(data.inp.act) <- gsub(".*\\.", "", rownames(data.inp.act))
cellchat.act <- createCellChat(object = data.inp.act, meta = seurat.act@meta.data,
group.by = "label")[1] "Create a CellChat object from a data matrix"
Set cell identities for the new CellChat object
The cell groups used for CellChat analysis are ACTA2+PRC BRC CD4T CD8Tcm CTL/NKcell GCB ILC3 MBC medRCIFRC Mph/DC-1 Mph/DC-2 naiveB pDC PI16+RC plasmaCell PRC1 TRC VSMC cellchat.act@DB <- CellChatDB
## preprocessing
cellchat.act <- CellChat::subsetData(cellchat.act)
cellchat.act <- identifyOverExpressedGenes(cellchat.act)
cellchat.act <- identifyOverExpressedInteractions(cellchat.act)compute communication probability res
cellchat.res <- computeCommunProb(cellchat.res, type = "truncatedMean")truncatedMean is used for calculating the average gene expression per cell group.
[1] ">>> Run CellChat on sc/snRNA-seq data <<< [2024-03-13 22:35:11.748377]"
[1] ">>> CellChat inference is done. Parameter values are stored in `object@options$parameter` <<< [2024-03-13 22:57:18.652009]"cellchat.res <- filterCommunication(cellchat.res, min.cells = 10)
cellchat.res <- computeCommunProbPathway(cellchat.res)
df.net.res <- subsetCommunication(cellchat.res,
sources.use = c("PI16+RC", "PRC1", "ACTA2+PRC"),
targets.use = c("CD4T", "CTL/NKcell", "GCB",
"ILC3", "naiveB", "MBC",
"plasmaCell", "CD8Tcm",
"Mph/DC-1", "Mph/DC-2"))
df.net2.res <- subsetCommunication(cellchat.res, sources.use = c("CD4T", "CTL/NKcell",
"GCB",
"ILC3", "naiveB", "MBC",
"plasmaCell", "CD8Tcm",
"Mph/DC-1", "Mph/DC-2"),
targets.use = c("PI16+RC", "PRC1", "ACTA2+PRC"))
cellchat.res <- aggregateNet(cellchat.res)
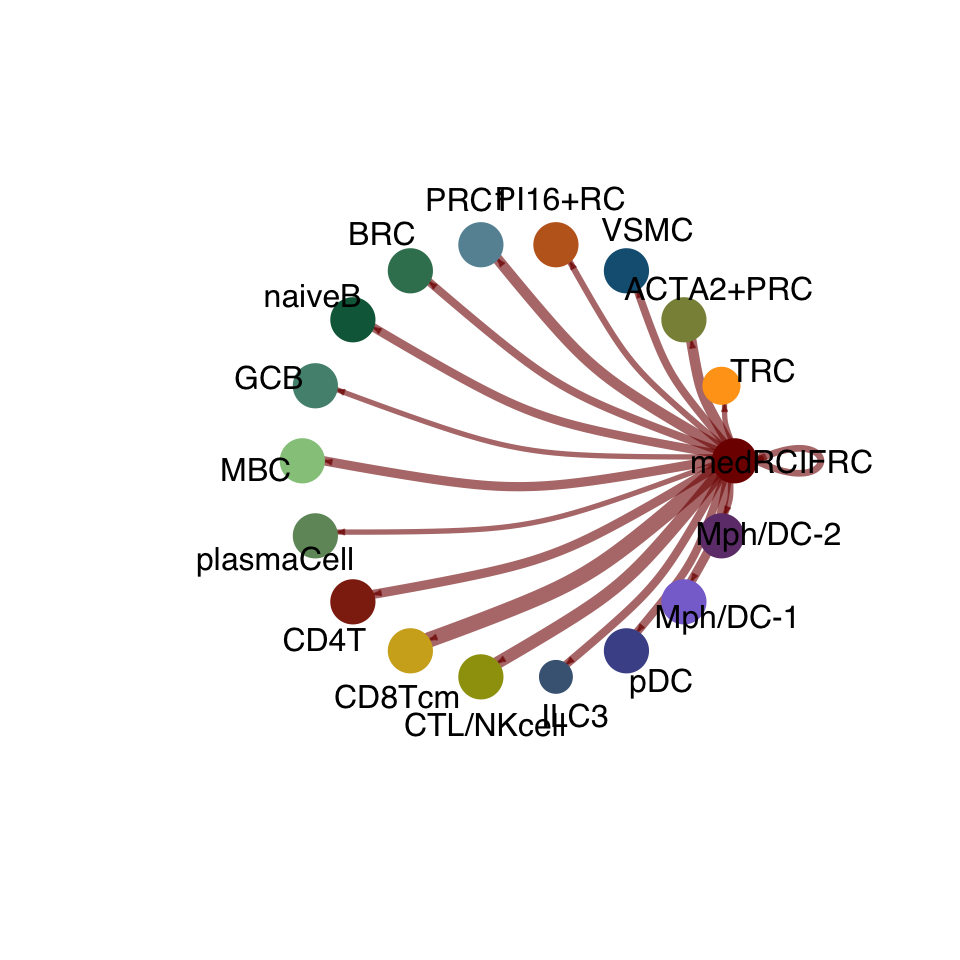
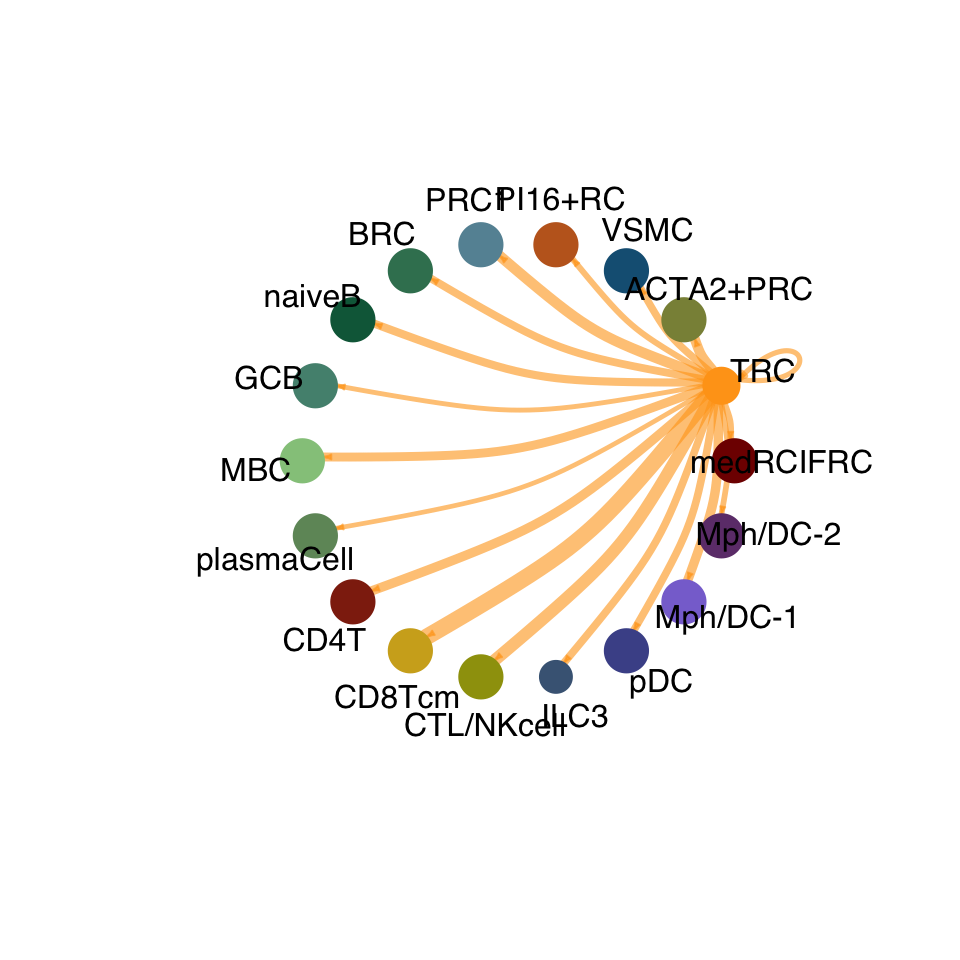
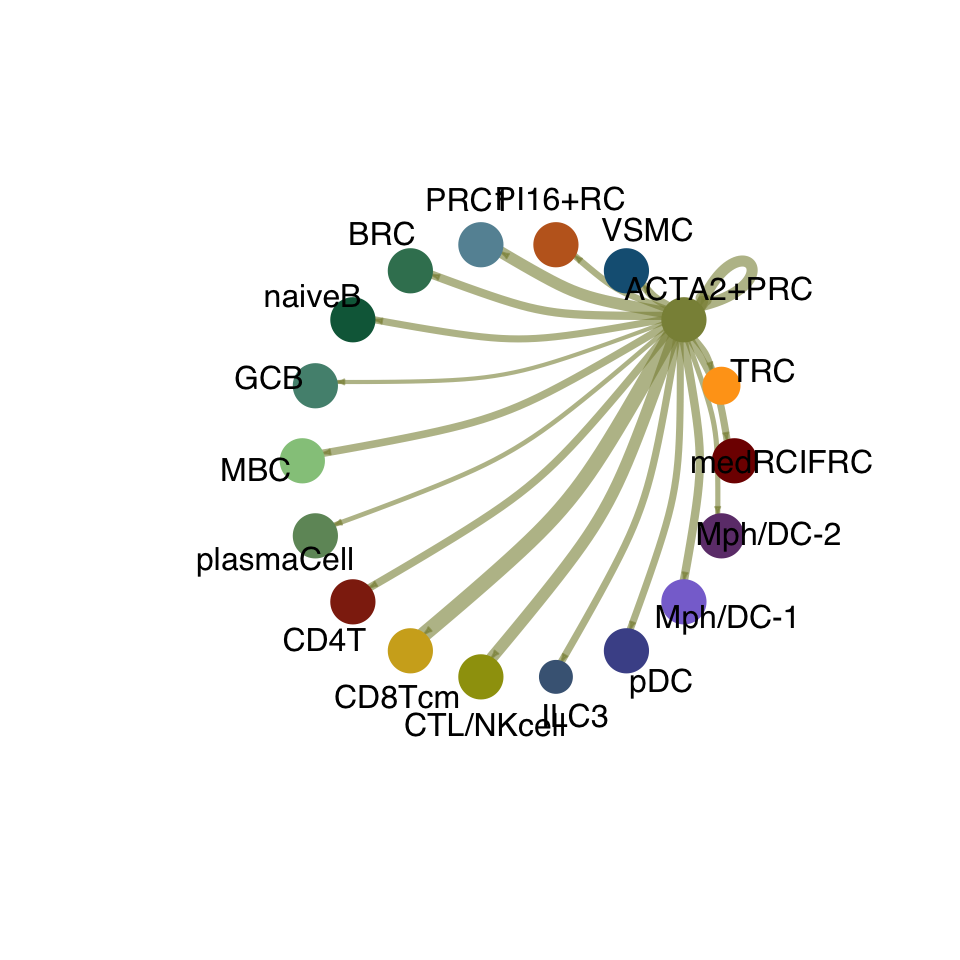
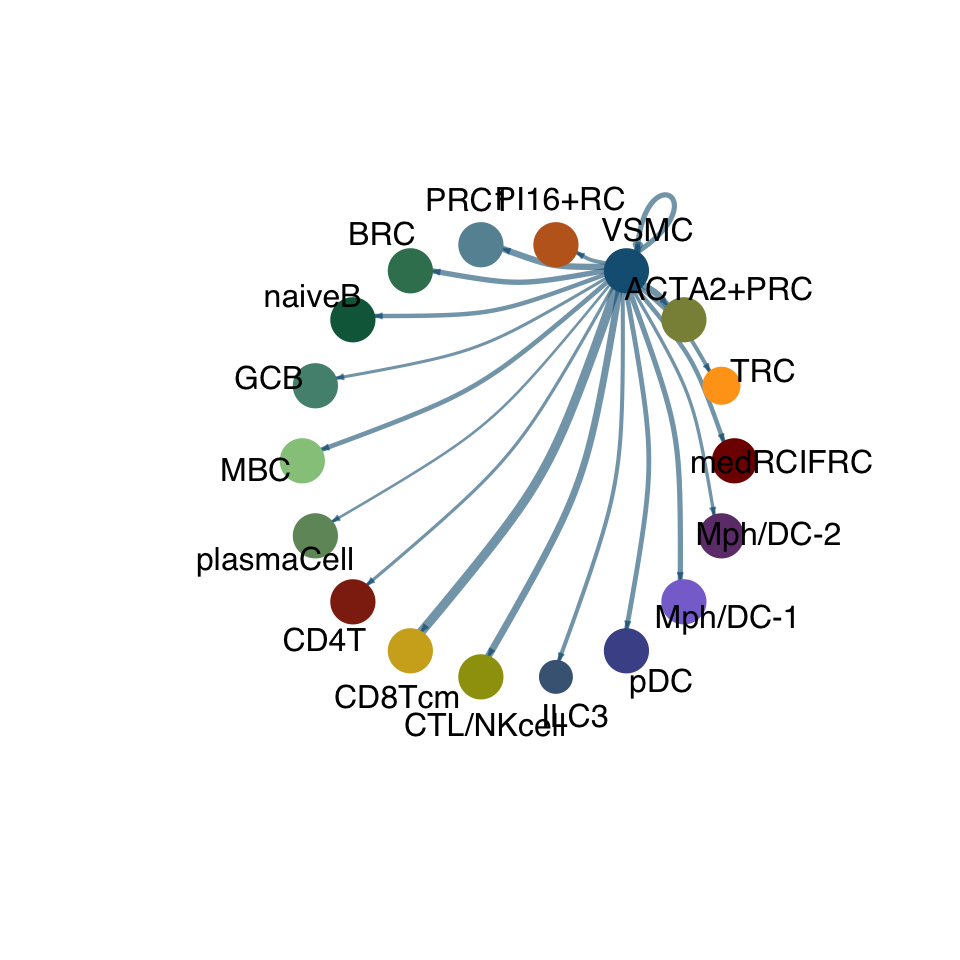
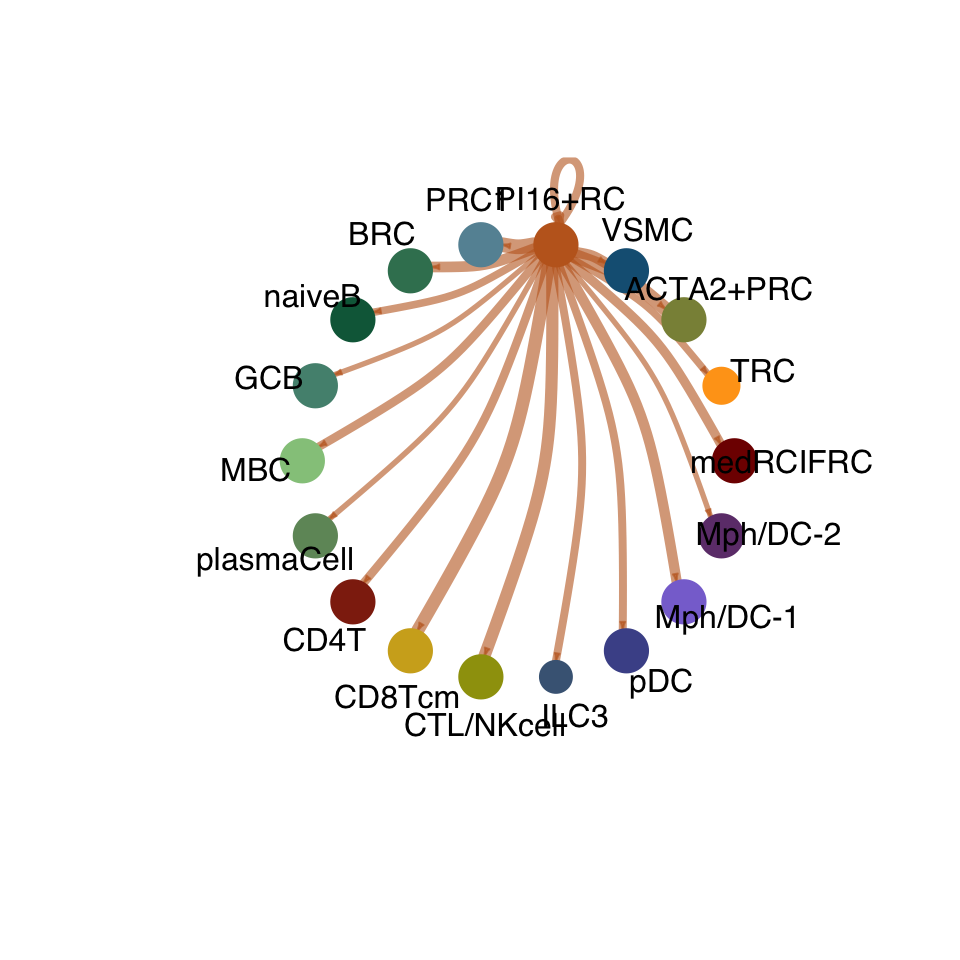
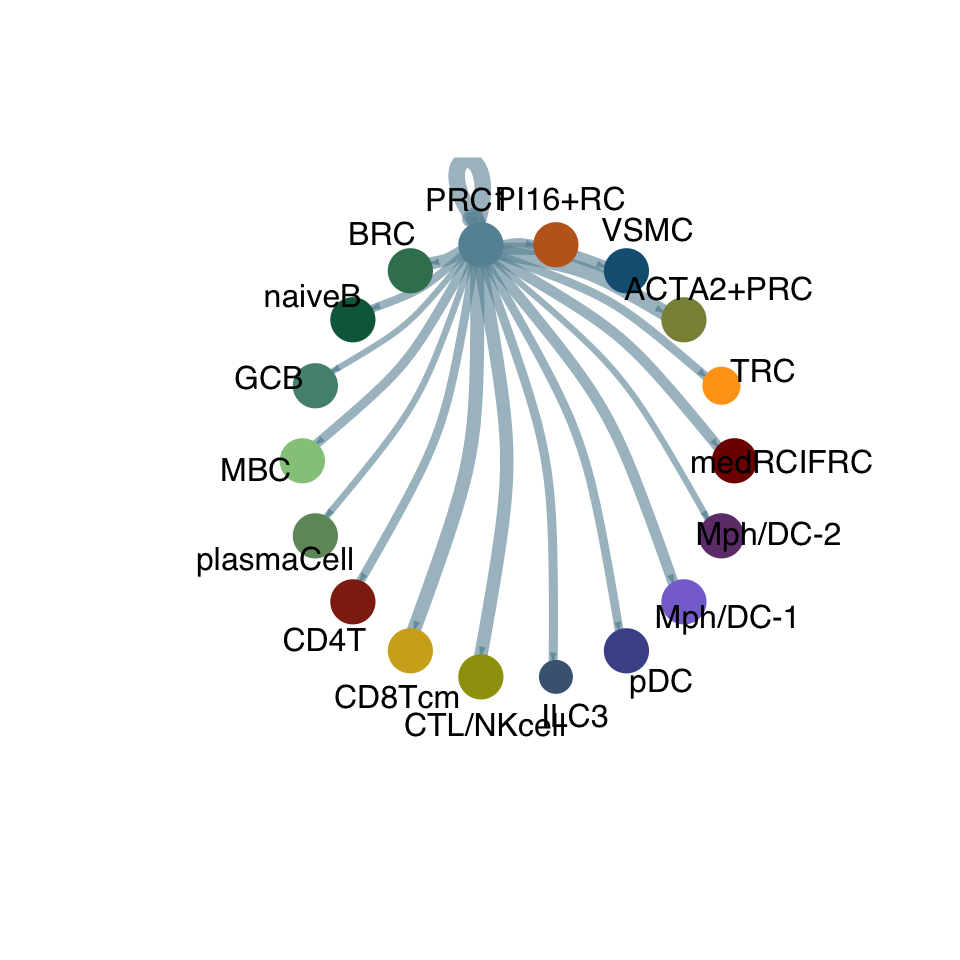
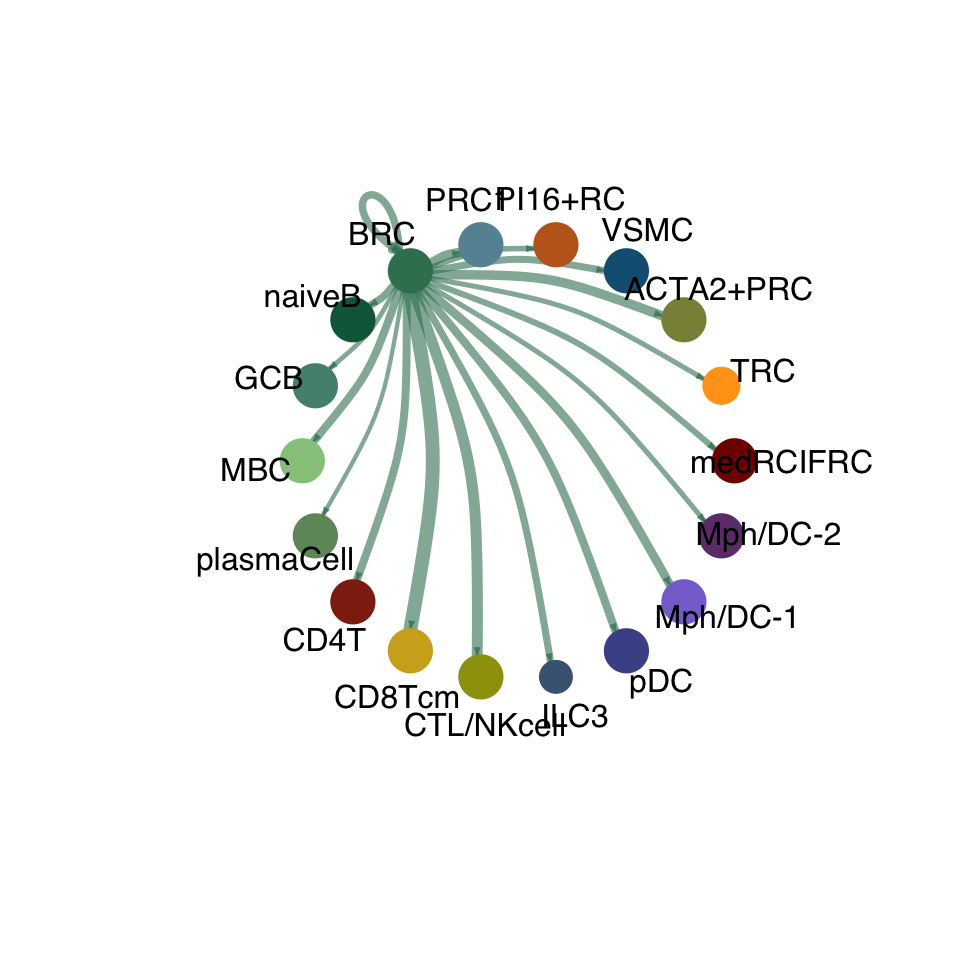
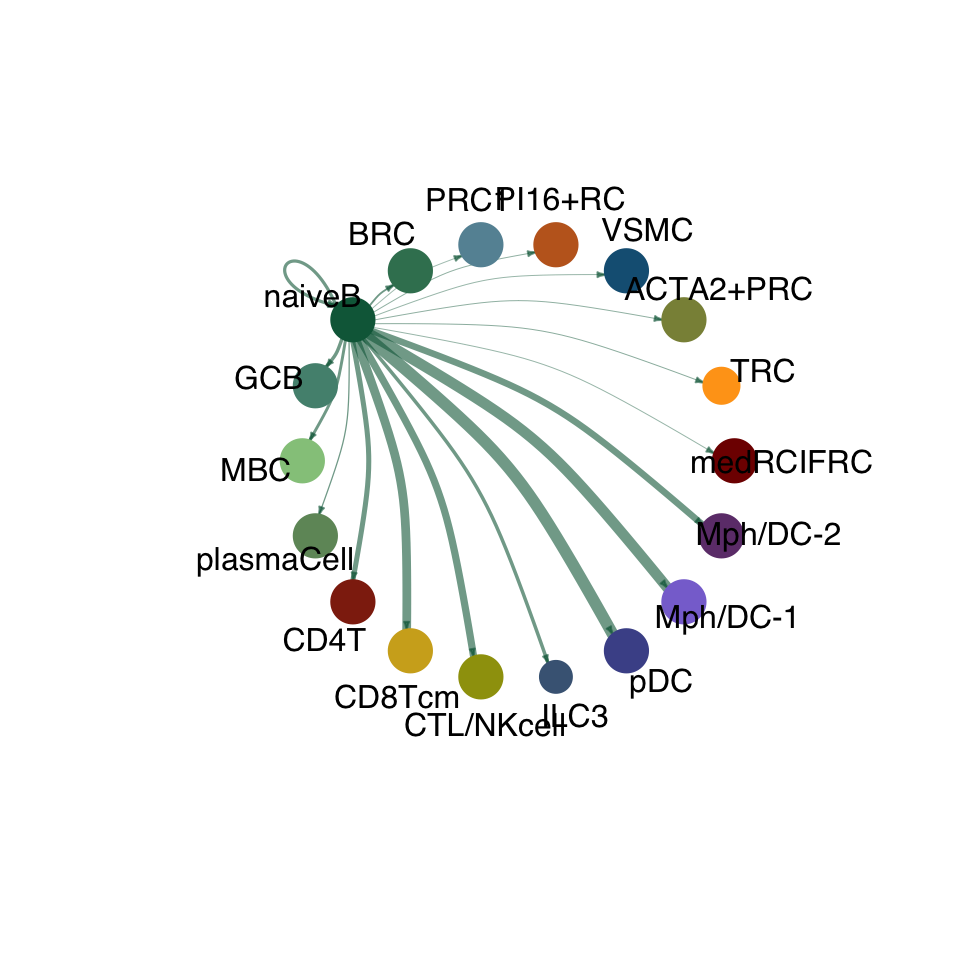
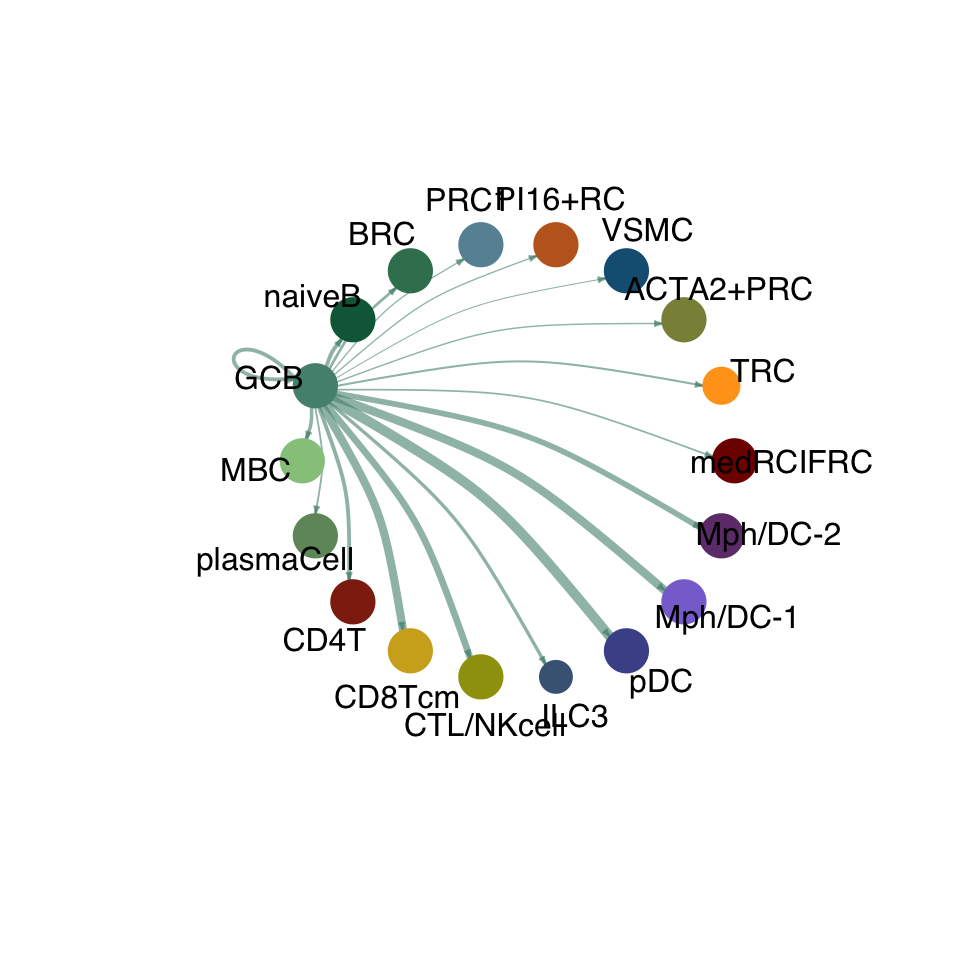
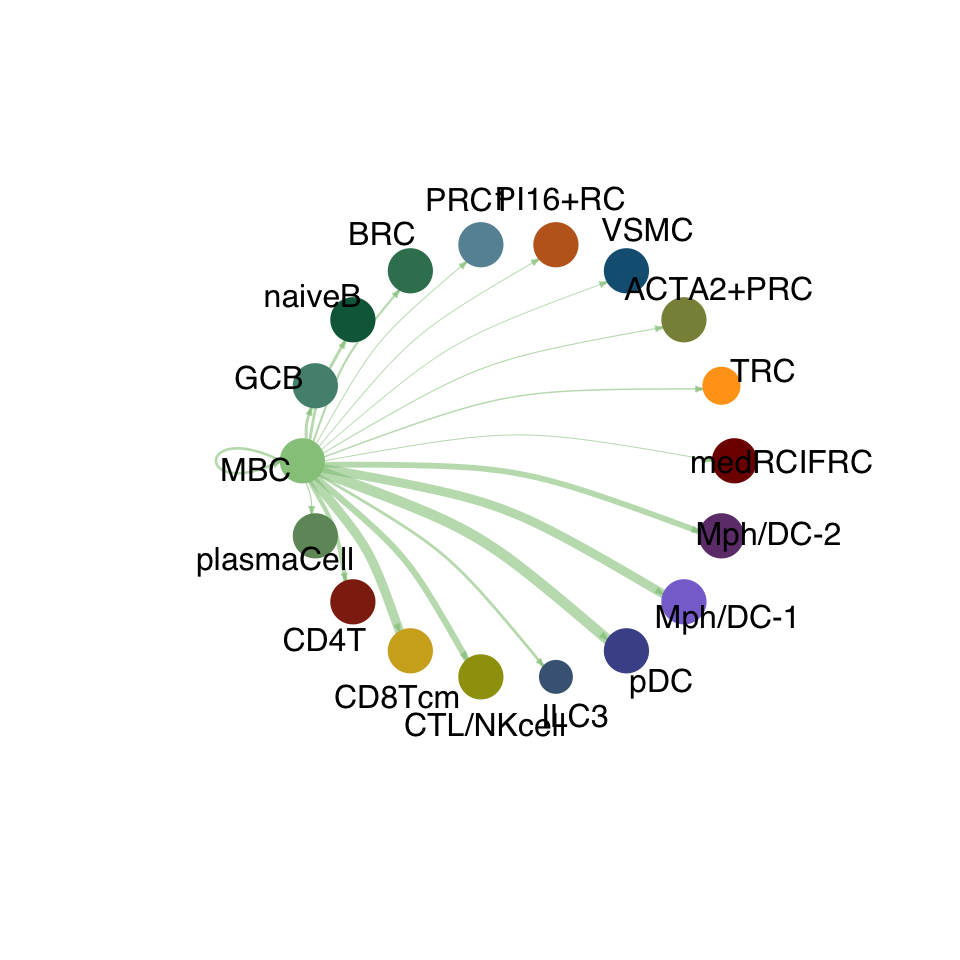
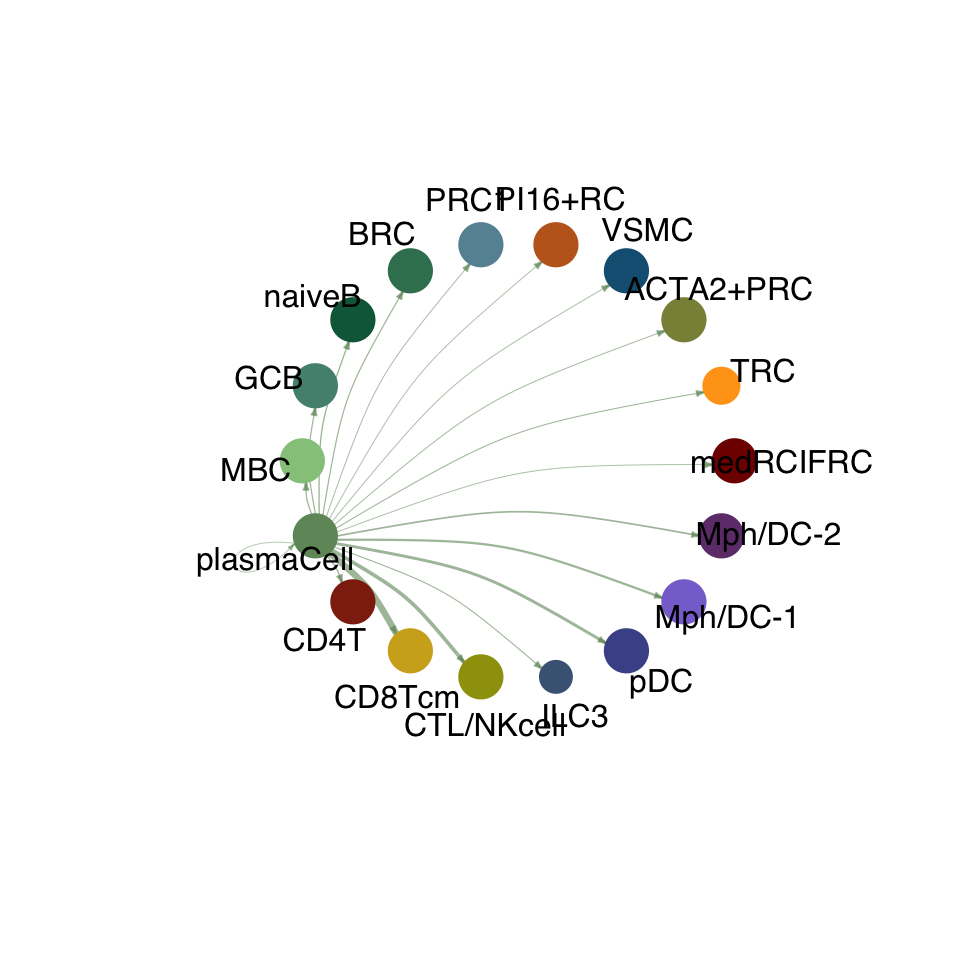
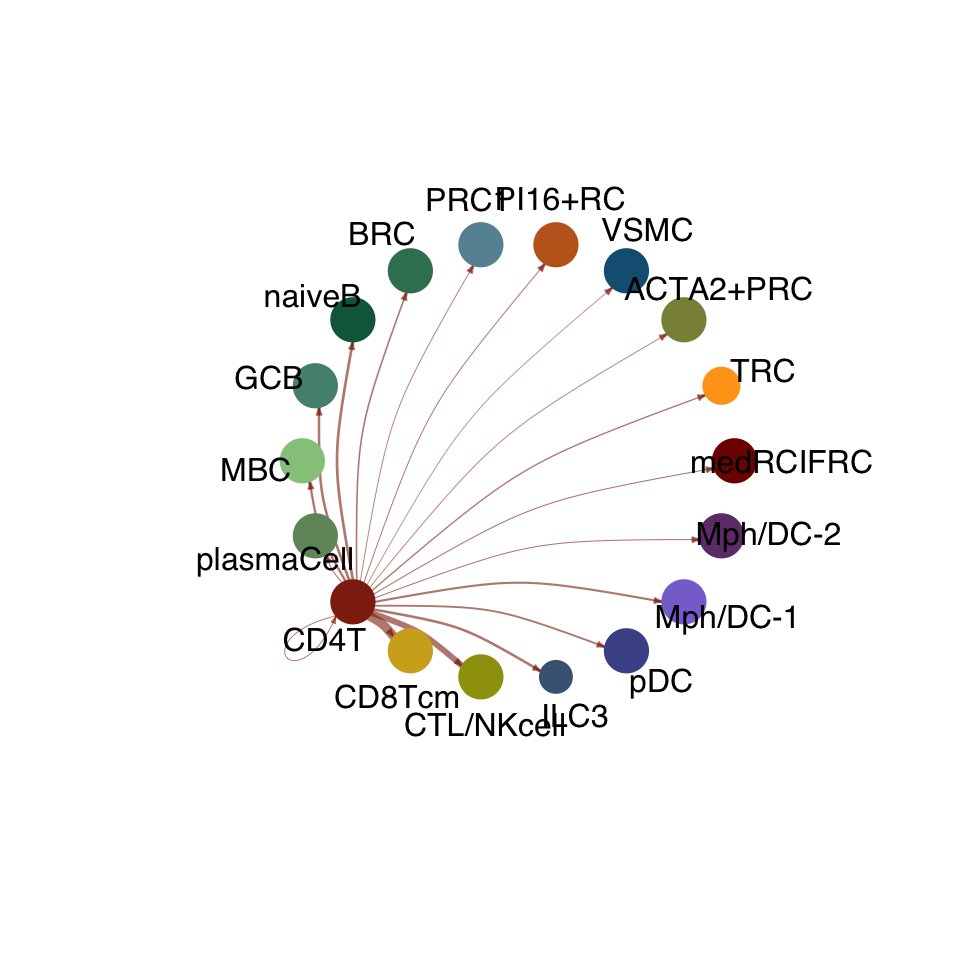
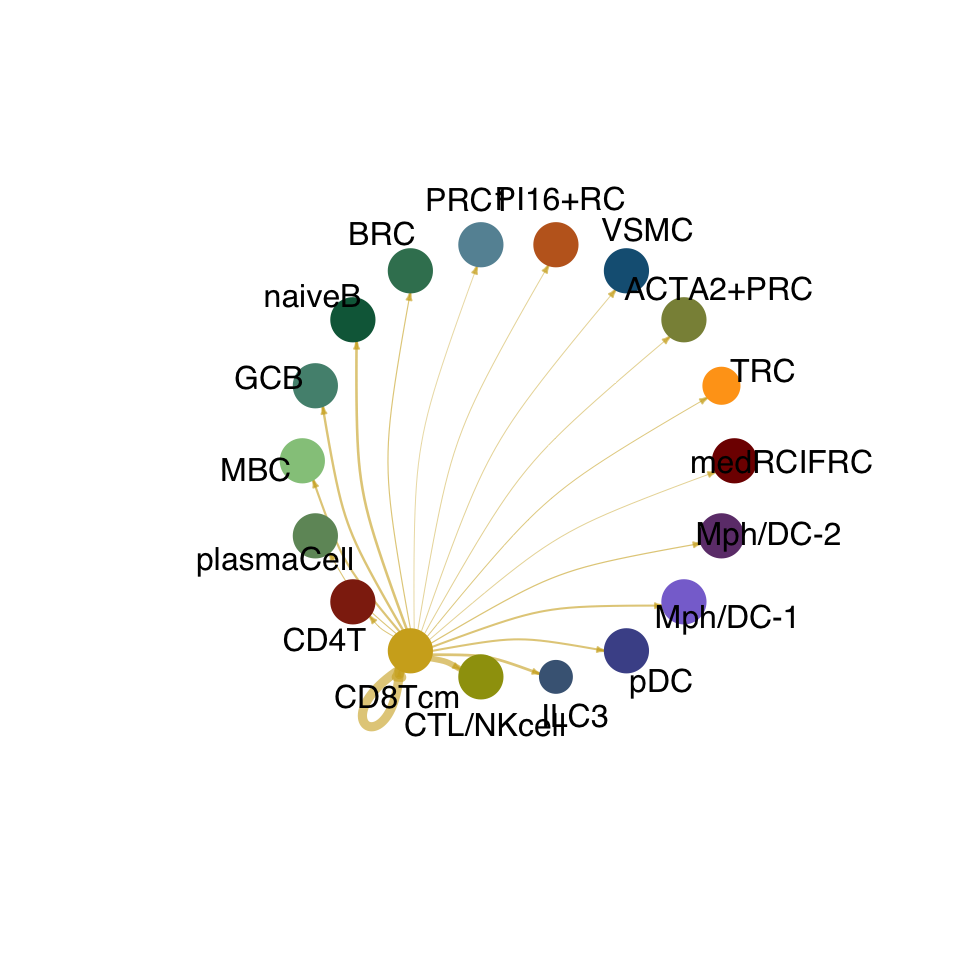
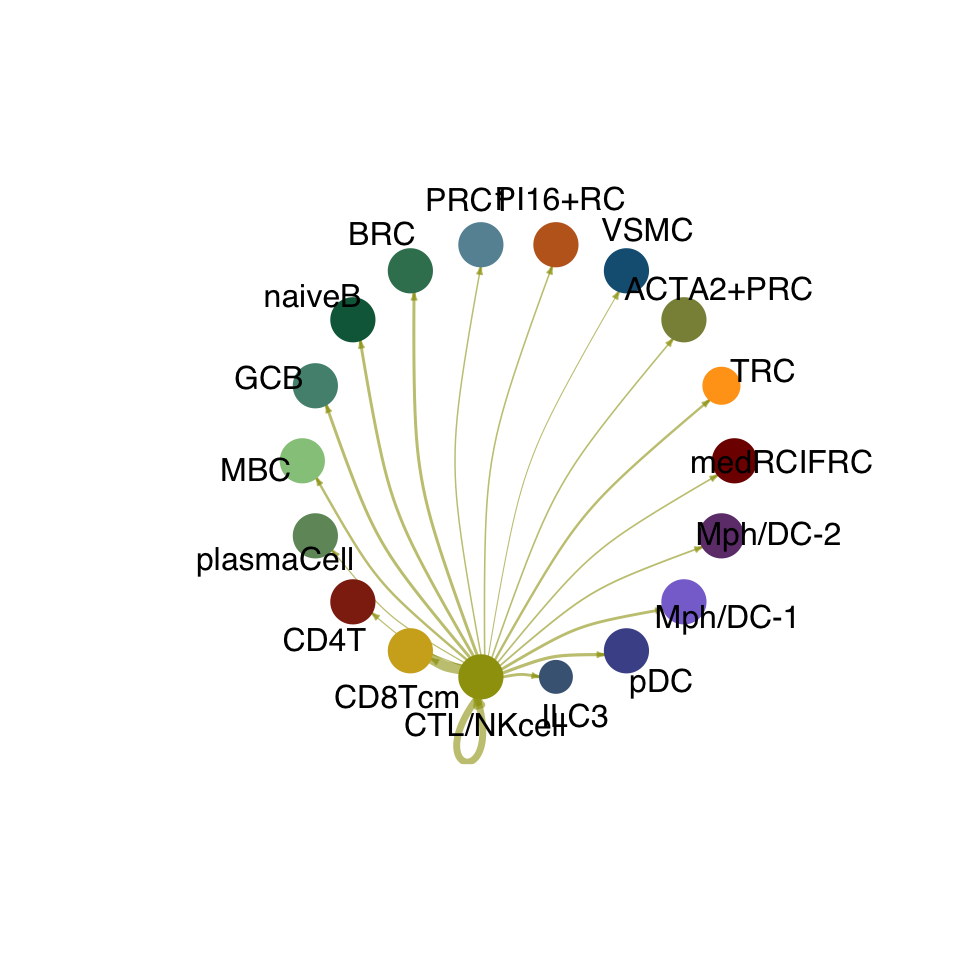
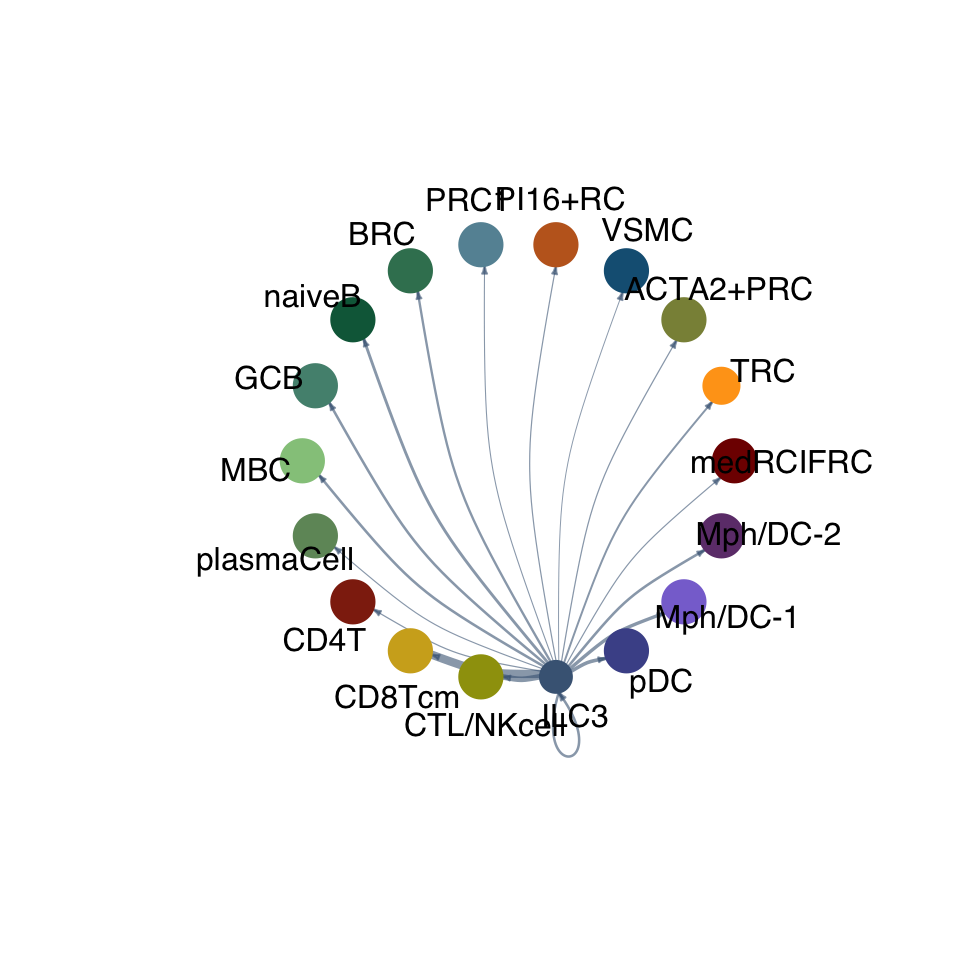
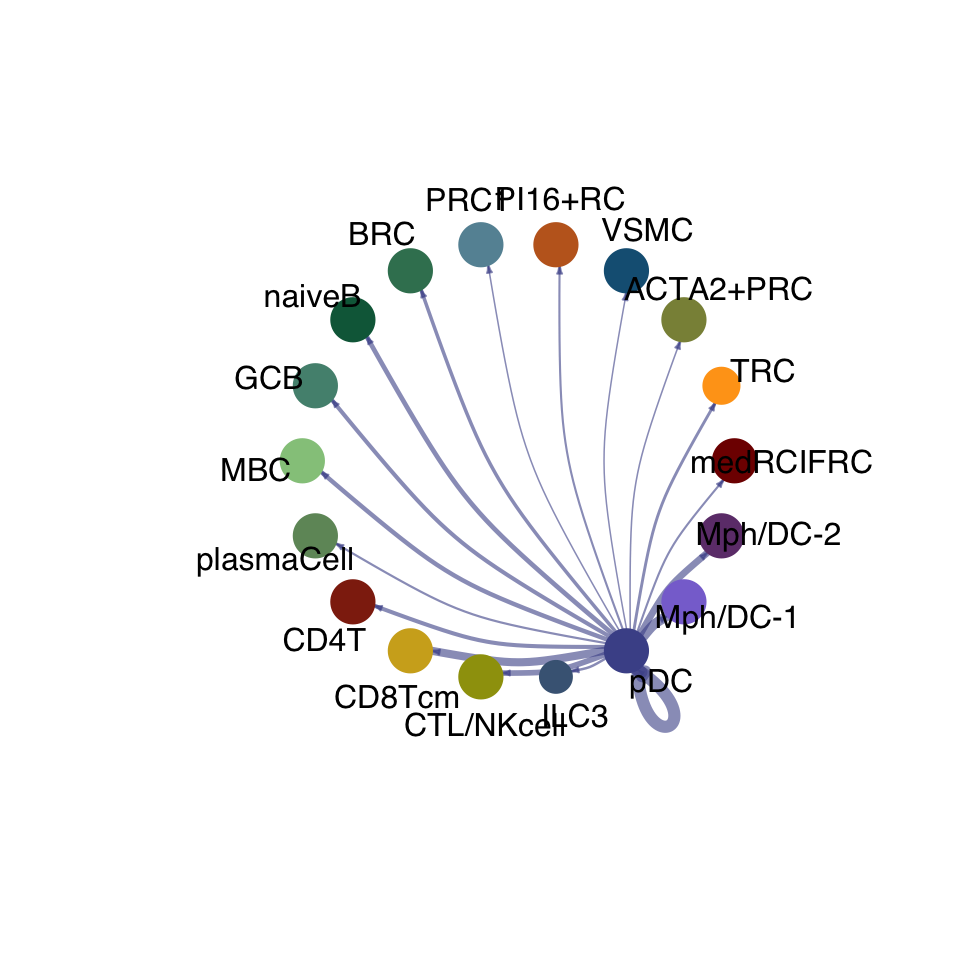
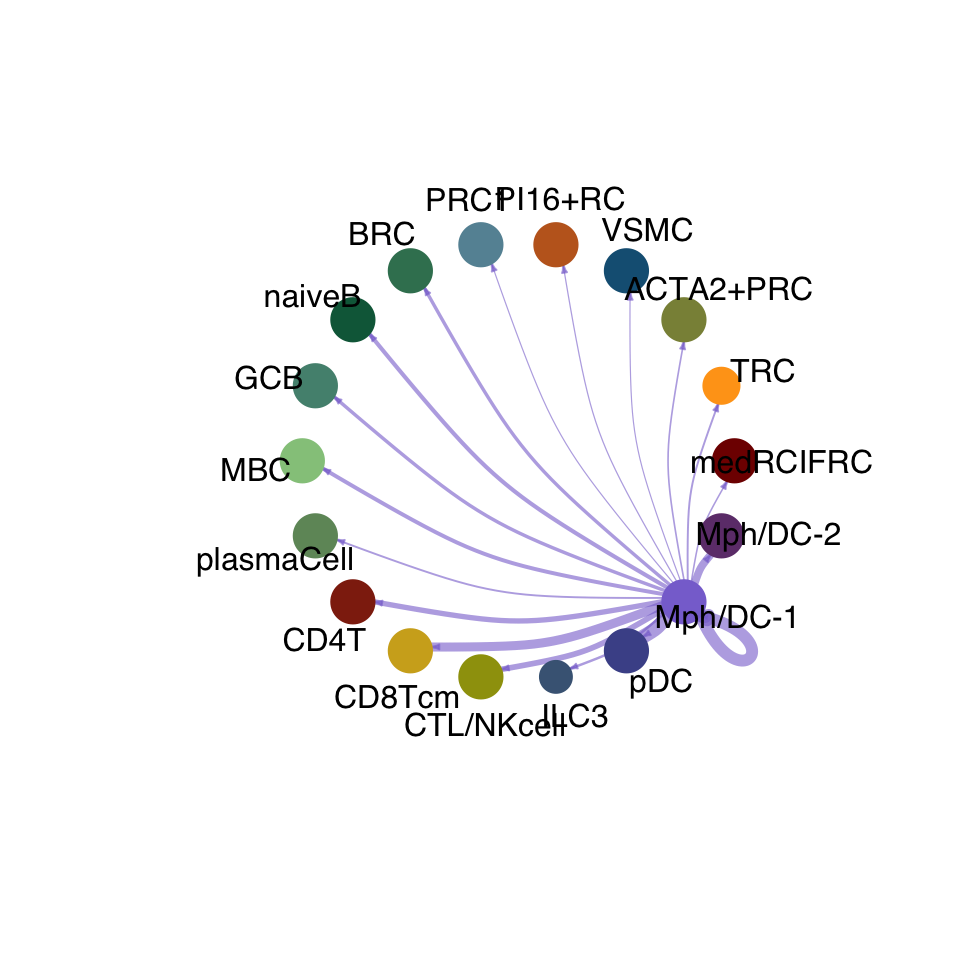
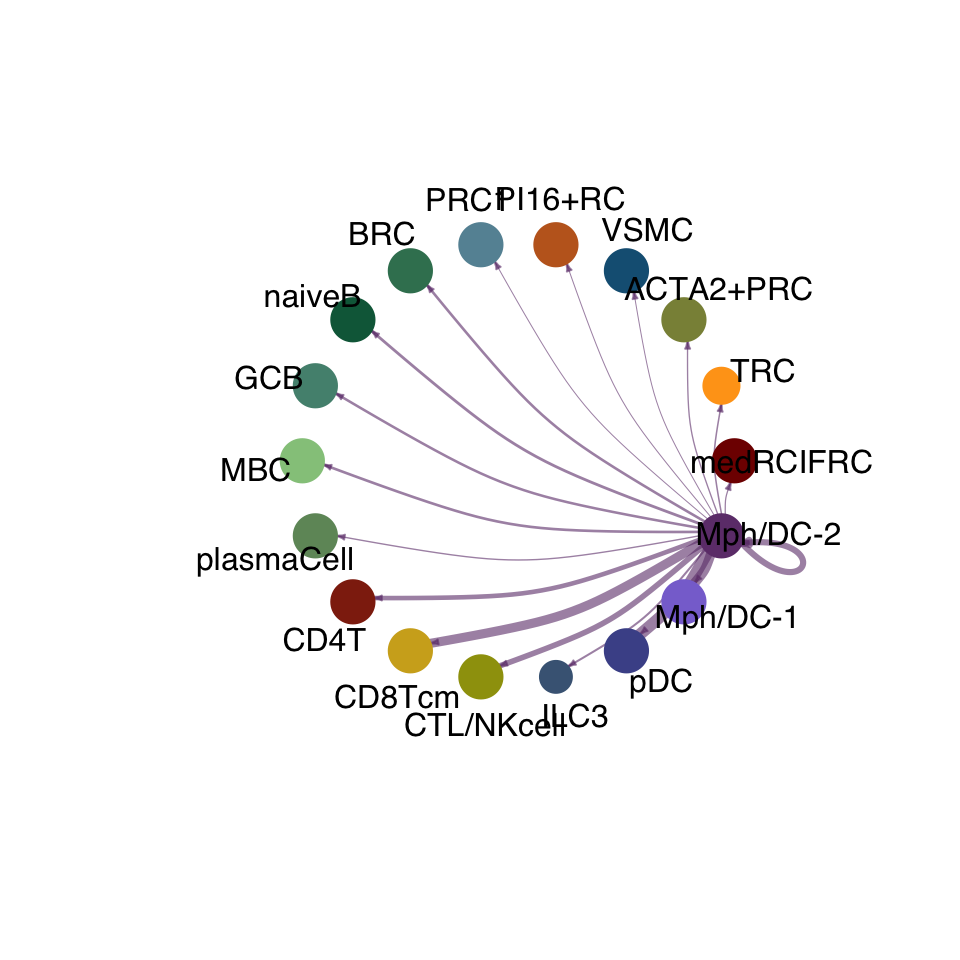
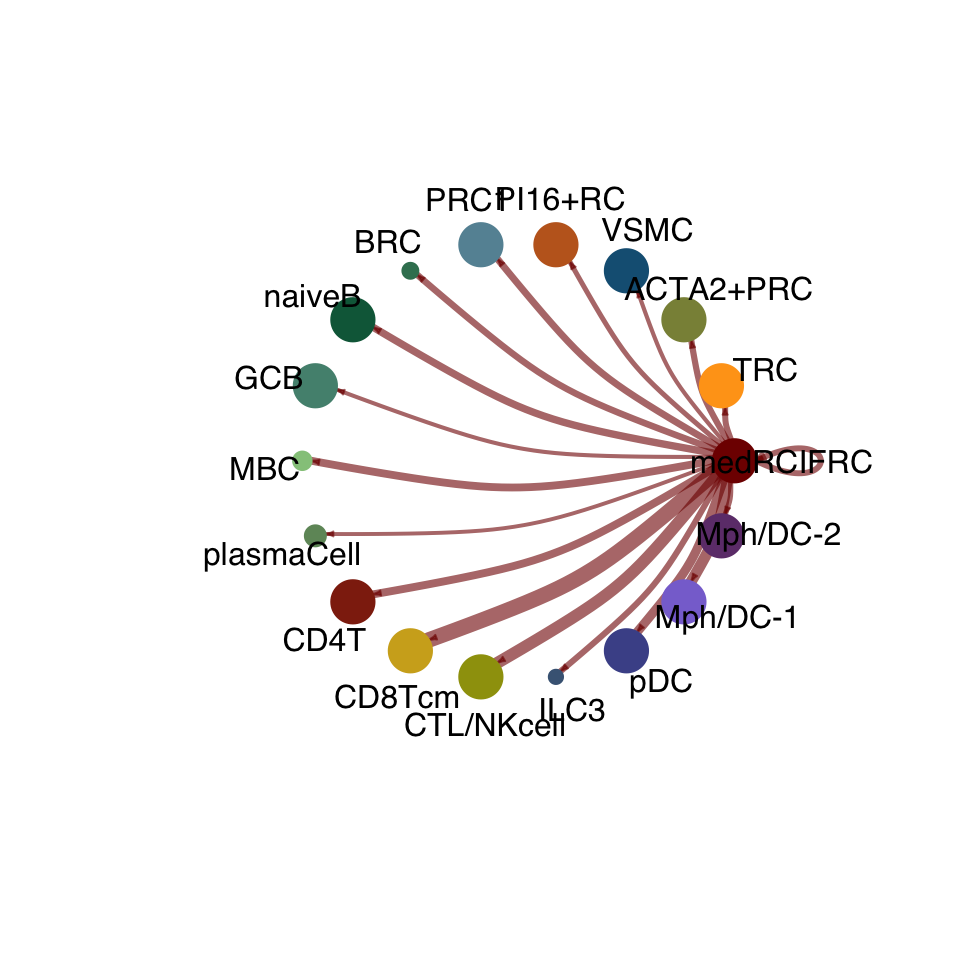
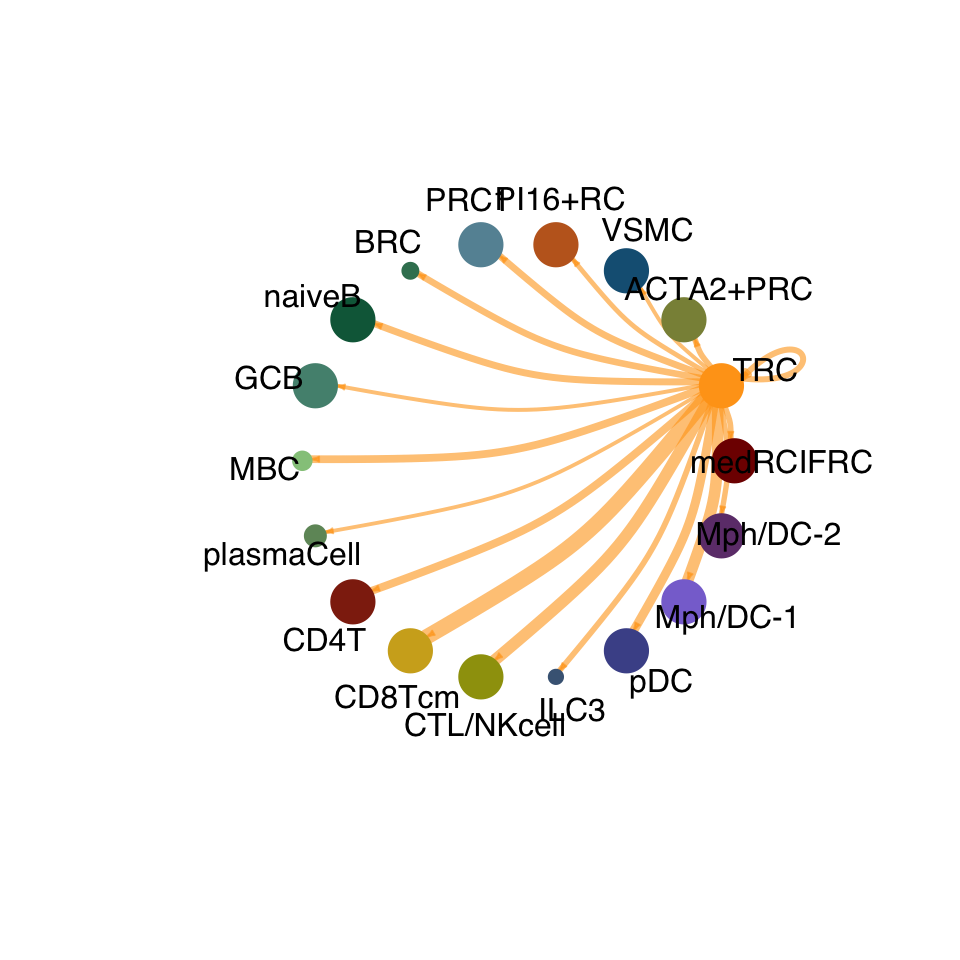
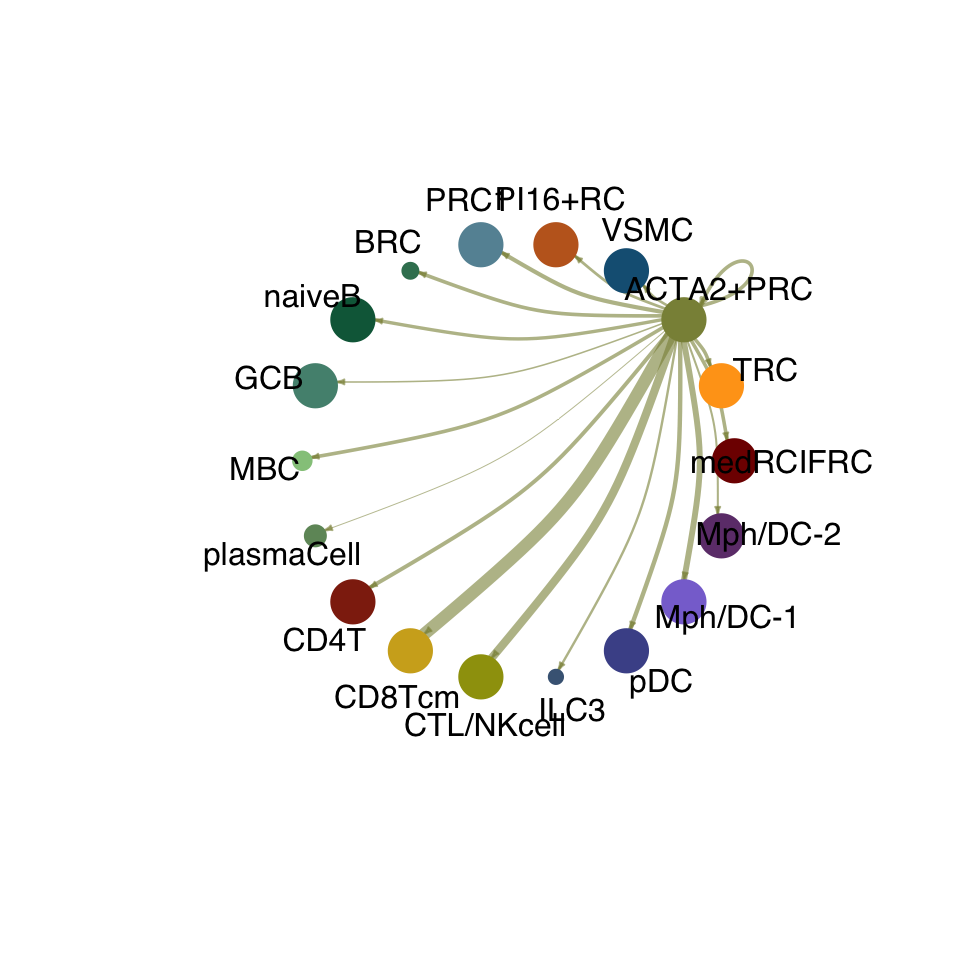
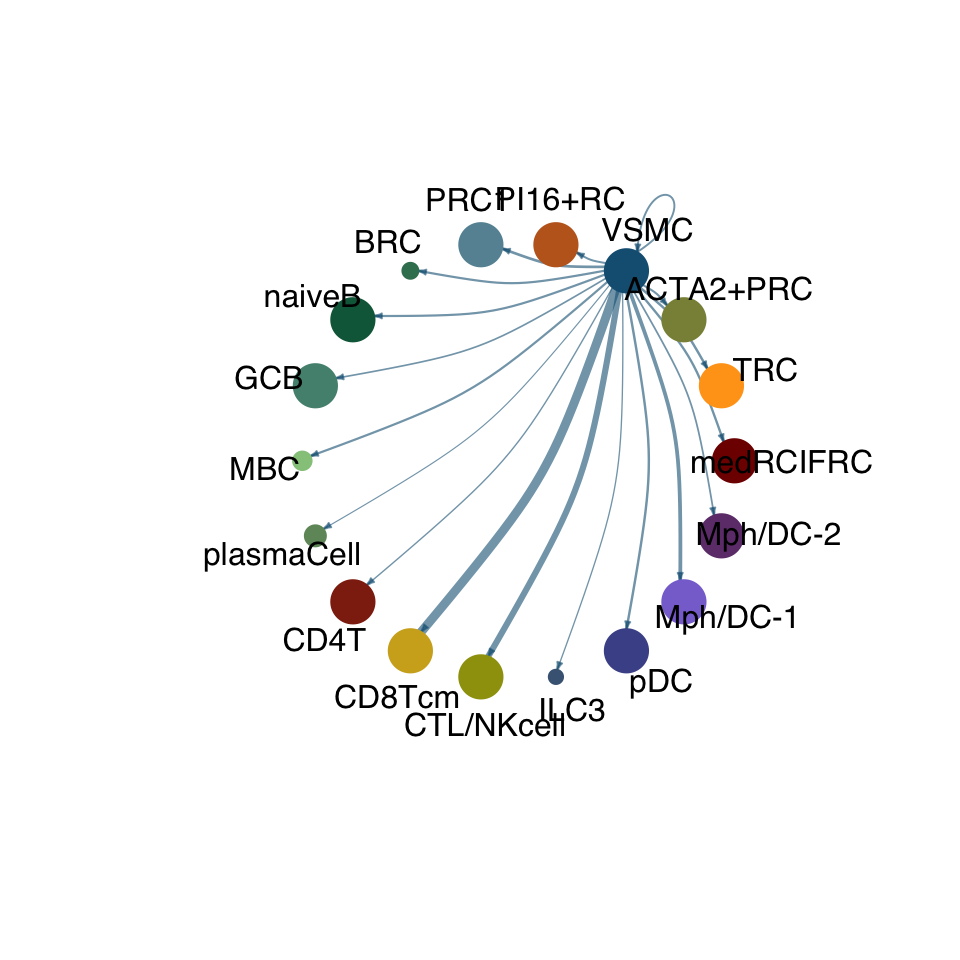
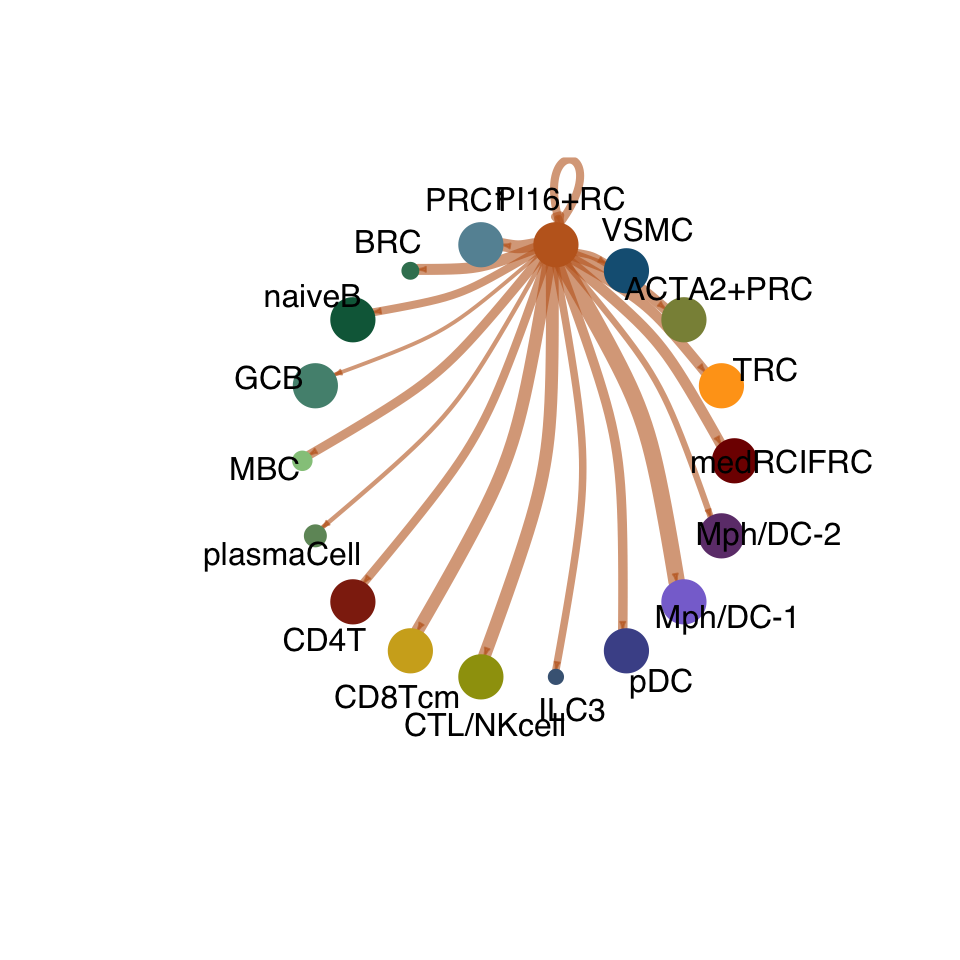
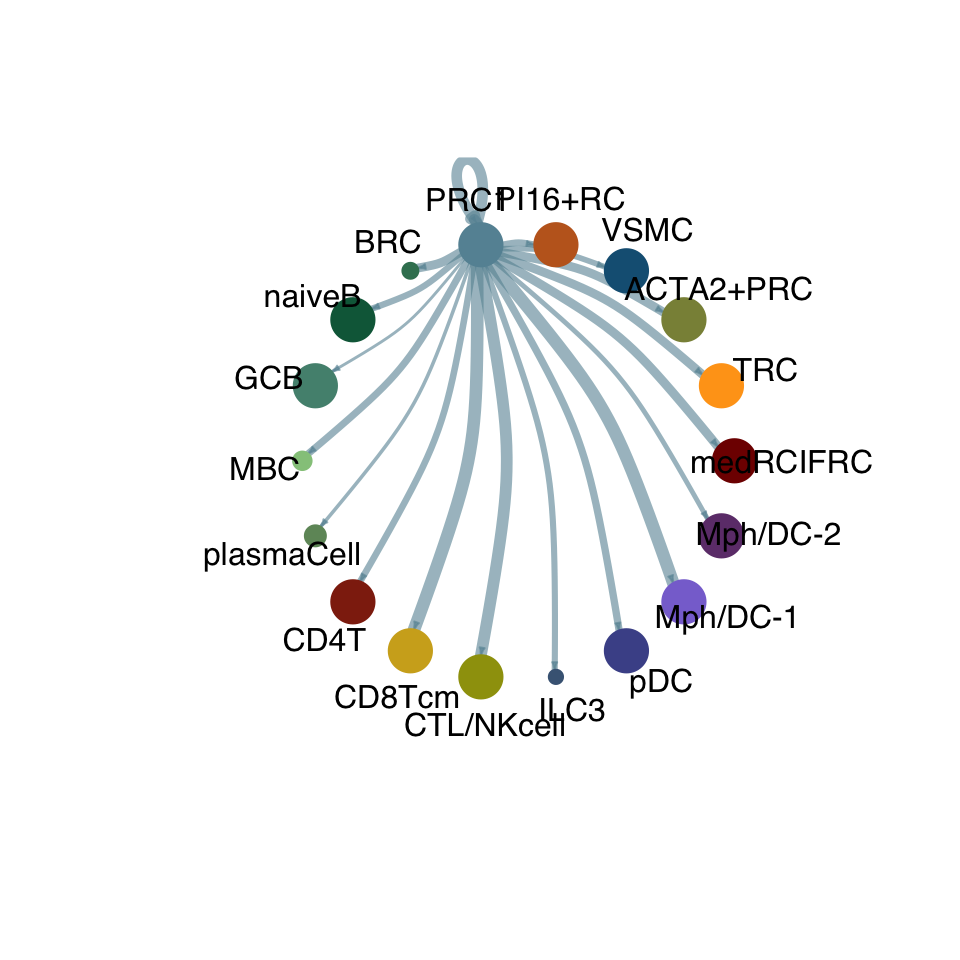
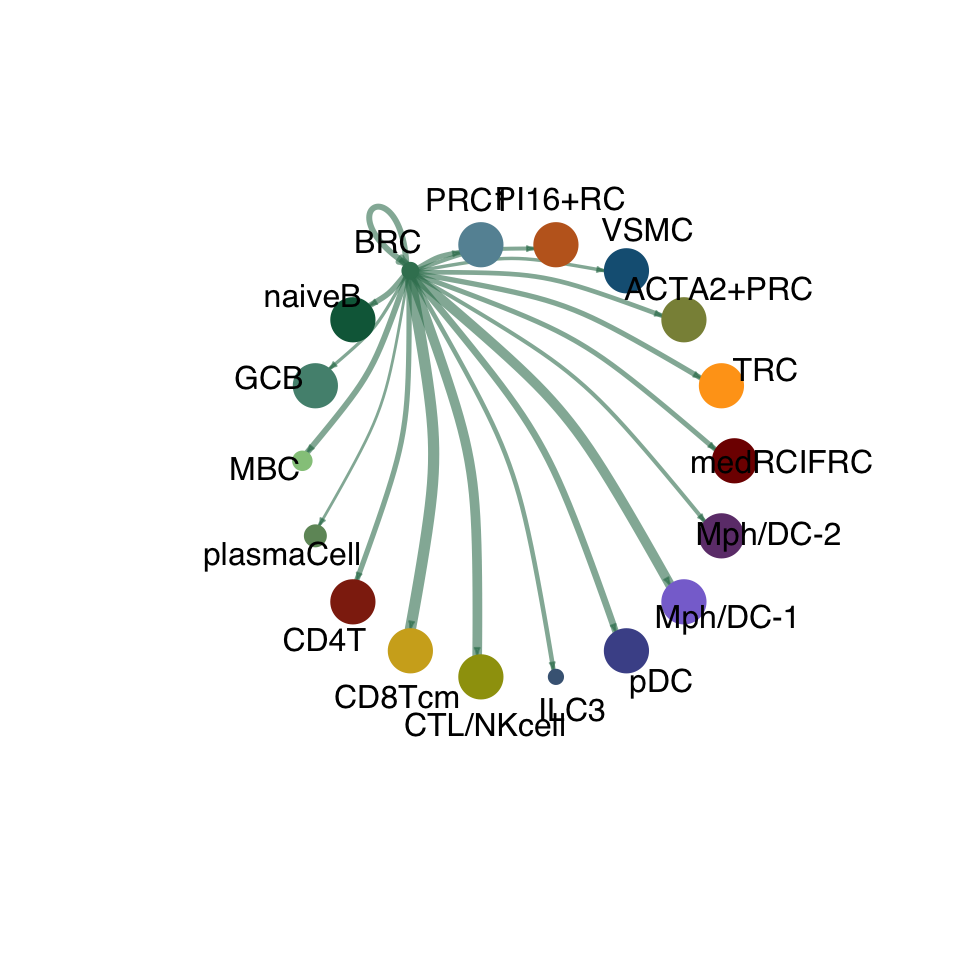
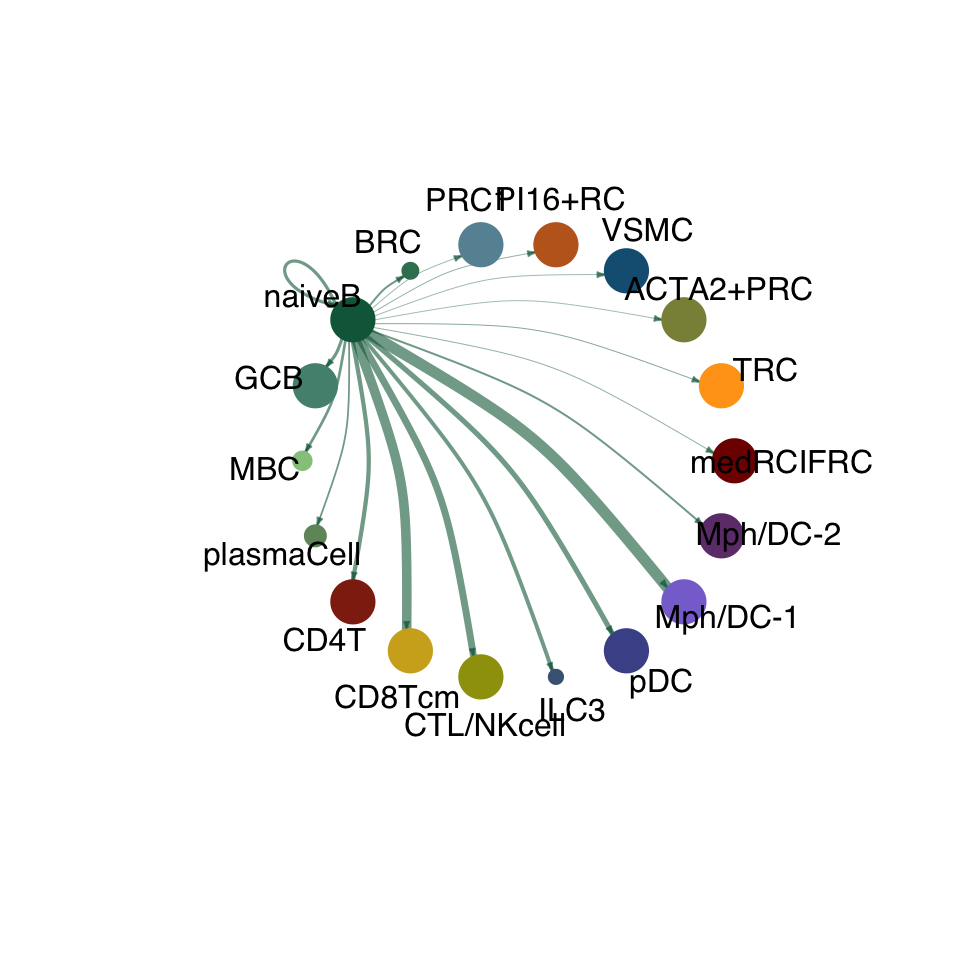
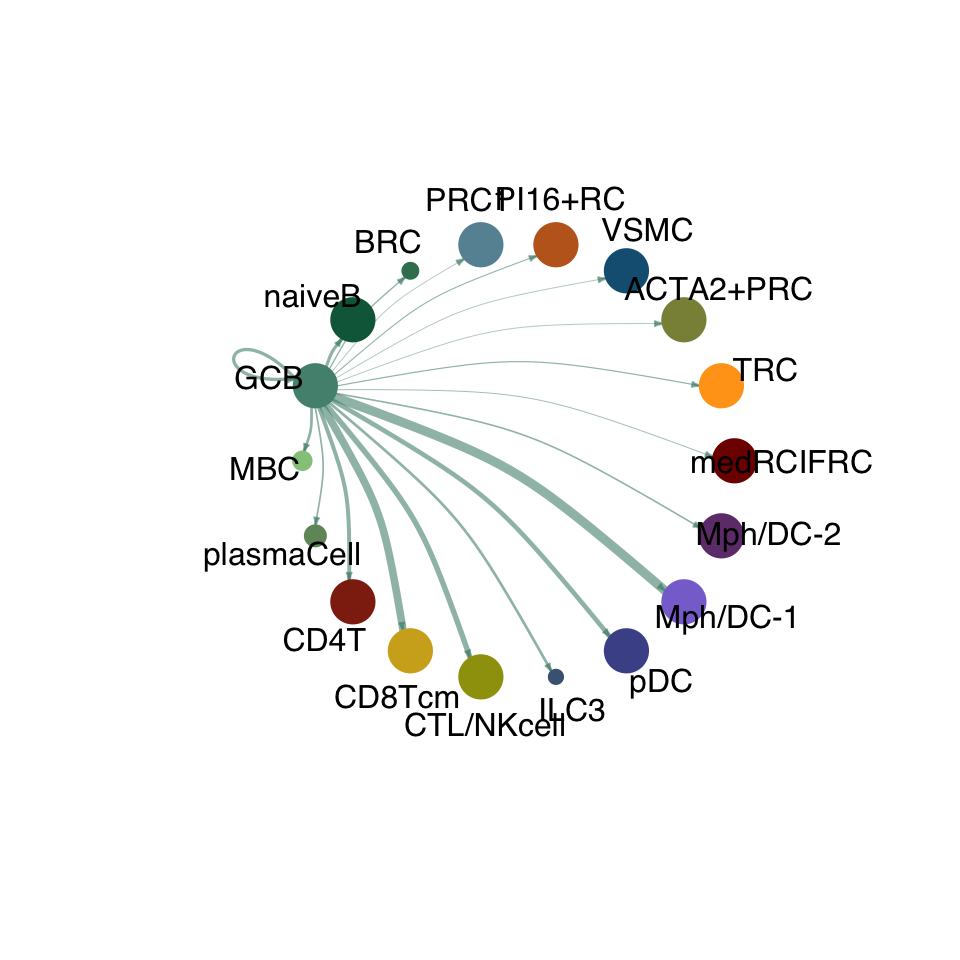
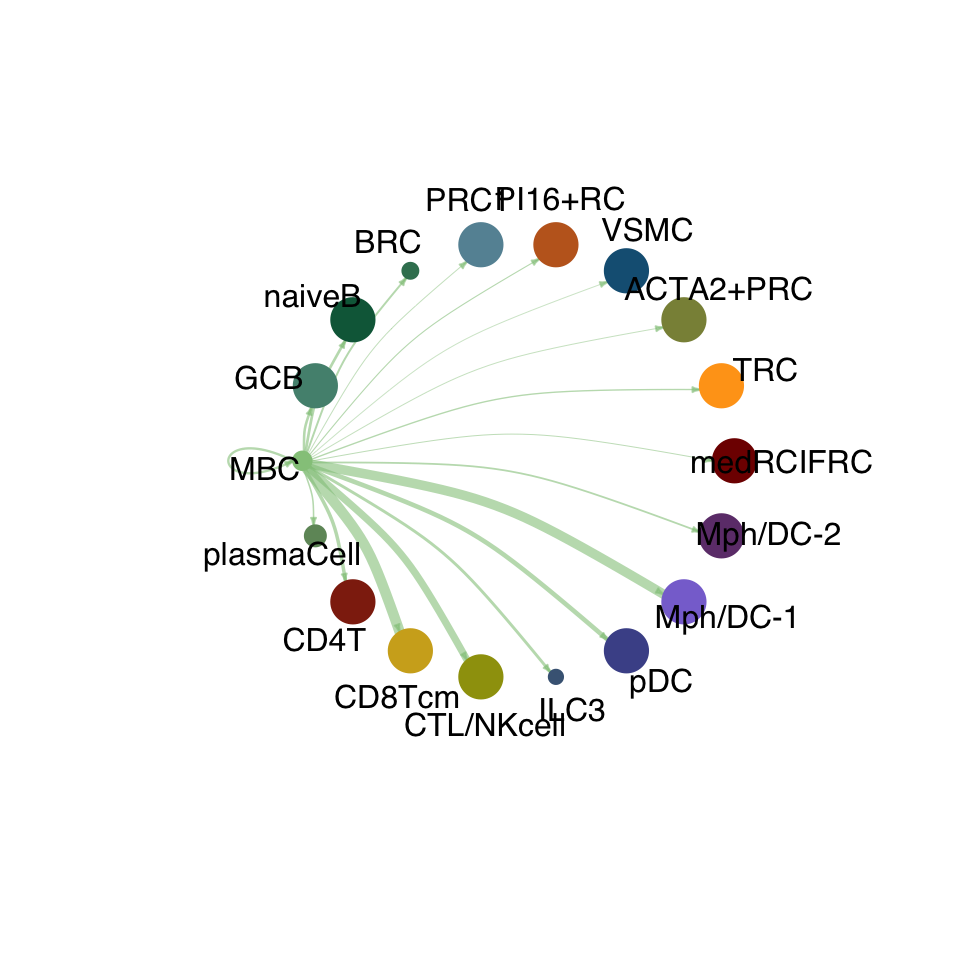
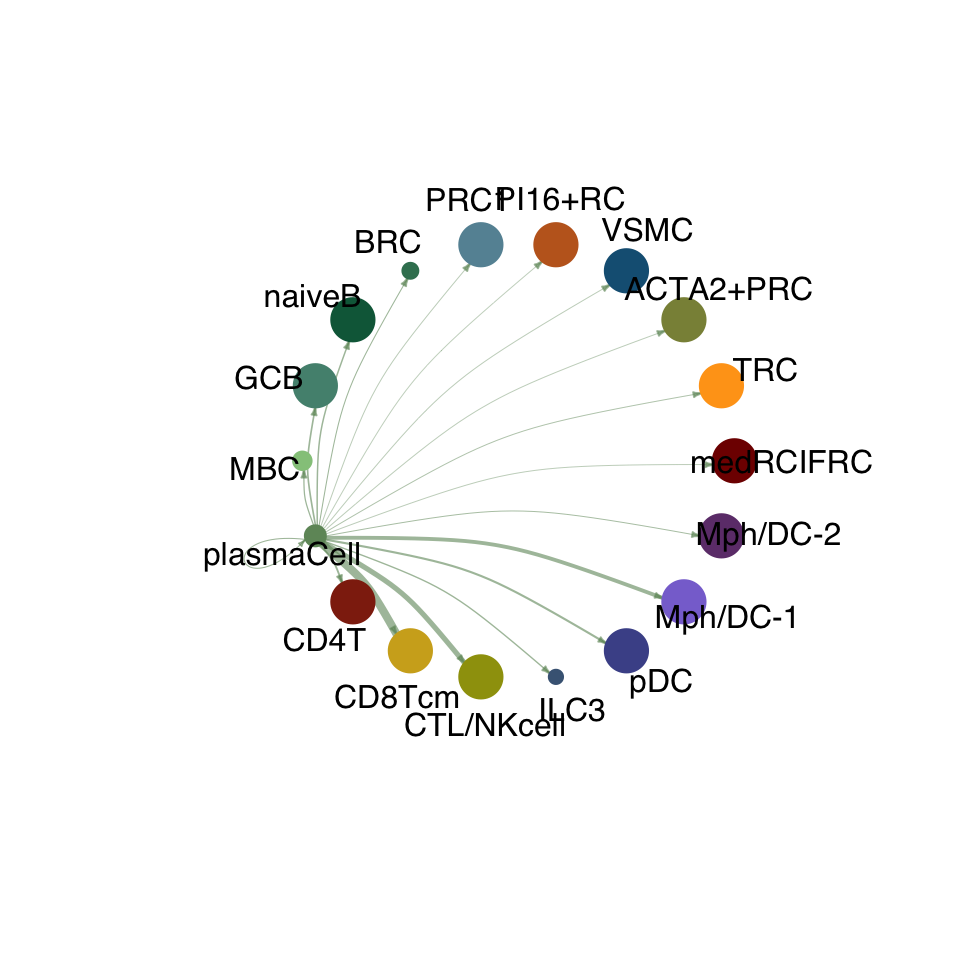
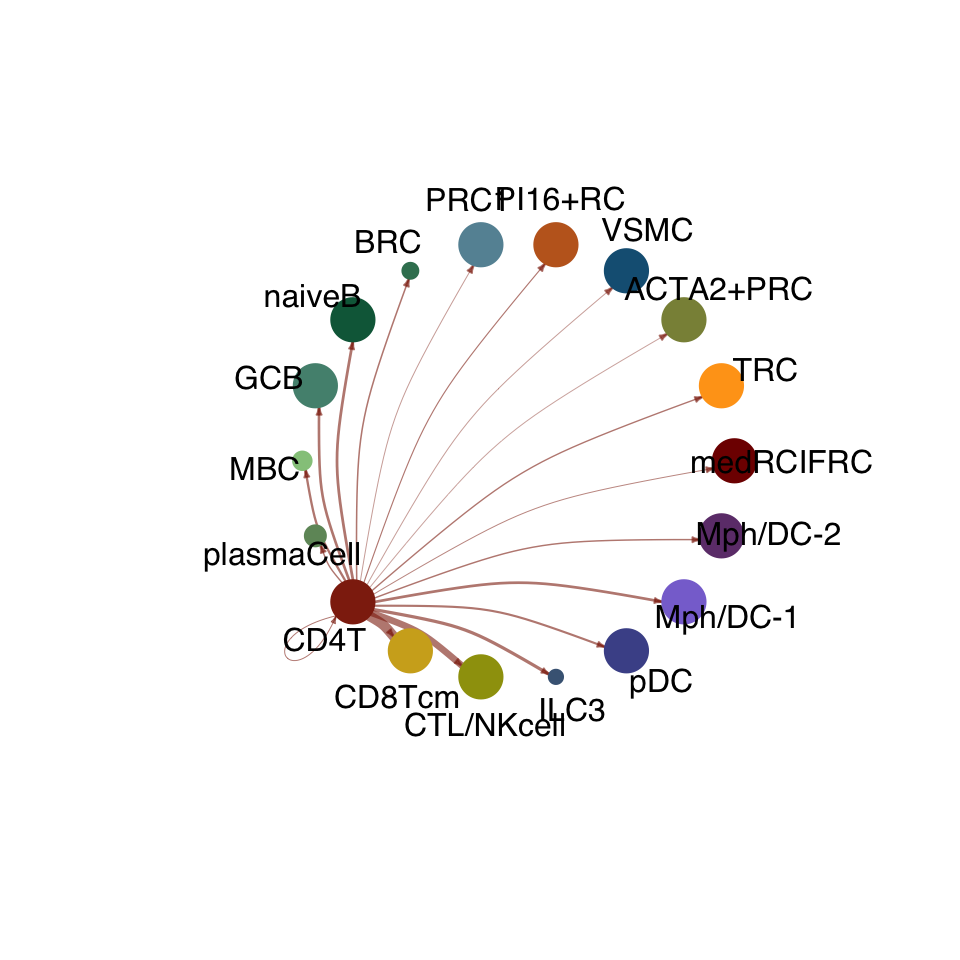
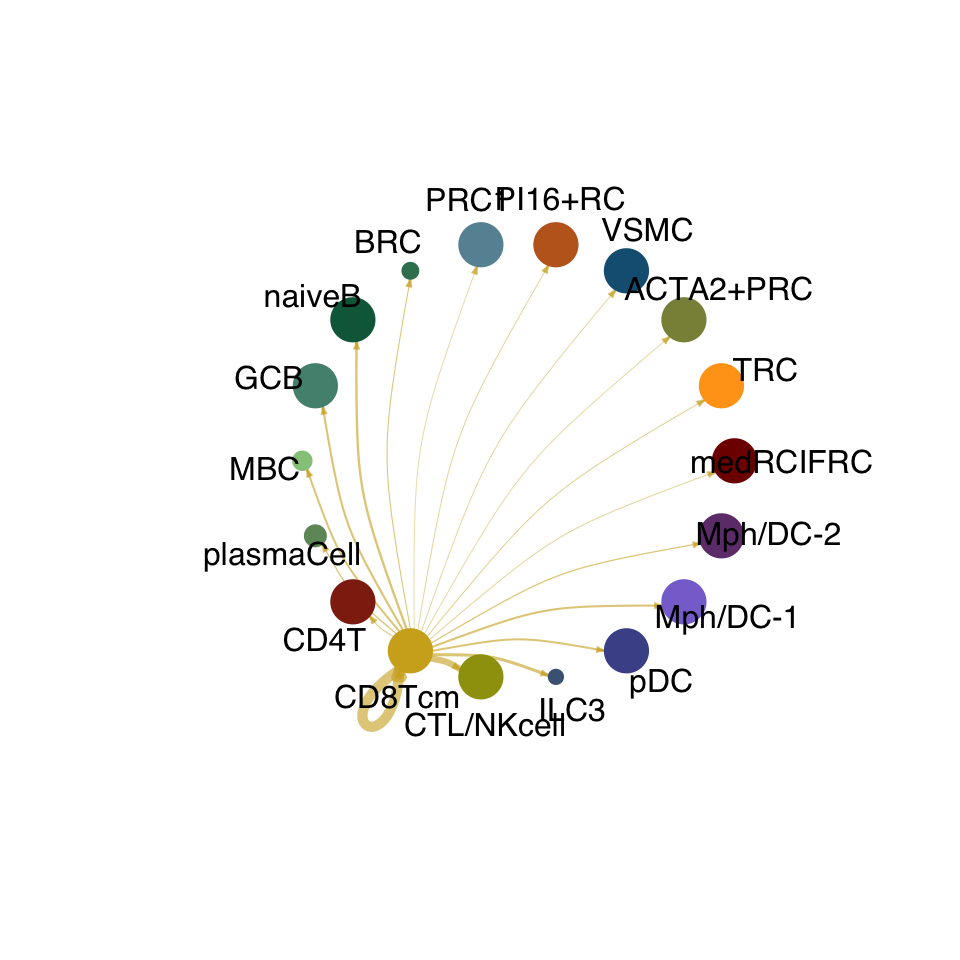
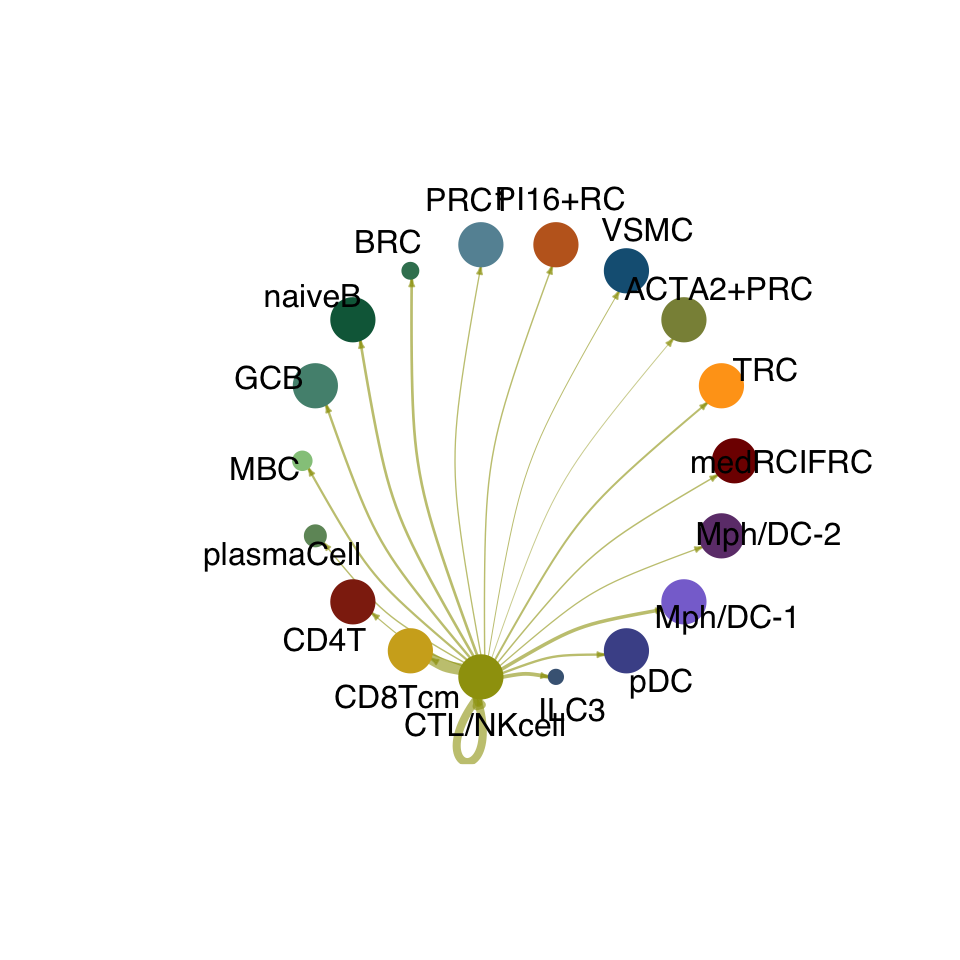
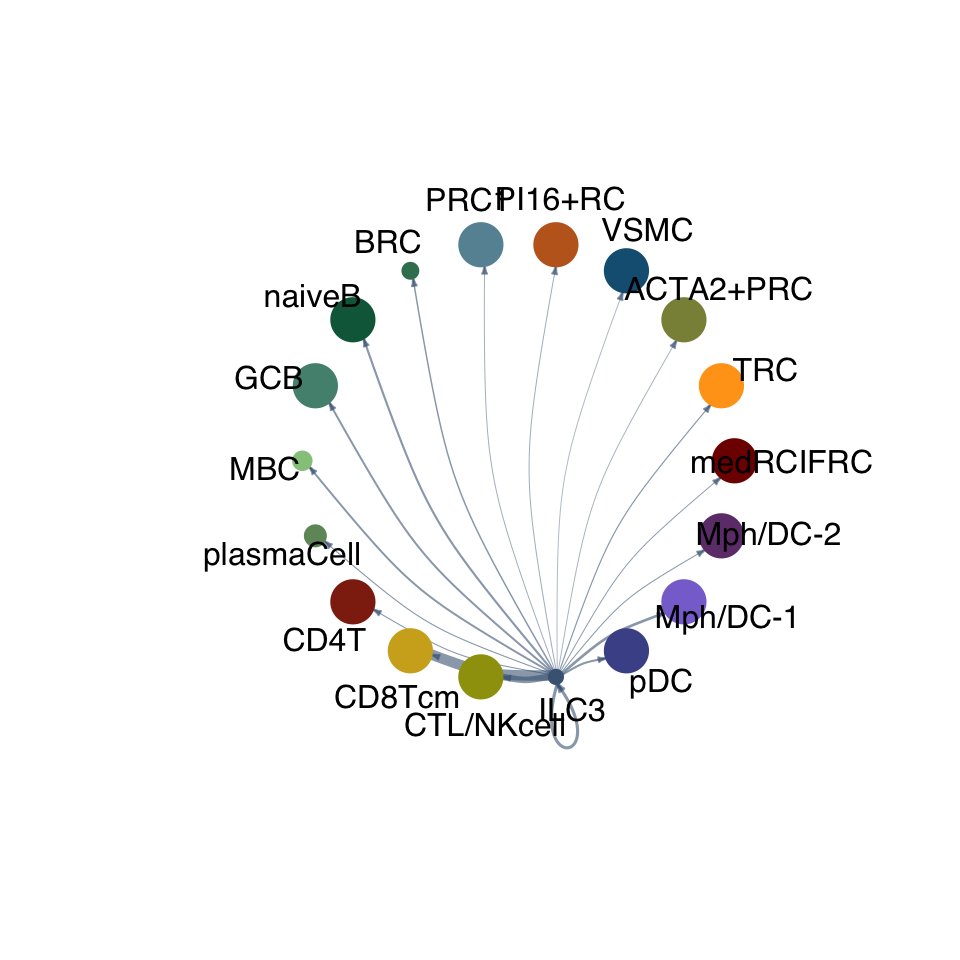
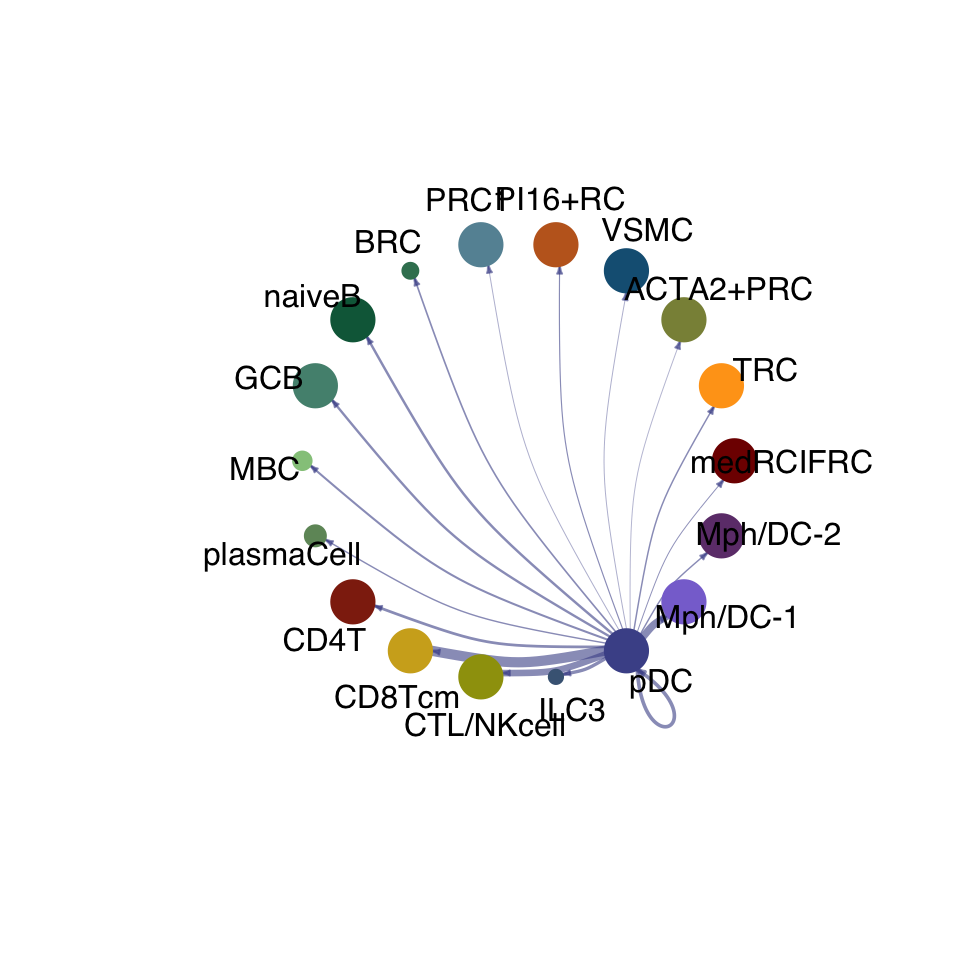
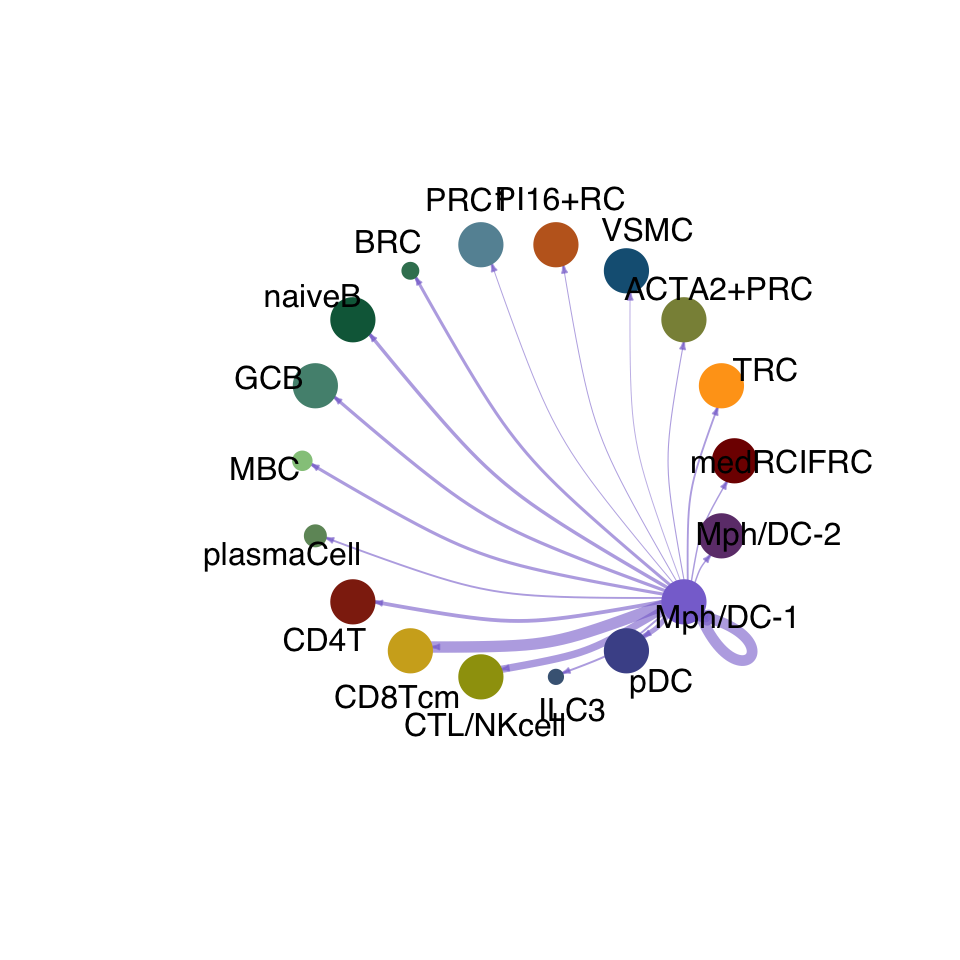
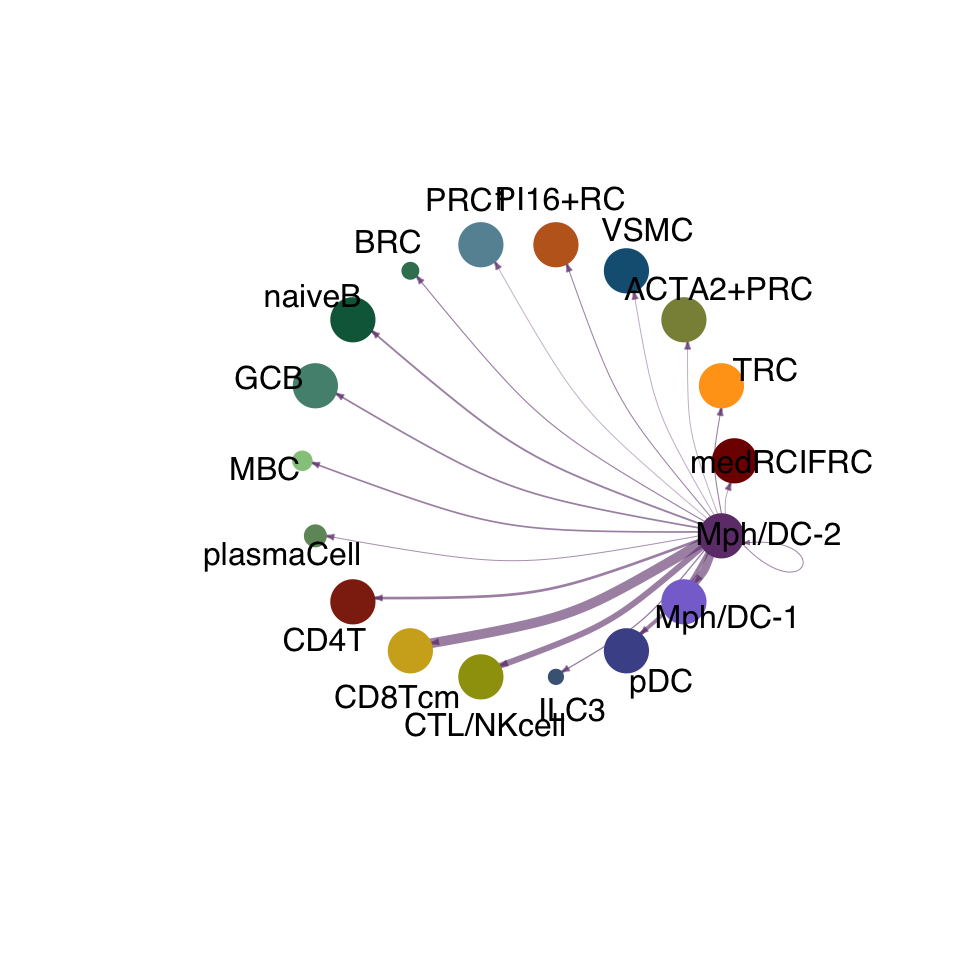
cellchat.res <- netAnalysis_computeCentrality(cellchat.res, slot.name = "netP")vis int partner rest
groupSize <- as.numeric(table(cellchat.res@idents))
matPre <- cellchat.res@net$weight
mat <- matPre[names(colAll), names(colAll)]
for (i in 1:nrow(mat)) {
  mat2 <- matrix(0, nrow = nrow(mat), ncol = ncol(mat), dimnames = dimnames(mat))
  mat2[i, ] <- mat[i, ]
  netVisual_circle(mat2, vertex.weight = groupSize, weight.scale = T,
                   edge.weight.max = max(mat), title.name = rownames(mat)[i],
                   color.use = colAll)
}
compute communication probability act
cellchat.act <- computeCommunProb(cellchat.act, type = "truncatedMean")truncatedMean is used for calculating the average gene expression per cell group.
[1] ">>> Run CellChat on sc/snRNA-seq data <<< [2024-03-13 22:57:25.050967]"
[1] ">>> CellChat inference is done. Parameter values are stored in `object@options$parameter` <<< [2024-03-13 23:08:37.2176]"cellchat.act <- filterCommunication(cellchat.act, min.cells = 10)
cellchat.act <- computeCommunProbPathway(cellchat.act)
df.net.act <- subsetCommunication(cellchat.act,
sources.use = c("PI16+RC", "PRC1", "ACTA2+PRC"),
targets.use = c("CD4T", "CTL/NKcell", "GCB",
"ILC3", "naiveB", "MBC",
"plasmaCell", "CD8Tcm" ,
"Mph/DC-1", "Mph/DC-2"))
df.net2.act <- subsetCommunication(cellchat.act, sources.use = c("CD4T",
"CTL/NKcell",
"GCB",
"ILC3", "naiveB", "MBC",
"plasmaCell", "CD8Tcm",
"Mph/DC-1", "Mph/DC-2"),
targets.use = c("PI16+RC", "PRC1", "ACTA2+PRC"))
cellchat.act <- aggregateNet(cellchat.act)
cellchat.act <- netAnalysis_computeCentrality(cellchat.act, slot.name = "netP")vis int partner act
groupSize <- as.numeric(table(cellchat.act@idents))
matPre <- cellchat.act@net$weight
mat <- matPre[names(colAll), names(colAll)]
for (i in 1:nrow(mat)) {
  mat2 <- matrix(0, nrow = nrow(mat), ncol = ncol(mat), dimnames = dimnames(mat))
  mat2[i, ] <- mat[i, ]
  netVisual_circle(mat2, vertex.weight = groupSize, weight.scale = T,
                   edge.weight.max = max(mat), title.name = rownames(mat)[i],
                   color.use = colAll)
}
compare interaction counts/strength
object.list <- list(act = cellchat.act, res = cellchat.res)
cellchat.merge <- mergeCellChat(object.list, add.names = names(object.list))

colCond3 <- colCond2
names(colCond3) <- c("res", "act")
gg1 <- compareInteractions(cellchat.merge, show.legend = F,
                           group = c("act","res")) +
  scale_fill_manual(values = colCond3)
gg2 <- compareInteractions(cellchat.merge, show.legend = F,
                           group = c("act","res"), measure = "weight") +
  scale_fill_manual(values = colCond3)
gg1 + gg2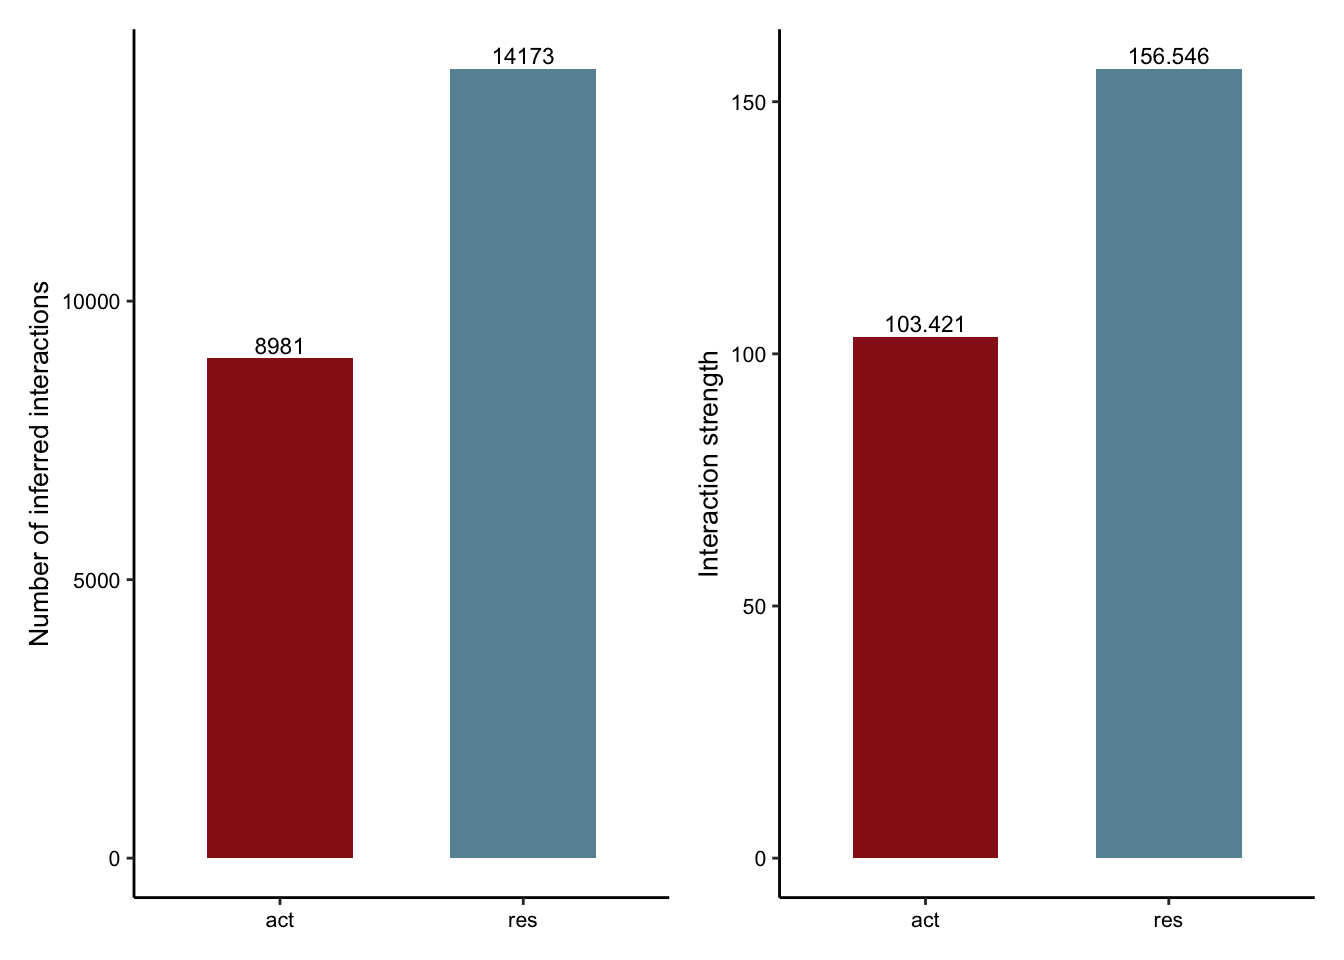
netVisual_diffInteraction(cellchat.merge, weight.scale = T)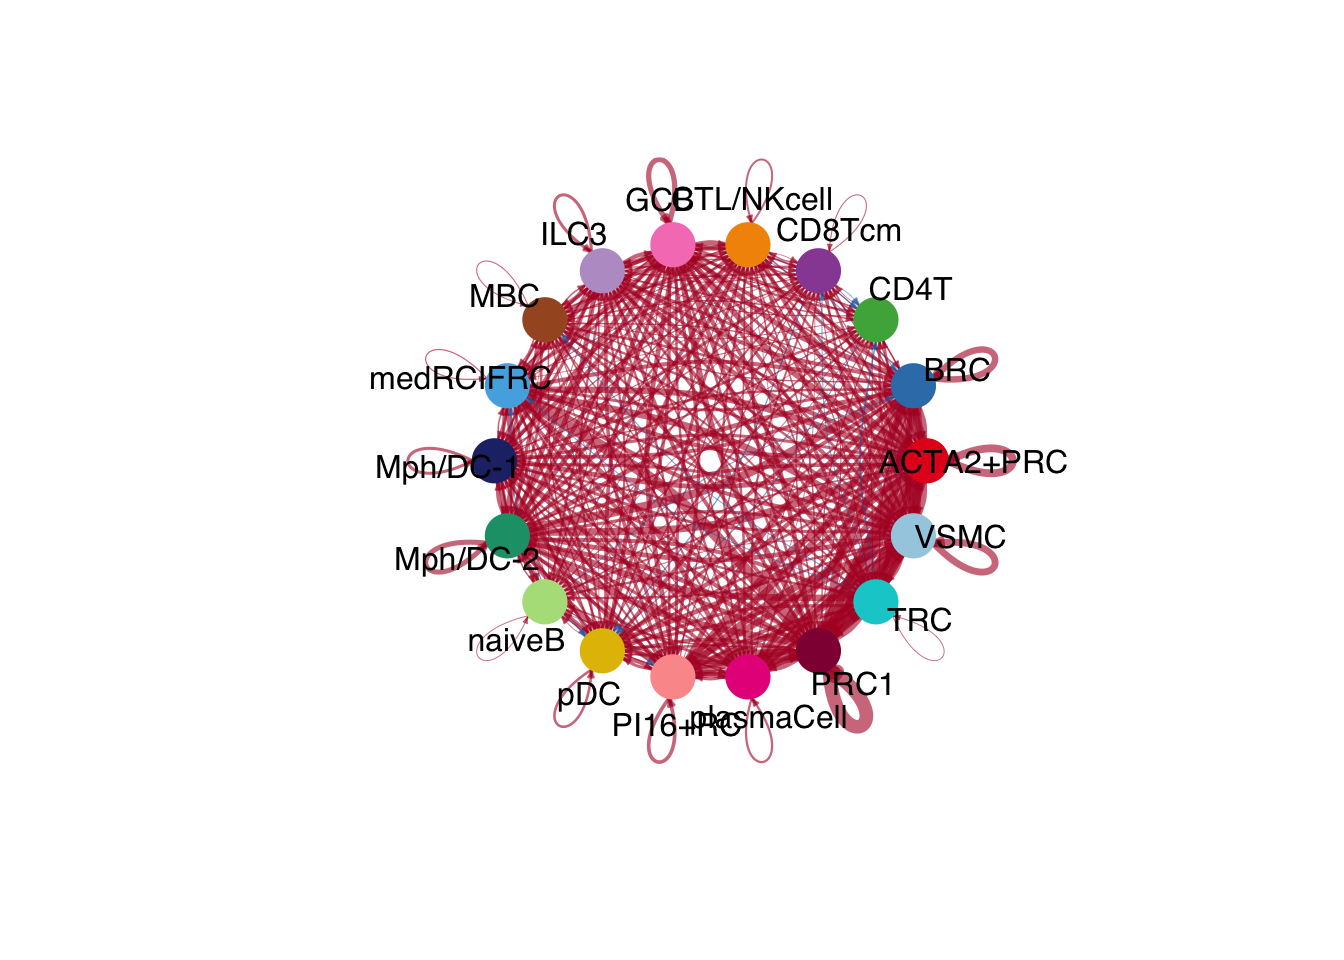
netVisual_diffInteraction(cellchat.merge, weight.scale = T, measure = "weight")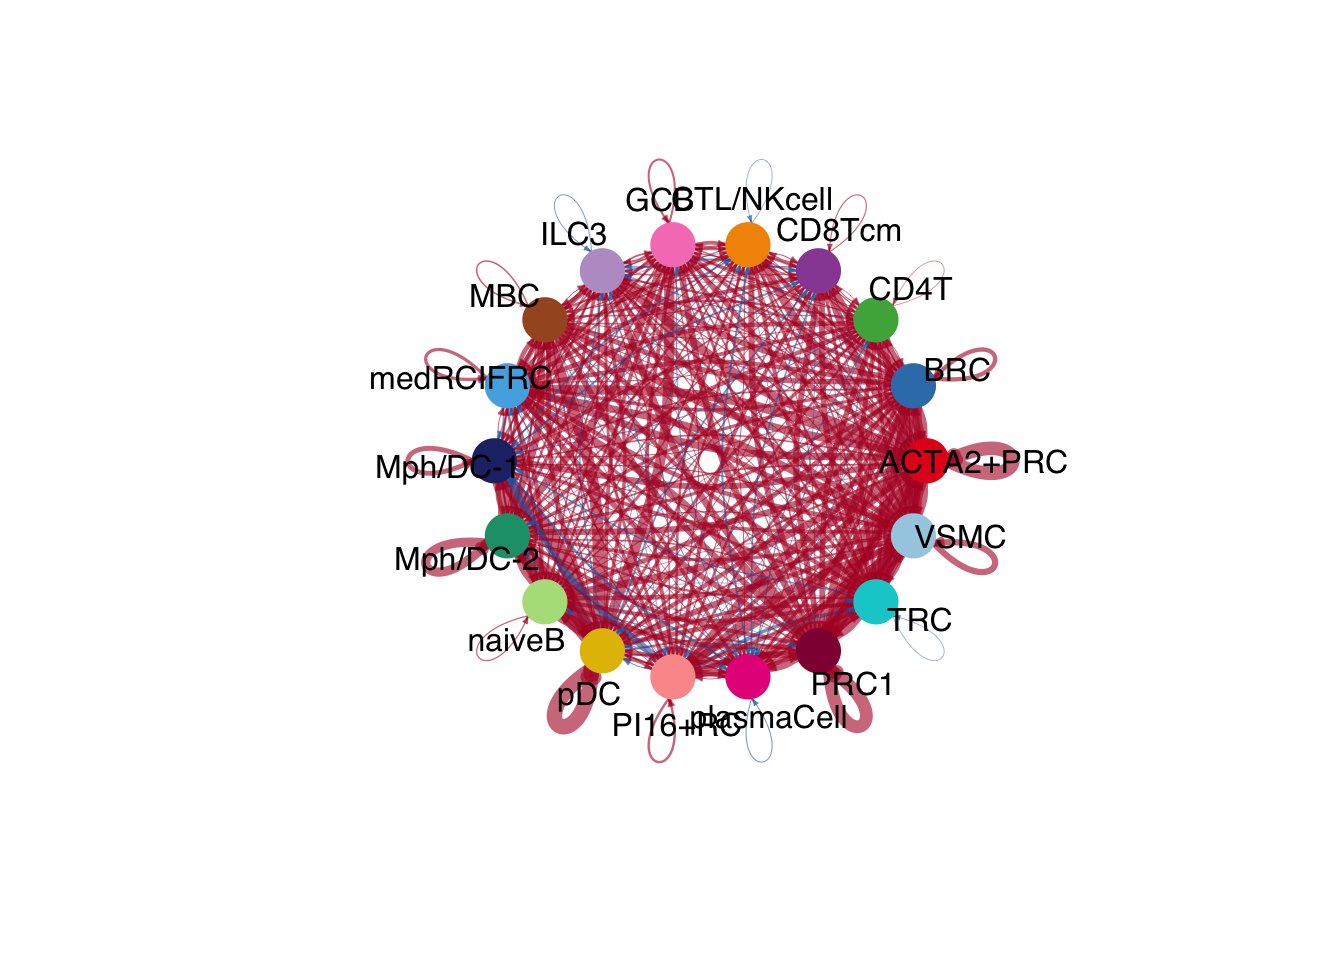
gg1 <- netVisual_heatmap(cellchat.merge)
gg2 <- netVisual_heatmap(cellchat.merge, measure = "weight")
gg1 + gg2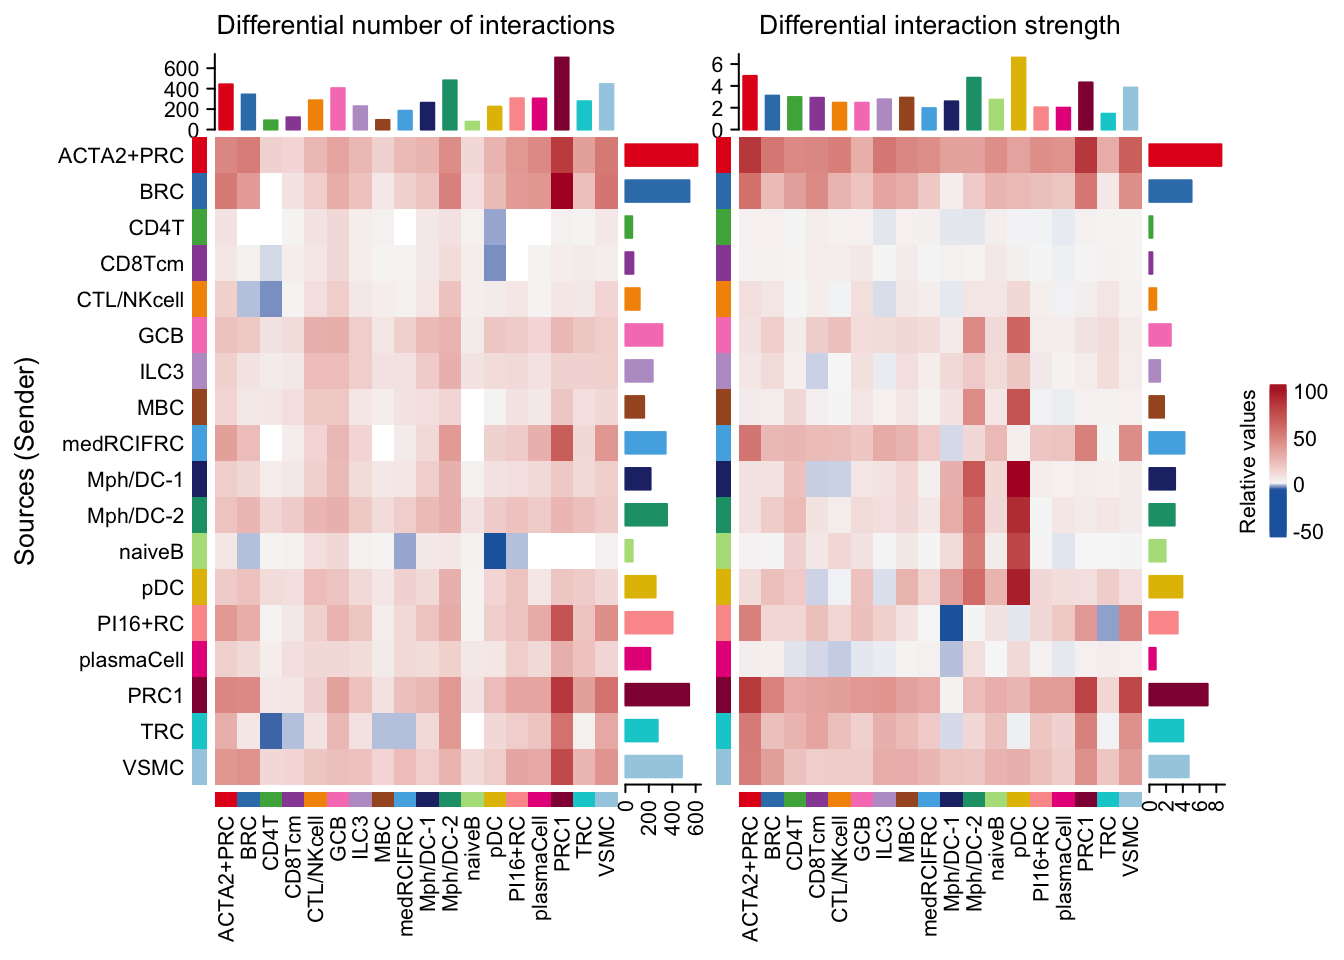
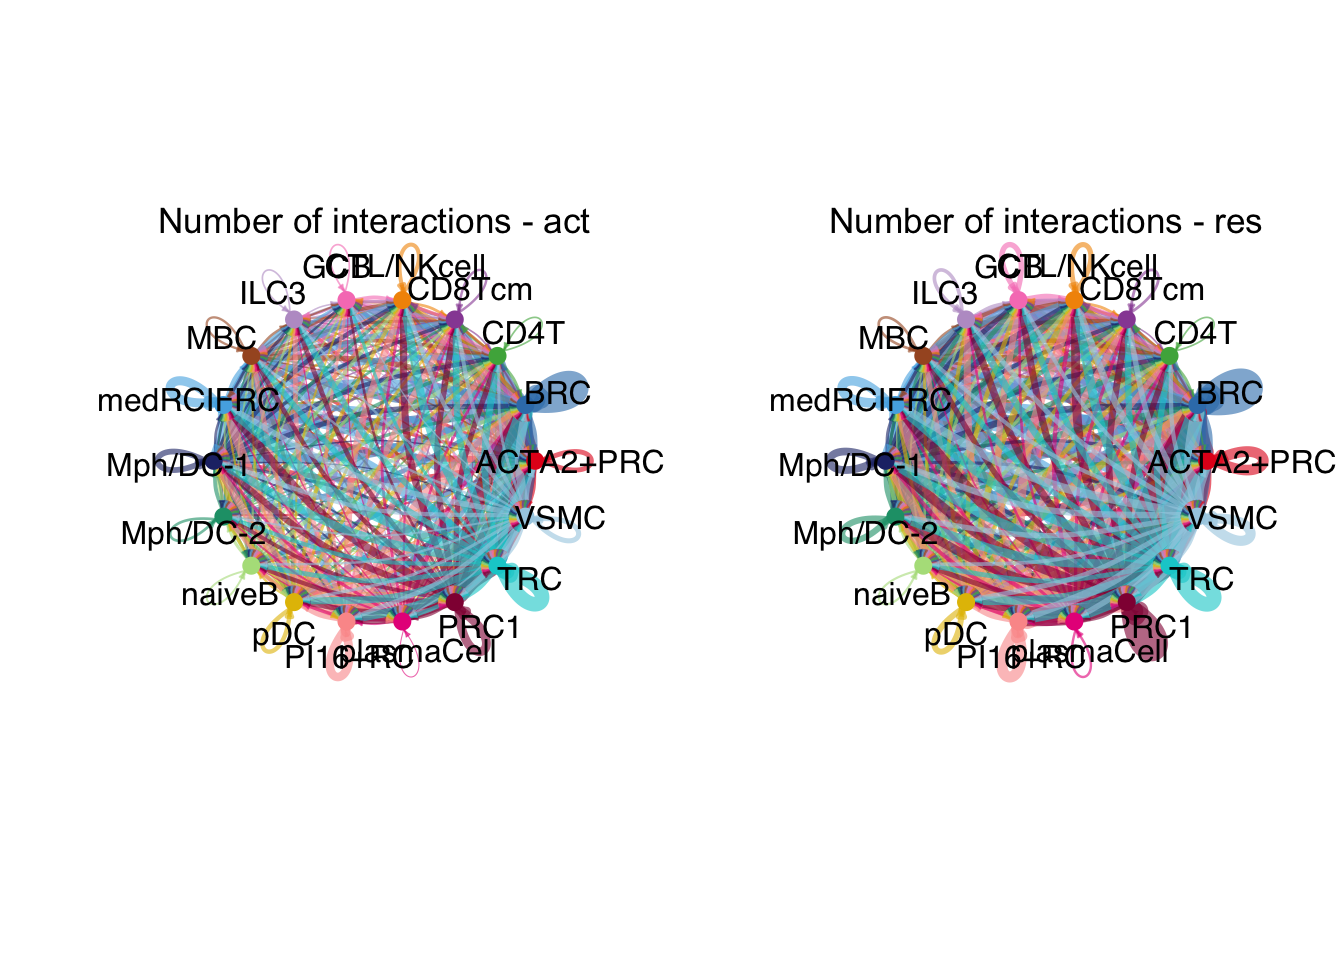
weight.max <- getMaxWeight(object.list, attribute = c("idents","count"))
par(mfrow = c(1,2), xpd=TRUE)
for (i in 1:length(object.list)) {
  netVisual_circle(object.list[[i]]@net$count, weight.scale = T, label.edge= F,
                   edge.weight.max = weight.max[2], edge.width.max = 12,
                   title.name = paste0("Number of interactions - ",
                                       names(object.list)[i]))
}
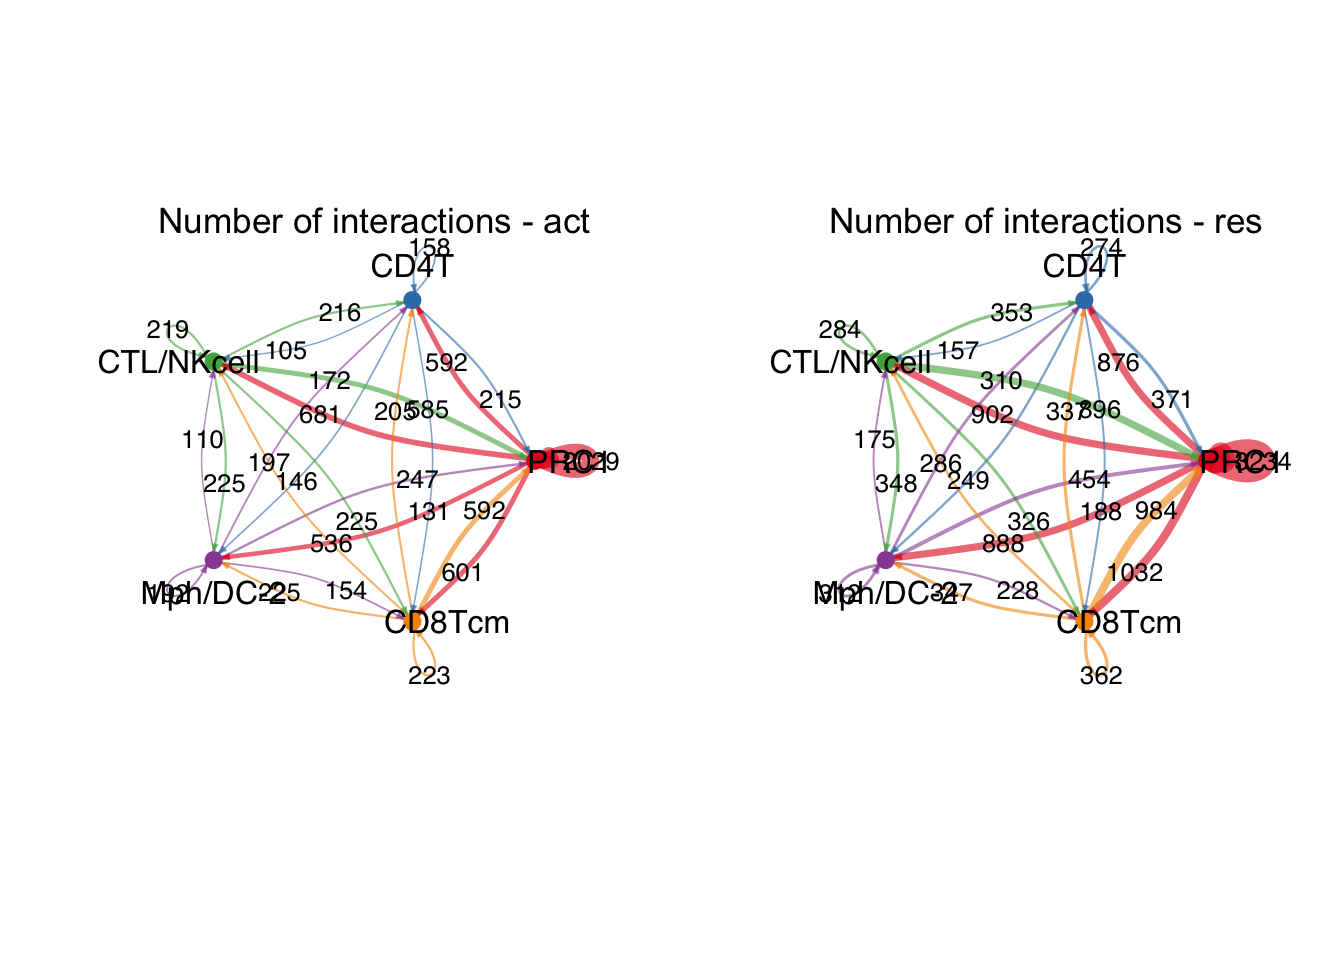
comp int cnt/strength subsets
########### ------------ PI16+RC ------------------- #############

group.cellType <- c(rep("PI16+RC", 3), rep("CD4T", 3), rep("CTL/NKcell", 3),
                    rep("Mph/DC-2", 3), rep("CD8Tcm", 3))
group.cellType <- factor(group.cellType, levels = c("PI16+RC", "CD4T",
                                                    "CTL/NKcell", "Mph/DC-2",
                                                    "CD8Tcm"))

object.list.sub <- lapply(object.list, function(x) {
  mergeInteractions(x, group.cellType)})
cellchat.sub <- mergeCellChat(object.list.sub,
                              add.names = names(object.list.sub))

weight.max <- getMaxWeight(object.list.sub,
                           slot.name = c("idents", "net", "net"),
                           attribute = c("idents","count", "count.merged"))
par(mfrow = c(1,2), xpd=TRUE)
for (i in 1:length(object.list.sub)) {
  netVisual_circle(object.list.sub[[i]]@net$count.merged, weight.scale = T,
                   label.edge= T, edge.weight.max = weight.max[3],
                   edge.width.max = 12,
                   title.name = paste0("Number of interactions - ",
                                       names(object.list.sub)[i]))
}
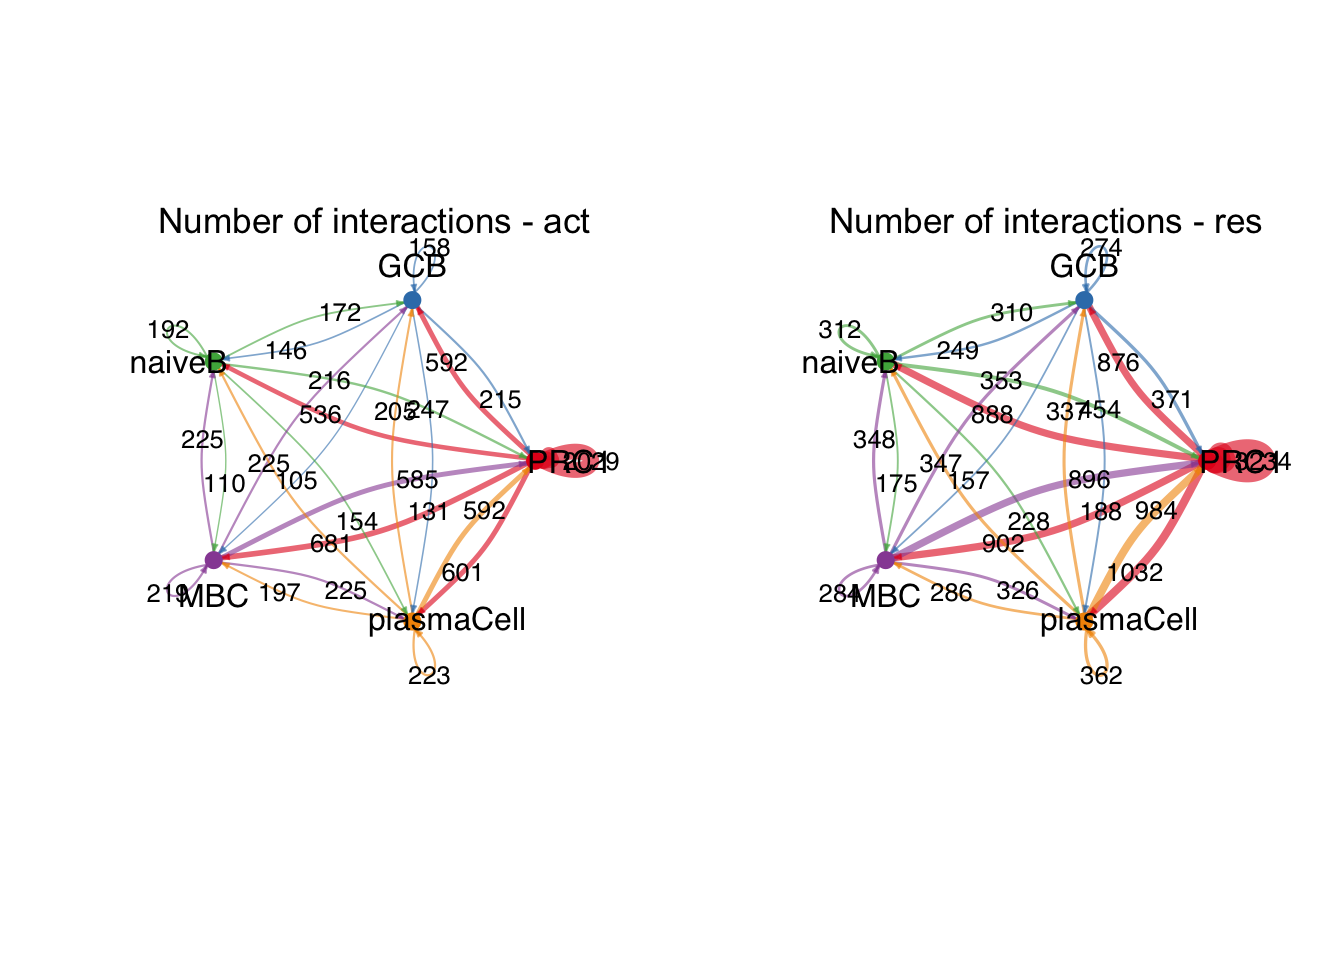
group.cellType <- c(rep("PI16+RC", 3), rep("GCB", 3), rep("MBC", 3),
                    rep("naiveB", 3), rep("plasmaCell", 3))
group.cellType <- factor(group.cellType, levels = c("PI16+RC","GCB", "naiveB",
                                                    "MBC", "plasmaCell"))

object.list.sub <- lapply(object.list, function(x) {
  mergeInteractions(x, group.cellType)
  })
cellchat.sub <- mergeCellChat(object.list.sub,
                              add.names = names(object.list.sub))

weight.max <- getMaxWeight(object.list.sub,
                           slot.name = c("idents", "net", "net"),
                           attribute = c("idents","count", "count.merged"))
par(mfrow = c(1,2), xpd=TRUE)
for (i in 1:length(object.list.sub)) {
  netVisual_circle(object.list.sub[[i]]@net$count.merged, weight.scale = T,
                   label.edge= T, edge.weight.max = weight.max[3],
                   edge.width.max = 12,
                   title.name = paste0("Number of interactions - ",
                                       names(object.list.sub)[i]))
}
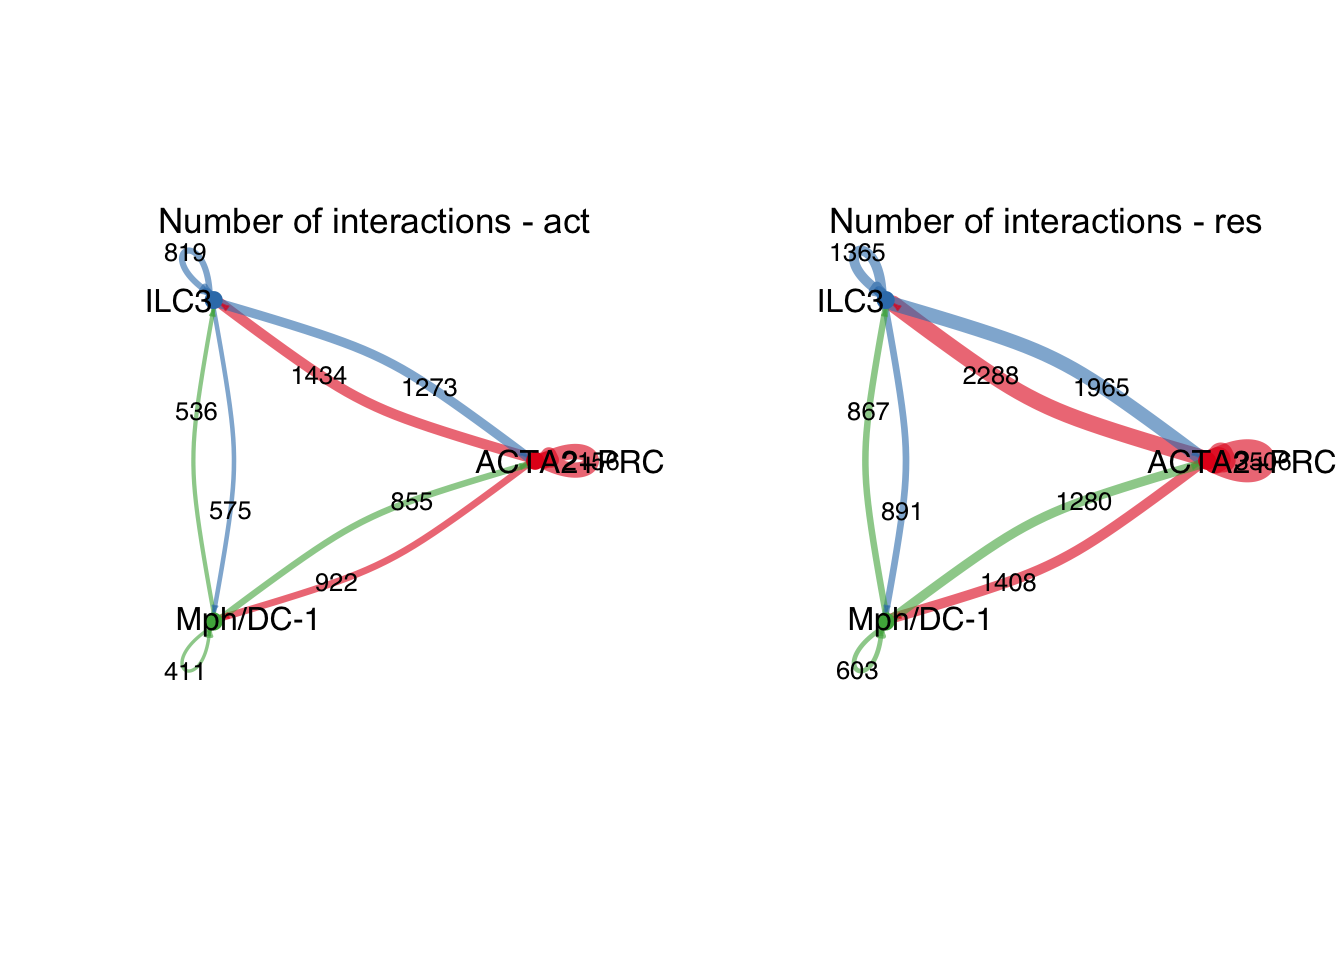
group.cellType <- c(rep("PI16+RC", 4), rep("ILC3", 4), rep("Mph/DC-1", 4))
group.cellType <- factor(group.cellType, levels = c("PI16+RC", "ILC3",
                                                    "Mph/DC-1"))

object.list.sub <- lapply(object.list, function(x) {
  mergeInteractions(x, group.cellType)
  })
cellchat.sub <- mergeCellChat(object.list.sub,
                              add.names = names(object.list.sub))

weight.max <- getMaxWeight(object.list.sub,
                           slot.name = c("idents", "net", "net"),
                           attribute = c("idents","count", "count.merged"))
par(mfrow = c(1,2), xpd=TRUE)
for (i in 1:length(object.list.sub)) {
  netVisual_circle(object.list.sub[[i]]@net$count.merged, weight.scale = T,
                   label.edge= T, edge.weight.max = weight.max[3],
                   edge.width.max = 12,
                   title.name = paste0("Number of interactions - ",
                                       names(object.list.sub)[i]))
}
########### ------------ PRC1 ------------------- #############

group.cellType <- c(rep("PRC1", 3), rep("CD4T", 3), rep("CTL/NKcell", 3),
                    rep("Mph/DC-2", 3), rep("CD8Tcm", 3))
group.cellType <- factor(group.cellType, levels = c("PRC1", "CD4T",
                                                    "CTL/NKcell","Mph/DC-2",
                                                    "CD8Tcm"))

object.list.sub <- lapply(object.list, function(x) {
  mergeInteractions(x, group.cellType)})
cellchat.sub <- mergeCellChat(object.list.sub,
                              add.names = names(object.list.sub))

weight.max <- getMaxWeight(object.list.sub,
                           slot.name = c("idents", "net", "net"),
                           attribute = c("idents","count", "count.merged"))
par(mfrow = c(1,2), xpd=TRUE)
for (i in 1:length(object.list.sub)) {
  netVisual_circle(object.list.sub[[i]]@net$count.merged, weight.scale = T,
                   label.edge= T, edge.weight.max = weight.max[3],
                   edge.width.max = 12,
                   title.name = paste0("Number of interactions - ",
                                       names(object.list.sub)[i]))
}
group.cellType <- c(rep("PRC1", 3), rep("GCB", 3), rep("MBC", 3),
                    rep("naiveB", 3), rep("plasmaCell", 3))
group.cellType <- factor(group.cellType, levels = c("PRC1","GCB", "naiveB",
                                                    "MBC", "plasmaCell"))

object.list.sub <- lapply(object.list, function(x) {
  mergeInteractions(x, group.cellType)
  })
cellchat.sub <- mergeCellChat(object.list.sub,
                              add.names = names(object.list.sub))

weight.max <- getMaxWeight(object.list.sub,
                           slot.name = c("idents", "net", "net"),
                           attribute = c("idents","count", "count.merged"))
par(mfrow = c(1,2), xpd=TRUE)
for (i in 1:length(object.list.sub)) {
  netVisual_circle(object.list.sub[[i]]@net$count.merged, weight.scale = T,
                   label.edge= T, edge.weight.max = weight.max[3],
                   edge.width.max = 12,
                   title.name = paste0("Number of interactions - ",
                                       names(object.list.sub)[i]))
}
group.cellType <- c(rep("PRC1", 4), rep("ILC3", 4), rep("Mph/DC-1", 4))
group.cellType <- factor(group.cellType, levels = c("PRC1", "ILC3", "Mph/DC-1"))

object.list.sub <- lapply(object.list, function(x) {
  mergeInteractions(x, group.cellType)
  })
cellchat.sub <- mergeCellChat(object.list.sub,
                              add.names = names(object.list.sub))

weight.max <- getMaxWeight(object.list.sub,
                           slot.name = c("idents", "net", "net"),
                           attribute = c("idents","count", "count.merged"))
par(mfrow = c(1,2), xpd=TRUE)
for (i in 1:length(object.list.sub)) {
  netVisual_circle(object.list.sub[[i]]@net$count.merged, weight.scale = T,
                   label.edge= T, edge.weight.max = weight.max[3],
                   edge.width.max = 12,
                   title.name = paste0("Number of interactions - ",
                                       names(object.list.sub)[i]))
}
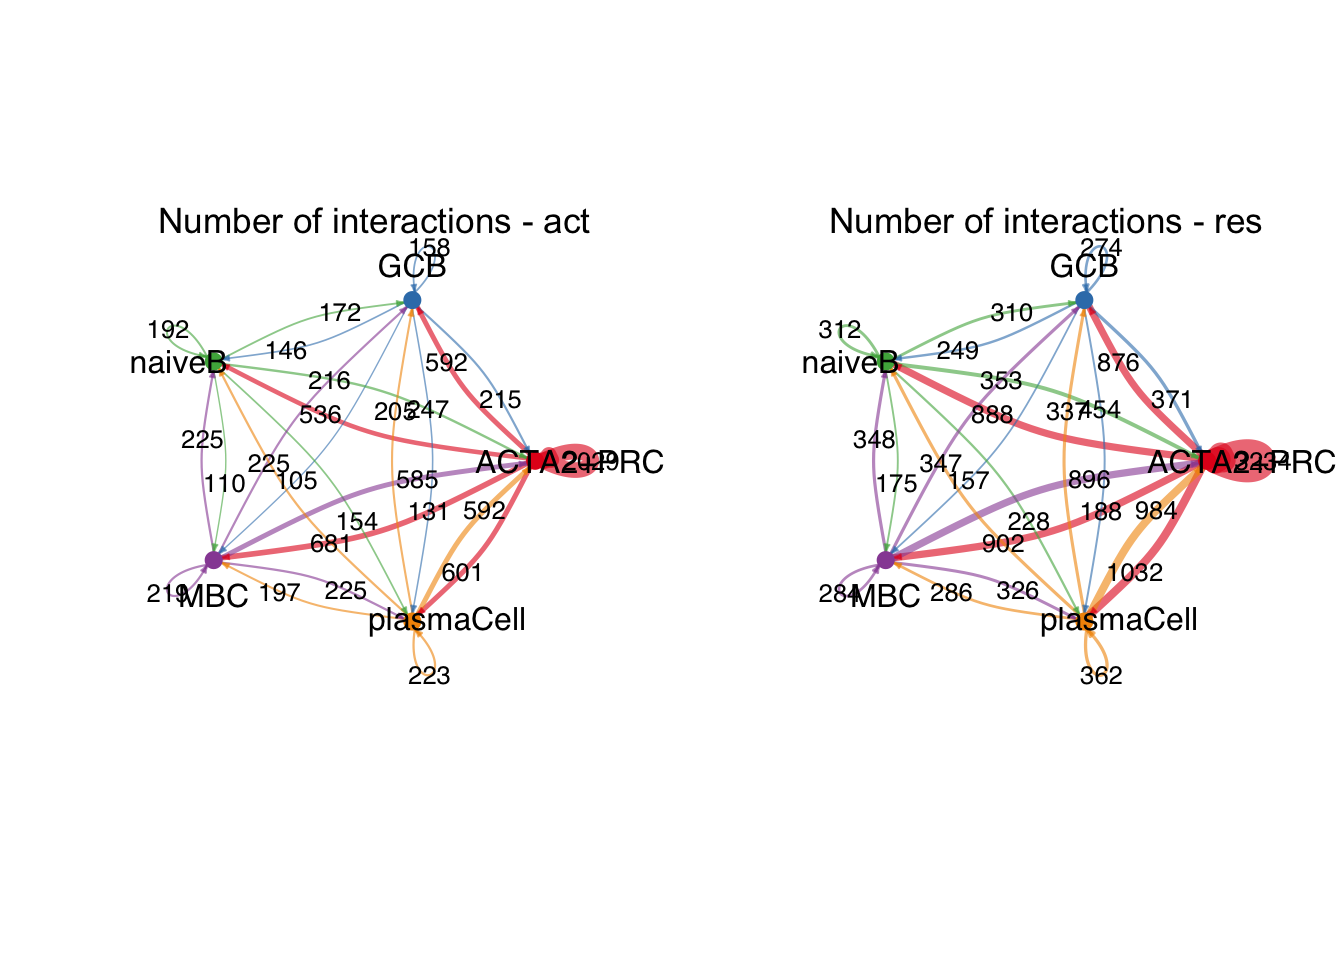
########### ------------ ACTA2+PRC ------------------- #############

group.cellType <- c(rep("ACTA2+PRC", 3), rep("CD4T", 3), rep("CTL/NKcell", 3),
                    rep("Mph/DC-2", 3), rep("CD8Tcm", 3))
group.cellType <- factor(group.cellType, levels = c("ACTA2+PRC", "CD4T",
                                                    "CTL/NKcell","Mph/DC-2",
                                                    "CD8Tcm"))

object.list.sub <- lapply(object.list, function(x) {
  mergeInteractions(x, group.cellType)})
cellchat.sub <- mergeCellChat(object.list.sub,
                              add.names = names(object.list.sub))

weight.max <- getMaxWeight(object.list.sub,
                           slot.name = c("idents", "net", "net"),
                           attribute = c("idents","count", "count.merged"))
par(mfrow = c(1,2), xpd=TRUE)
for (i in 1:length(object.list.sub)) {
  netVisual_circle(object.list.sub[[i]]@net$count.merged, weight.scale = T,
                   label.edge= T, edge.weight.max = weight.max[3],
                   edge.width.max = 12,
                   title.name = paste0("Number of interactions - ",
                                       names(object.list.sub)[i]))
}
group.cellType <- c(rep("ACTA2+PRC", 3), rep("GCB", 3), rep("MBC", 3),
                    rep("naiveB", 3), rep("plasmaCell", 3))
group.cellType <- factor(group.cellType, levels = c("ACTA2+PRC","GCB", "naiveB",
                                                    "MBC", "plasmaCell"))

object.list.sub <- lapply(object.list, function(x) {
  mergeInteractions(x, group.cellType)
  })
cellchat.sub <- mergeCellChat(object.list.sub,
                              add.names = names(object.list.sub))

weight.max <- getMaxWeight(object.list.sub,
                           slot.name = c("idents", "net", "net"),
                           attribute = c("idents","count", "count.merged"))
par(mfrow = c(1,2), xpd=TRUE)
for (i in 1:length(object.list.sub)) {
  netVisual_circle(object.list.sub[[i]]@net$count.merged, weight.scale = T,
                   label.edge= T, edge.weight.max = weight.max[3],
                   edge.width.max = 12,
                   title.name = paste0("Number of interactions - ",
                                       names(object.list.sub)[i]))
}
group.cellType <- c(rep("ACTA2+PRC", 4), rep("ILC3", 4), rep("Mph/DC-1", 4))
group.cellType <- factor(group.cellType, levels = c("ACTA2+PRC", "ILC3",
                                                    "Mph/DC-1"))

object.list.sub <- lapply(object.list, function(x) {
  mergeInteractions(x, group.cellType)
  })
cellchat.sub <- mergeCellChat(object.list.sub,
                              add.names = names(object.list.sub))

weight.max <- getMaxWeight(object.list.sub,
                           slot.name = c("idents", "net", "net"),
                           attribute = c("idents","count", "count.merged"))
par(mfrow = c(1,2), xpd=TRUE)
for (i in 1:length(object.list.sub)) {
  netVisual_circle(object.list.sub[[i]]@net$count.merged, weight.scale = T,
                   label.edge= T, edge.weight.max = weight.max[3],
                   edge.width.max = 12,
                   title.name = paste0("Number of interactions - ",
                                       names(object.list.sub)[i]))
}
changes in signaling of subsets
num.link <- sapply(object.list, function(x) {rowSums(x@net$count) +
    colSums(x@net$count)-diag(x@net$count)})
weight.MinMax <- c(min(num.link), max(num.link))

gg <- list()
for (i in 1:length(object.list)) {
  gg[[i]] <- netAnalysis_signalingRole_scatter(object.list[[i]],
                                               title = names(object.list)[i], weight.MinMax = weight.MinMax)
}
patchwork::wrap_plots(plots = gg)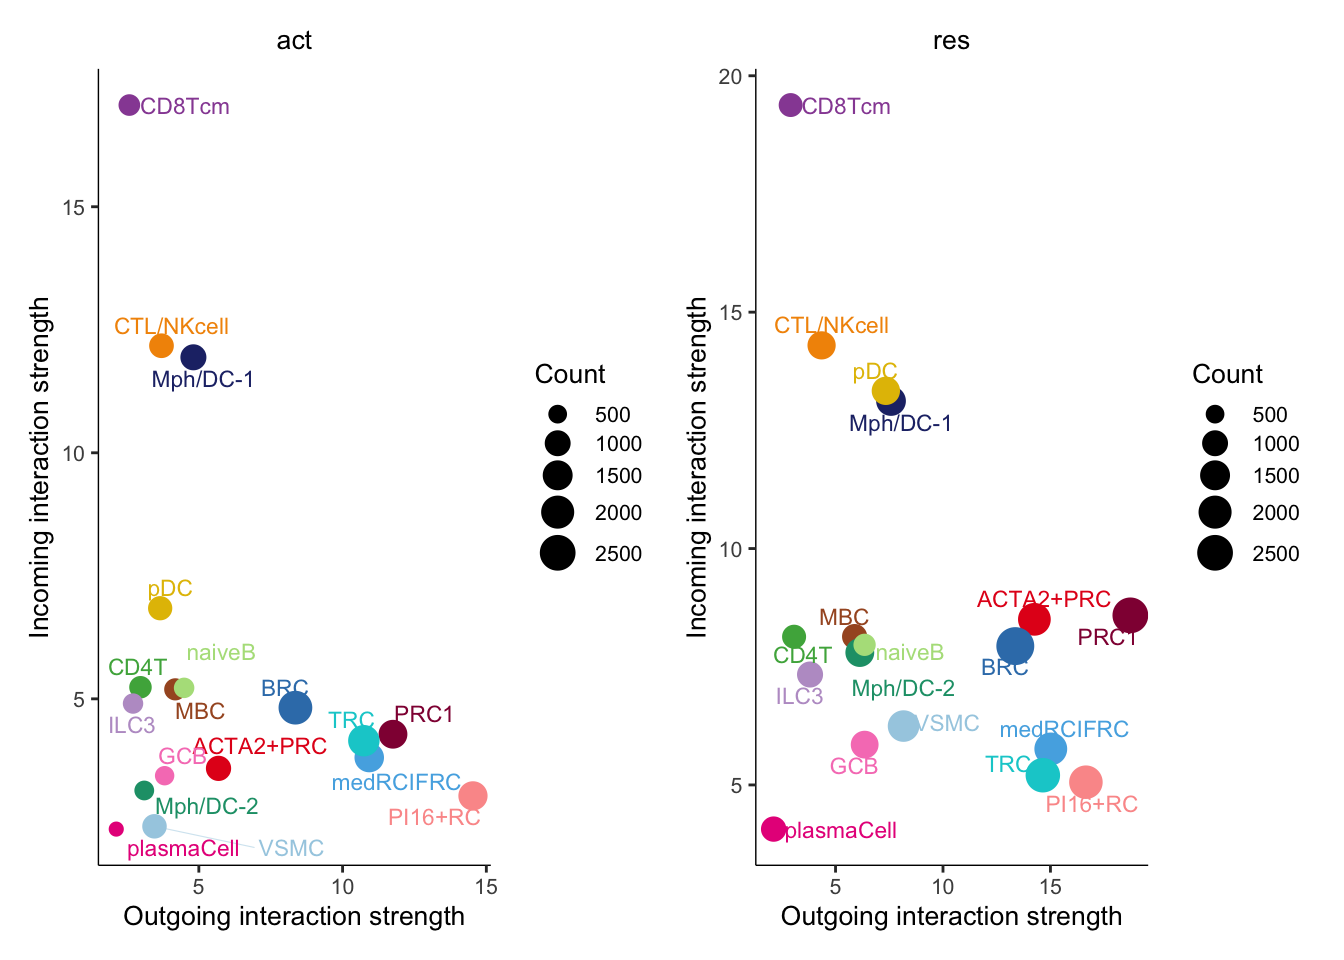
gg1 <- netAnalysis_signalingChanges_scatter(cellchat.merge,
                                            idents.use = "PI16+RC")
gg2 <- netAnalysis_signalingChanges_scatter(cellchat.merge,
                                            idents.use = "PRC1")
gg3 <- netAnalysis_signalingChanges_scatter(cellchat.merge,
                                            idents.use = "ACTA2+PRC")
gg1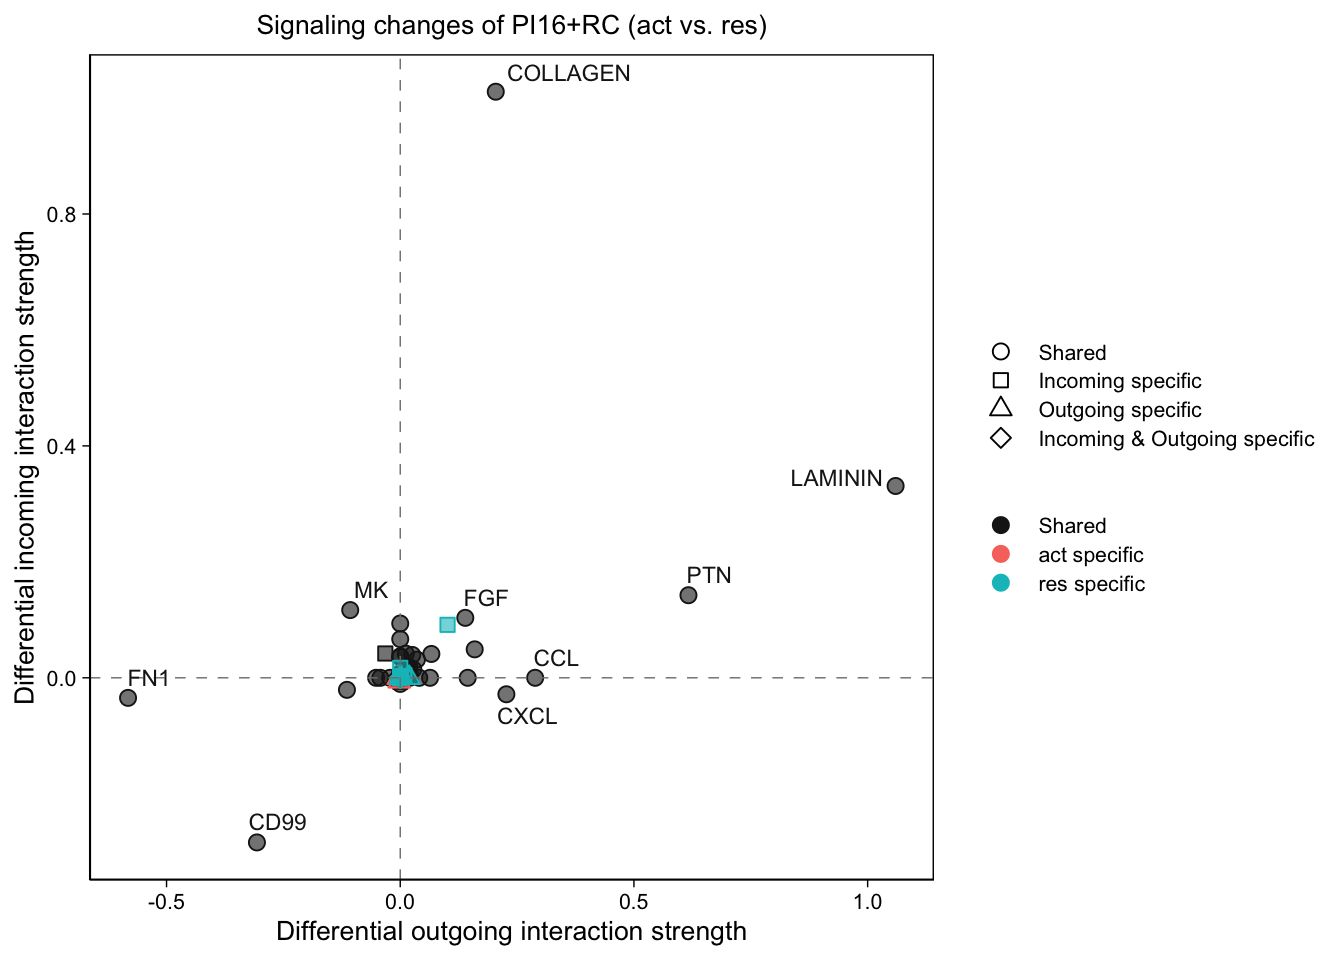
gg2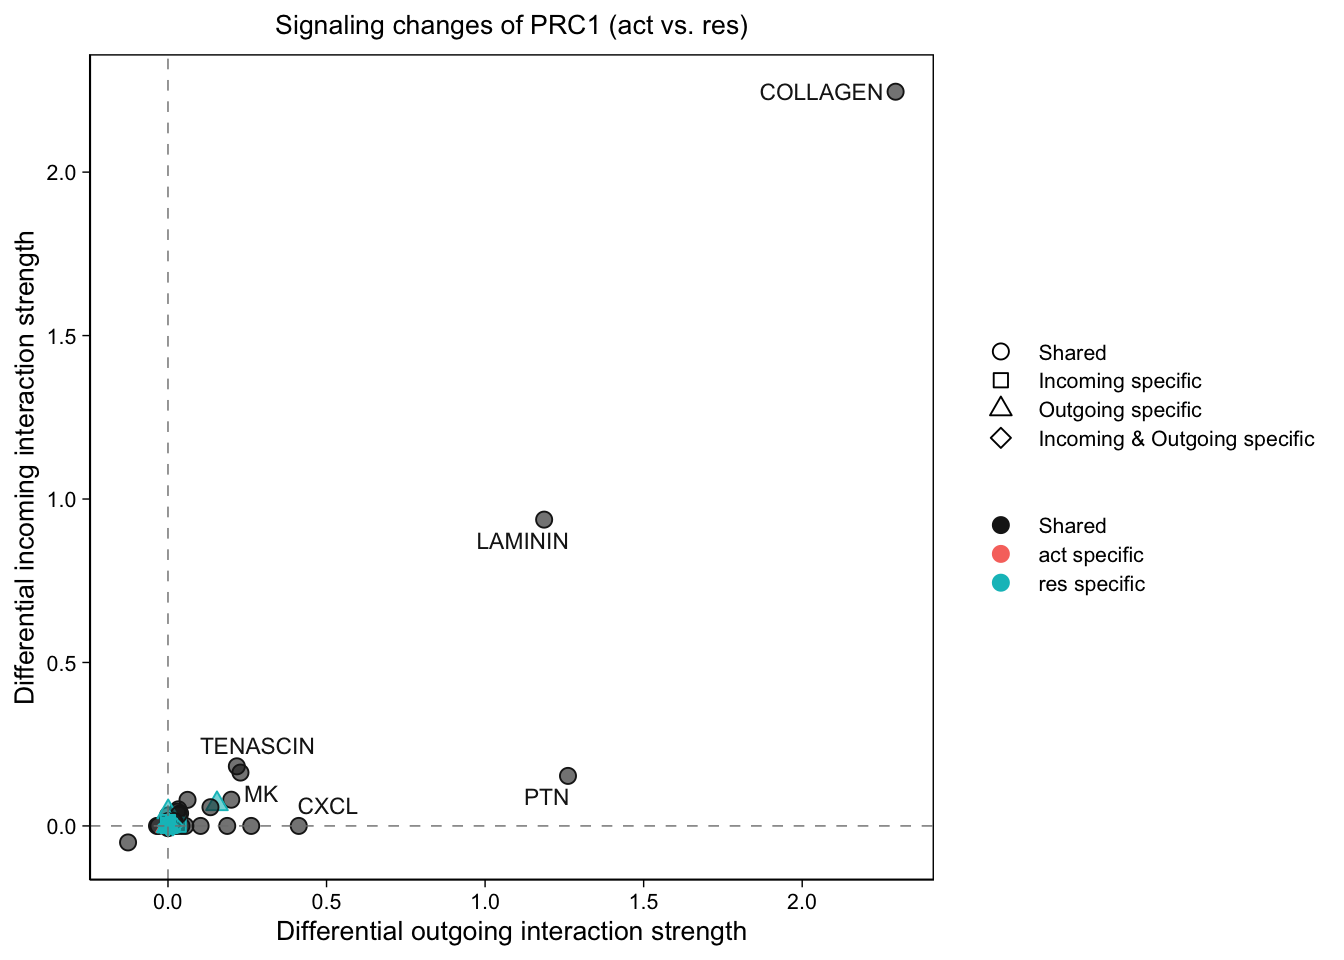
gg3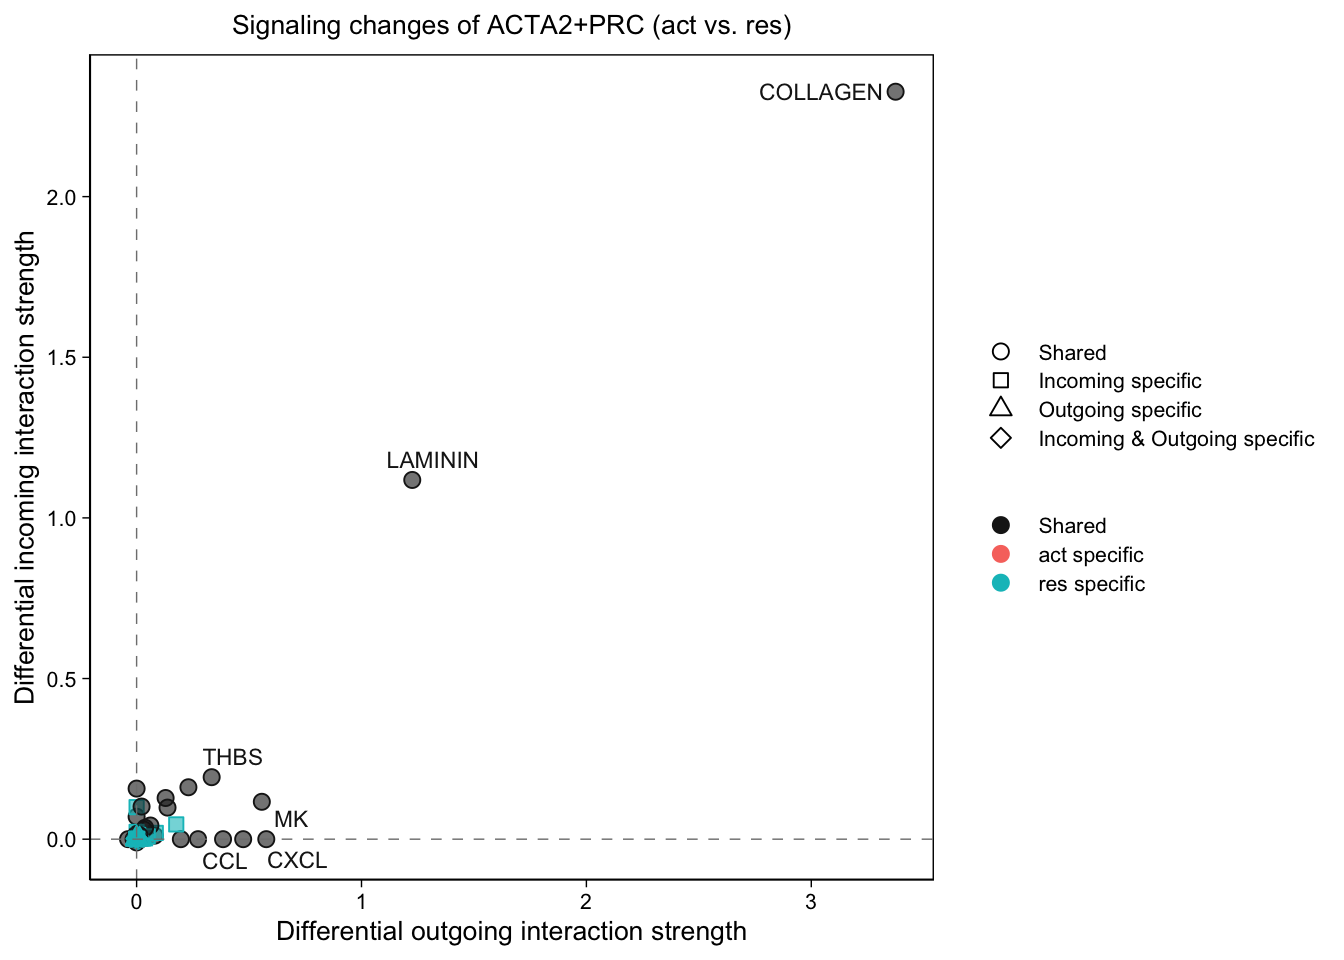
signaling pathways between cond
cellchat.merge <- computeNetSimilarityPairwise(cellchat.merge, type = "functional")Compute signaling network similarity for datasets 1 2 cellchat.merge <- netEmbedding(cellchat.merge, type = "functional", umap.method = "uwot")Manifold learning of the signaling networks for datasets 1 2 cellchat.merge <- netClustering(cellchat.merge, type = "functional", do.parallel = F)Classification learning of the signaling networks for datasets 1 2 netVisual_embeddingPairwise(cellchat.merge, type = "functional", label.size = 2,
top.label=100)2D visualization of signaling networks from datasets 1 2 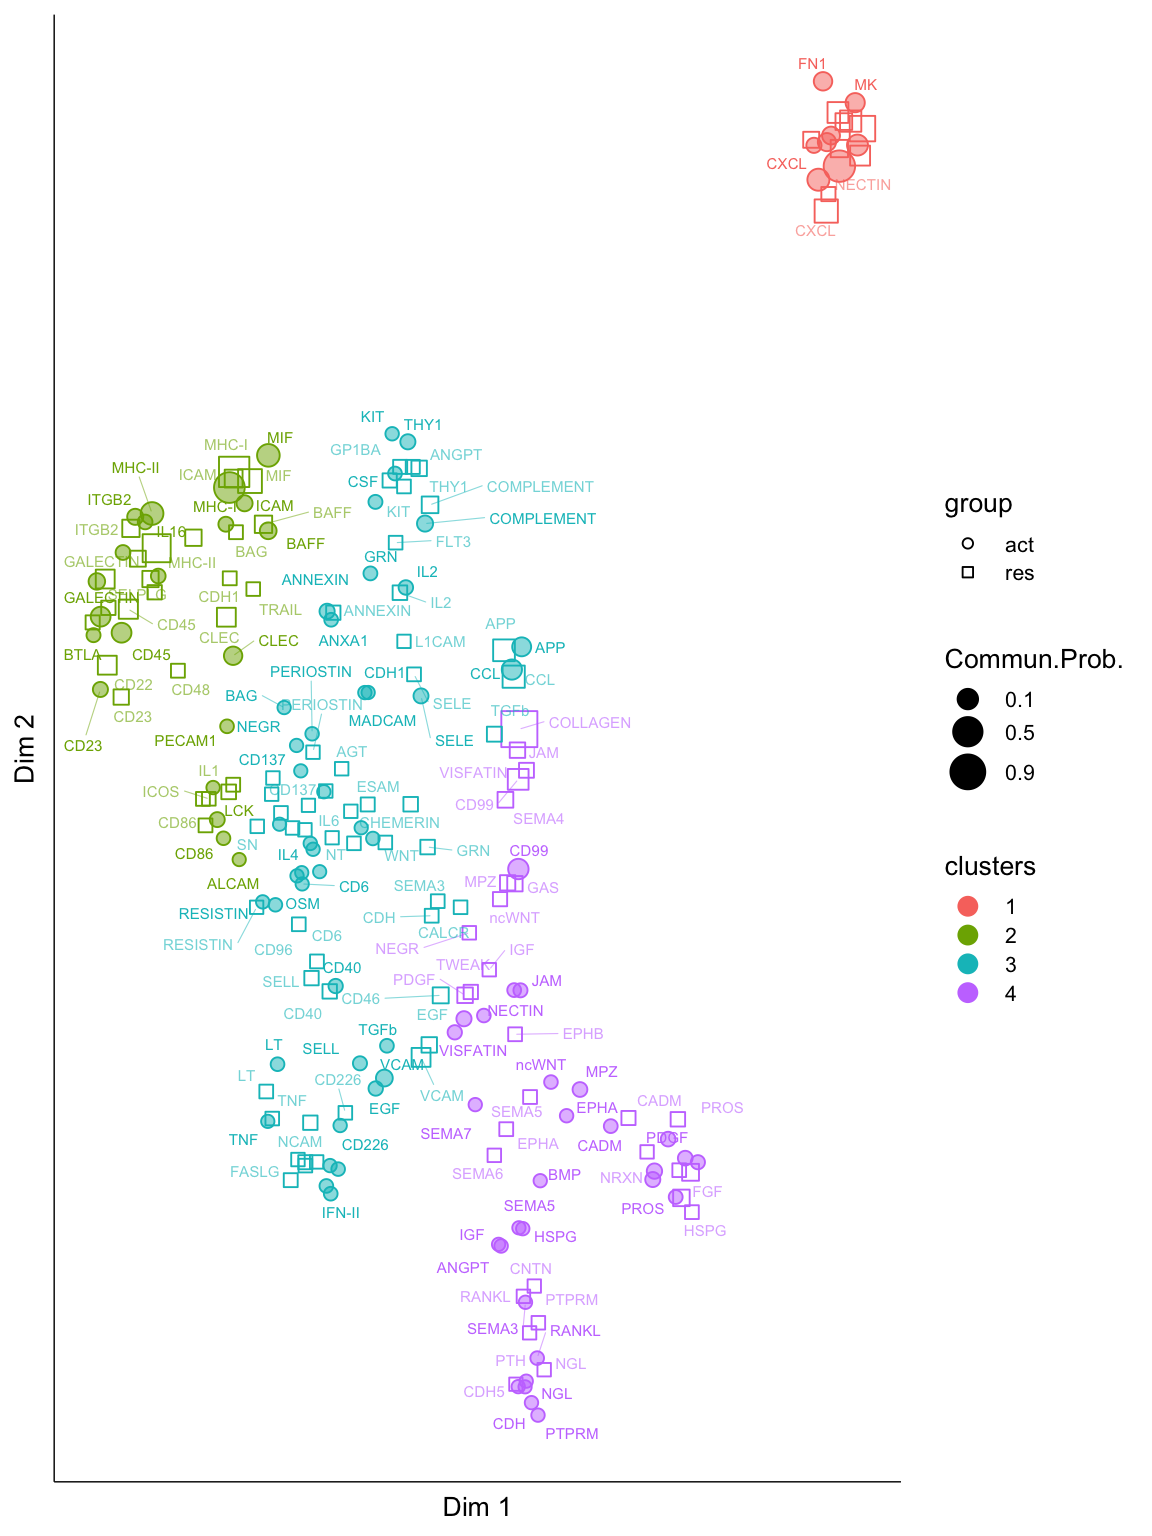
cellchat.merge <- computeNetSimilarityPairwise(cellchat.merge, type = "structural")Compute signaling network similarity for datasets 1 2 cellchat.merge <- netEmbedding(cellchat.merge, type = "structural", umap.method = "uwot")Manifold learning of the signaling networks for datasets 1 2 cellchat.merge <- netClustering(cellchat.merge, type = "structural", do.parallel = F)Classification learning of the signaling networks for datasets 1 2 netVisual_embeddingPairwise(cellchat.merge, type = "structural", label.size = 2)2D visualization of signaling networks from datasets 1 2 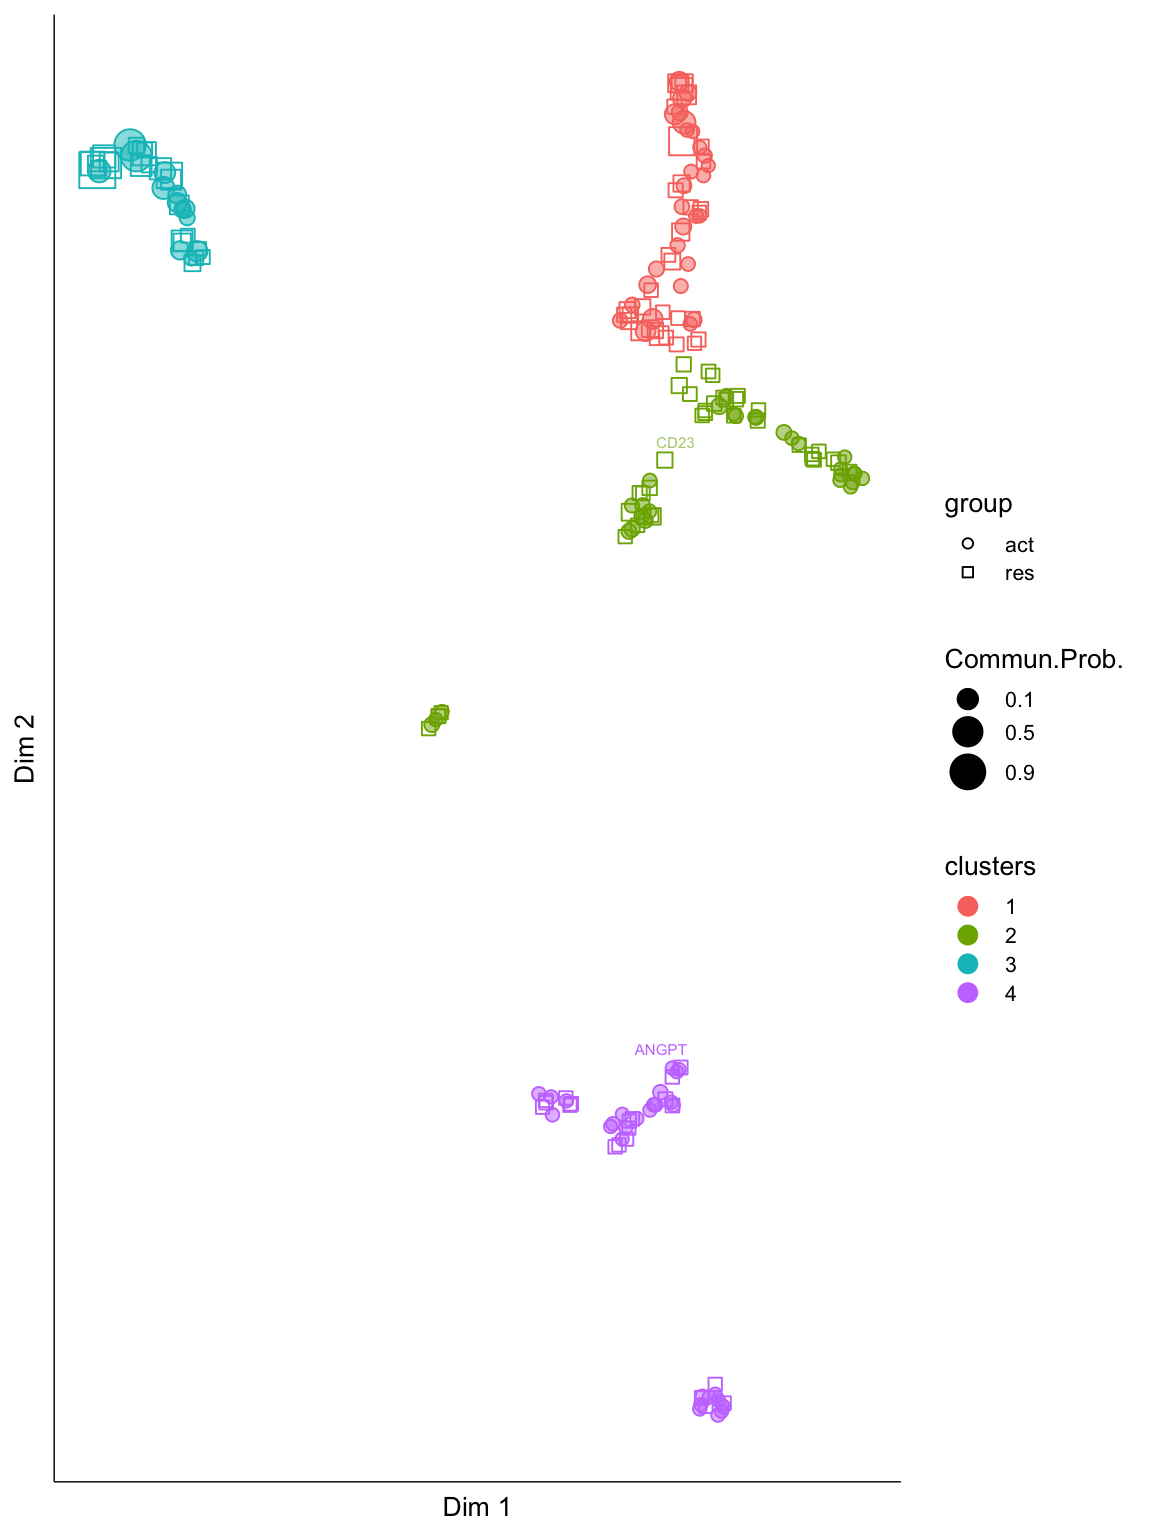
rankSimilarity(cellchat.merge, type = "functional")Compute the distance of signaling networks between datasets 1 2 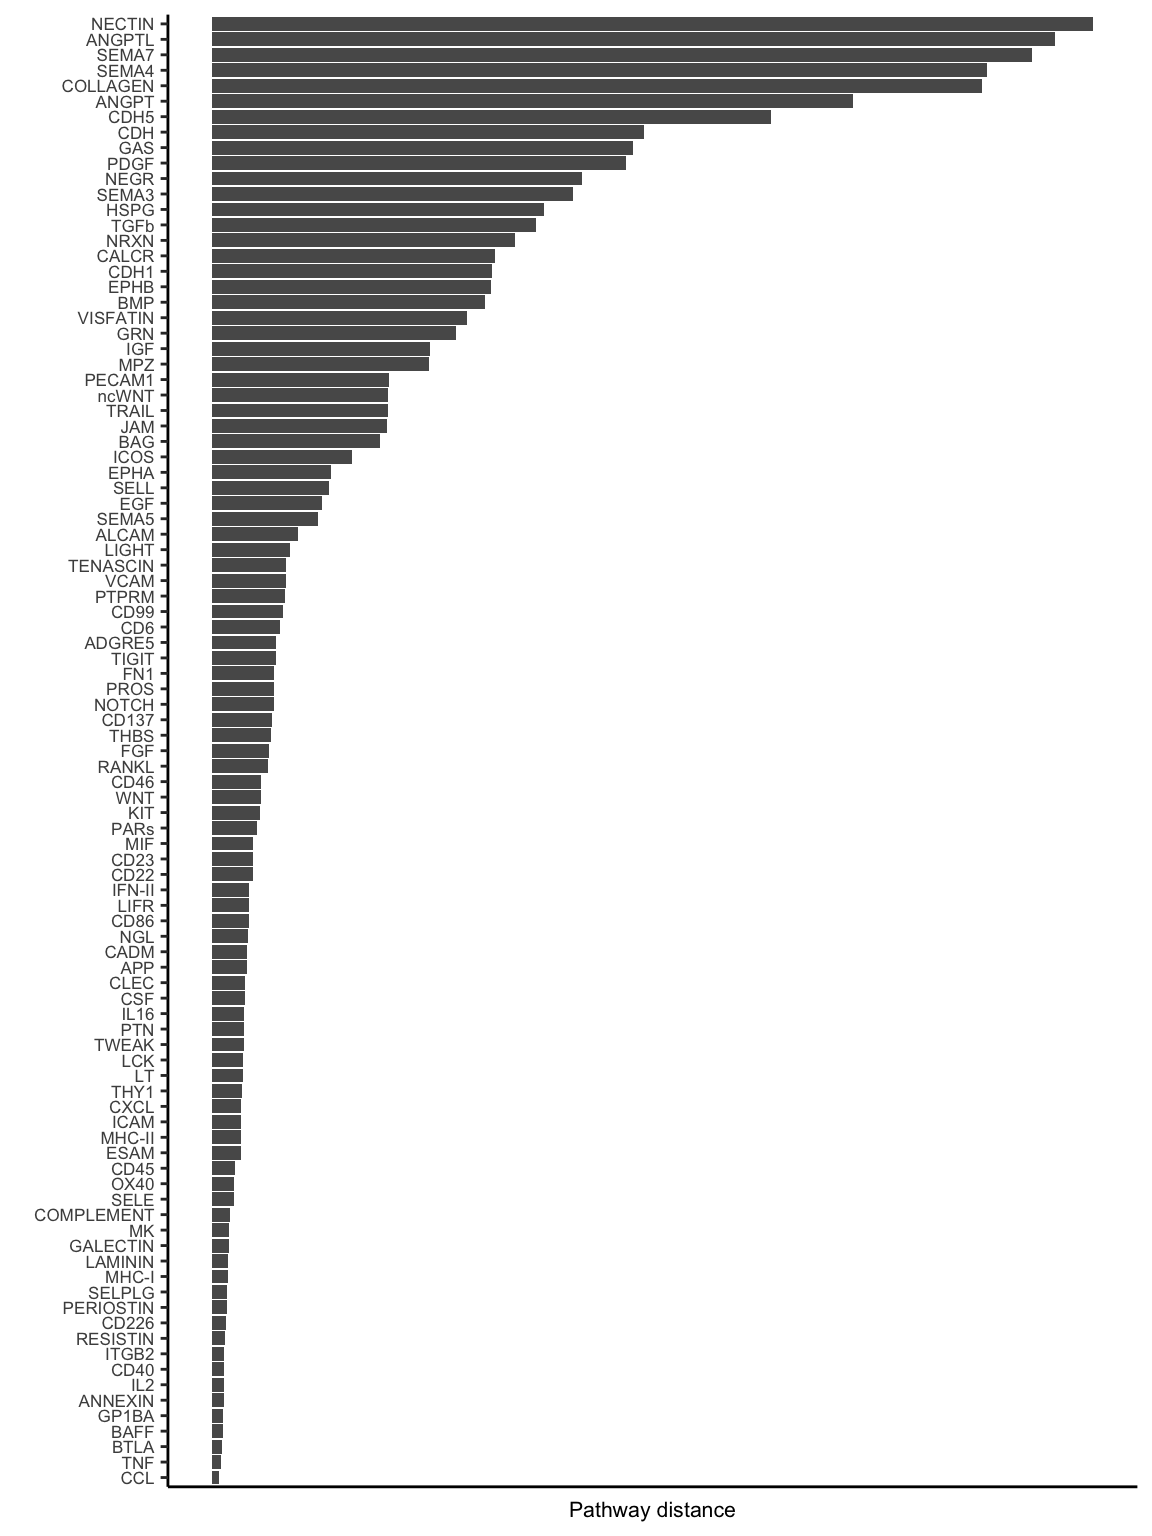
diff usage of PW
gg1 <- rankNet(cellchat.merge, mode = "comparison", stacked = T, do.stat = TRUE)
gg2 <- rankNet(cellchat.merge, mode = "comparison", stacked = F, do.stat = TRUE)
gg1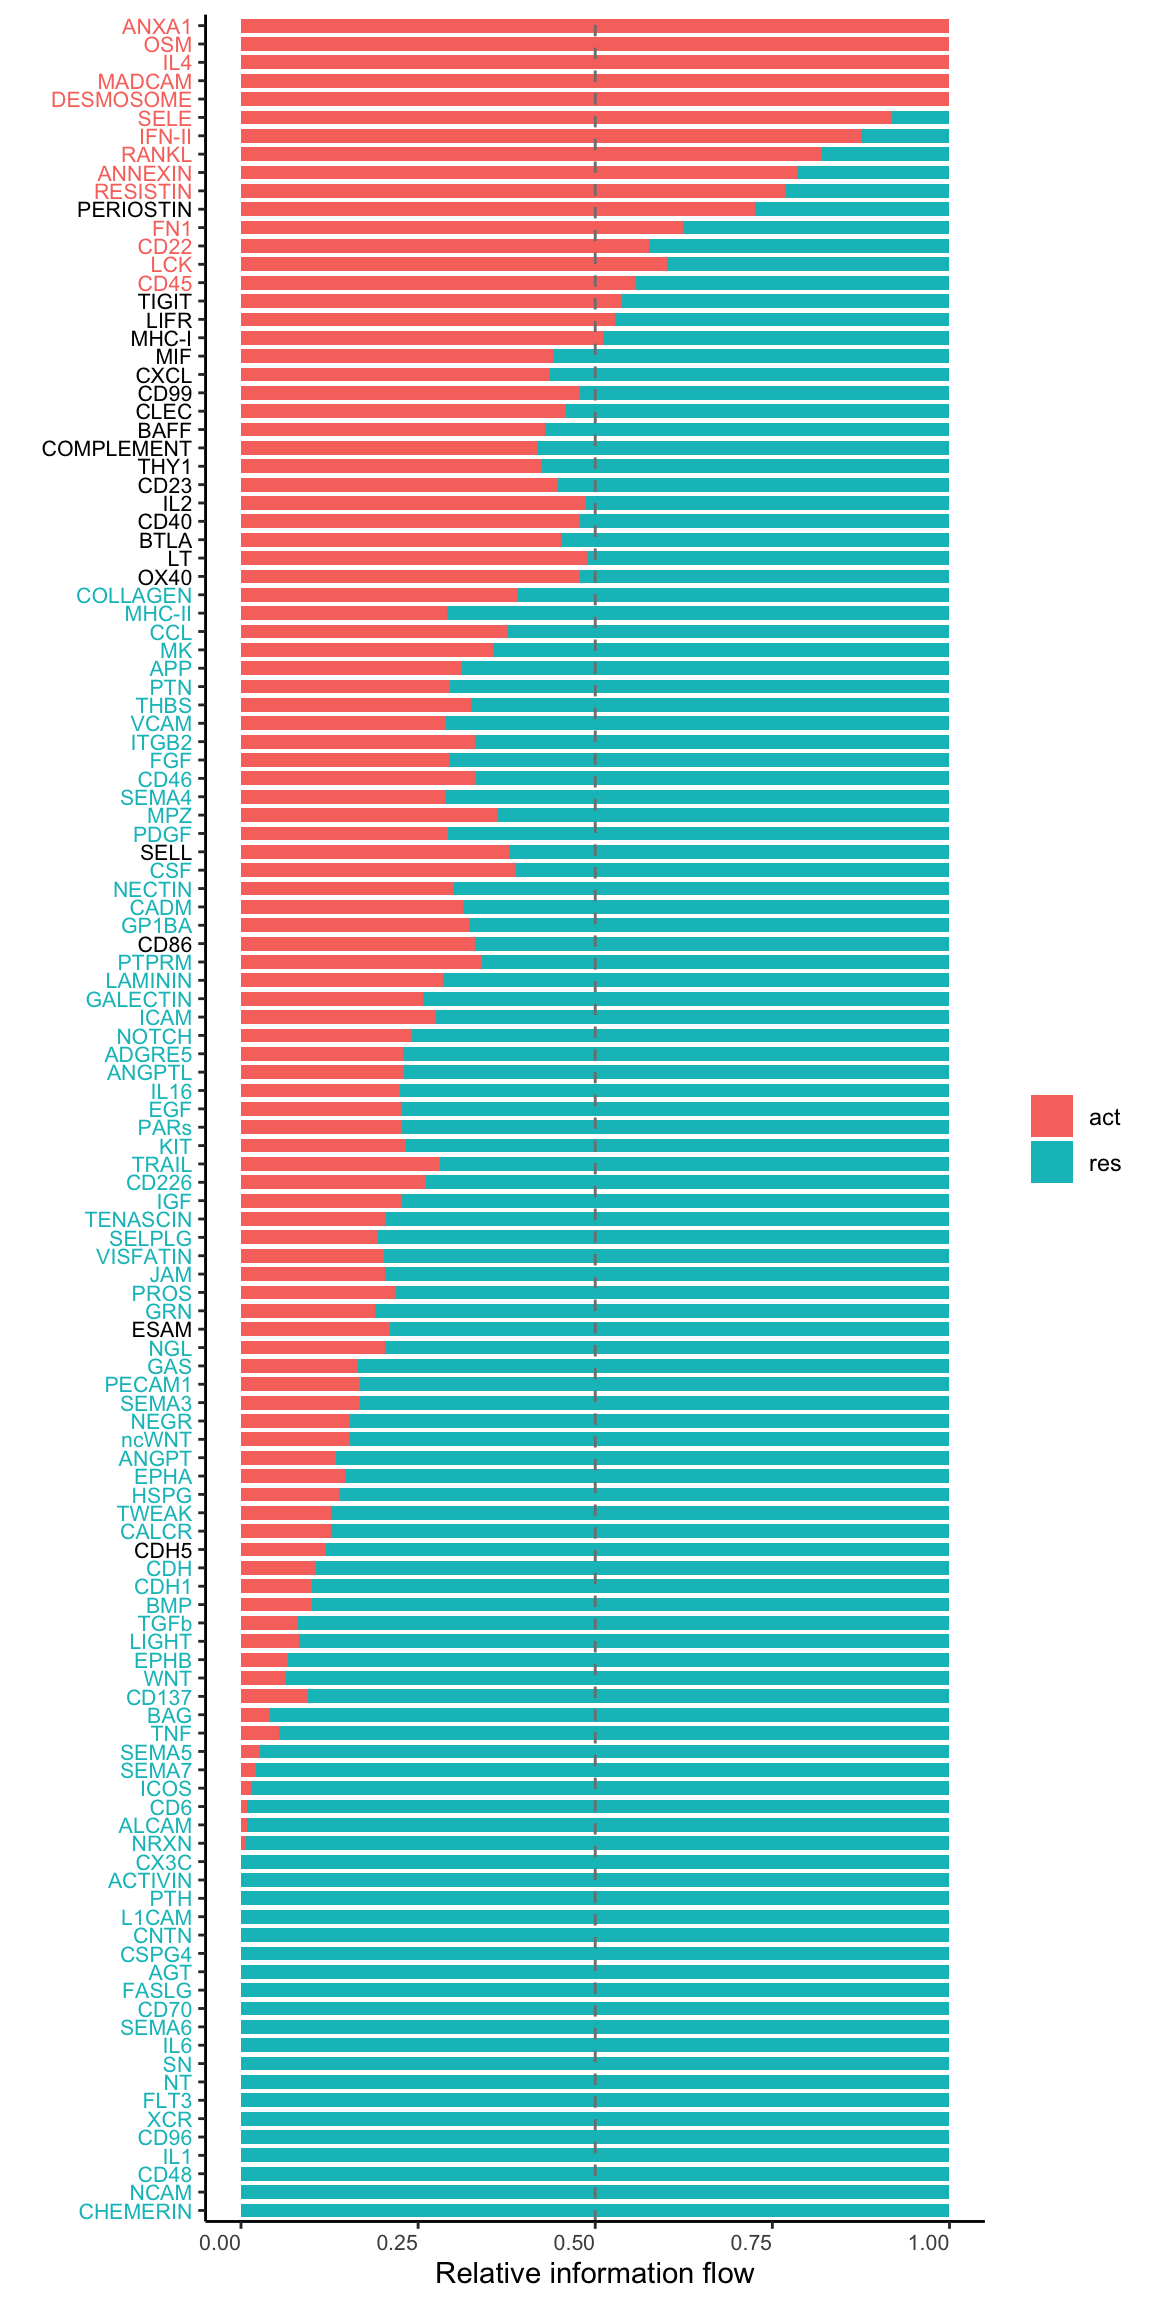
gg2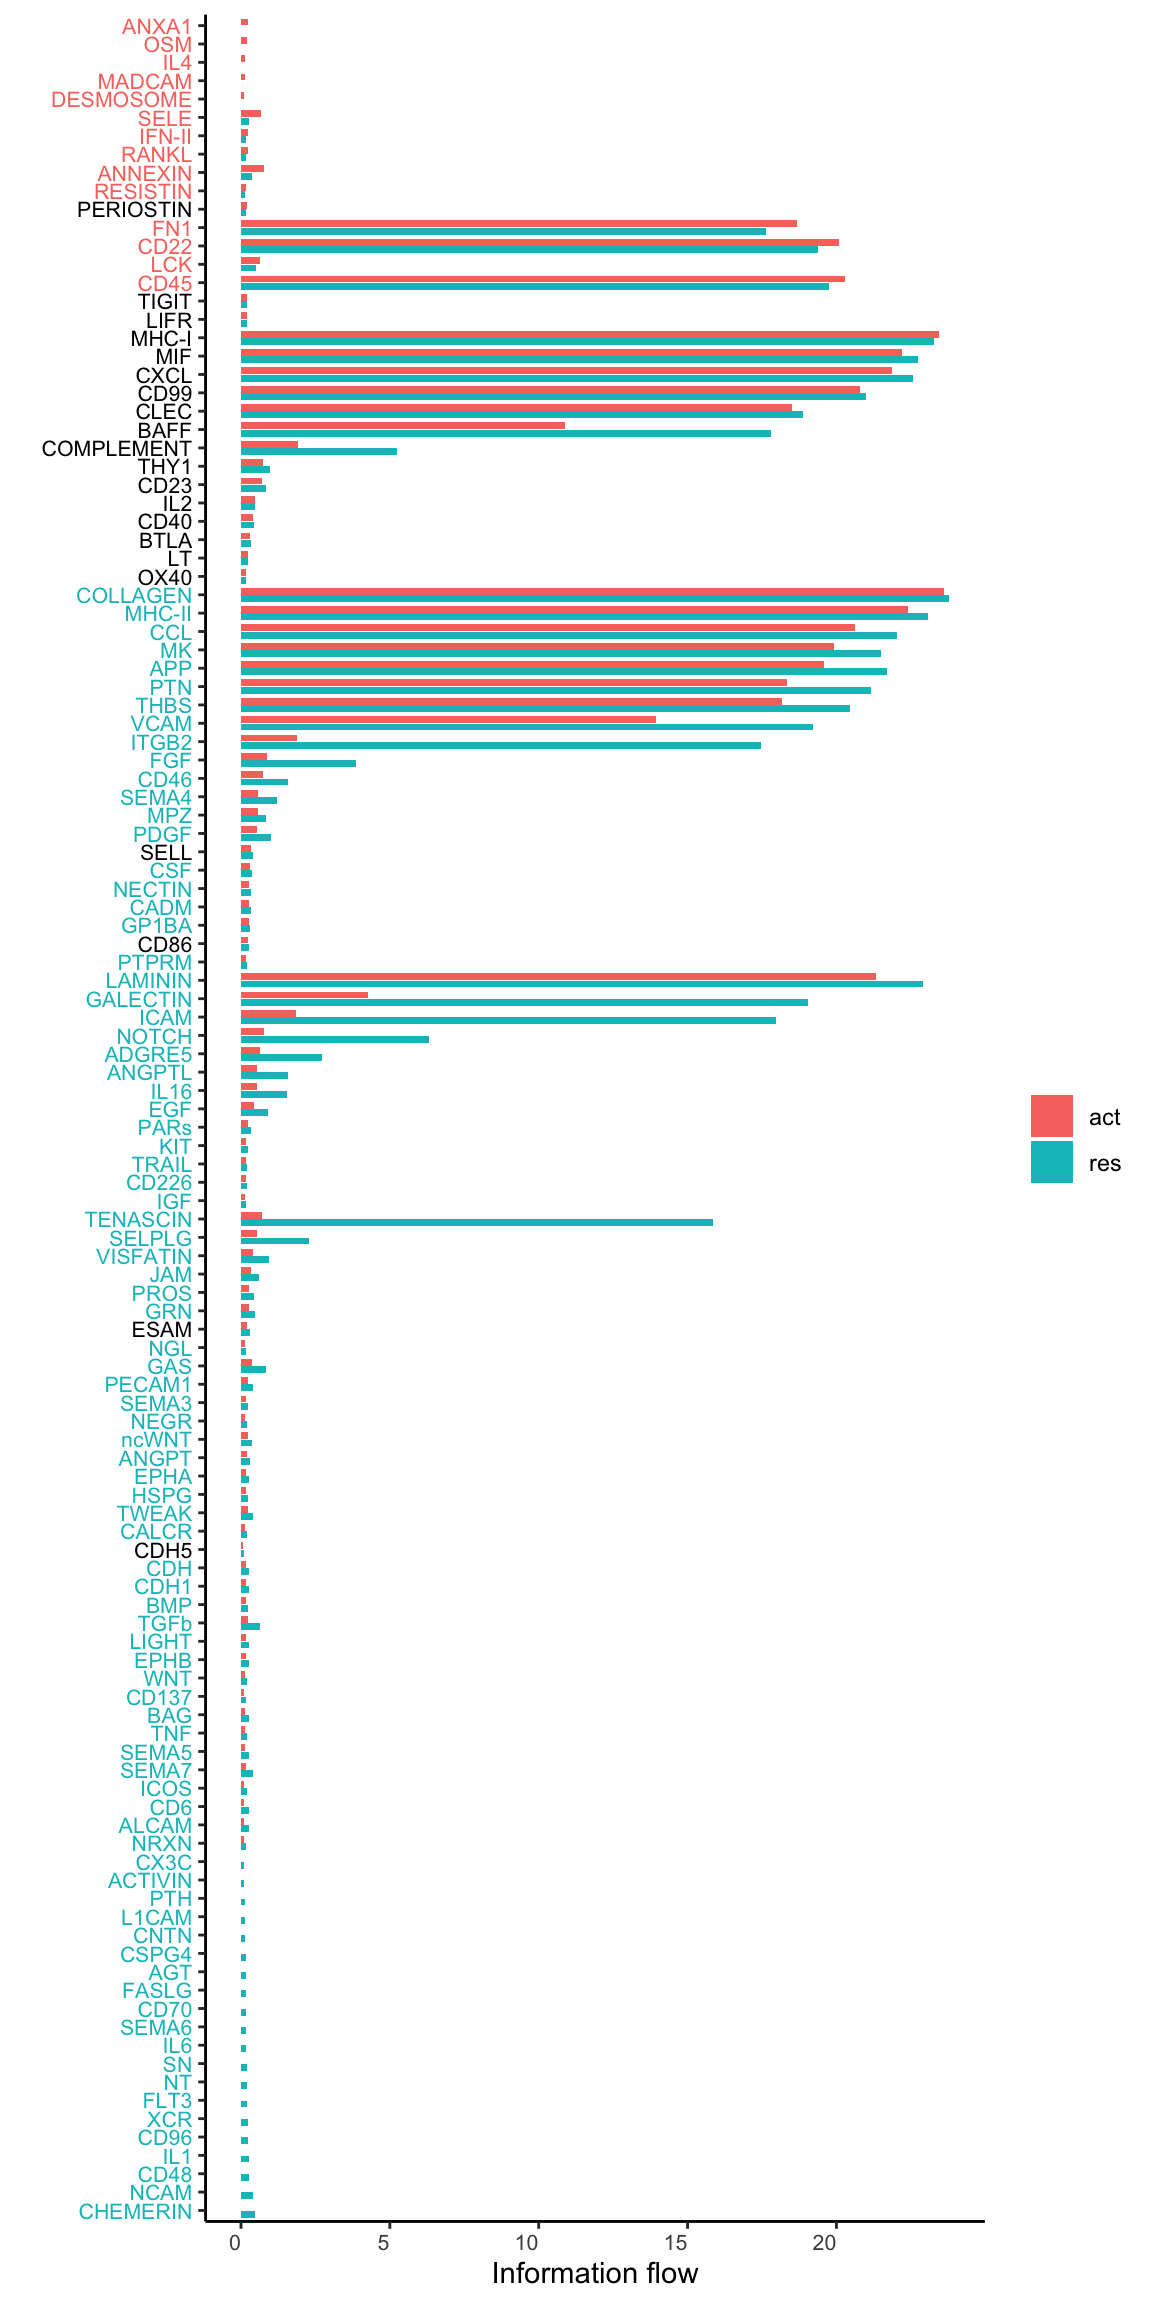
in out signalling
i = 1
pathway.union <- union(object.list[[i]]@netP$pathways, object.list[[i+1]]@netP$pathways)
ht1 = netAnalysis_signalingRole_heatmap(object.list[[i]], pattern = "outgoing", signaling = pathway.union, title = names(object.list)[i], width = 12, height = 26)
ht2 = netAnalysis_signalingRole_heatmap(object.list[[i+1]], pattern = "outgoing", signaling = pathway.union, title = names(object.list)[i+1], width = 12, height = 26)
draw(ht1 + ht2, ht_gap = unit(0.5, "cm"))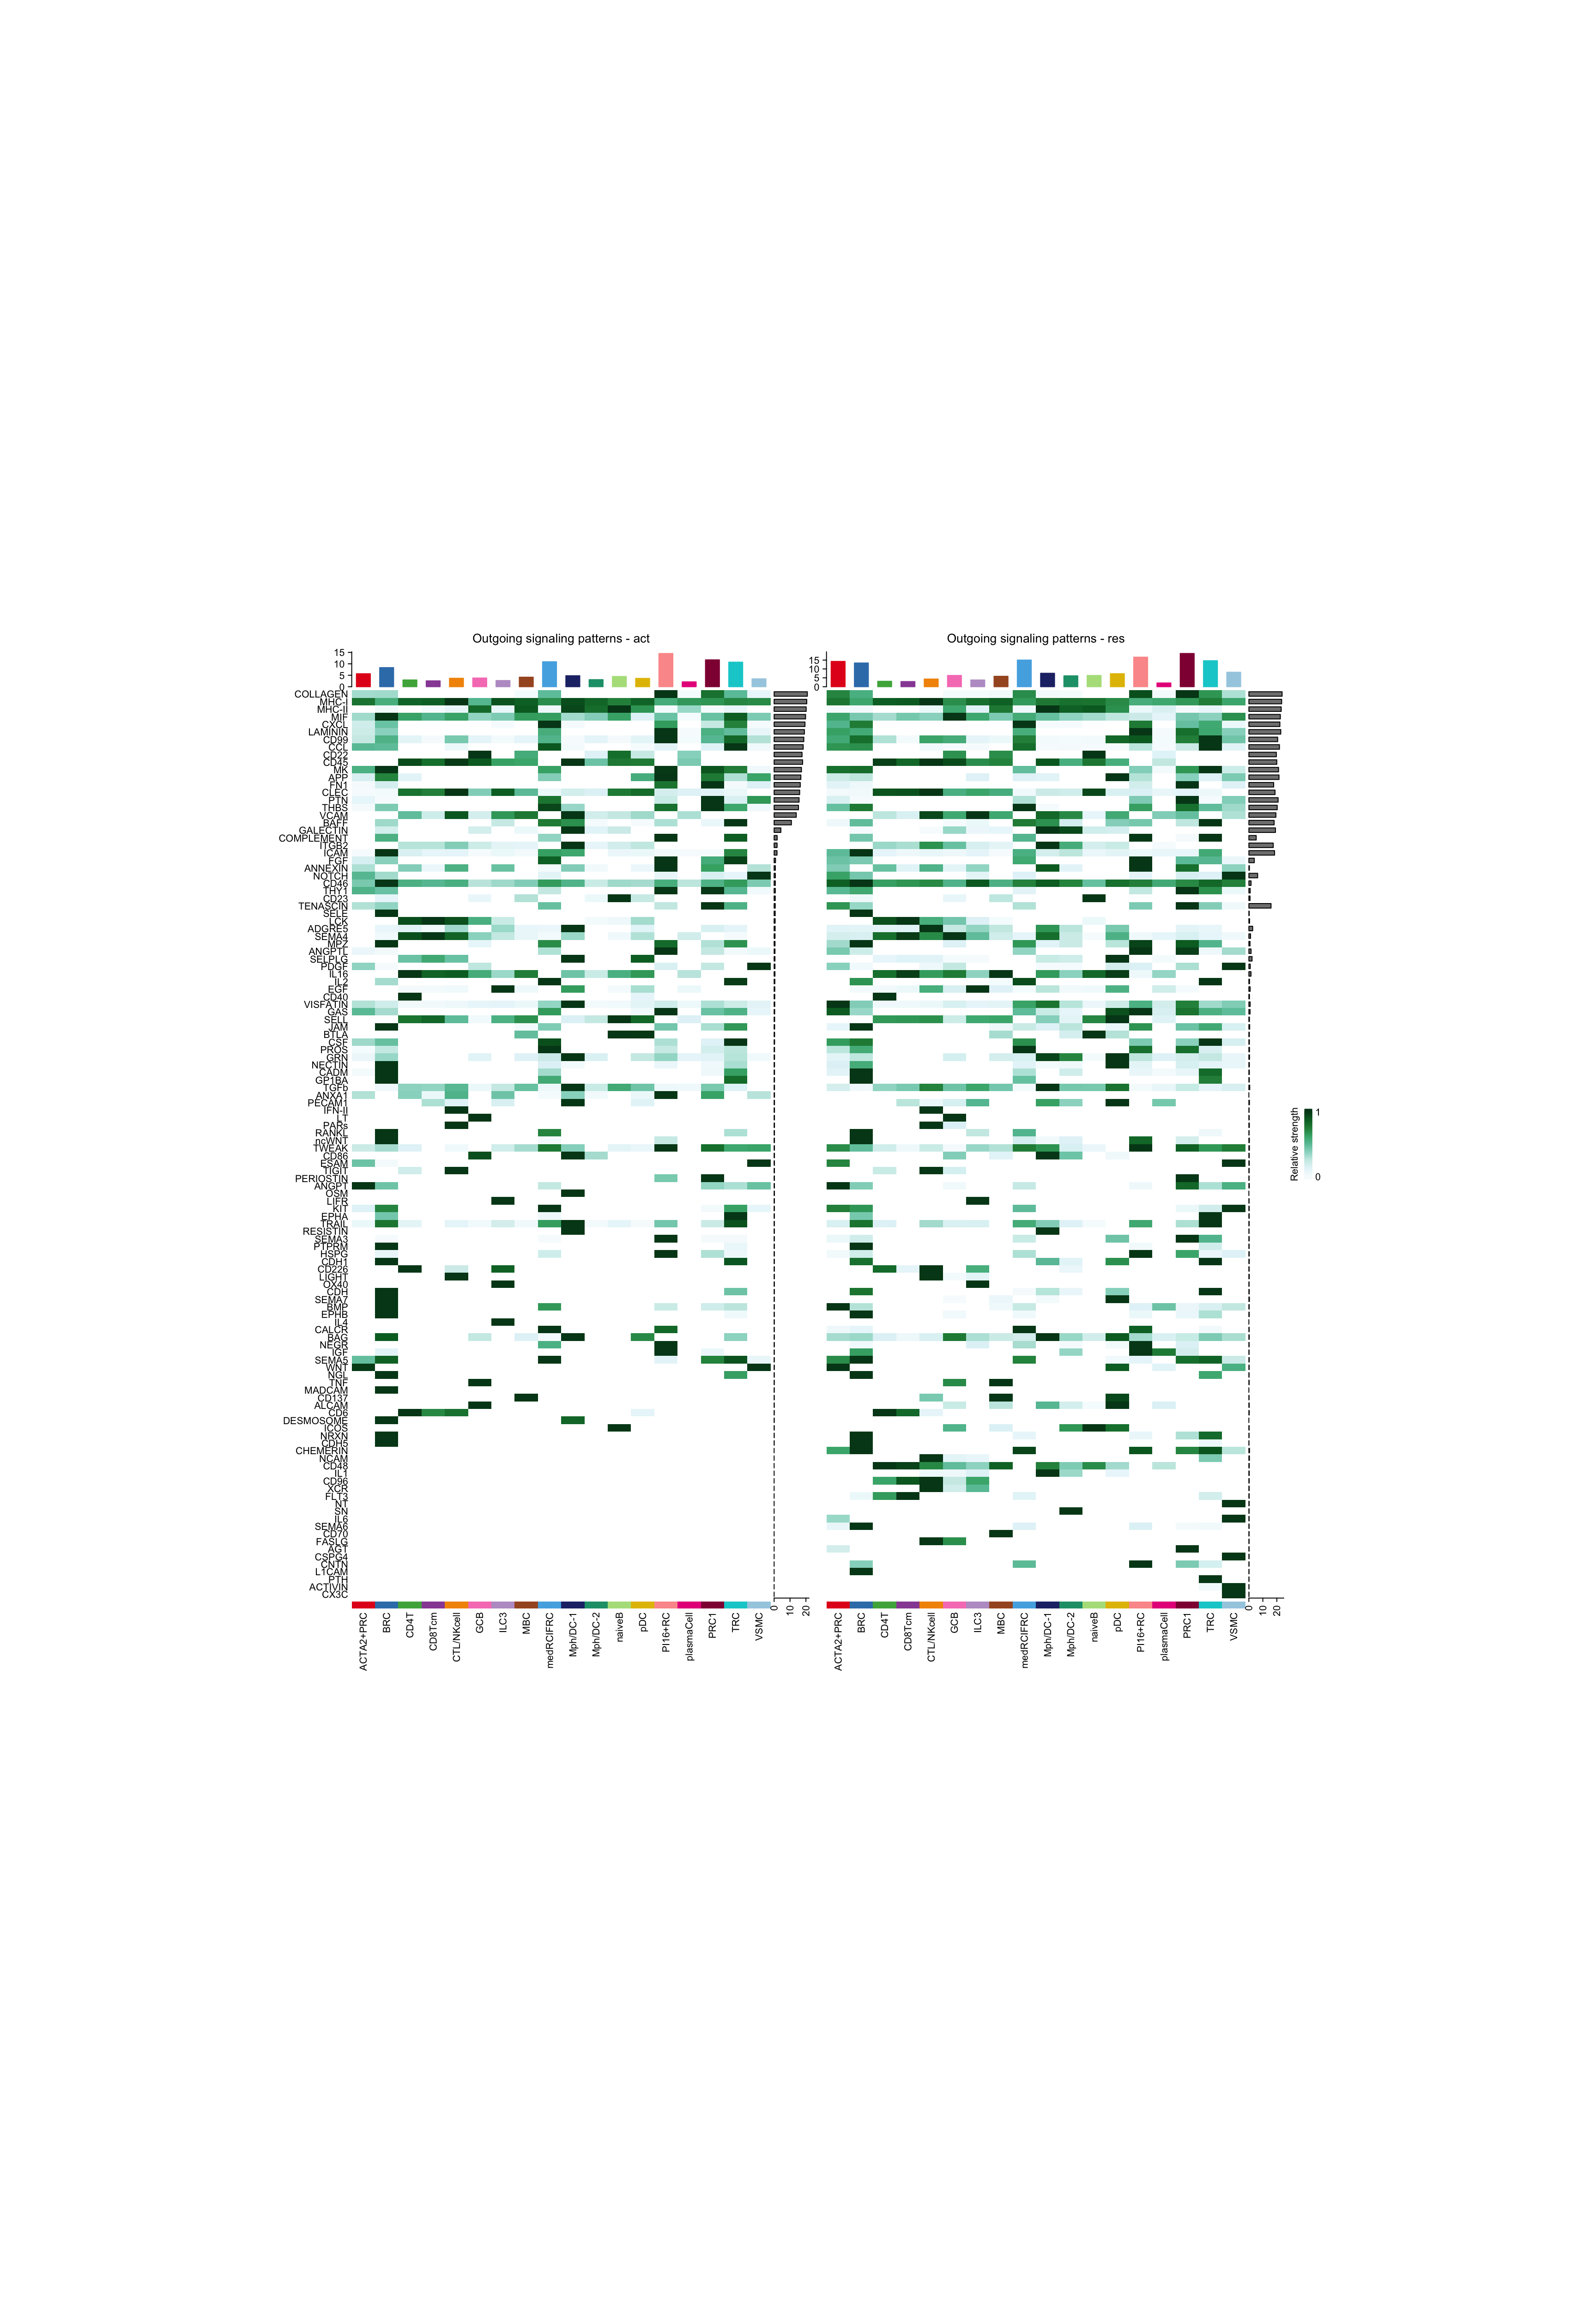
ht1 = netAnalysis_signalingRole_heatmap(object.list[[i]], pattern = "incoming", signaling = pathway.union, title = names(object.list)[i], width = 12, height = 26, color.heatmap = "GnBu")
ht2 = netAnalysis_signalingRole_heatmap(object.list[[i+1]], pattern = "incoming", signaling = pathway.union, title = names(object.list)[i+1], width = 12, height = 26, color.heatmap = "GnBu")
draw(ht1 + ht2, ht_gap = unit(0.5, "cm"))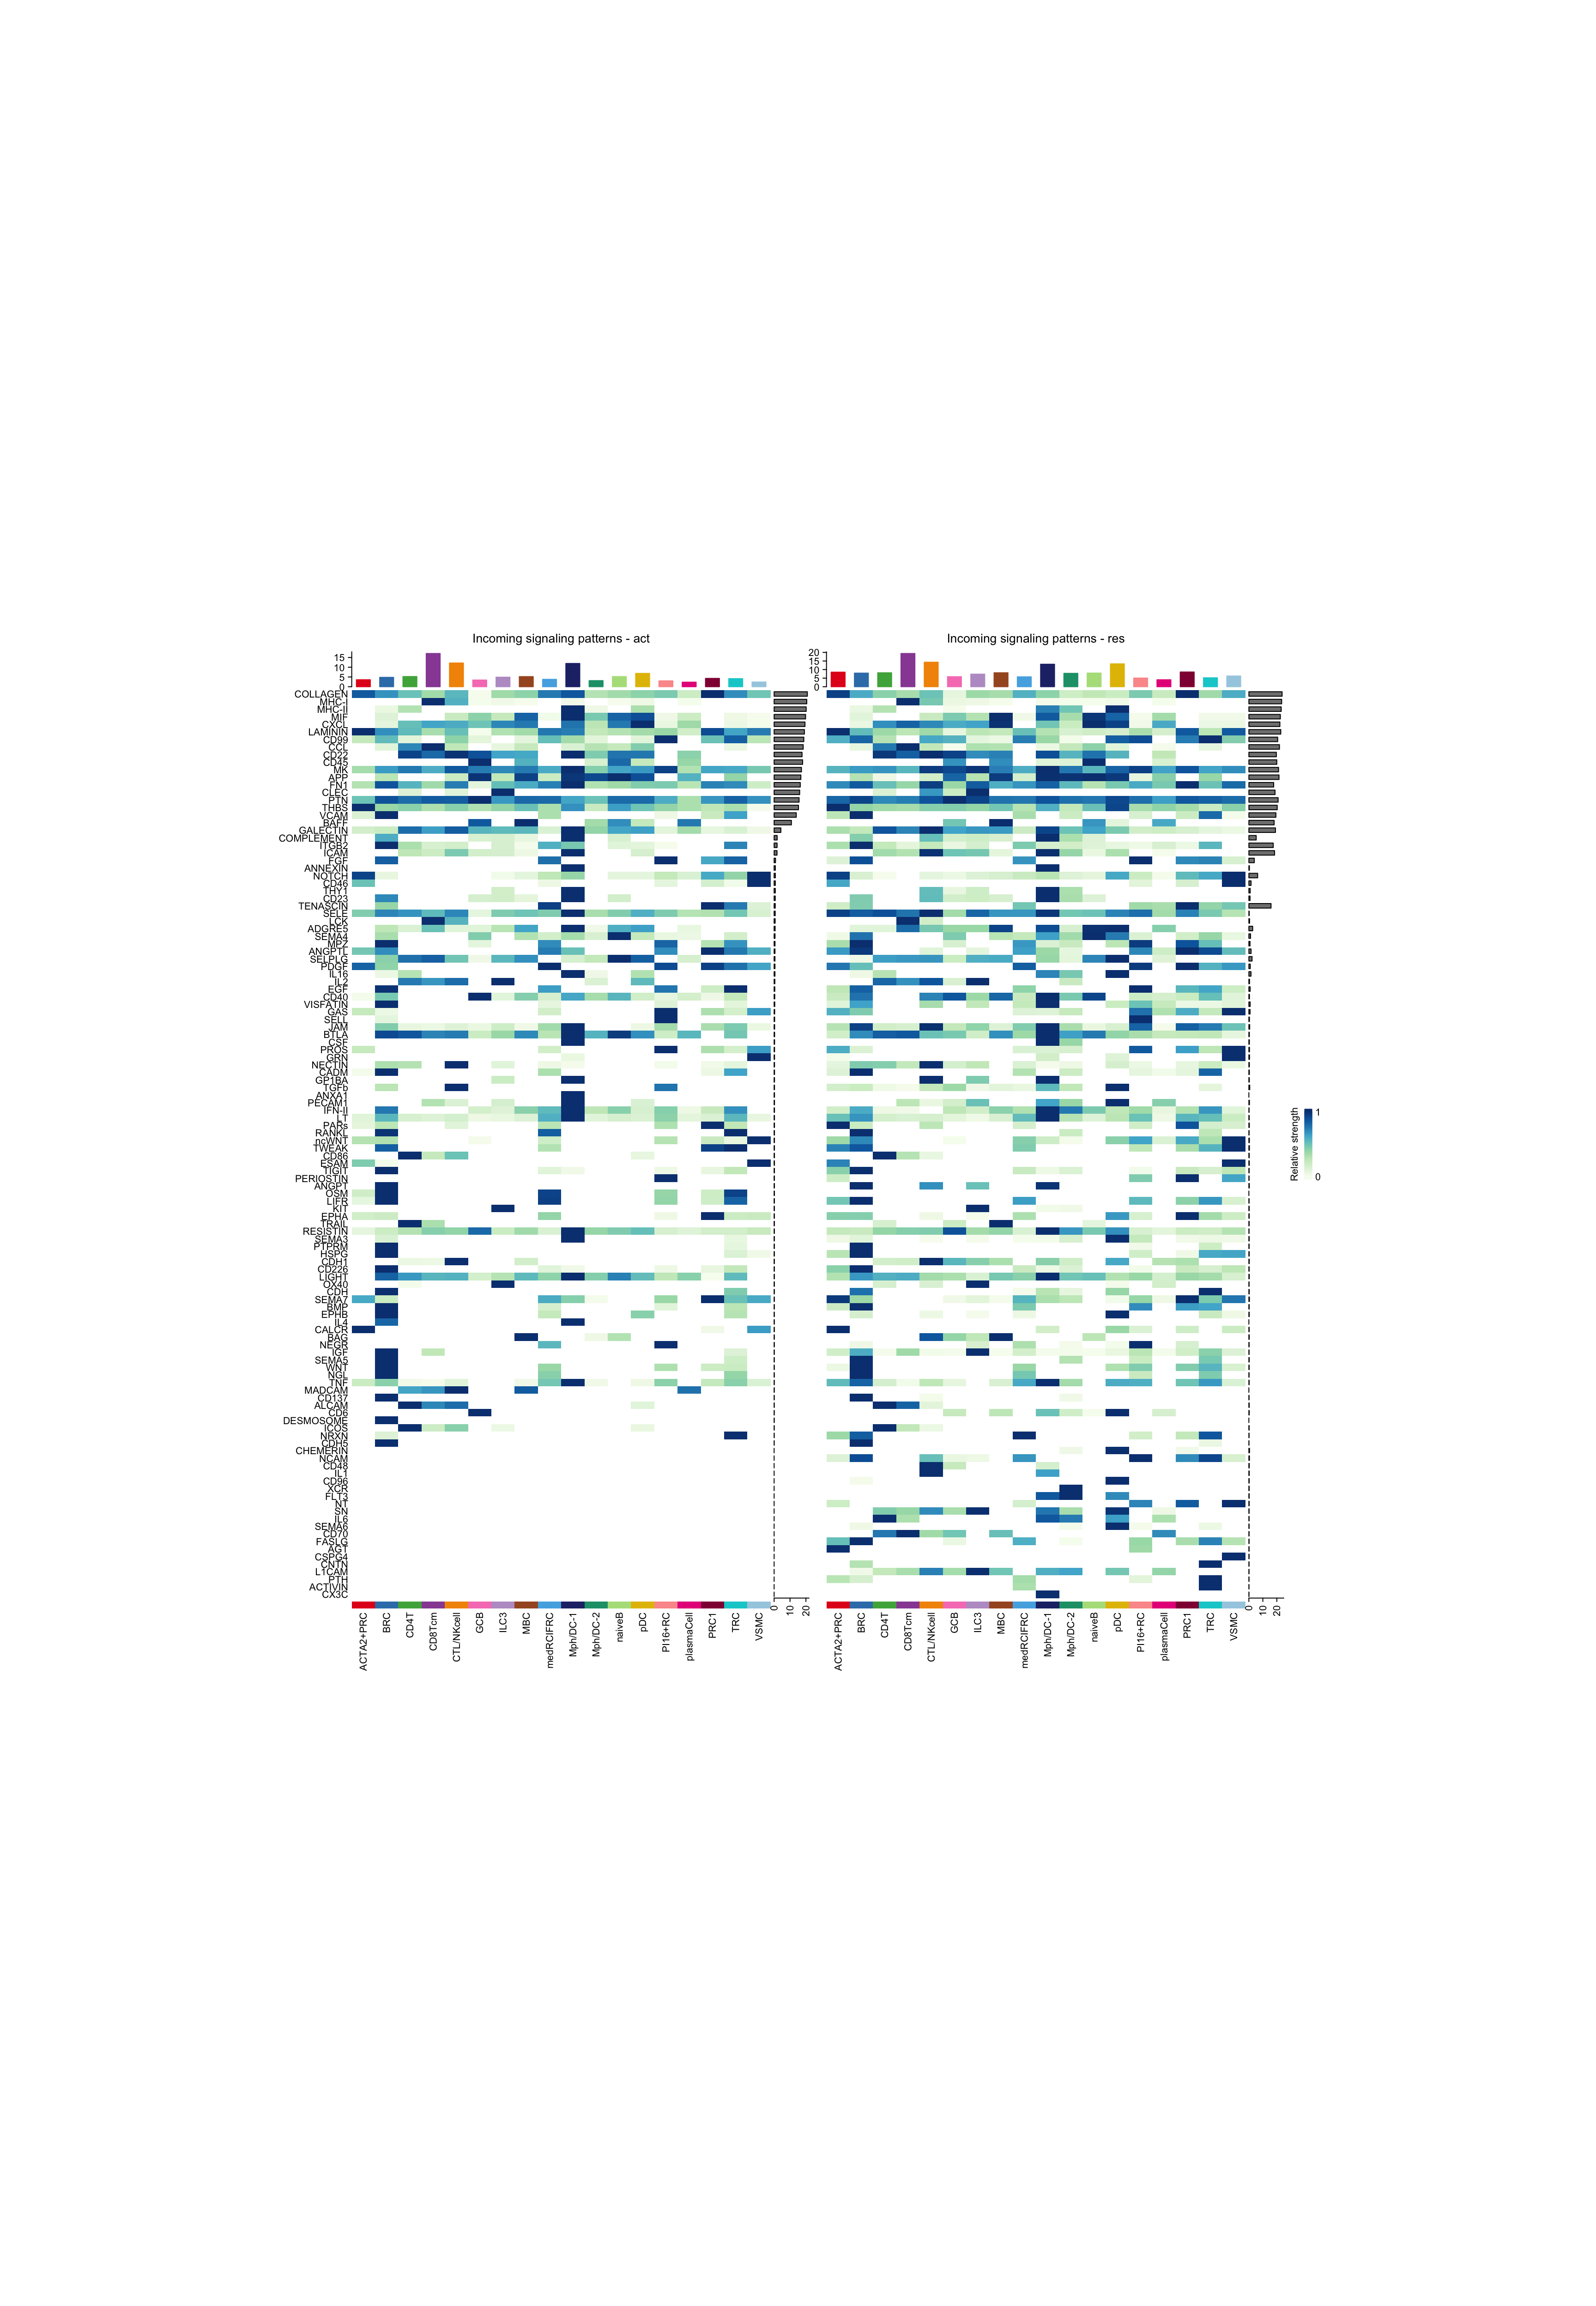
R L pairs
vis exp of RL pairs
netVisual_bubble(cellchat.merge, sources.use = "PI16+RC",
                 targets.use = c("CD4T", "CTL/NKcell", "GCB", "ILC3",
                                 "naiveB", "MBC", "plasmaCell", "CD8Tcm",
                                 "Mph/DC-1", "Mph/DC-2"),
                 comparison = c(1, 2), angle.x = 45)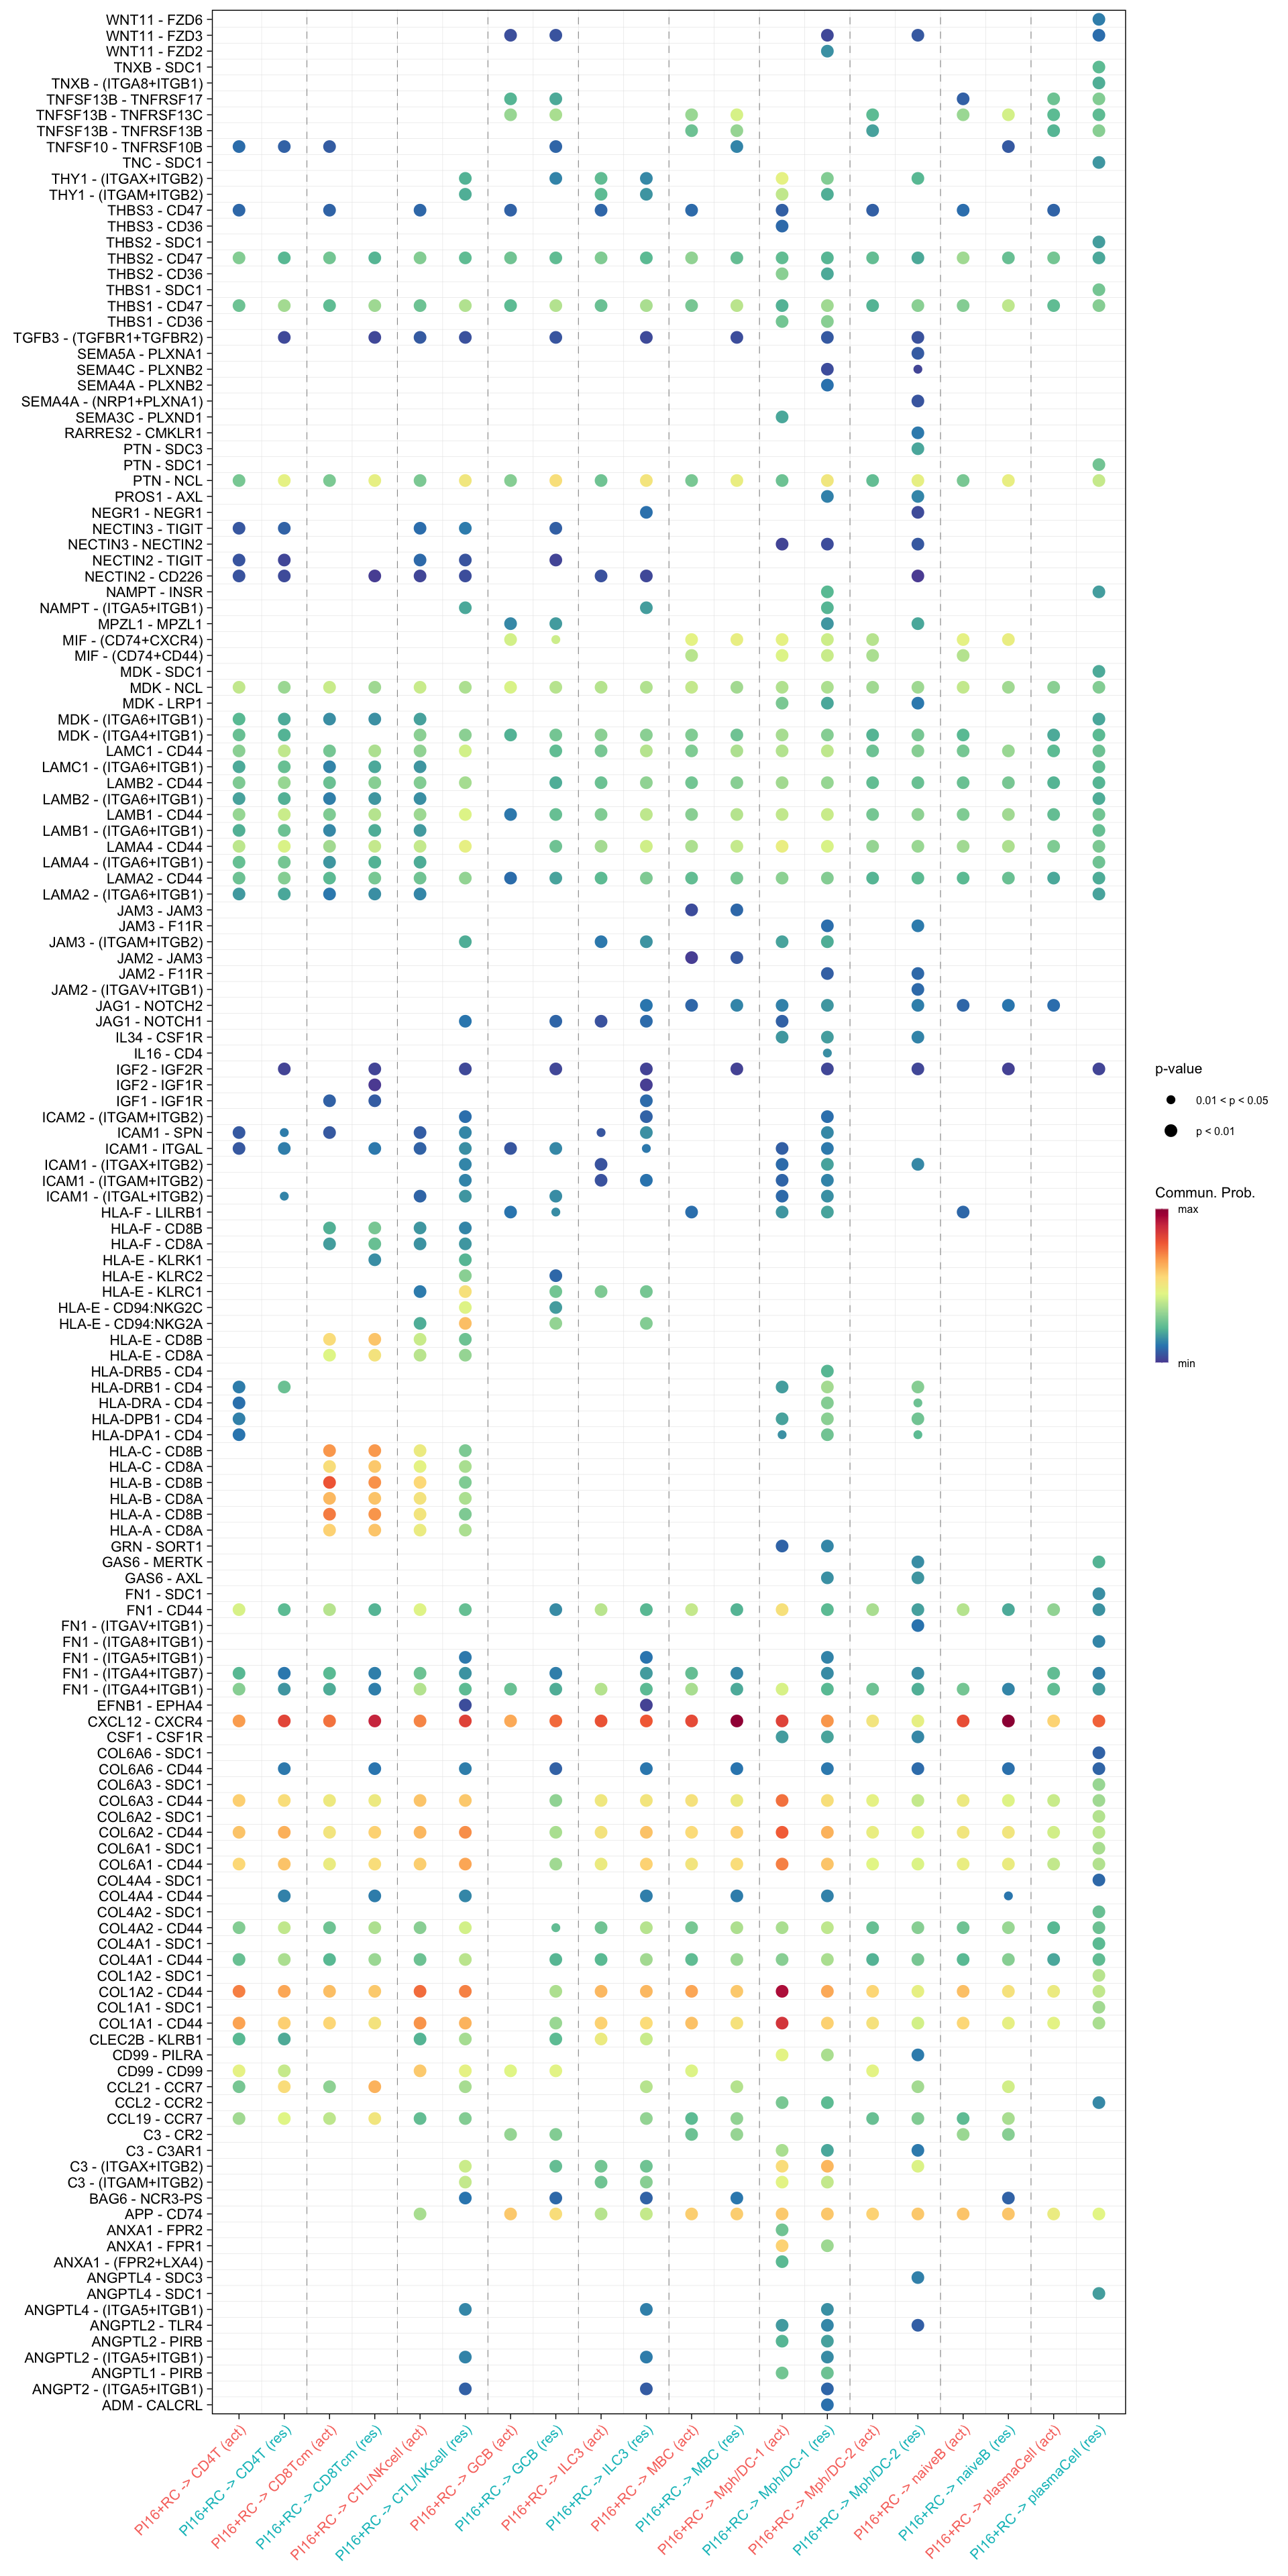
netVisual_bubble(cellchat.merge, sources.use = c("CD4T", "CTL/NKcell", "GCB", "ILC3",
                                 "naiveB", "MBC", "plasmaCell", "CD8Tcm",
                                 "Mph/DC-1", "Mph/DC-2"),
                 targets.use = "PI16+RC",
                 comparison = c(1, 2), angle.x = 45)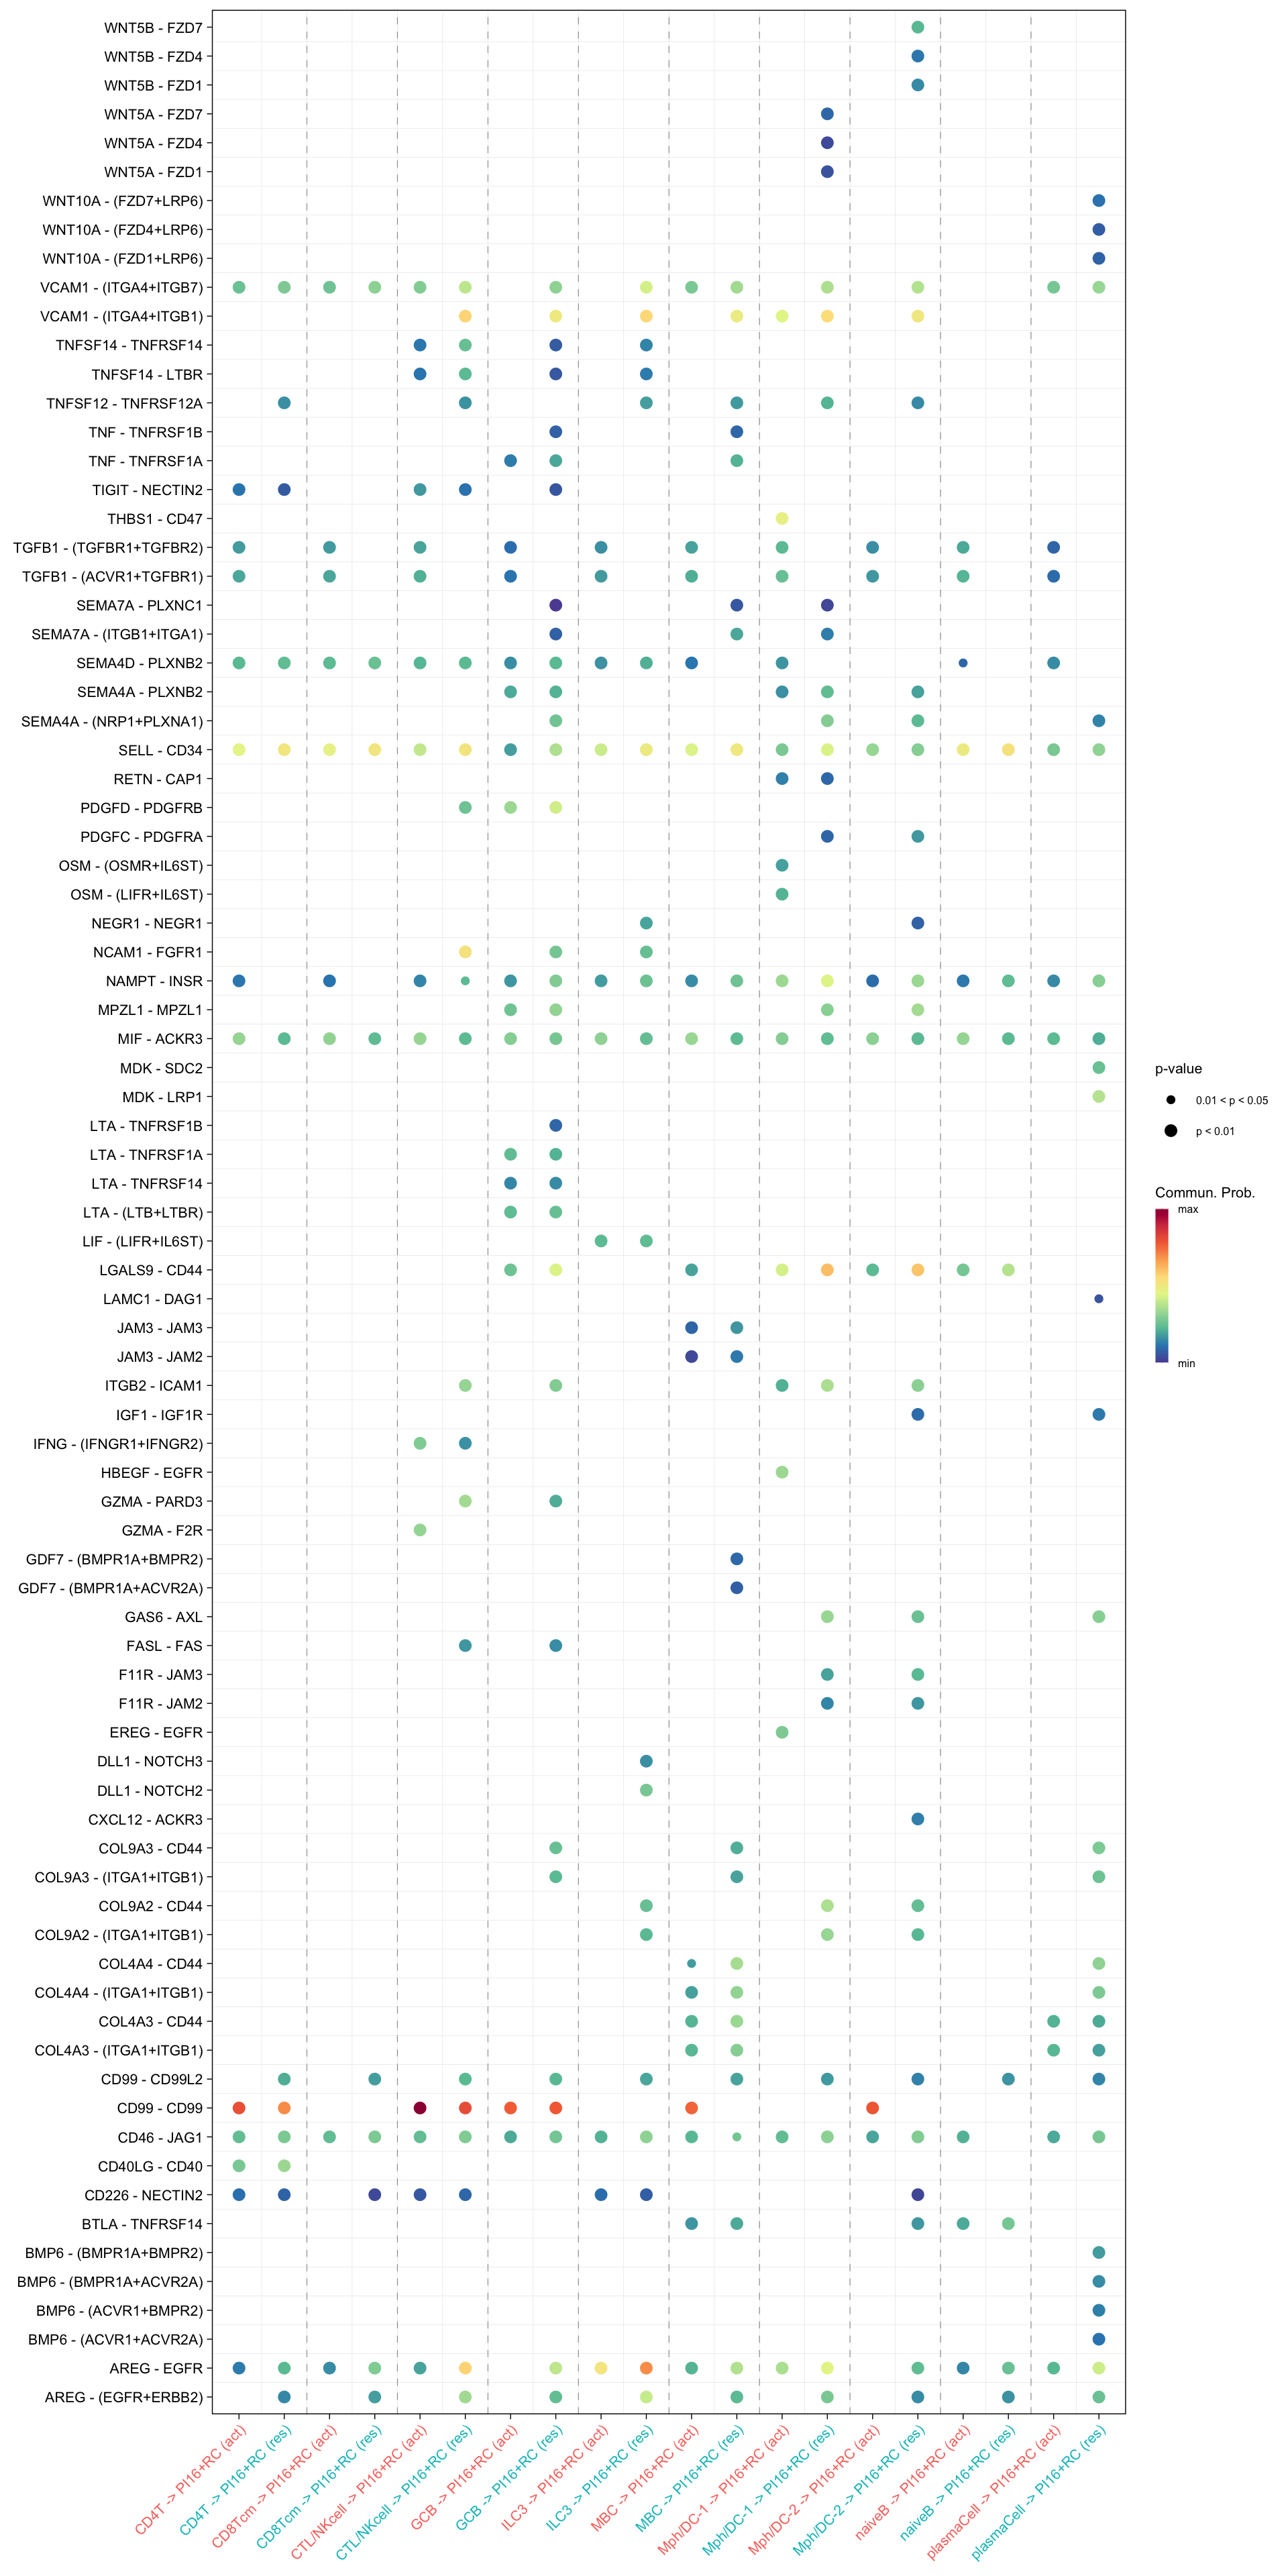
netVisual_bubble(cellchat.merge, sources.use = "PRC1",
                 targets.use = c("CD4T", "CTL/NKcell", "GCB", "ILC3",
                                 "naiveB", "MBC", "plasmaCell", "CD8Tcm",
                                 "Mph/DC-1", "Mph/DC-2"),
                 comparison = c(1, 2), angle.x = 45)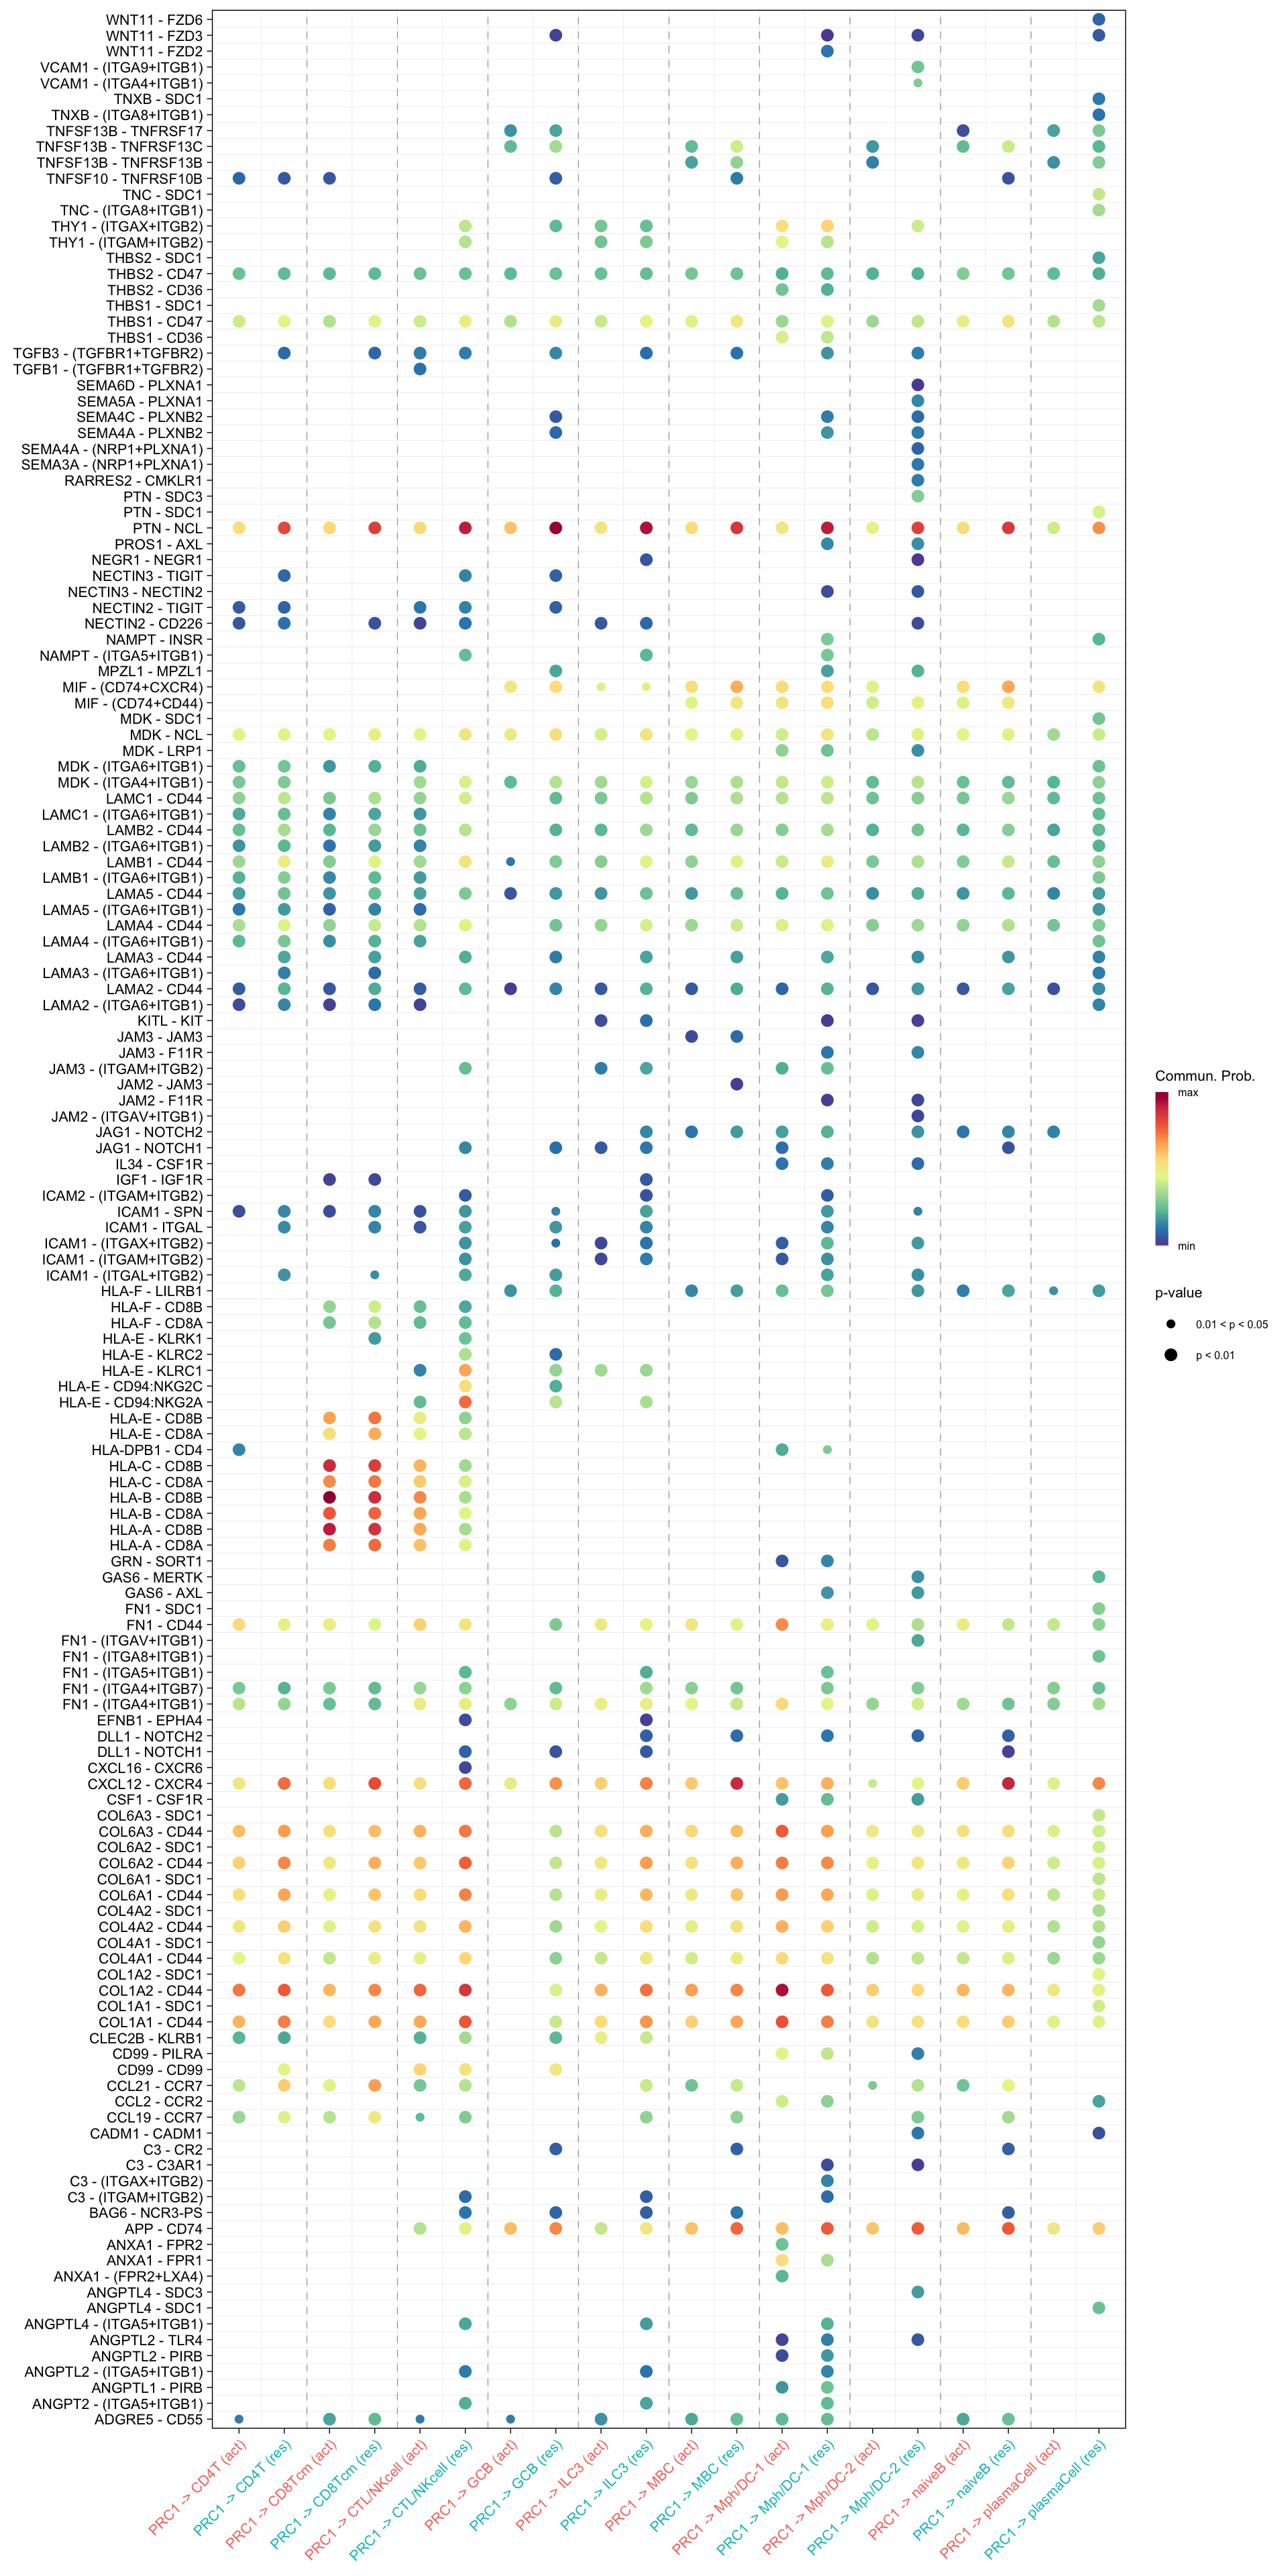
netVisual_bubble(cellchat.merge, sources.use = c("CD4T", "CTL/NKcell", "GCB", "ILC3",
                                 "naiveB", "MBC", "plasmaCell", "CD8Tcm",
                                 "Mph/DC-1", "Mph/DC-2"),
                 targets.use = "PRC1",
                 comparison = c(1, 2), angle.x = 45)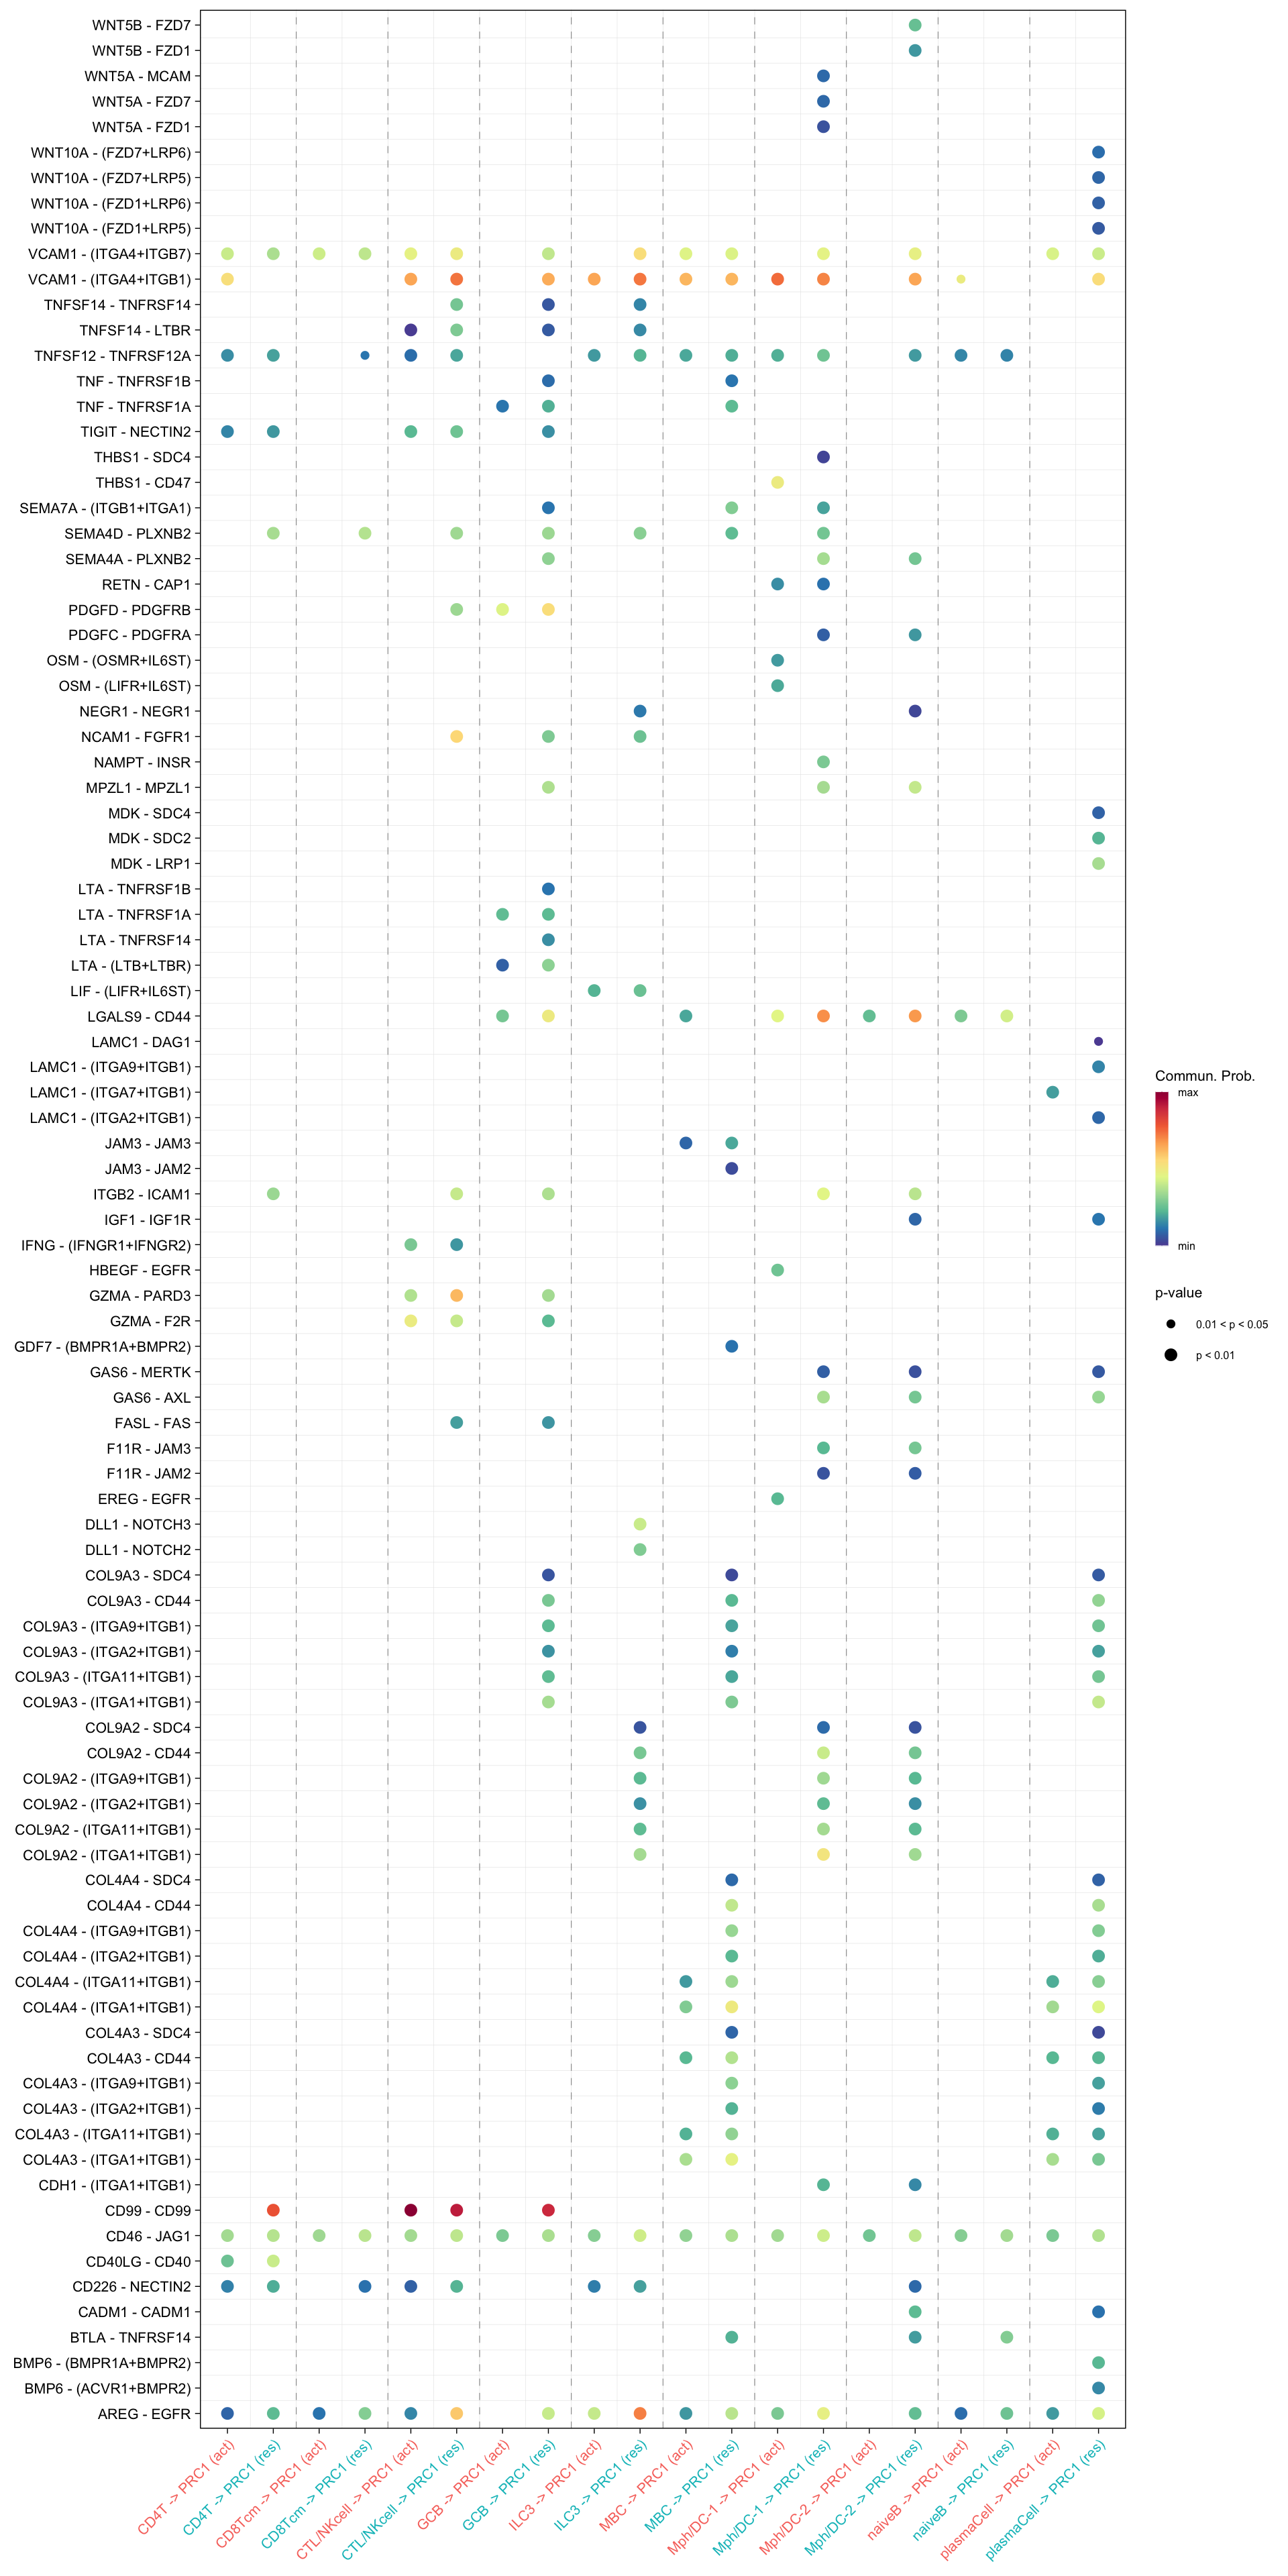
netVisual_bubble(cellchat.merge, sources.use = "ACTA2+PRC",
                 targets.use = c("CD4T", "CTL/NKcell", "GCB", "ILC3",
                                 "naiveB", "MBC", "plasmaCell", "CD8Tcm",
                                 "Mph/DC-1", "Mph/DC-2"),
                 comparison = c(1, 2), angle.x = 45)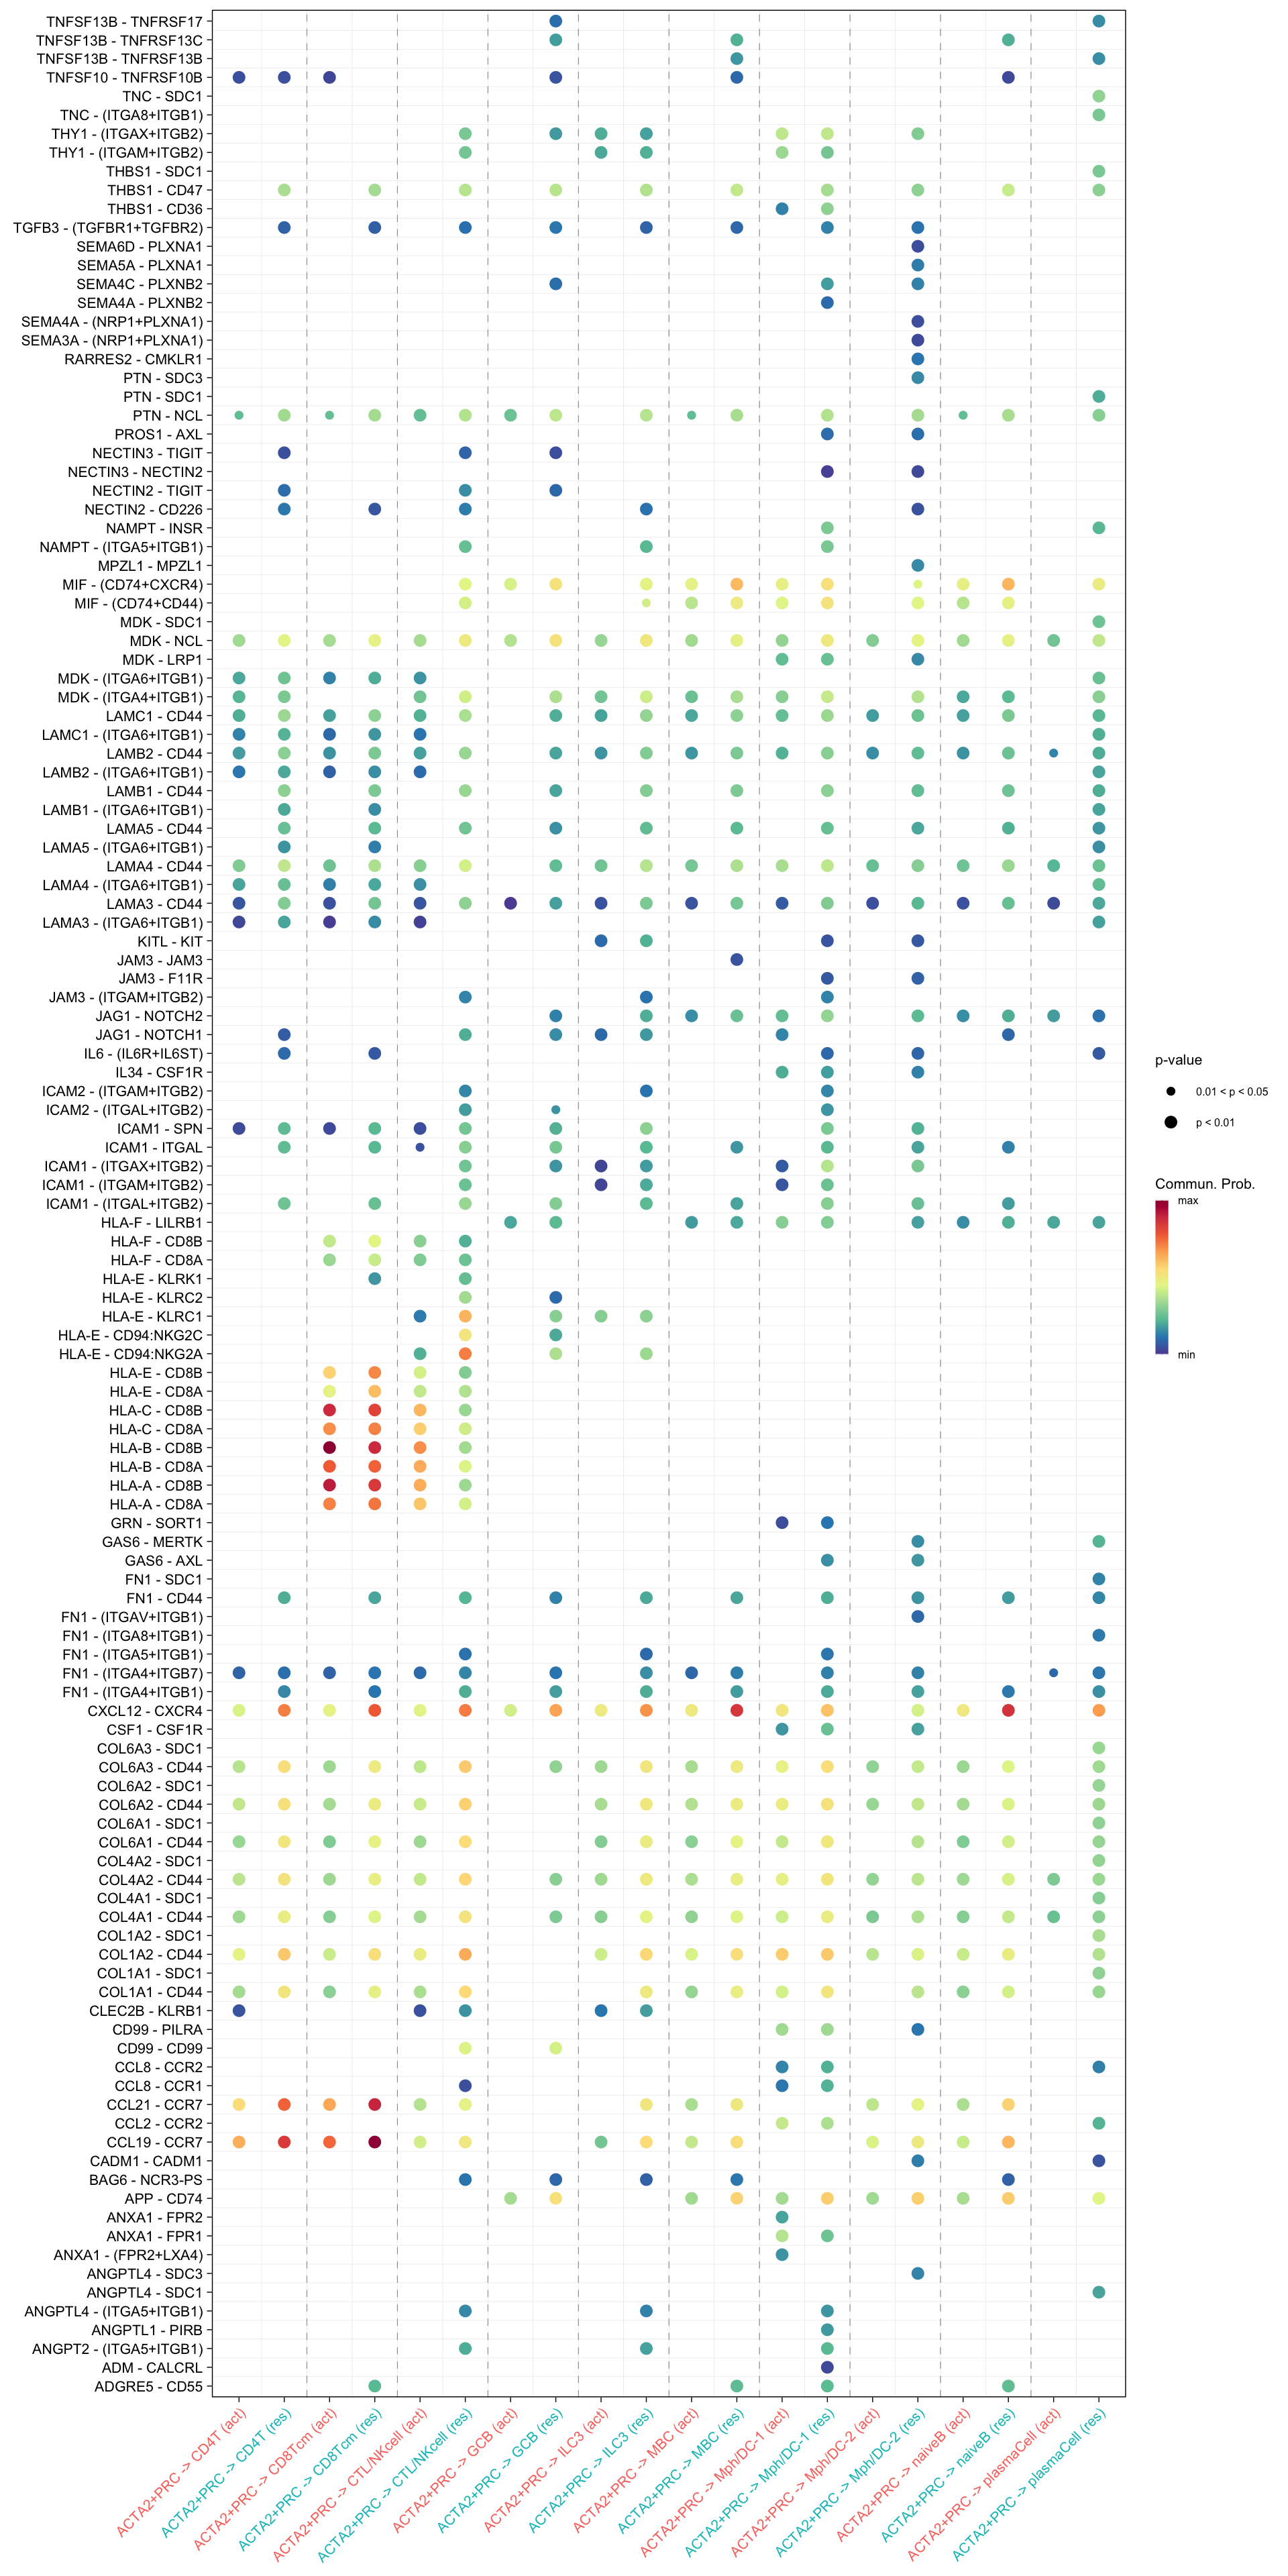
netVisual_bubble(cellchat.merge, sources.use = c("CD4T", "CTL/NKcell", "GCB", "ILC3",
                                 "naiveB", "MBC", "plasmaCell", "CD8Tcm",
                                 "Mph/DC-1", "Mph/DC-2"),
                 targets.use = "ACTA2+PRC",
                 comparison = c(1, 2), angle.x = 45)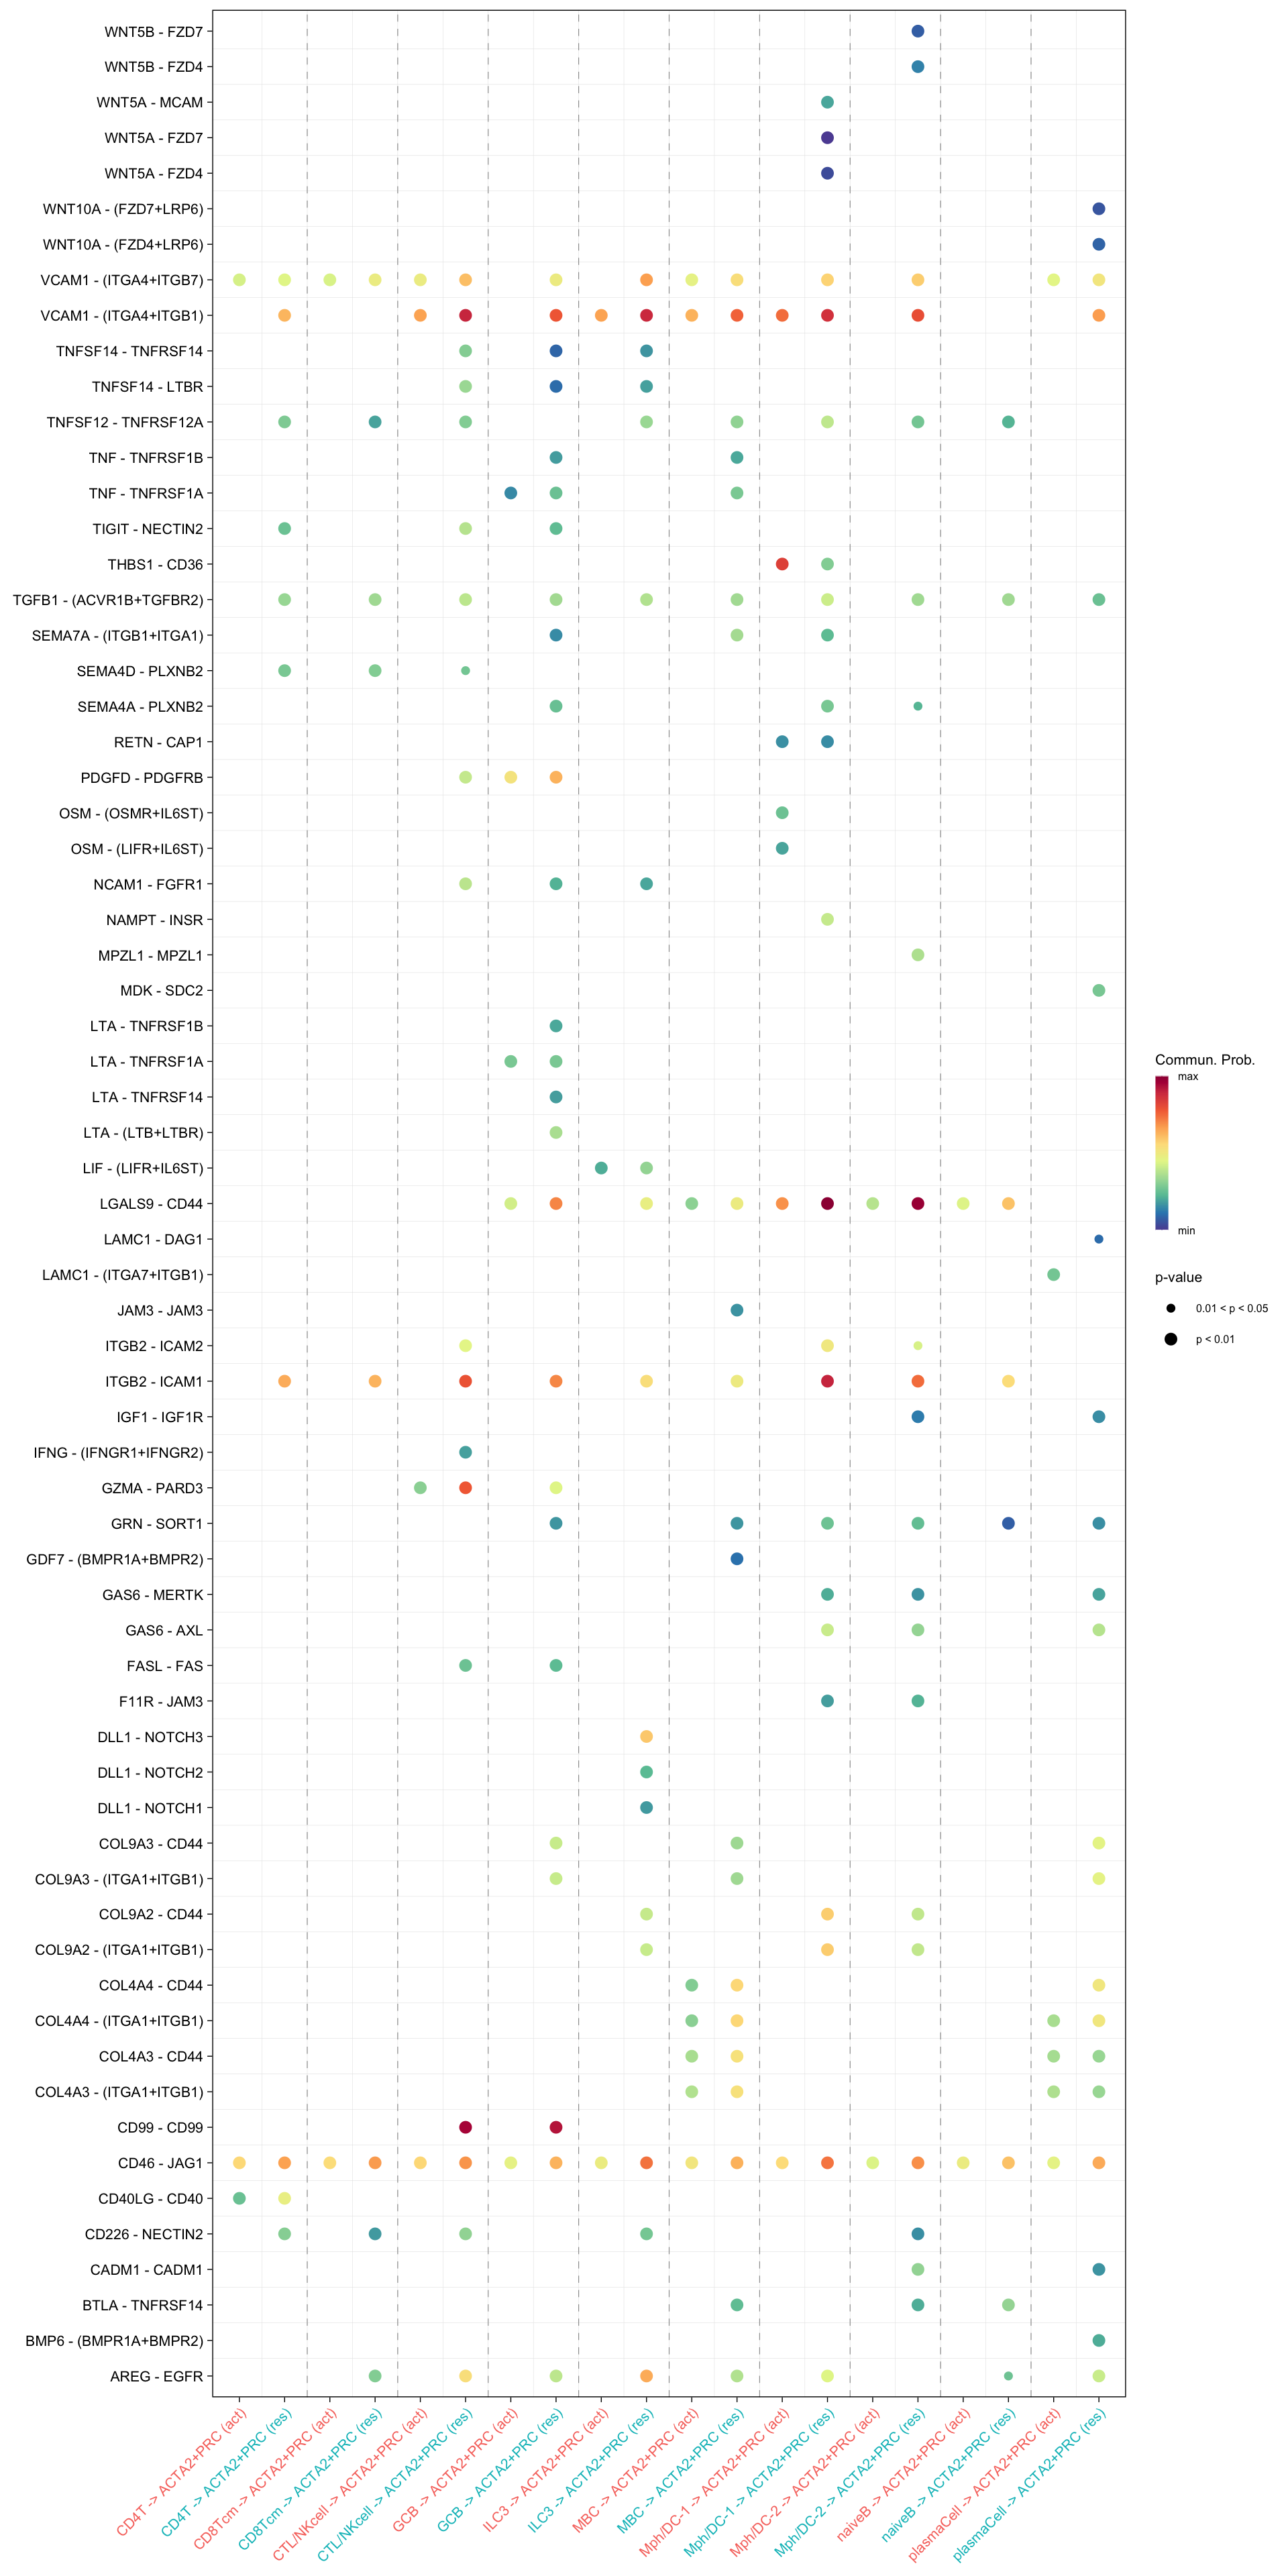
vis exp of diff RL pairs
##### ----------------- FRC to immune cells ------------------- ######

gg1 <- netVisual_bubble(cellchat.merge, sources.use = "PI16+RC",
                        targets.use = c("CD4T", "CTL/NKcell", "GCB", "ILC3",
                                 "naiveB", "MBC", "plasmaCell", "CD8Tcm",
                                 "Mph/DC-1", "Mph/DC-2"),
                        comparison = c(1, 2), max.dataset = 2,
                        title.name = "Increased signaling in resting", angle.x = 45,
                        remove.isolate = T)
gg2 <- netVisual_bubble(cellchat.merge, sources.use = "PI16+RC",
                        targets.use = c("CD4T", "CTL/NKcell", "GCB", "ILC3",
                                 "naiveB", "MBC", "plasmaCell", "CD8Tcm",
                                 "Mph/DC-1", "Mph/DC-2"),
                        comparison = c(1, 2), max.dataset = 1,
                        title.name = "Increased signaling in activated", angle.x = 45,
                        remove.isolate = T)
gg1 + gg2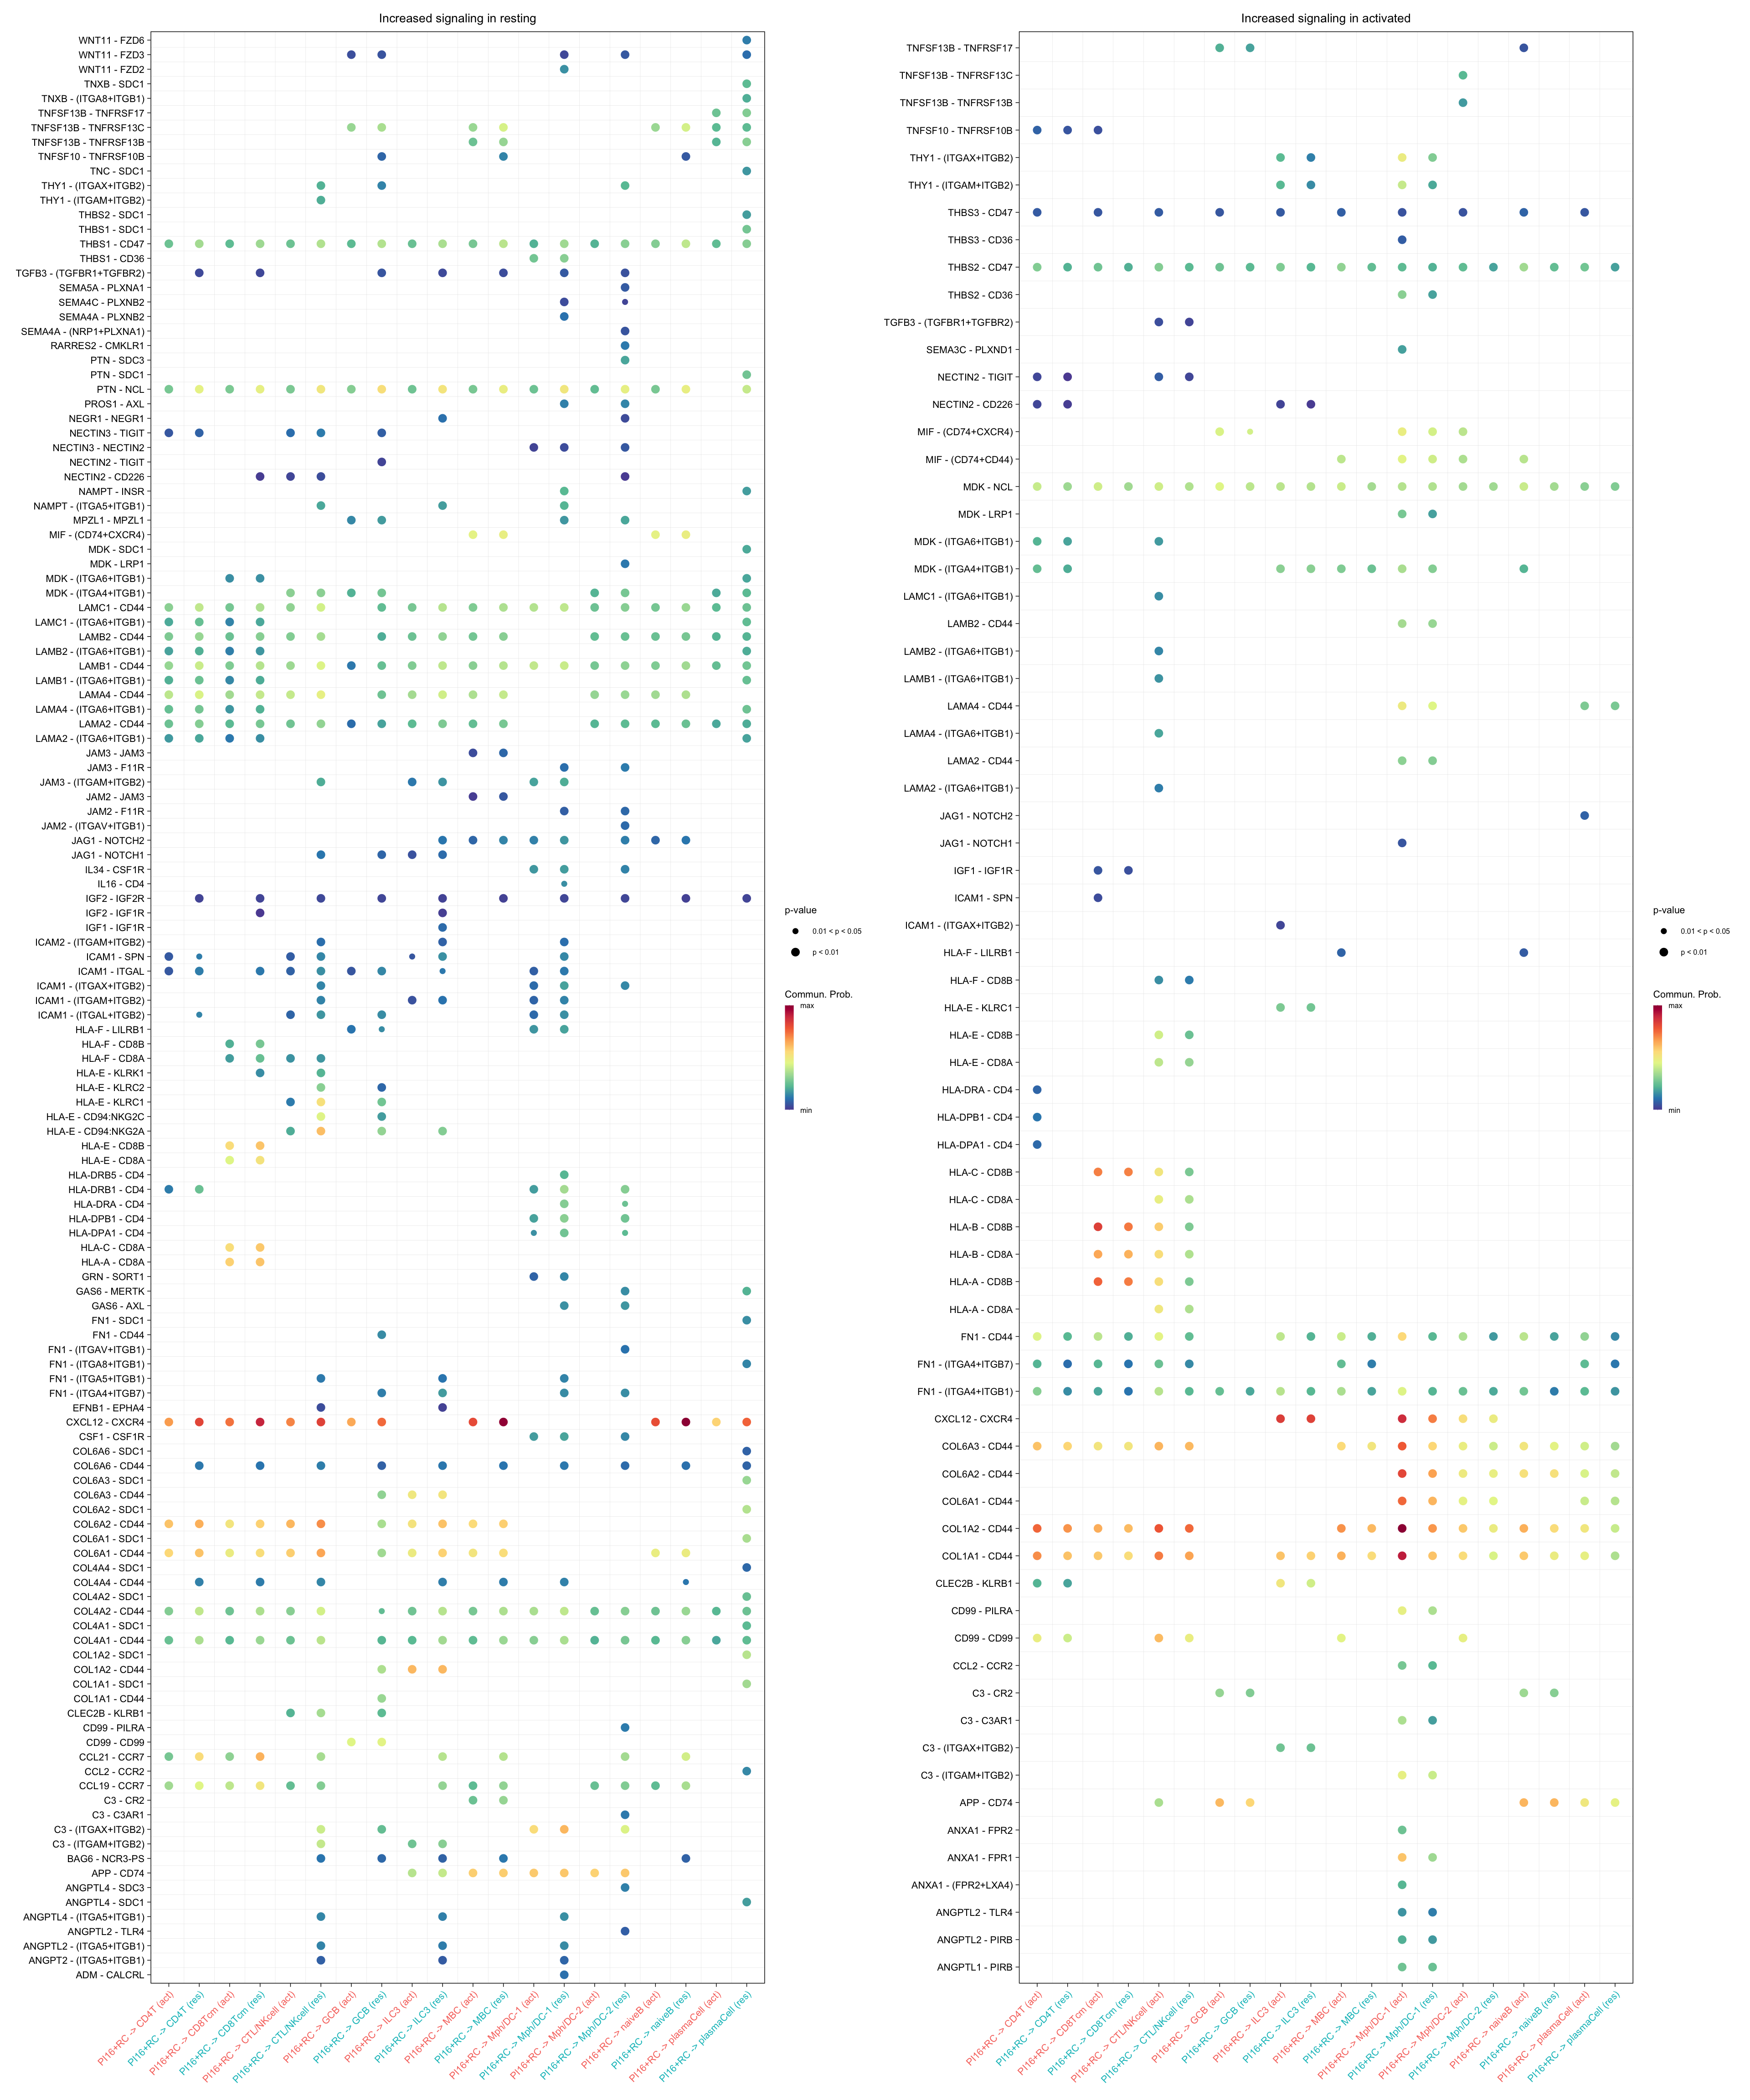
gg1 <- netVisual_bubble(cellchat.merge, sources.use = "PRC1",
                        targets.use = c("CD4T", "CTL/NKcell", "GCB", "ILC3",
                                 "naiveB", "MBC", "plasmaCell", "CD8Tcm",
                                 "Mph/DC-1", "Mph/DC-2"),
                        comparison = c(1, 2), max.dataset = 2,
                        title.name = "Increased signaling in resting", angle.x = 45,
                        remove.isolate = T)
gg2 <- netVisual_bubble(cellchat.merge, sources.use = "PRC1",
                        targets.use = c("CD4T", "CTL/NKcell", "GCB", "ILC3",
                                 "naiveB", "MBC", "plasmaCell", "CD8Tcm",
                                 "Mph/DC-1", "Mph/DC-2"),
                        comparison = c(1, 2), max.dataset = 1,
                        title.name = "Increased signaling in activated", angle.x = 45,
                        remove.isolate = T)
gg1 + gg2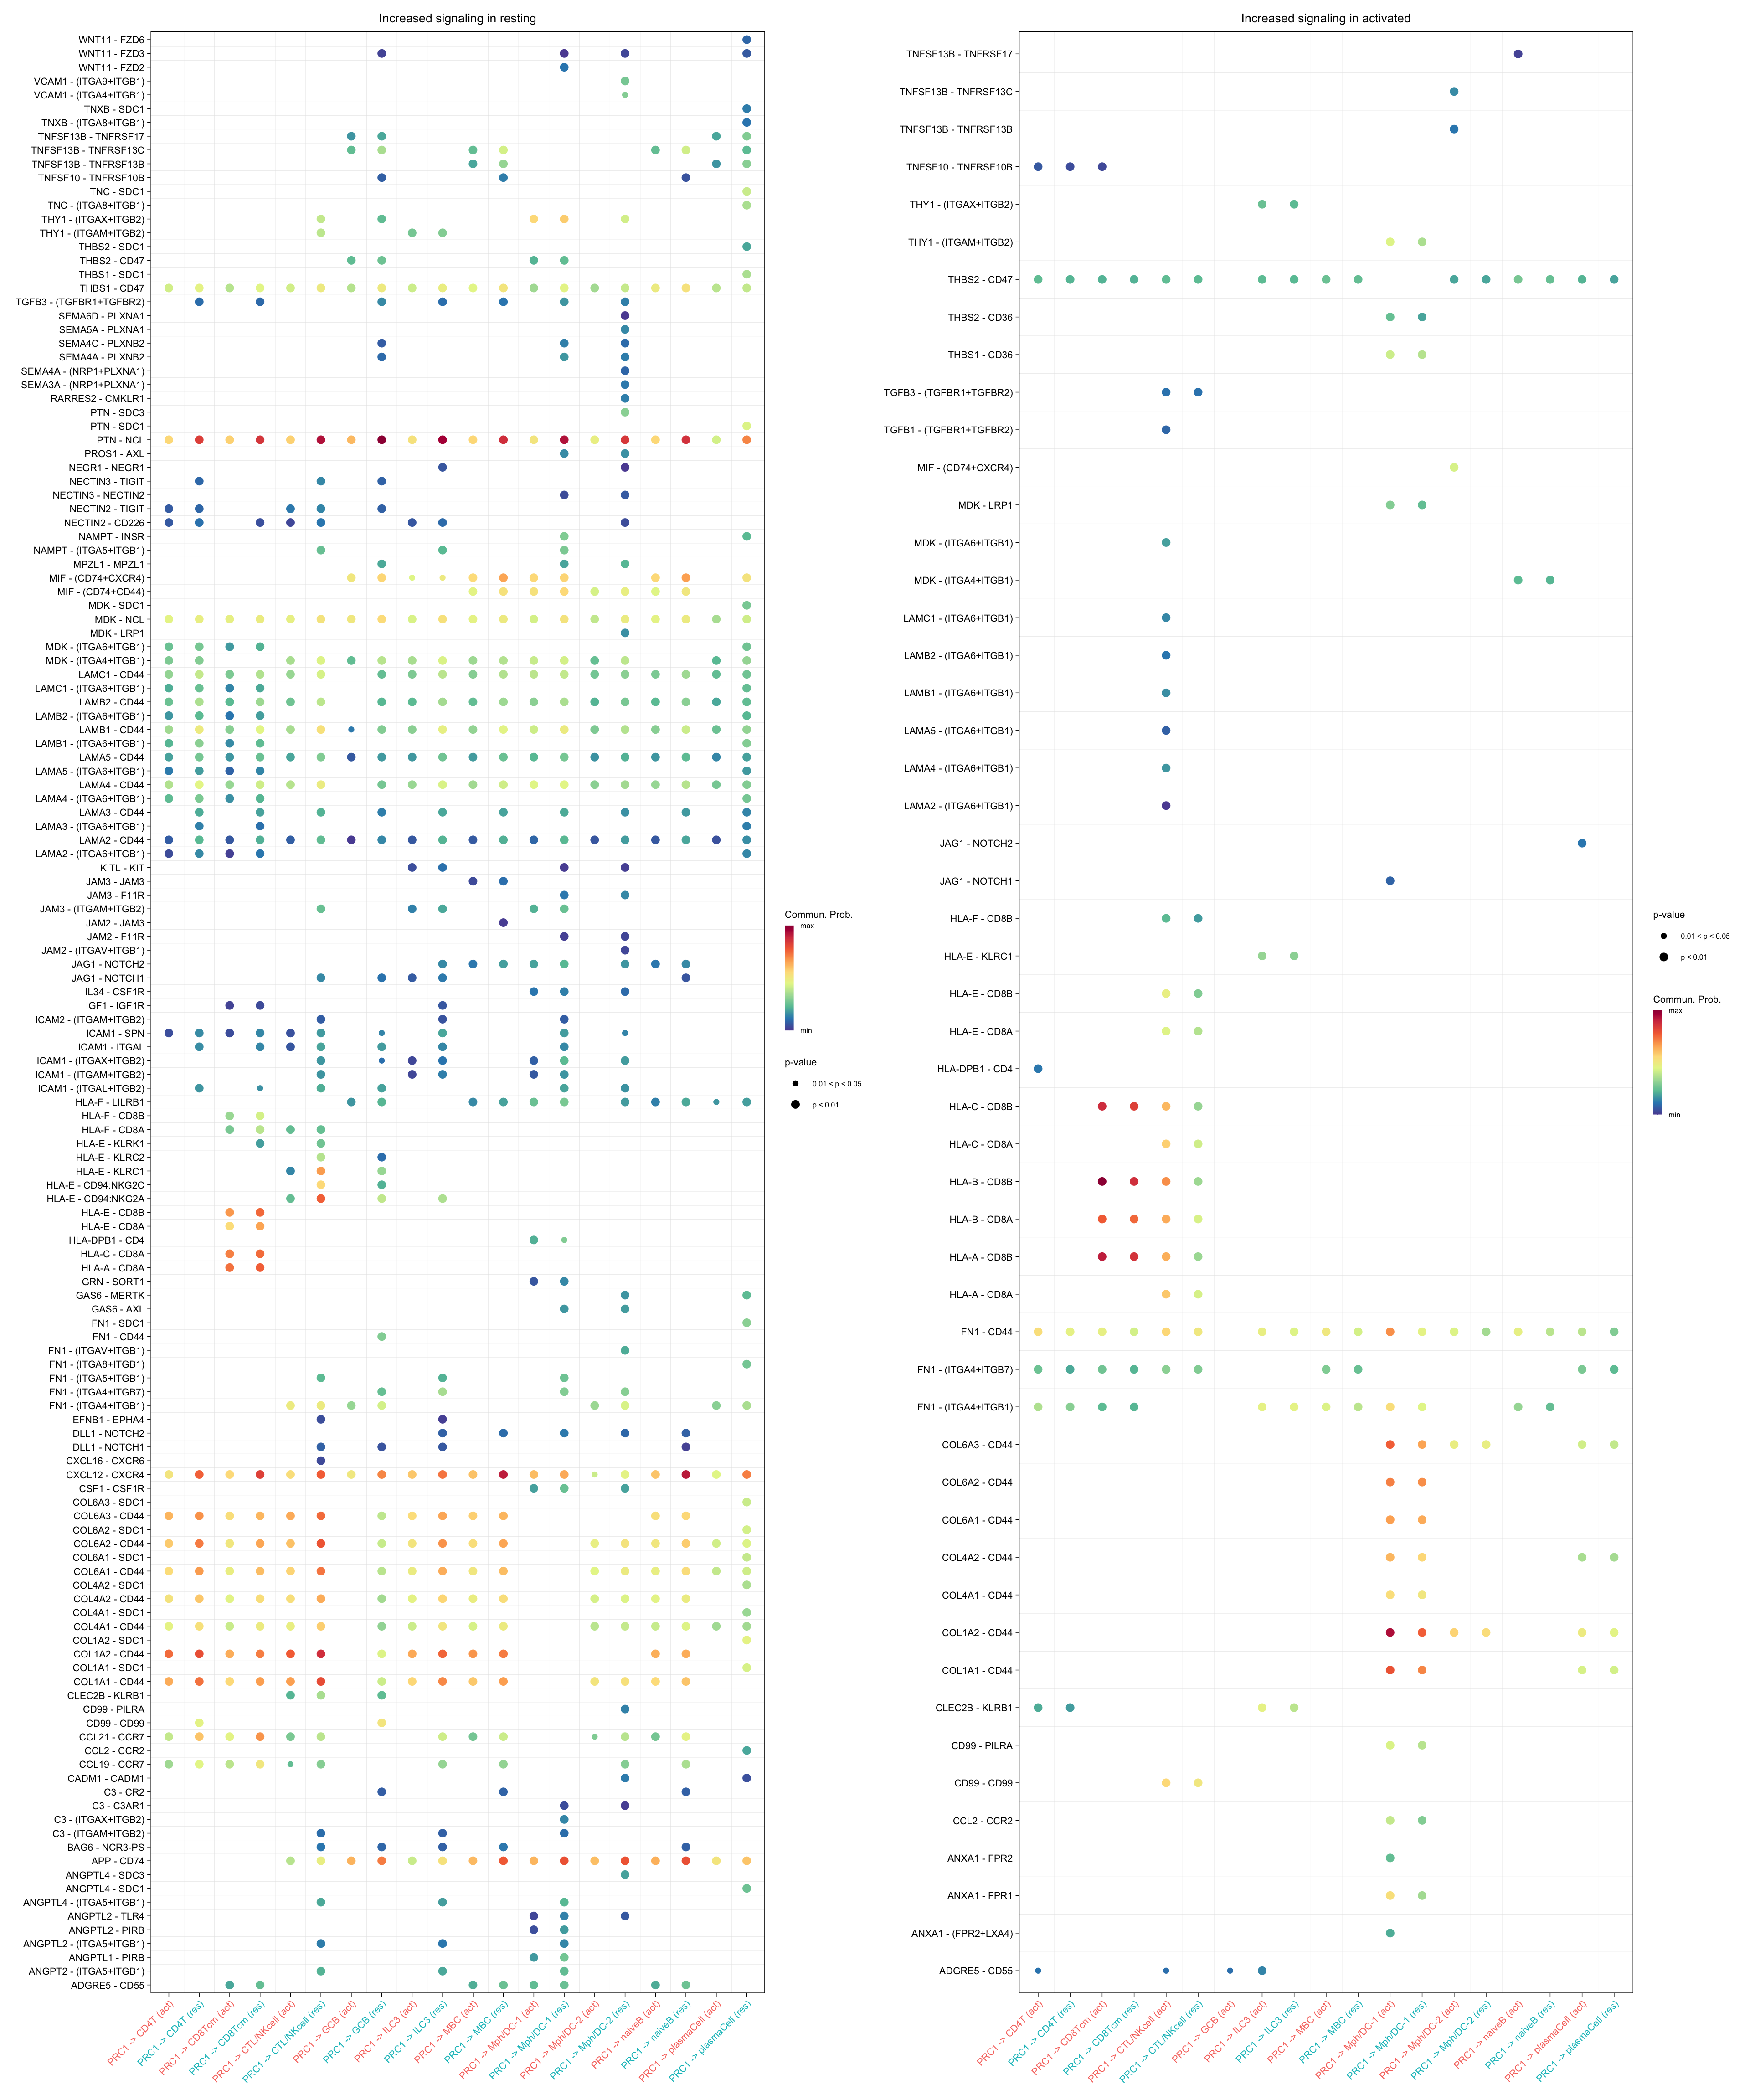
gg1 <- netVisual_bubble(cellchat.merge, sources.use = "ACTA2+PRC",
                        targets.use = c("CD4T", "CTL/NKcell", "GCB", "ILC3",
                                 "naiveB", "MBC", "plasmaCell", "CD8Tcm",
                                 "Mph/DC-1", "Mph/DC-2"),
                        comparison = c(1, 2), max.dataset = 2,
                        title.name = "Increased signaling in resting", angle.x = 45,
                        remove.isolate = T)
gg2 <- netVisual_bubble(cellchat.merge, sources.use = "ACTA2+PRC",
                        targets.use = c("CD4T", "CTL/NKcell", "GCB", "ILC3",
                                 "naiveB", "MBC", "plasmaCell", "CD8Tcm",
                                 "Mph/DC-1", "Mph/DC-2"),
                        comparison = c(1, 2), max.dataset = 1,
                        title.name = "Increased signaling in activated", angle.x = 45,
                        remove.isolate = T)
gg1 + gg2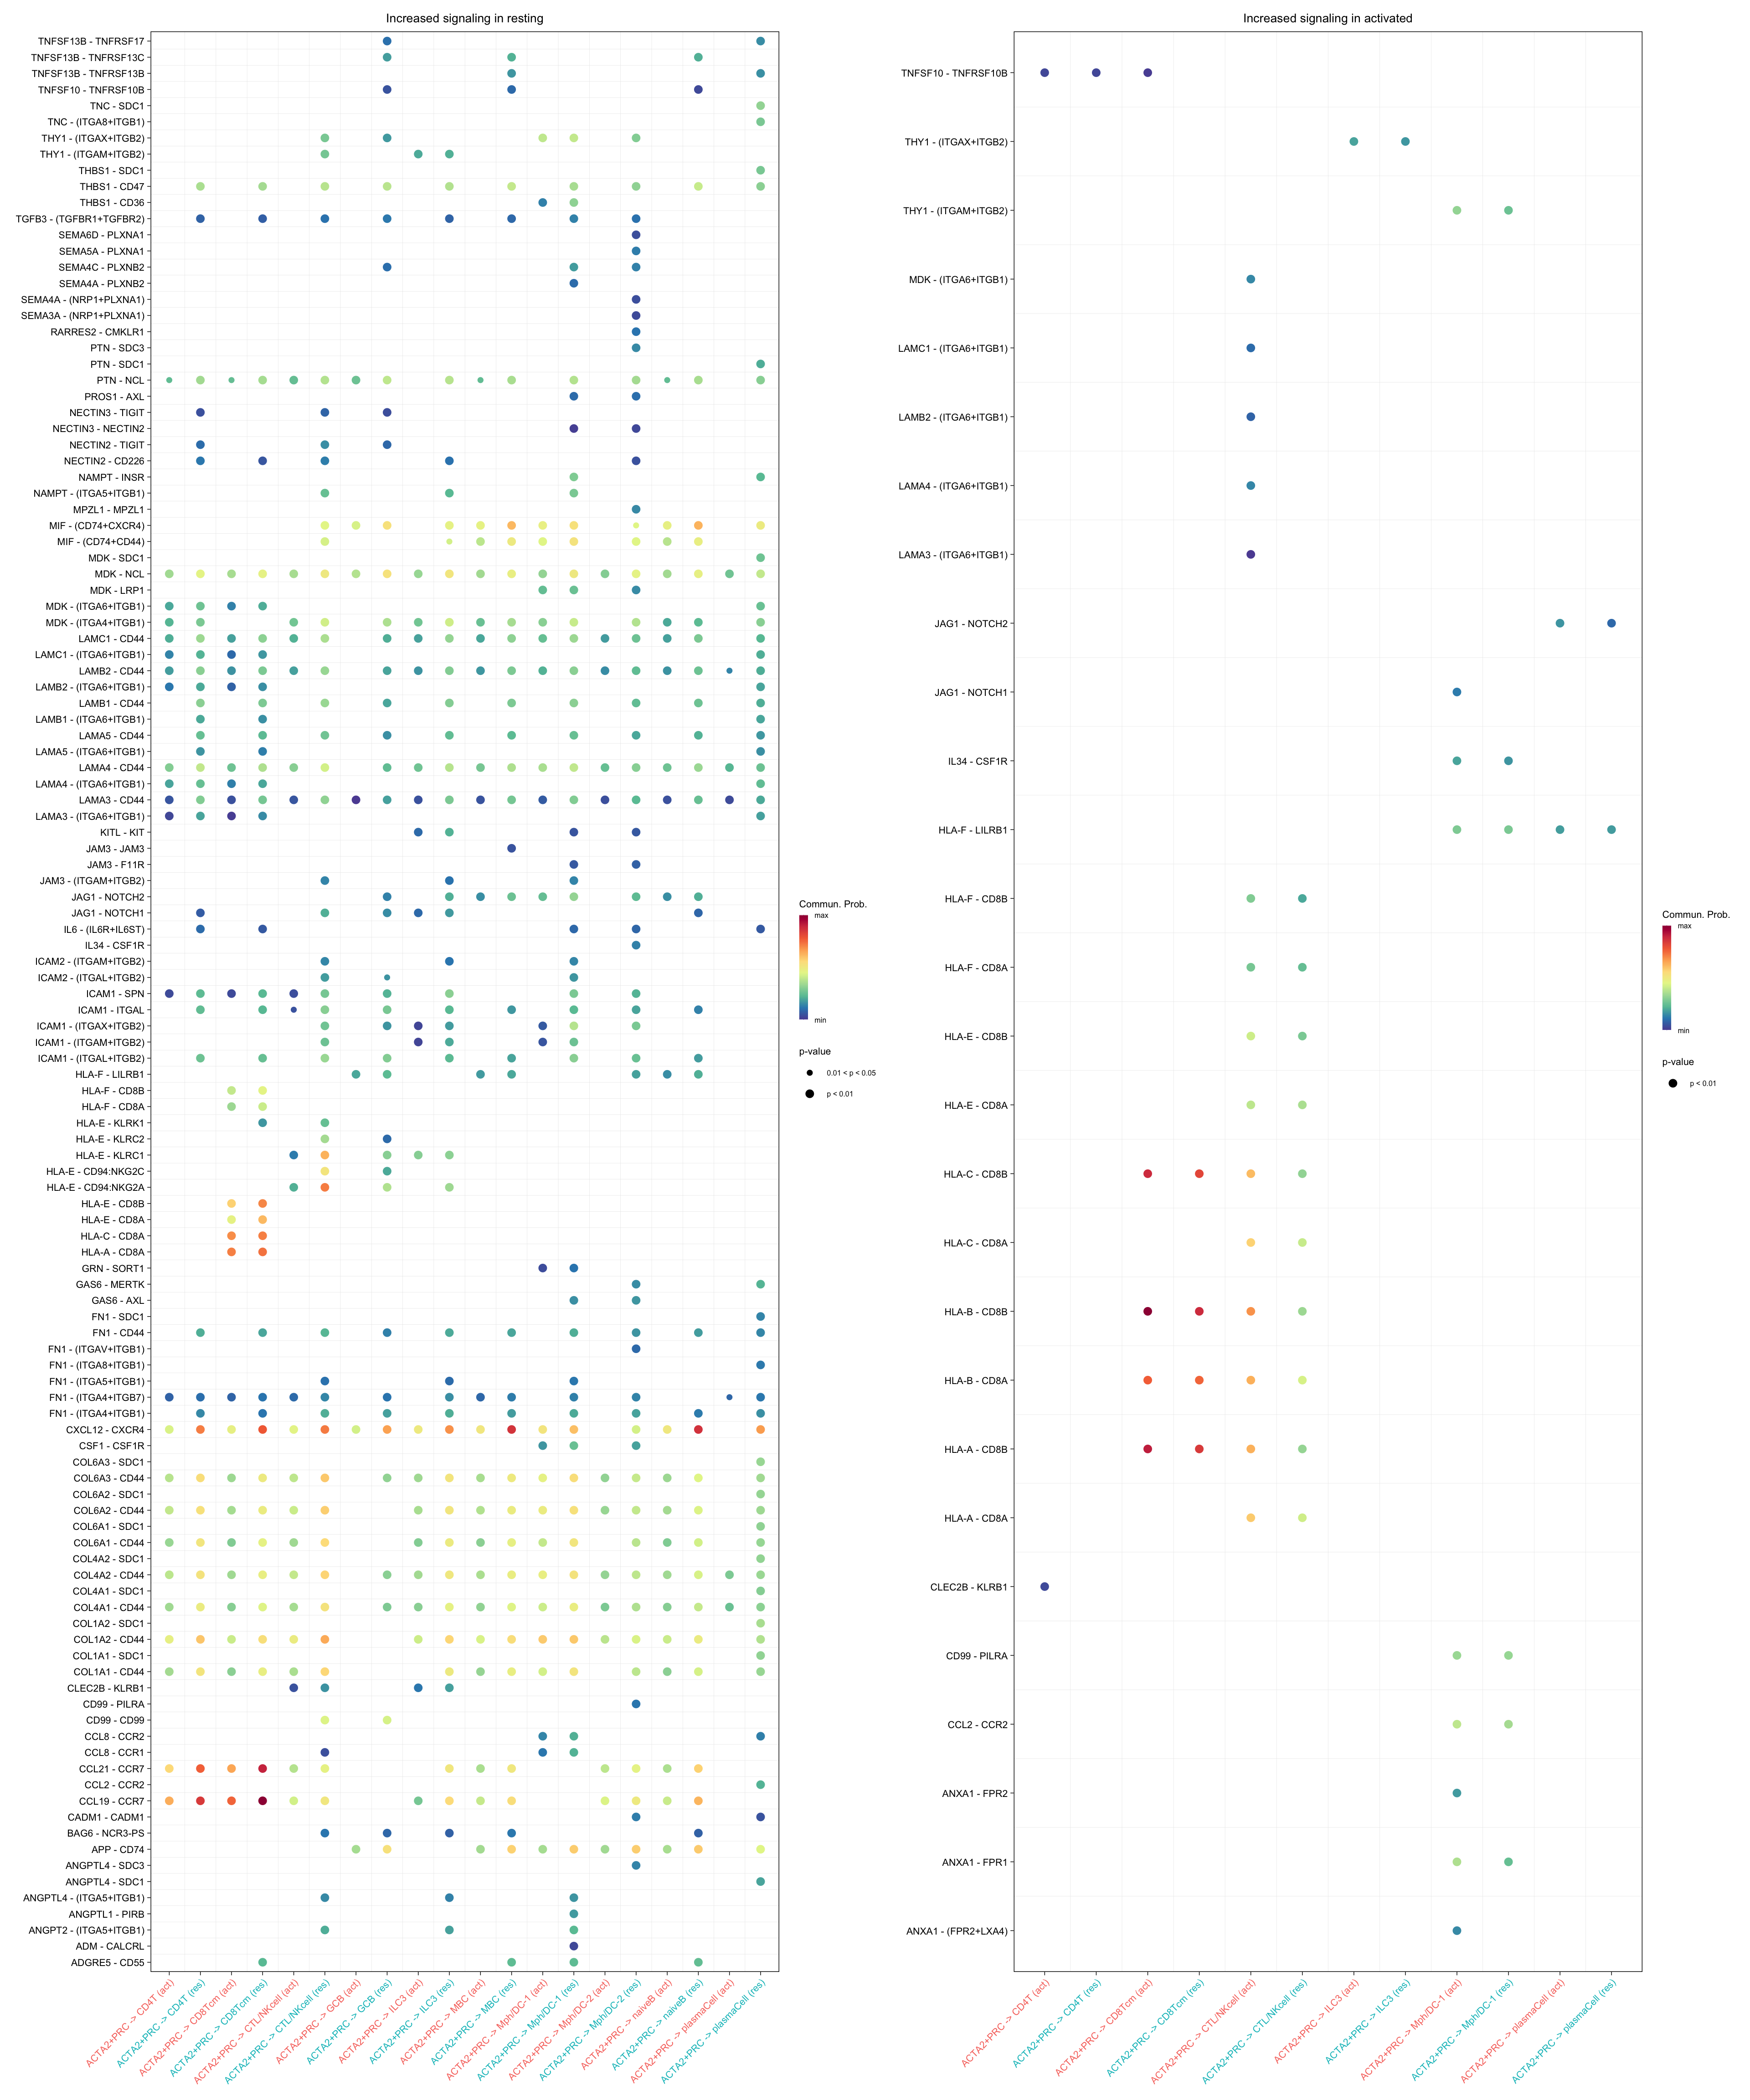
##### ----------------- Immune cells to FRCs ------------------- ######

gg1 <- netVisual_bubble(cellchat.merge, sources.use = c("CD4T", "CTL/NKcell",
                                                        "GCB", "ILC3",
                                 "naiveB", "MBC", "plasmaCell", "CD8Tcm",
                                 "Mph/DC-1", "Mph/DC-2"),
                        targets.use = "PI16+RC",
                        comparison = c(1, 2), max.dataset = 2,
                        title.name = "Increased signaling in resting", angle.x = 45,
                        remove.isolate = T)
gg2 <- netVisual_bubble(cellchat.merge, sources.use = c("CD4T", "CTL/NKcell",
                                                        "GCB", "ILC3",
                                 "naiveB", "MBC", "plasmaCell", "CD8Tcm",
                                 "Mph/DC-1", "Mph/DC-2"),
                        targets.use = "PI16+RC",
                        comparison = c(1, 2), max.dataset = 1,
                        title.name = "Increased signaling in activated", angle.x = 45,
                        remove.isolate = T)
gg1 + gg2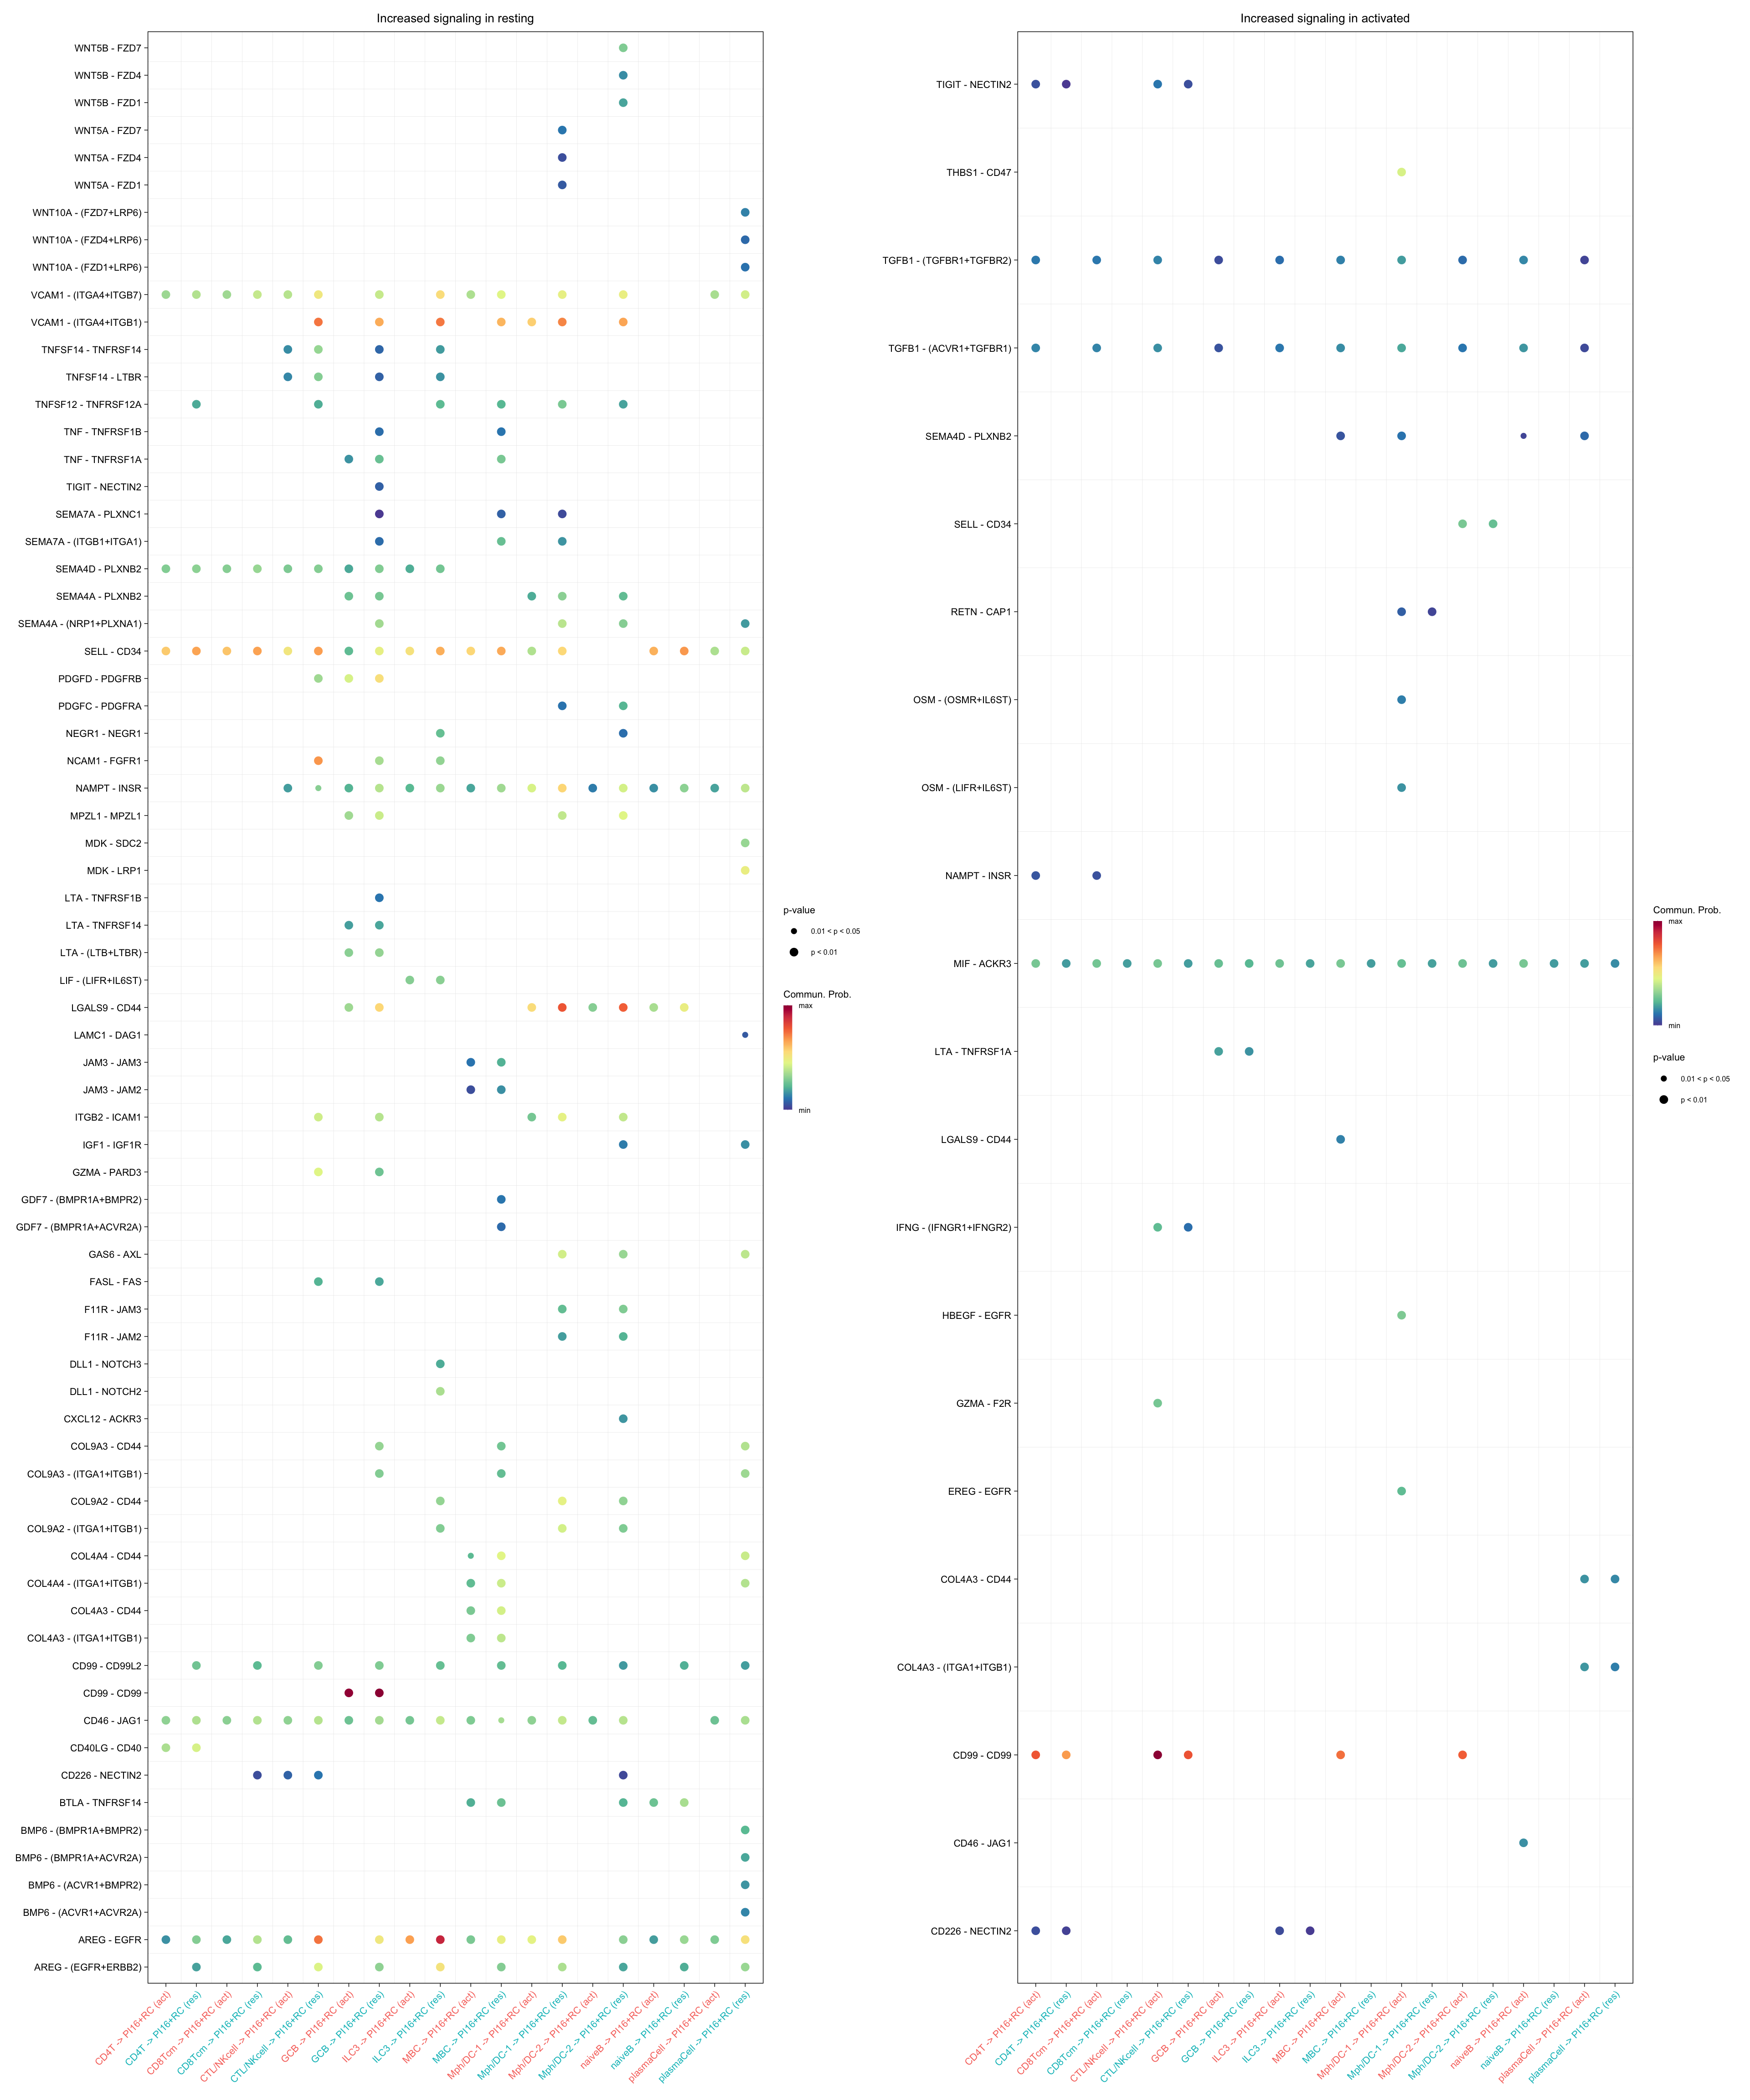
gg1 <- netVisual_bubble(cellchat.merge, sources.use = c("CD4T", "CTL/NKcell",
                                                        "GCB", "ILC3",
                                 "naiveB", "MBC", "plasmaCell", "CD8Tcm",
                                 "Mph/DC-1", "Mph/DC-2"),
                        targets.use = "PRC1",
                        comparison = c(1, 2), max.dataset = 2,
                        title.name = "Increased signaling in resting", angle.x = 45,
                        remove.isolate = T)
gg2 <- netVisual_bubble(cellchat.merge, sources.use = c("CD4T", "CTL/NKcell",
                                                        "GCB", "ILC3",
                                 "naiveB", "MBC", "plasmaCell", "CD8Tcm",
                                 "Mph/DC-1", "Mph/DC-2"),
                        targets.use = "PRC1",
                        comparison = c(1, 2), max.dataset = 1,
                        title.name = "Increased signaling in activated", angle.x = 45,
                        remove.isolate = T)
gg1 + gg2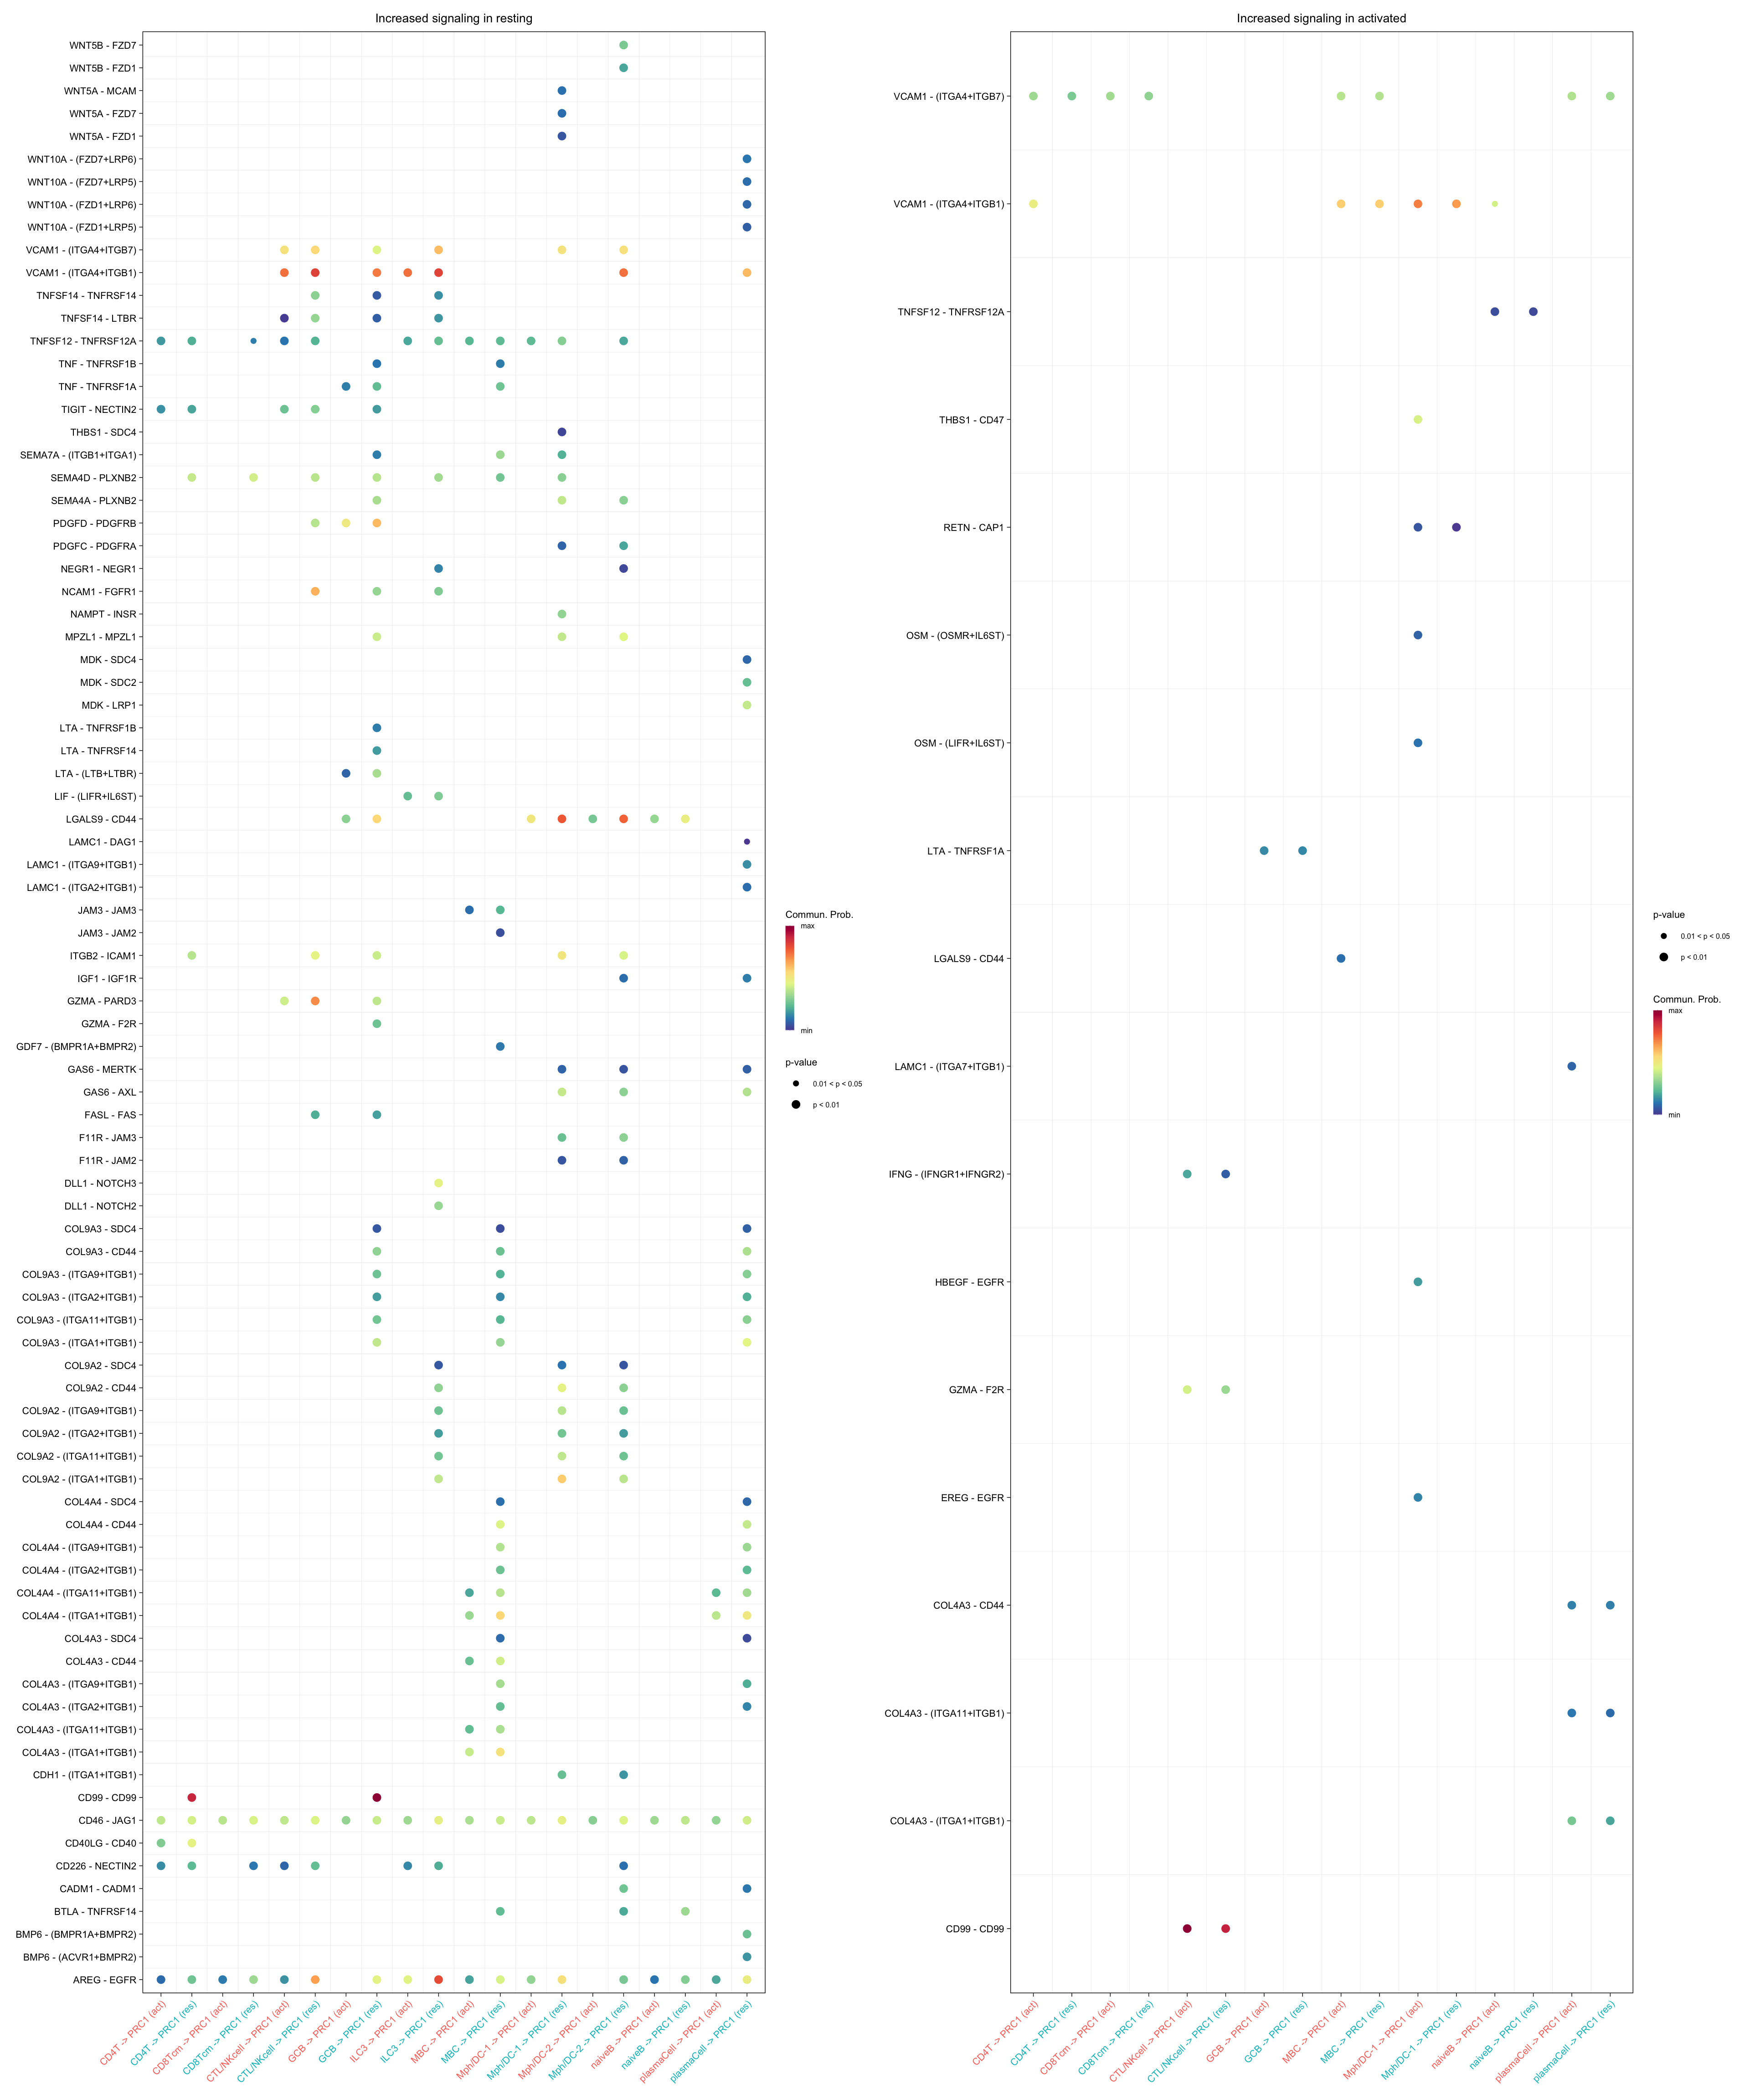
gg1 <- netVisual_bubble(cellchat.merge, sources.use = c("CD4T", "CTL/NKcell",
                                                        "GCB", "ILC3",
                                 "naiveB", "MBC", "plasmaCell", "CD8Tcm",
                                 "Mph/DC-1", "Mph/DC-2"),
                        targets.use = "ACTA2+PRC",
                        comparison = c(1, 2), max.dataset = 2,
                        title.name = "Increased signaling in resting", angle.x = 45,
                        remove.isolate = T)
gg2 <- netVisual_bubble(cellchat.merge, sources.use = c("CD4T", "CTL/NKcell",
                                                        "GCB", "ILC3",
                                 "naiveB", "MBC", "plasmaCell", "CD8Tcm",
                                 "Mph/DC-1", "Mph/DC-2"),
                        targets.use = "ACTA2+PRC",
                        comparison = c(1, 2), max.dataset = 1,
                        title.name = "Increased signaling in activated", angle.x = 45,
                        remove.isolate = T)
gg1 + gg2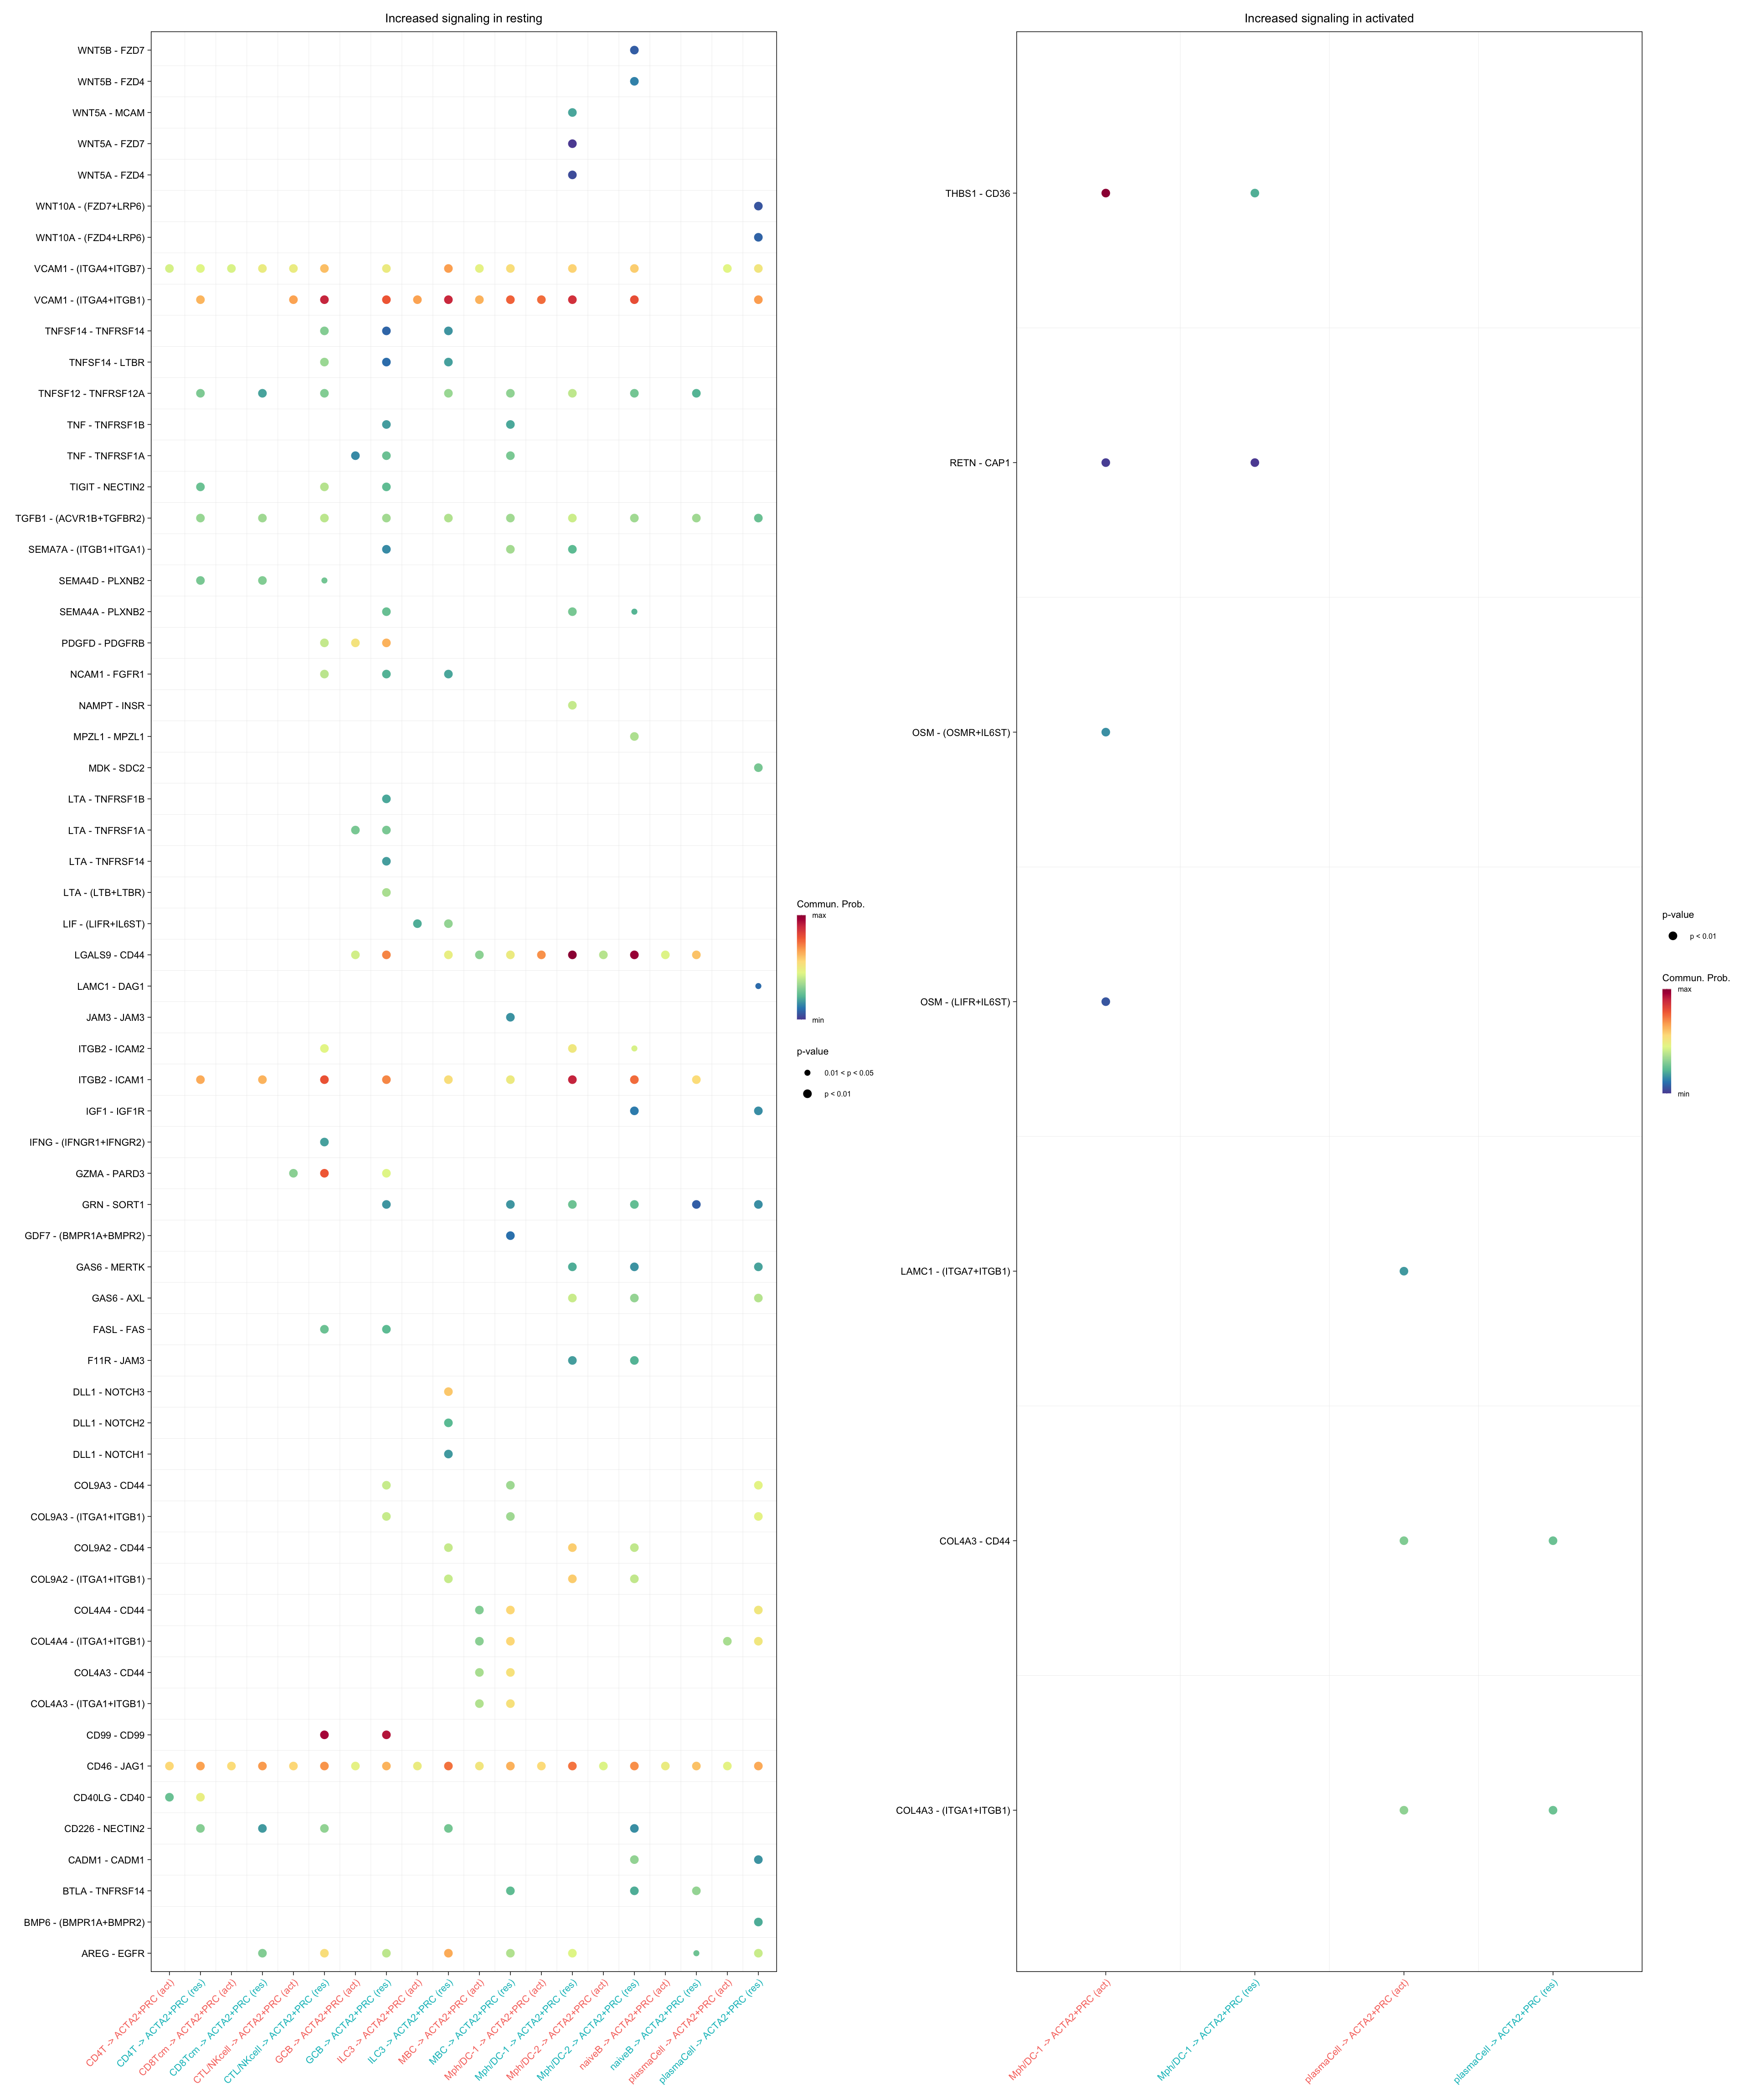
diff RL pairs based on DE genes
pos.dataset = "act"
features.name = pos.dataset
cellchat.merge <- identifyOverExpressedGenes(cellchat.merge,
                                             group.dataset = "datasets",
                                       pos.dataset = pos.dataset,
                                       features.name = features.name,
                                       only.pos = FALSE, thresh.pc = 0.05,
                                       thresh.fc = 0.05, thresh.p = 1)
net <- netMappingDEG(cellchat.merge, features.name = features.name)
net.up <- subsetCommunication(cellchat.merge, net = net, datasets = "act",
                              ligand.logFC = 0.05, receptor.logFC = 0.05)
net.down <- subsetCommunication(cellchat.merge, net = net, datasets = "res",
                                ligand.logFC = -0.05, receptor.logFC = -0.05)

gene.up <- extractGeneSubsetFromPair(net.up, cellchat.merge)
gene.down <- extractGeneSubsetFromPair(net.down, cellchat.merge)

pairLR.use.up = net.up[, "interaction_name", drop = F]
pairLR.use.down = net.down[, "interaction_name", drop = F]

##### ----------------- FRCs to immune cells ------------------- ######

gg1 <- netVisual_bubble(cellchat.merge, pairLR.use = pairLR.use.up,
                        sources.use = "PI16+RC",
                        targets.use = c("CD4T", "CTL/NKcell", "GCB",
                                        "ILC3", "naiveB", "MBC", "plasmaCell",
                                        "CD8Tcm", "Mph/DC-1", "Mph/DC-2"),
                        comparison = c(1, 2),  angle.x = 90, remove.isolate = T,
                        title.name = paste0("Up-regulated signaling in ",
                                            names(object.list)[1]))


gg2 <- netVisual_bubble(cellchat.merge, pairLR.use = pairLR.use.down,
                        sources.use = "PI16+RC",
                        targets.use = c("CD4T", "CTL/NKcell", "GCB",
                                        "ILC3", "naiveB", "MBC", "plasmaCell",
                                        "CD8Tcm", "Mph/DC-1", "Mph/DC-2"),
                        comparison = c(1, 2),  angle.x = 90, remove.isolate = T,
                        title.name = paste0("Down-regulated signaling in ",
                                            names(object.list)[1]))
gg1 + gg2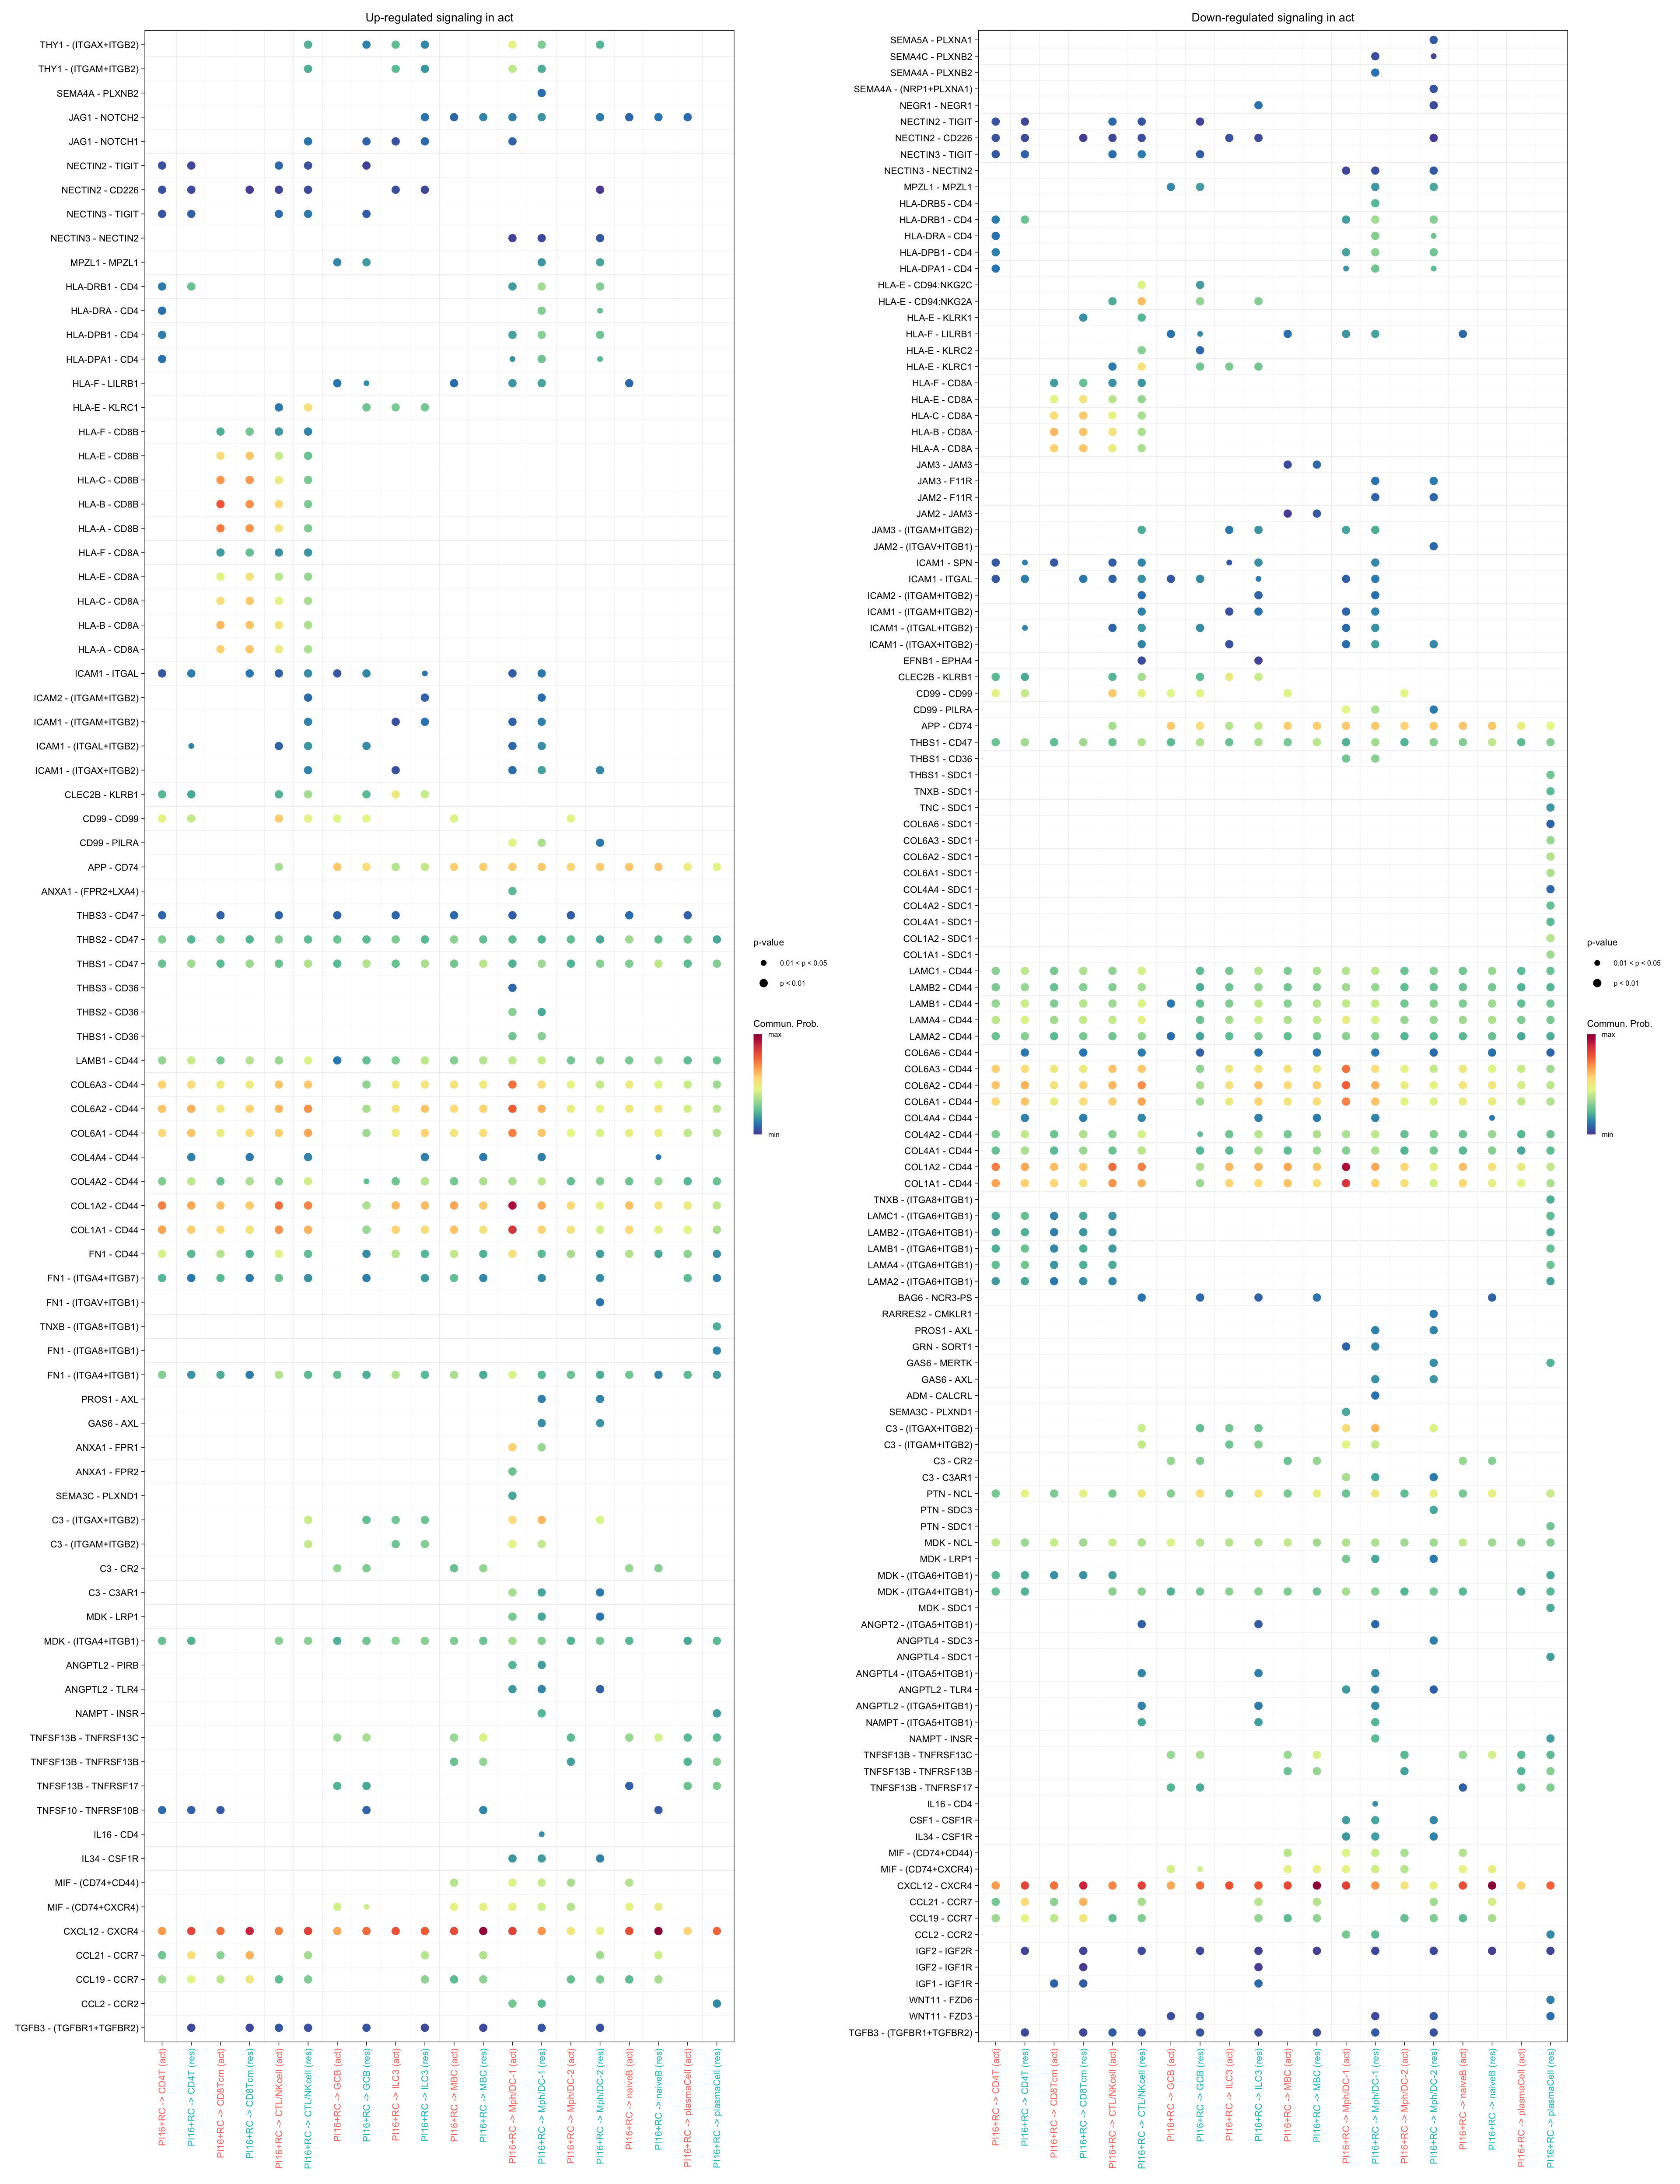
gg1 <- netVisual_bubble(cellchat.merge, pairLR.use = pairLR.use.up,
                        sources.use = "PRC1",
                        targets.use = c("CD4T", "CTL/NKcell", "GCB",
                                        "ILC3", "naiveB", "MBC", "plasmaCell",
                                        "CD8Tcm", "Mph/DC-1", "Mph/DC-2"),
                        comparison = c(1, 2),  angle.x = 90, remove.isolate = T,
                        title.name = paste0("Up-regulated signaling in ",
                                            names(object.list)[1]))


gg2 <- netVisual_bubble(cellchat.merge, pairLR.use = pairLR.use.down,
                        sources.use = "PRC1",
                        targets.use = c("CD4T", "CTL/NKcell", "GCB",
                                        "ILC3", "naiveB", "MBC", "plasmaCell",
                                        "CD8Tcm", "Mph/DC-1", "Mph/DC-2"),
                        comparison = c(1, 2),  angle.x = 90, remove.isolate = T,
                        title.name = paste0("Down-regulated signaling in ",
                                            names(object.list)[1]))
gg1 + gg2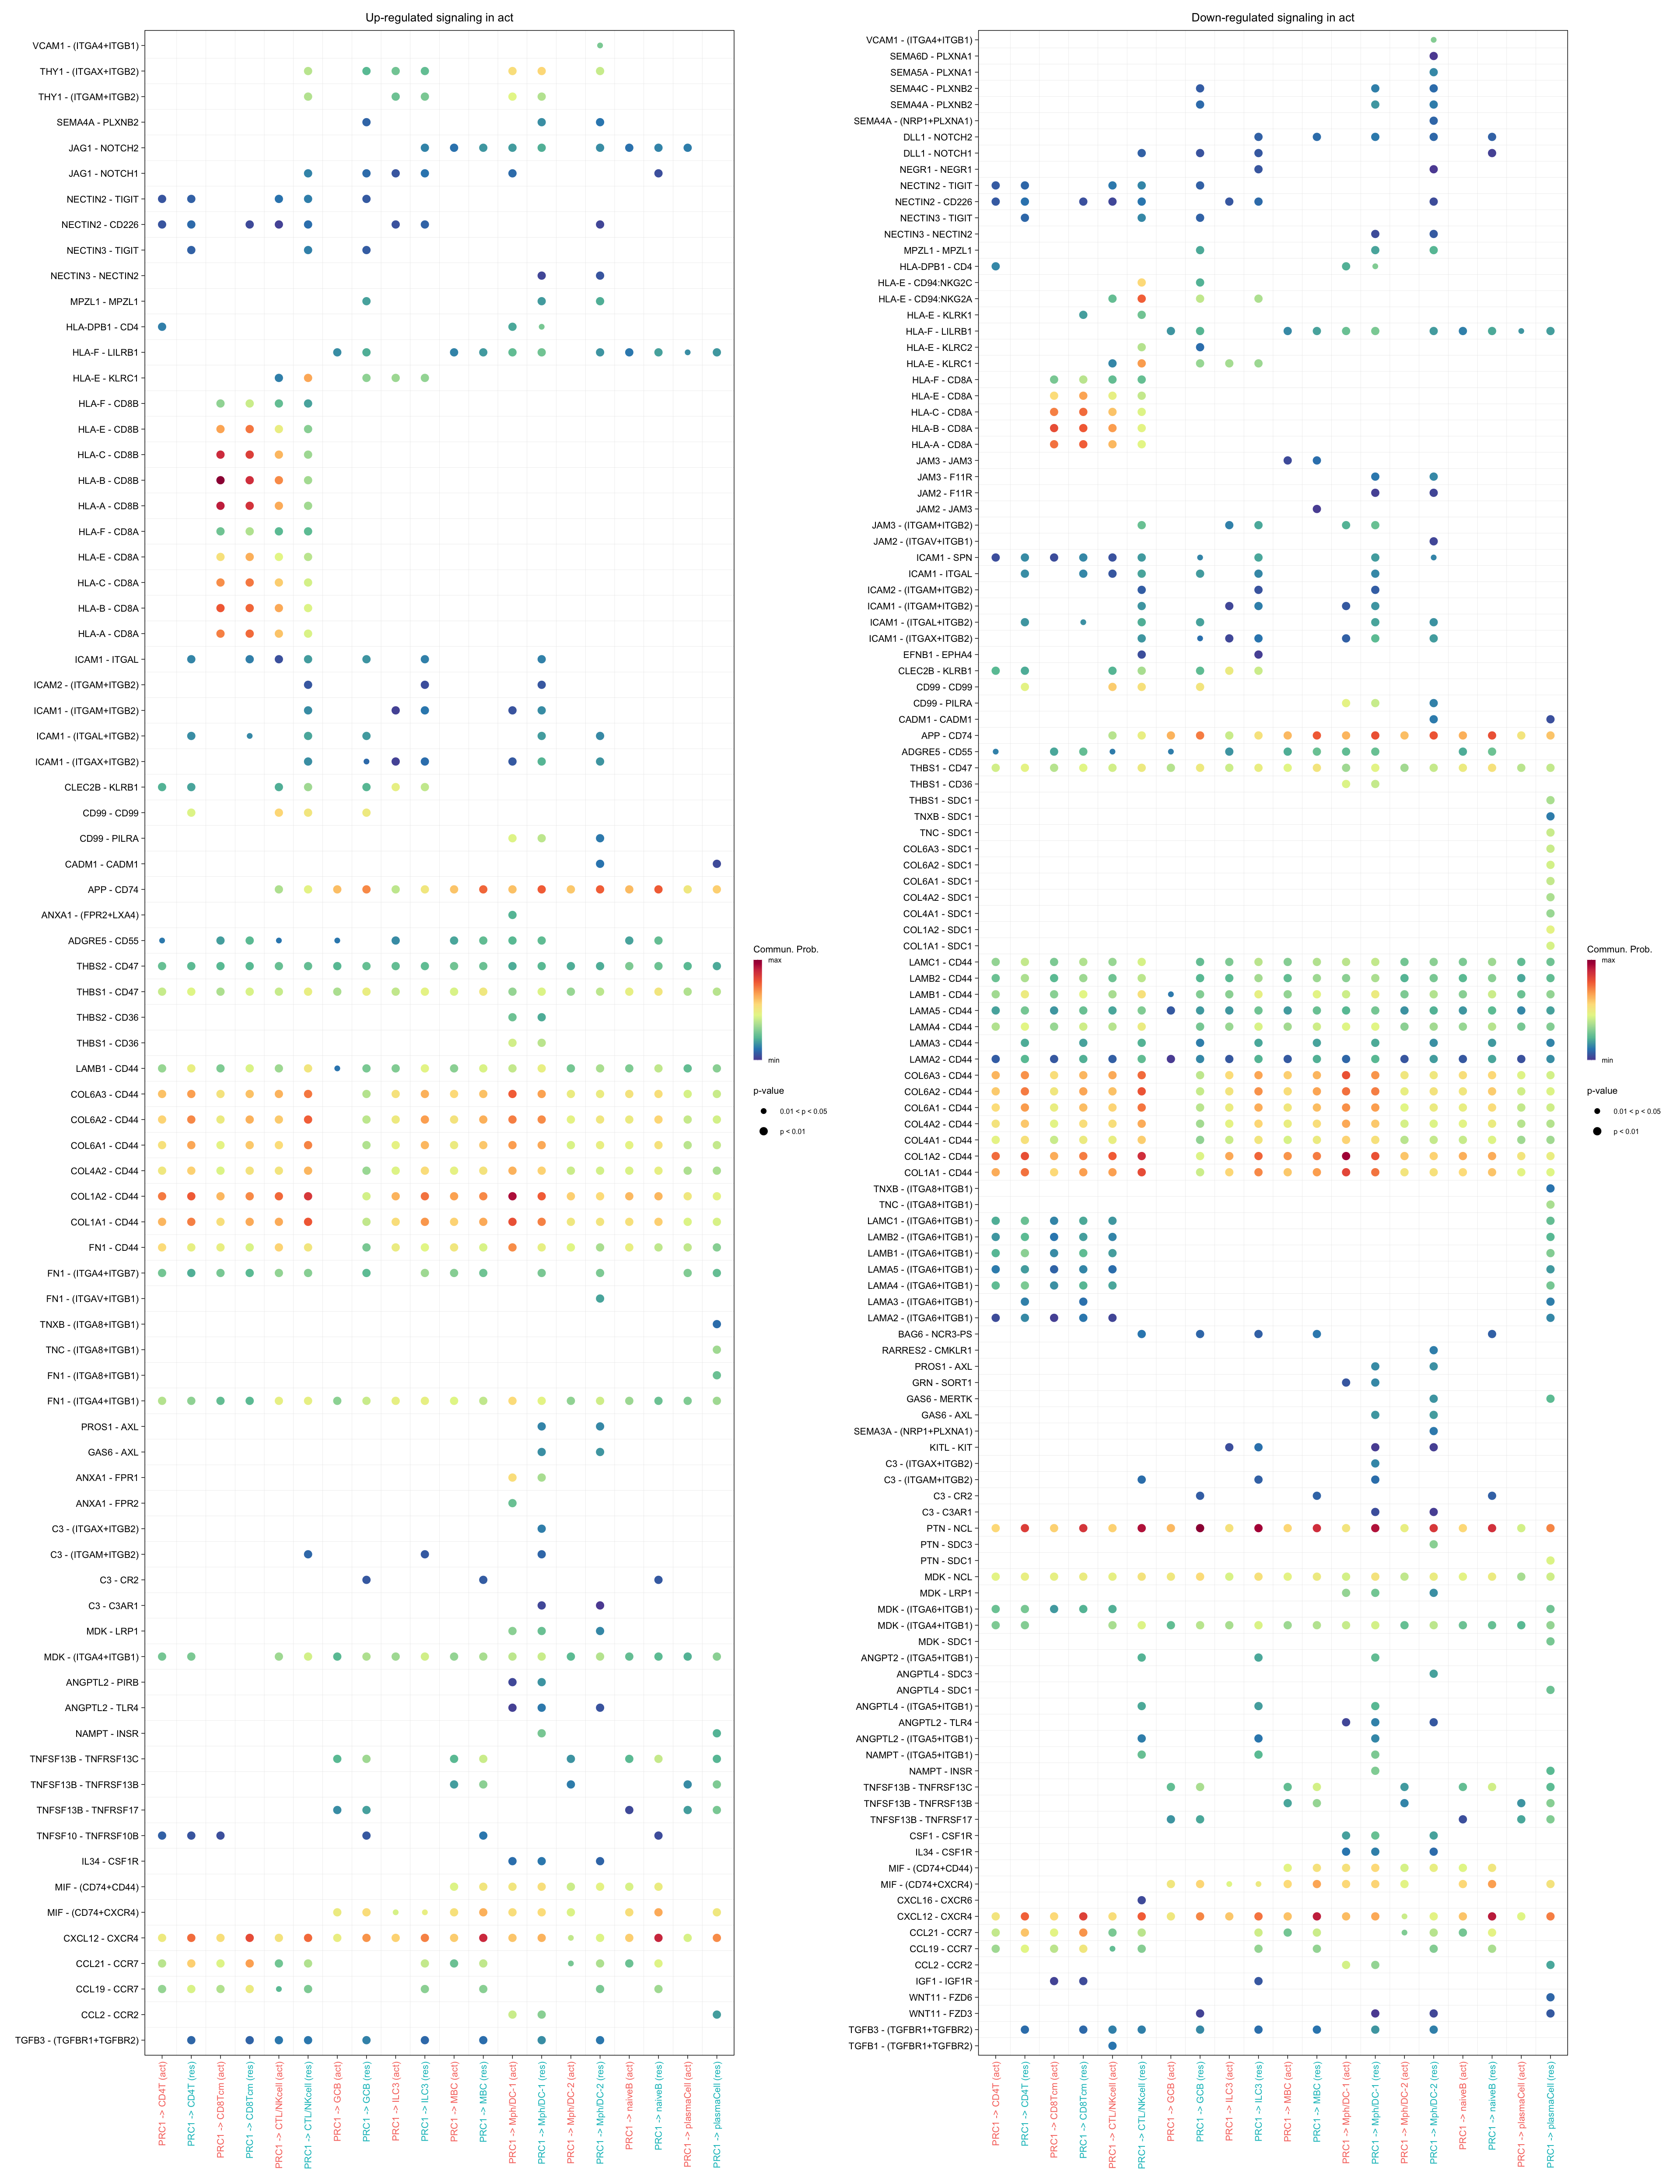
gg1 <- netVisual_bubble(cellchat.merge, pairLR.use = pairLR.use.up,
                        sources.use = "ACTA2+PRC",
                        targets.use = c("CD4T", "CTL/NKcell", "GCB",
                                        "ILC3", "naiveB", "MBC", "plasmaCell",
                                        "CD8Tcm", "Mph/DC-1", "Mph/DC-2"),
                        comparison = c(1, 2),  angle.x = 90, remove.isolate = T,
                        title.name = paste0("Up-regulated signaling in ",
                                            names(object.list)[1]))


gg2 <- netVisual_bubble(cellchat.merge, pairLR.use = pairLR.use.down,
                        sources.use = "ACTA2+PRC",
                        targets.use = c("CD4T", "CTL/NKcell", "GCB",
                                        "ILC3", "naiveB", "MBC", "plasmaCell",
                                        "CD8Tcm", "Mph/DC-1", "Mph/DC-2"),
                        comparison = c(1, 2),  angle.x = 90, remove.isolate = T,
                        title.name = paste0("Down-regulated signaling in ",
                                            names(object.list)[1]))
gg1 + gg2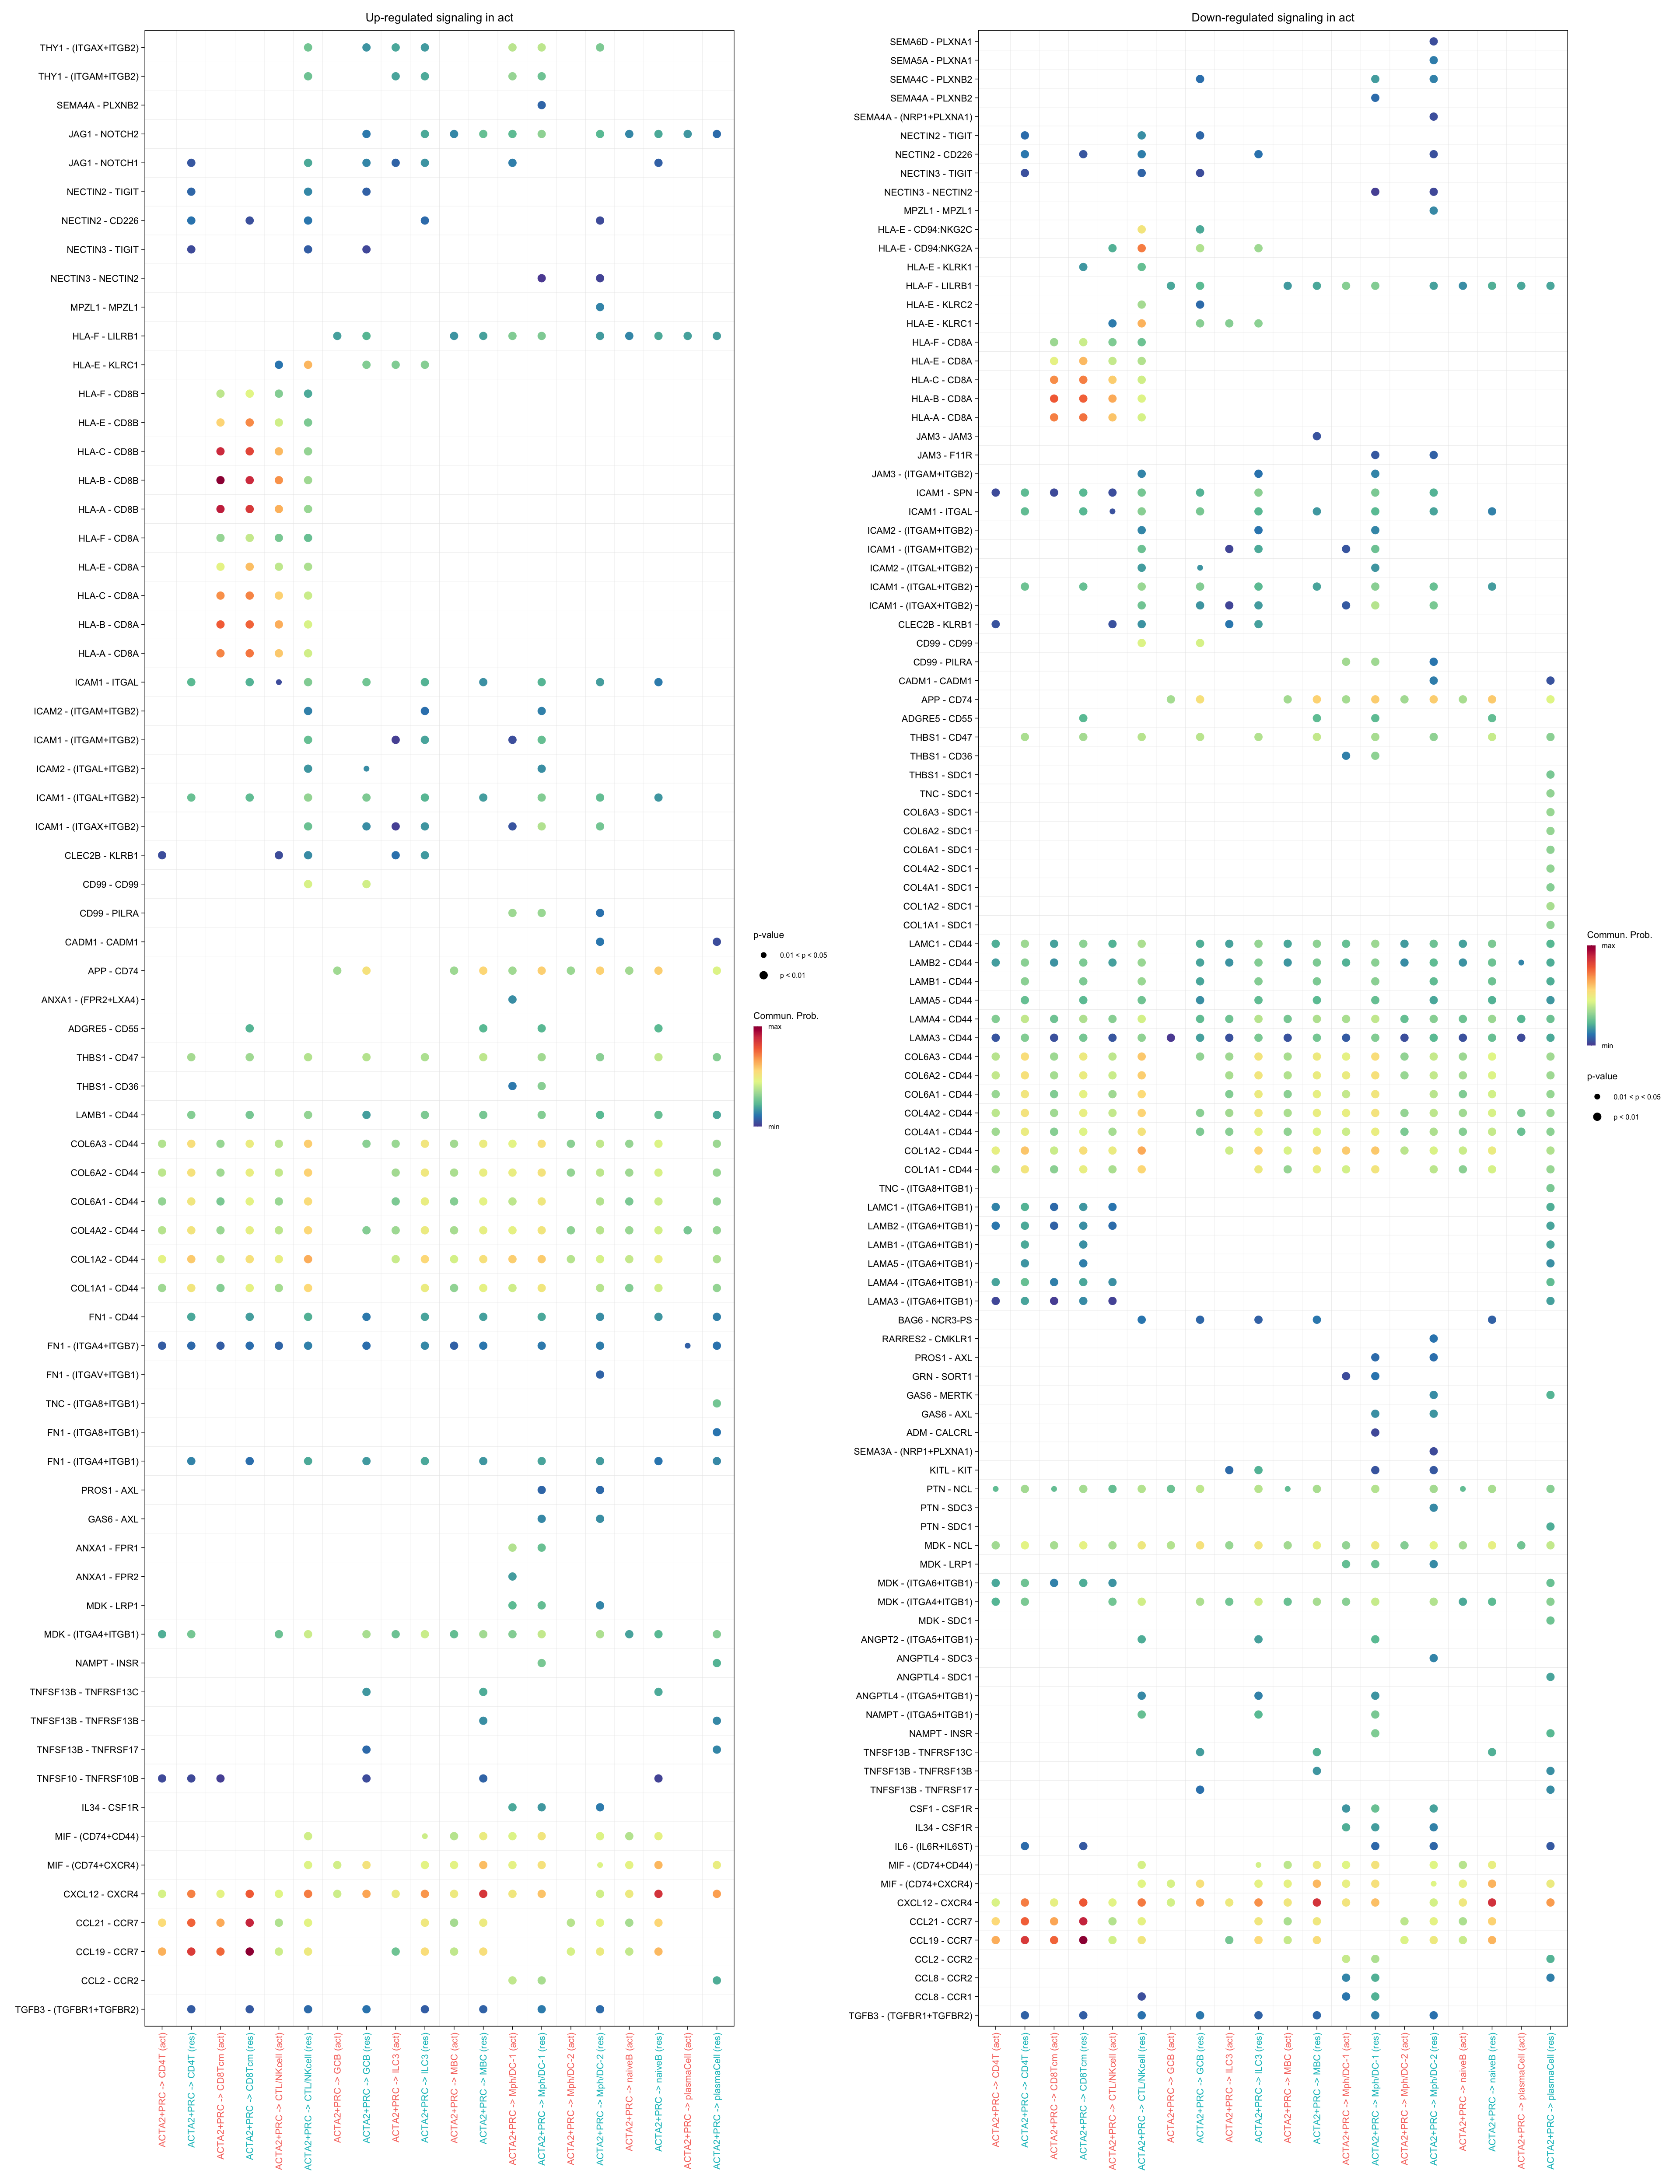
##### ----------------- Immune cells to FRCs ------------------- ######

gg1 <- netVisual_bubble(cellchat.merge, pairLR.use = pairLR.use.up,
                        sources.use = c("CD4T", "CTL/NKcell", "GCB",
                                        "ILC3", "naiveB", "MBC", "plasmaCell",
                                        "CD8Tcm","Mph/DC-1", "Mph/DC-2"),
                        targets.use = "PI16+RC",
                        comparison = c(1, 2),  angle.x = 90, remove.isolate = T,
                        title.name = paste0("Up-regulated signaling in ",
                                            names(object.list)[1]))


gg2 <- netVisual_bubble(cellchat.merge, pairLR.use = pairLR.use.down,
                        sources.use = c("CD4T", "CTL/NKcell", "GCB",
                                        "ILC3", "naiveB", "MBC", "plasmaCell",
                                        "CD8Tcm","Mph/DC-1", "Mph/DC-2"),
                        targets.use = "PI16+RC",
                        comparison = c(1, 2),  angle.x = 90, remove.isolate = T,
                        title.name = paste0("Down-regulated signaling in ",
                                            names(object.list)[1]))
gg1 + gg2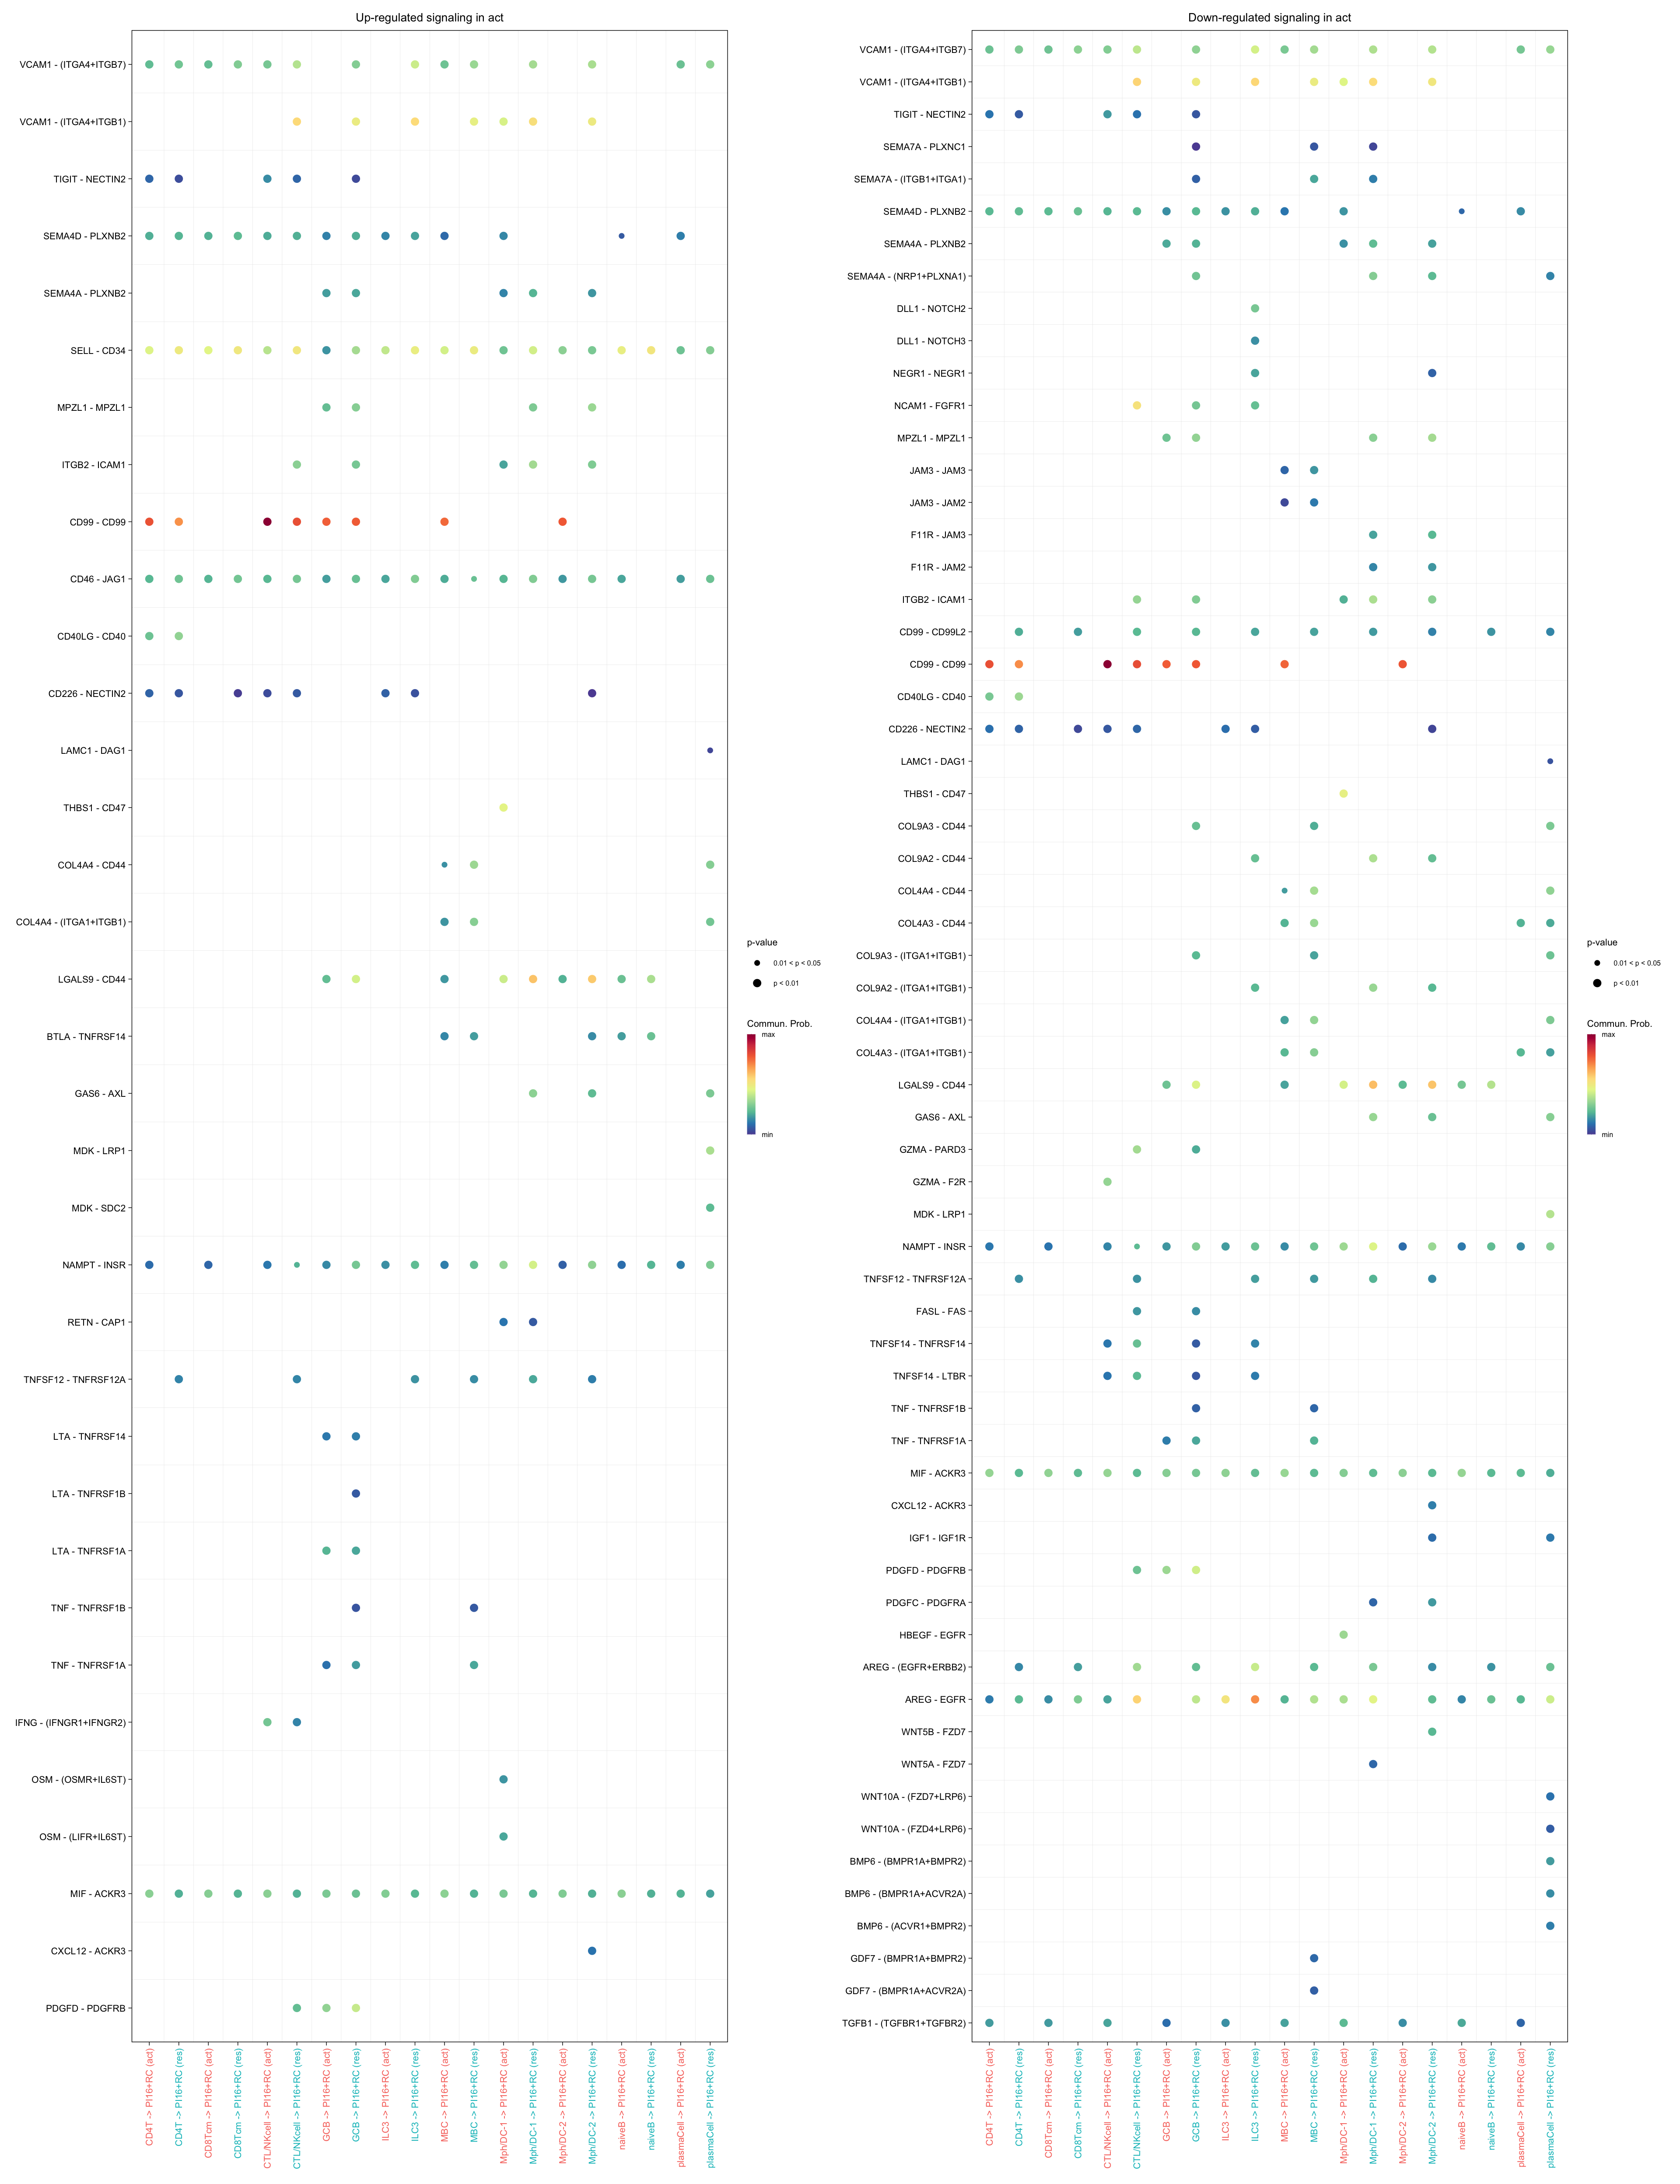
gg1 <- netVisual_bubble(cellchat.merge, pairLR.use = pairLR.use.up,
                        sources.use = c("CD4T", "CTL/NKcell", "GCB",
                                        "ILC3", "naiveB", "MBC", "plasmaCell",
                                        "CD8Tcm","Mph/DC-1", "Mph/DC-2"),
                        targets.use = "PRC1",
                        comparison = c(1, 2),  angle.x = 90, remove.isolate = T,
                        title.name = paste0("Up-regulated signaling in ",
                                            names(object.list)[1]))


gg2 <- netVisual_bubble(cellchat.merge, pairLR.use = pairLR.use.down,
                        sources.use = c("CD4T", "CTL/NKcell", "GCB",
                                        "ILC3", "naiveB", "MBC", "plasmaCell",
                                        "CD8Tcm","Mph/DC-1", "Mph/DC-2"),
                        targets.use = "PRC1",
                        comparison = c(1, 2),  angle.x = 90, remove.isolate = T,
                        title.name = paste0("Down-regulated signaling in ",
                                            names(object.list)[1]))
gg1 + gg2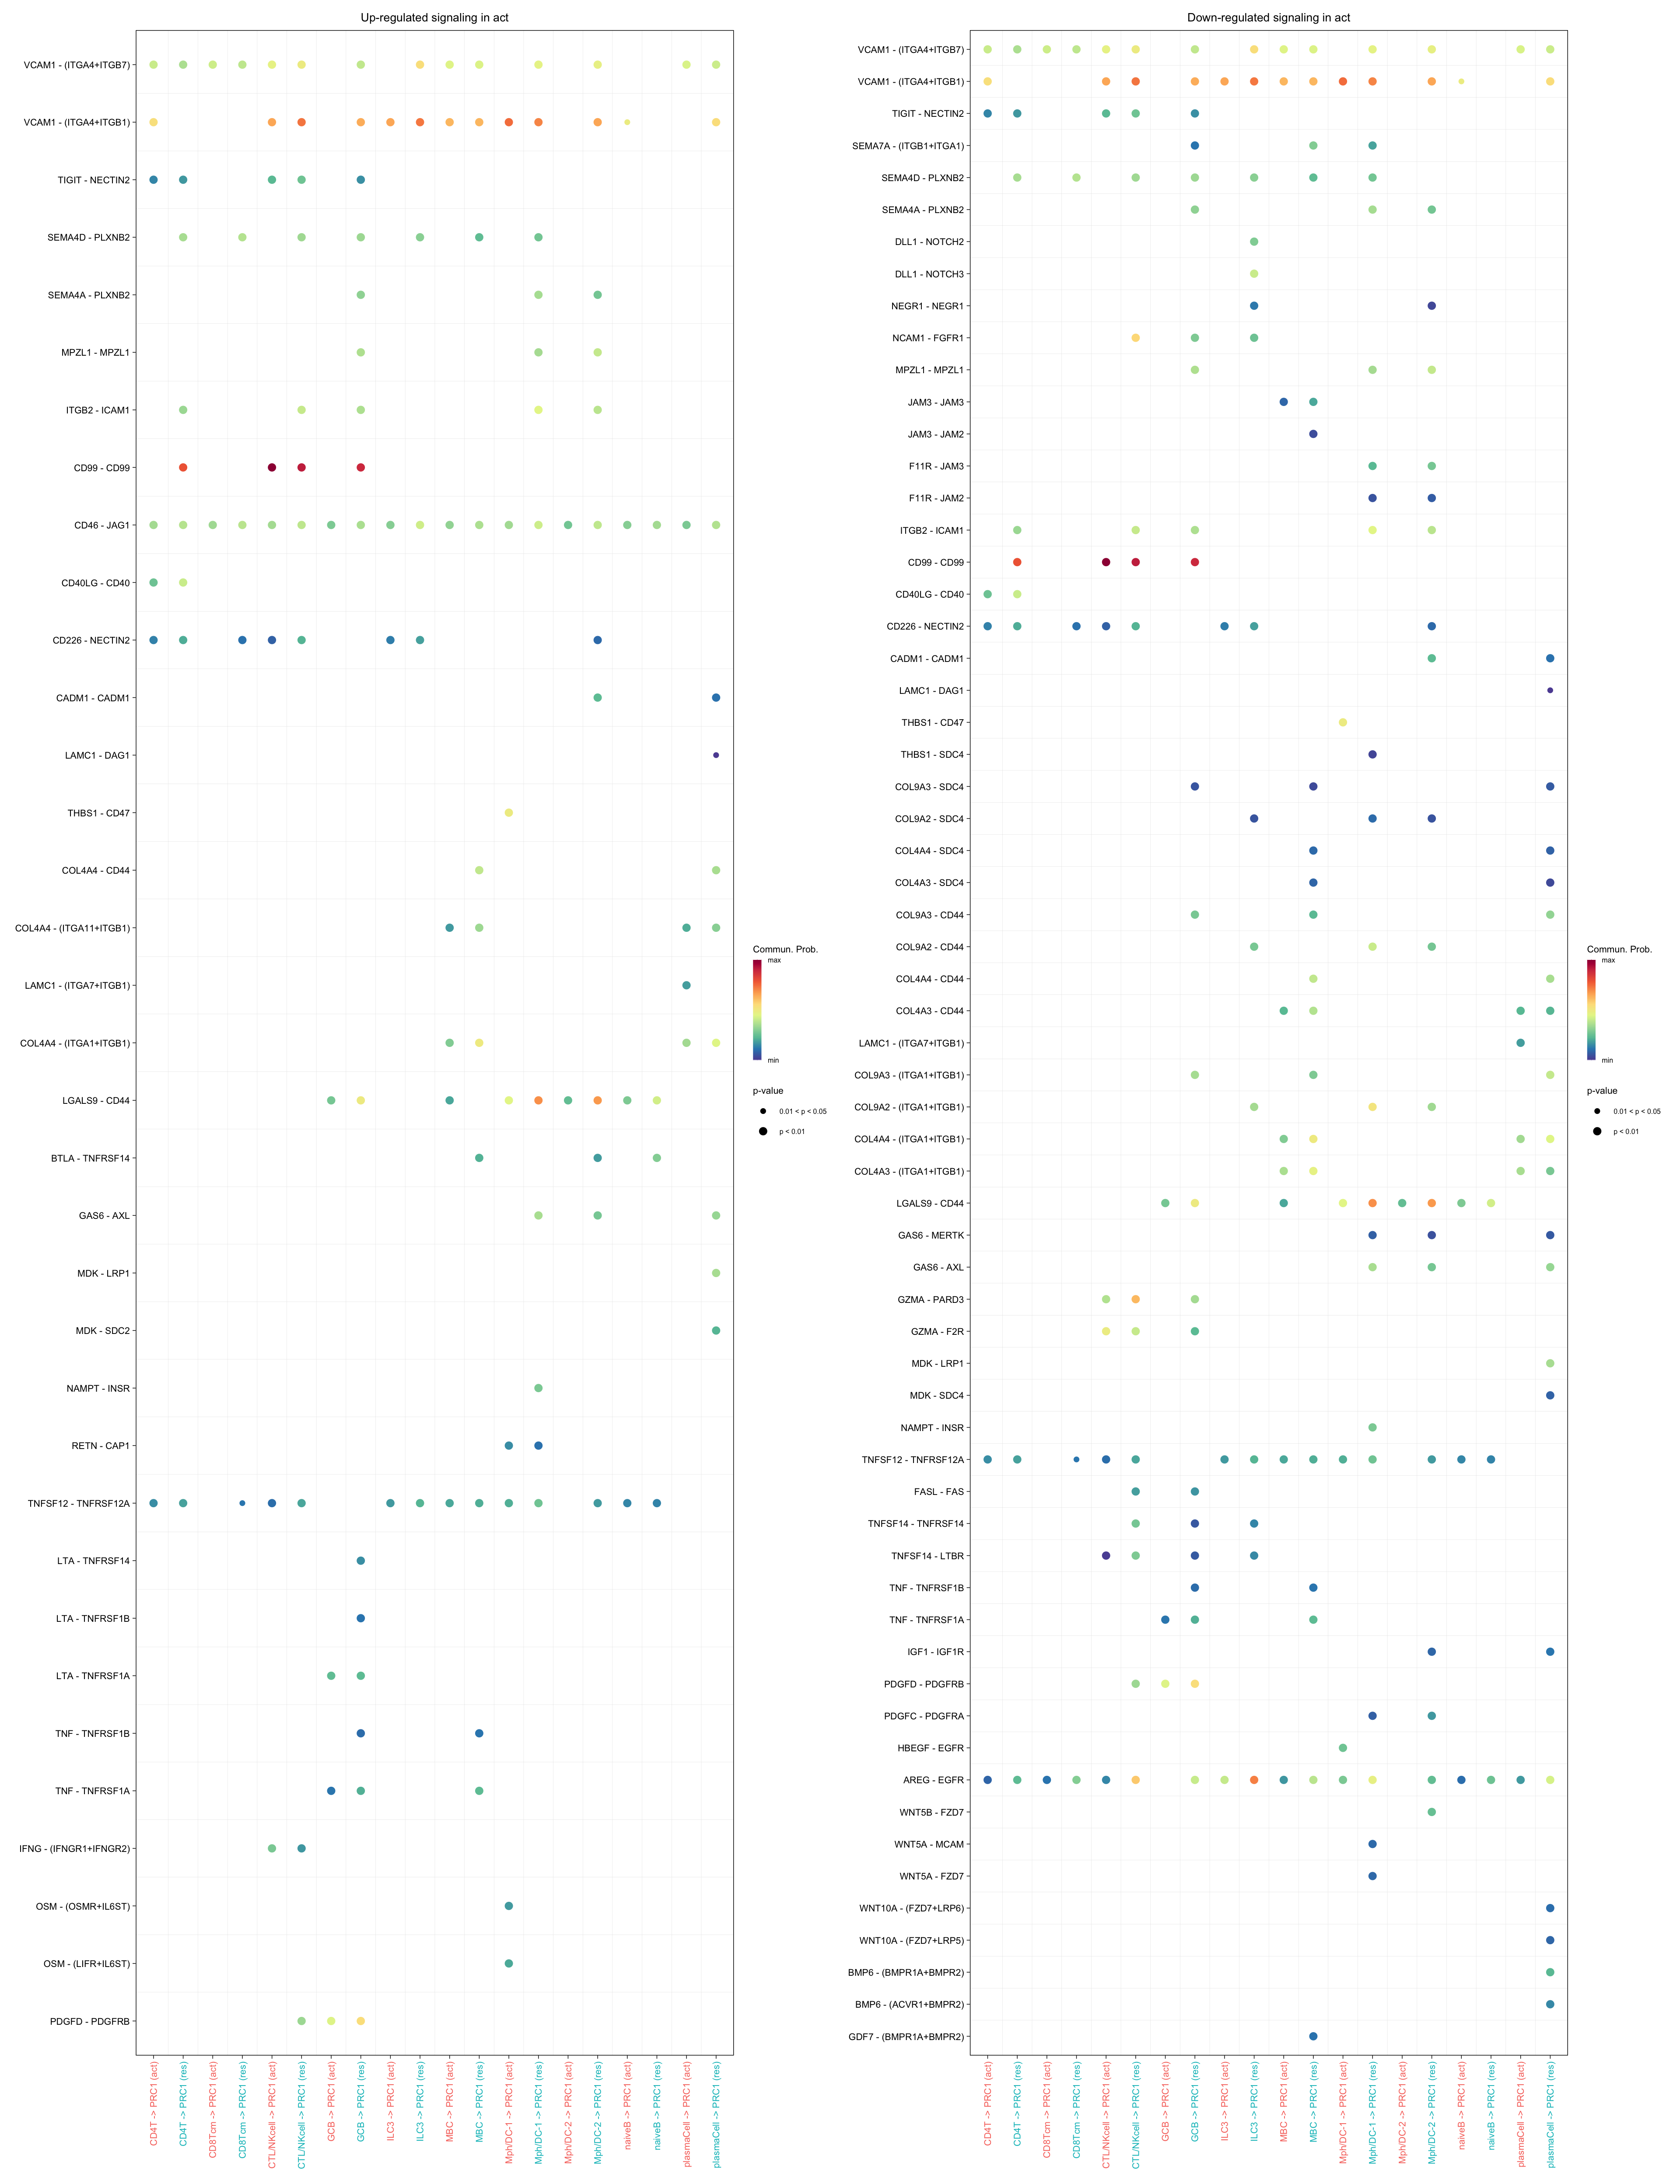
gg1 <- netVisual_bubble(cellchat.merge, pairLR.use = pairLR.use.up,
                        sources.use = c("CD4T", "CTL/NKcell", "GCB",
                                        "ILC3", "naiveB", "MBC", "plasmaCell",
                                        "CD8Tcm","Mph/DC-1", "Mph/DC-2"),
                        targets.use = "ACTA2+PRC",
                        comparison = c(1, 2),  angle.x = 90, remove.isolate = T,
                        title.name = paste0("Up-regulated signaling in ",
                                            names(object.list)[1]))


gg2 <- netVisual_bubble(cellchat.merge, pairLR.use = pairLR.use.down,
                        sources.use = c("CD4T", "CTL/NKcell", "GCB",
                                        "ILC3", "naiveB", "MBC", "plasmaCell",
                                        "CD8Tcm","Mph/DC-1", "Mph/DC-2"),
                        targets.use = "ACTA2+PRC",
                        comparison = c(1, 2),  angle.x = 90, remove.isolate = T,
                        title.name = paste0("Down-regulated signaling in ",
                                            names(object.list)[1]))
gg1 + gg2
save cellchat objects
saveRDS(cellchat.merge, file = paste0(basedir, "/data/cellchat/FRCplusImmune_",
                                      "resPlusActMerge_cellchat.rds"))

saveRDS(cellchat.res, file = paste0(basedir, "/data/cellchat/FRCplusImmune_",
                                      "resOnly_cellchat.rds"))

saveRDS(cellchat.act, file = paste0(basedir, "/data/cellchat/FRCplusImmune_",
                                      "actOnly_cellchat.rds"))
session info
sessionInfo()R version 4.3.0 (2023-04-21)
Platform: x86_64-apple-darwin20 (64-bit)
Running under: macOS Ventura 13.4.1
Matrix products: default
BLAS: /Library/Frameworks/R.framework/Versions/4.3-x86_64/Resources/lib/libRblas.0.dylib
LAPACK: /Library/Frameworks/R.framework/Versions/4.3-x86_64/Resources/lib/libRlapack.dylib; LAPACK version 3.11.0
locale:
[1] en_US.UTF-8/en_US.UTF-8/en_US.UTF-8/C/en_US.UTF-8/en_US.UTF-8
time zone: Europe/Berlin
tzcode source: internal
attached base packages:
[1] grid stats4 stats graphics grDevices utils datasets methods base
other attached packages:
[1] ComplexHeatmap_2.16.0 patchwork_1.2.0 CellChat_1.6.1
[4] igraph_2.0.2 scran_1.28.2 scater_1.28.0
[7] scuttle_1.10.3 SingleCellExperiment_1.22.0 SummarizedExperiment_1.30.2
[10] Biobase_2.60.0 GenomicRanges_1.52.1 GenomeInfoDb_1.36.4
[13] IRanges_2.36.0 S4Vectors_0.40.1 BiocGenerics_0.48.0
[16] MatrixGenerics_1.12.3 matrixStats_1.2.0 pheatmap_1.0.12
[19] ggsci_3.0.1 here_1.0.1 runSeurat3_0.1.0
[22] ggpubr_0.6.0 lubridate_1.9.3 forcats_1.0.0
[25] stringr_1.5.1 readr_2.1.5 tidyr_1.3.1
[28] tibble_3.2.1 tidyverse_2.0.0 Seurat_5.0.2
[31] SeuratObject_5.0.1 sp_2.1-3 purrr_1.0.2
[34] ggplot2_3.5.0 reshape2_1.4.4 dplyr_1.1.4
loaded via a namespace (and not attached):
[1] spatstat.sparse_3.0-3 bitops_1.0-7 httr_1.4.7
[4] RColorBrewer_1.1-3 doParallel_1.0.17 tools_4.3.0
[7] sctransform_0.4.1 backports_1.4.1 utf8_1.2.4
[10] R6_2.5.1 lazyeval_0.2.2 uwot_0.1.16
[13] GetoptLong_1.0.5 withr_3.0.0 gridExtra_2.3
[16] progressr_0.14.0 textshaping_0.3.7 cli_3.6.2
[19] Cairo_1.6-2 spatstat.explore_3.2-6 fastDummies_1.7.3
[22] network_1.18.2 labeling_0.4.3 spatstat.data_3.0-4
[25] ggridges_0.5.6 pbapply_1.7-2 systemfonts_1.0.5
[28] svglite_2.1.3 parallelly_1.37.1 limma_3.56.2
[31] rstudioapi_0.15.0 FNN_1.1.4 generics_0.1.3
[34] shape_1.4.6.1 ica_1.0-3 spatstat.random_3.2-3
[37] car_3.1-2 Matrix_1.6-5 ggbeeswarm_0.7.2
[40] fansi_1.0.6 abind_1.4-5 lifecycle_1.0.4
[43] yaml_2.3.8 edgeR_3.42.4 carData_3.0-5
[46] Rtsne_0.17 promises_1.2.1 dqrng_0.3.2
[49] crayon_1.5.2 miniUI_0.1.1.1 lattice_0.22-5
[52] beachmat_2.16.0 cowplot_1.1.3 magick_2.8.3
[55] sna_2.7-2 pillar_1.9.0 knitr_1.45
[58] metapod_1.8.0 rjson_0.2.21 future.apply_1.11.1
[61] codetools_0.2-19 leiden_0.4.3.1 glue_1.7.0
[64] data.table_1.15.2 vctrs_0.6.5 png_0.1-8
[67] spam_2.10-0 gtable_0.3.4 xfun_0.42
[70] S4Arrays_1.0.6 mime_0.12 coda_0.19-4.1
[73] survival_3.5-8 iterators_1.0.14 statmod_1.5.0
[76] bluster_1.10.0 ellipsis_0.3.2 fitdistrplus_1.1-11
[79] ROCR_1.0-11 nlme_3.1-164 RcppAnnoy_0.0.22
[82] rprojroot_2.0.4 irlba_2.3.5.1 vipor_0.4.7
[85] KernSmooth_2.23-22 colorspace_2.1-0 tidyselect_1.2.0
[88] compiler_4.3.0 BiocNeighbors_1.18.0 DelayedArray_0.26.7
[91] plotly_4.10.4 scales_1.3.0 lmtest_0.9-40
[94] NMF_0.27 digest_0.6.34 goftest_1.2-3
[97] spatstat.utils_3.0-4 rmarkdown_2.26 XVector_0.40.0
[100] htmltools_0.5.7 pkgconfig_2.0.3 sparseMatrixStats_1.12.2
[103] fastmap_1.1.1 rlang_1.1.3 GlobalOptions_0.1.2
[106] htmlwidgets_1.6.4 shiny_1.8.0 DelayedMatrixStats_1.22.6
[109] farver_2.1.1 zoo_1.8-12 jsonlite_1.8.8
[112] statnet.common_4.9.0 BiocParallel_1.34.2 BiocSingular_1.16.0
[115] RCurl_1.98-1.14 magrittr_2.0.3 ggnetwork_0.5.13
[118] GenomeInfoDbData_1.2.10 dotCall64_1.1-1 munsell_0.5.0
[121] Rcpp_1.0.12 viridis_0.6.5 reticulate_1.35.0
[124] stringi_1.8.3 ggalluvial_0.12.5 zlibbioc_1.46.0
[127] MASS_7.3-60.0.1 plyr_1.8.9 parallel_4.3.0
[130] listenv_0.9.1 ggrepel_0.9.5 deldir_2.0-4
[133] splines_4.3.0 tensor_1.5 hms_1.1.3
[136] circlize_0.4.16 locfit_1.5-9.9 spatstat.geom_3.2-9
[139] ggsignif_0.6.4 RcppHNSW_0.6.0 rngtools_1.5.2
[142] ScaledMatrix_1.8.1 evaluate_0.23 tzdb_0.4.0
[145] foreach_1.5.2 httpuv_1.6.14 RANN_2.6.1
[148] polyclip_1.10-6 future_1.33.1 clue_0.3-65
[151] scattermore_1.2 gridBase_0.4-7 rsvd_1.0.5
[154] broom_1.0.5 xtable_1.8-4 RSpectra_0.16-1
[157] rstatix_0.7.2 later_1.3.2 ragg_1.2.7
[160] viridisLite_0.4.2 beeswarm_0.4.0 registry_0.5-1
[163] cluster_2.1.6 timechange_0.3.0 globals_0.16.2 date()[1] "Wed Mar 13 23:29:37 2024"