visualize activated immune cells human LN
Load packages
## load packages
suppressPackageStartupMessages({
  library(dplyr)
  library(reshape2)
  library(ggplot2)
  library(cowplot)
  library(purrr)
  library(Seurat)
  library(tidyverse)
  library(ggpubr)
  library(runSeurat3)
  library(here)
  library(ggsci)
  library(pheatmap)
  library(scater)
})
load seurat object
basedir <- here()
seurat <- readRDS(file= paste0(basedir,
                            "/data/AllPatWithoutCM_IMMMerged_integrated_label",
                            "_seurat.rds"))

Idents(seurat) <- seurat$label
seurat <- subset(seurat, cond2 == "activated")

## set col palettes
colPal <- colPal <- c(pal_flatui()(10), pal_frontiers()(8),
                      pal_nejm()(8))[1:length(unique(seurat$RNA_snn_res.0.25))]
names(colPal) <- unique(seurat$RNA_snn_res.0.25)


colPat <- c(pal_nejm()(7),pal_futurama()(12))[1:length(unique(seurat$patient))]
names(colPat) <- unique(seurat$patient)
colCond <- c("#6692a3","#971c1c","#d17d67")
names(colCond) <- unique(seurat$cond)
colOri <- pal_npg()(length(unique(seurat$origin)))
names(colOri) <- unique(seurat$origin)
colCond2 <- c("#6692a3","#971c1c")
names(colCond2) <- c("resting", "activated")

colLab <- c("#2a3b30", "#0b6647", "#54907e", "#94c78a", "#6f9568",
            "#8f2810", "#a83e0b", "#ce6915","#d08821", "#d0ac21","#b9bb20",
            "#486584","#56799e", "#4b5397", "#8873d3", "#6e3e7a")

names(colLab) <- c("preB", "naiveB", "GCB", "MBC", "plasmaCell",
                   "naiveCD4-1", "naiveCD4-2", "naiveCD4-3", "Treg", "CD8Tcm",
                    "CTL/NKcell",
                   "ILC3","pDC-1", "pDC-2", "Mph/DC-1", "Mph/DC-2")
visualize data
DimPlot(seurat, reduction = "umap", cols=colLab)+
  theme_bw() +
  theme(axis.text = element_blank(), axis.ticks = element_blank(),
        panel.grid.minor = element_blank()) +
  xlab("UMAP1") +
  ylab("UMAP2")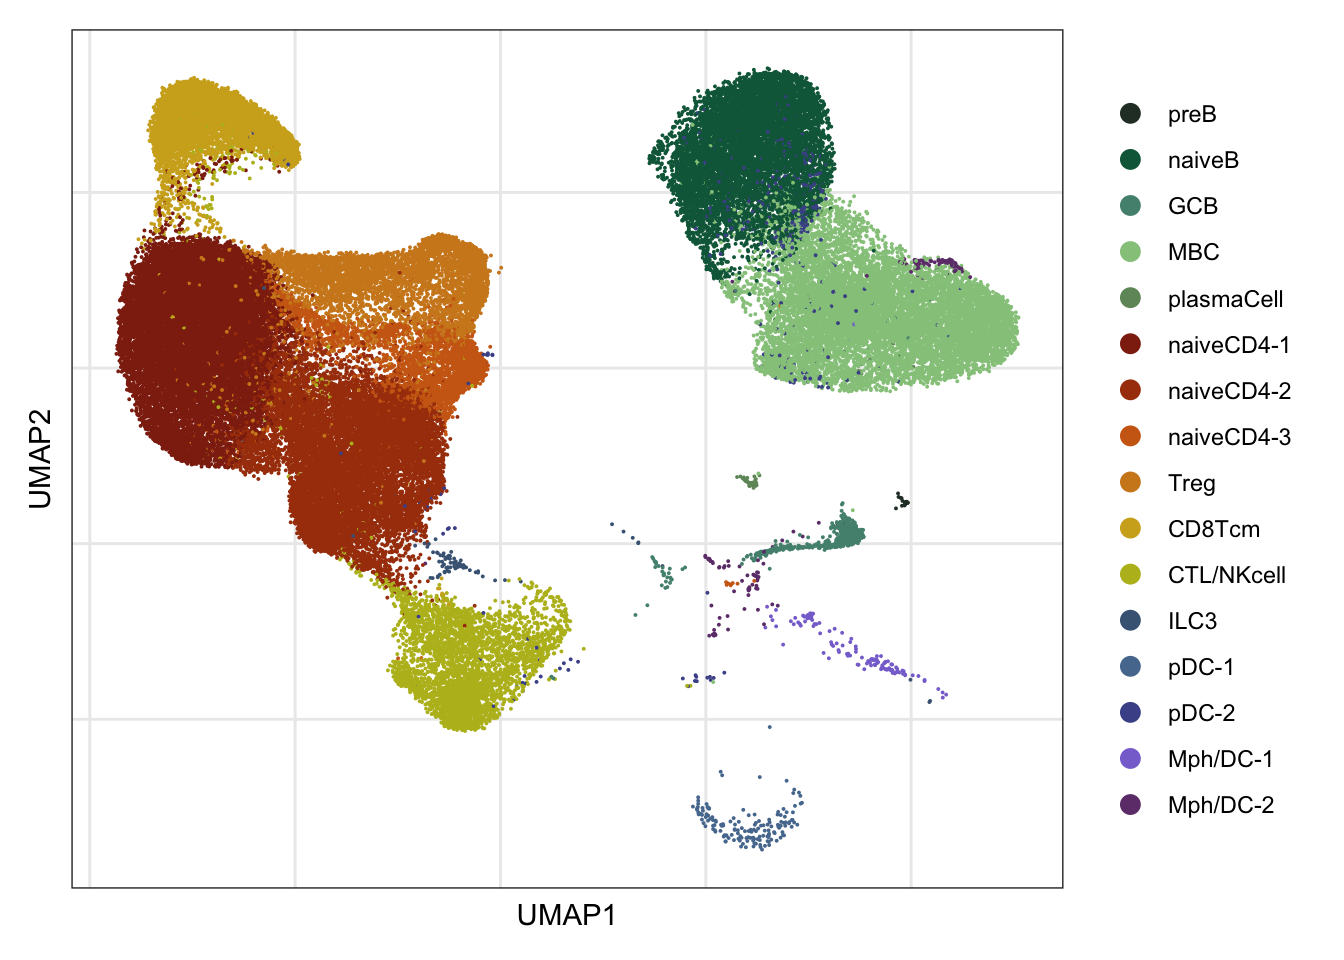
DimPlot(seurat, reduction = "umap", cols=colLab, pt.size=1)+
  theme_void()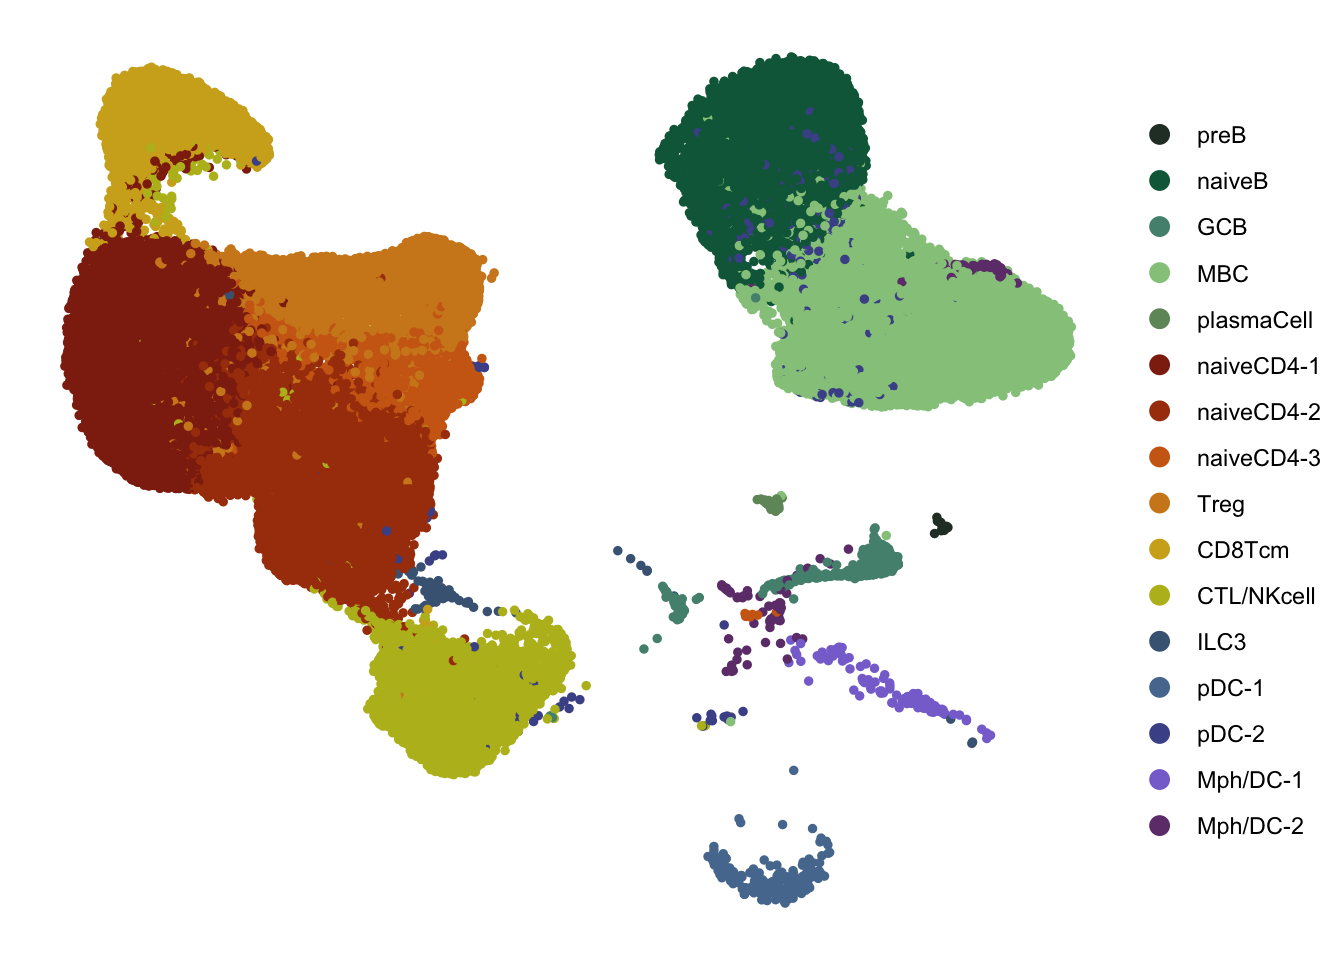
clustering
## visualize input data
DimPlot(seurat, reduction = "umap", cols=colPal, group.by = "RNA_snn_res.0.25")+
  theme_bw() +
  theme(axis.text = element_blank(), axis.ticks = element_blank(),
        panel.grid.minor = element_blank()) +
  xlab("UMAP1") +
  ylab("UMAP2")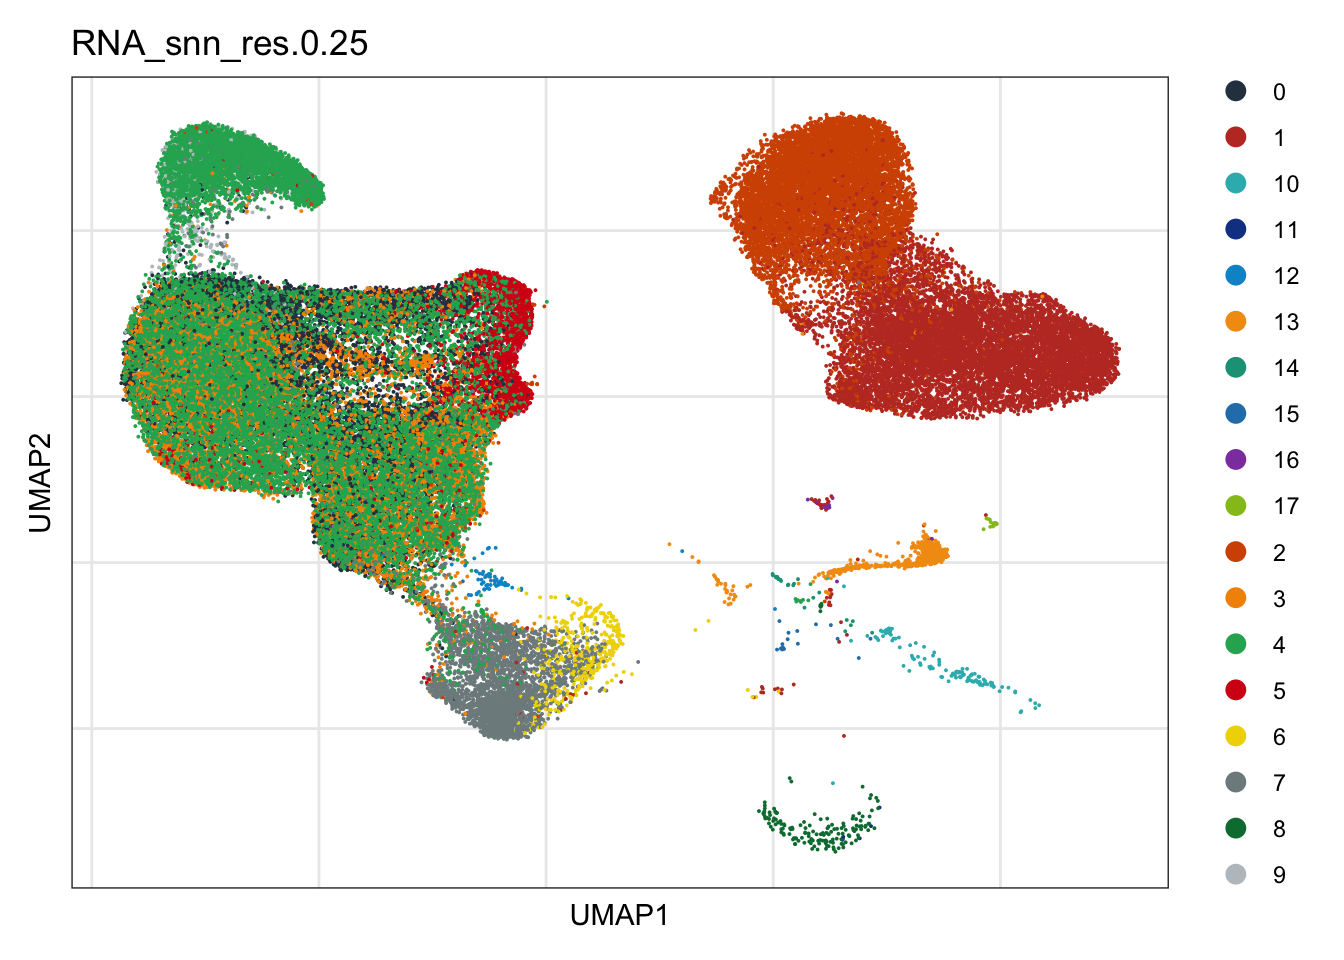
DimPlot(seurat, reduction = "umap", group.by = "RNA_snn_res.0.25",
        cols=colPal, pt.size=0.5)+
  theme_void()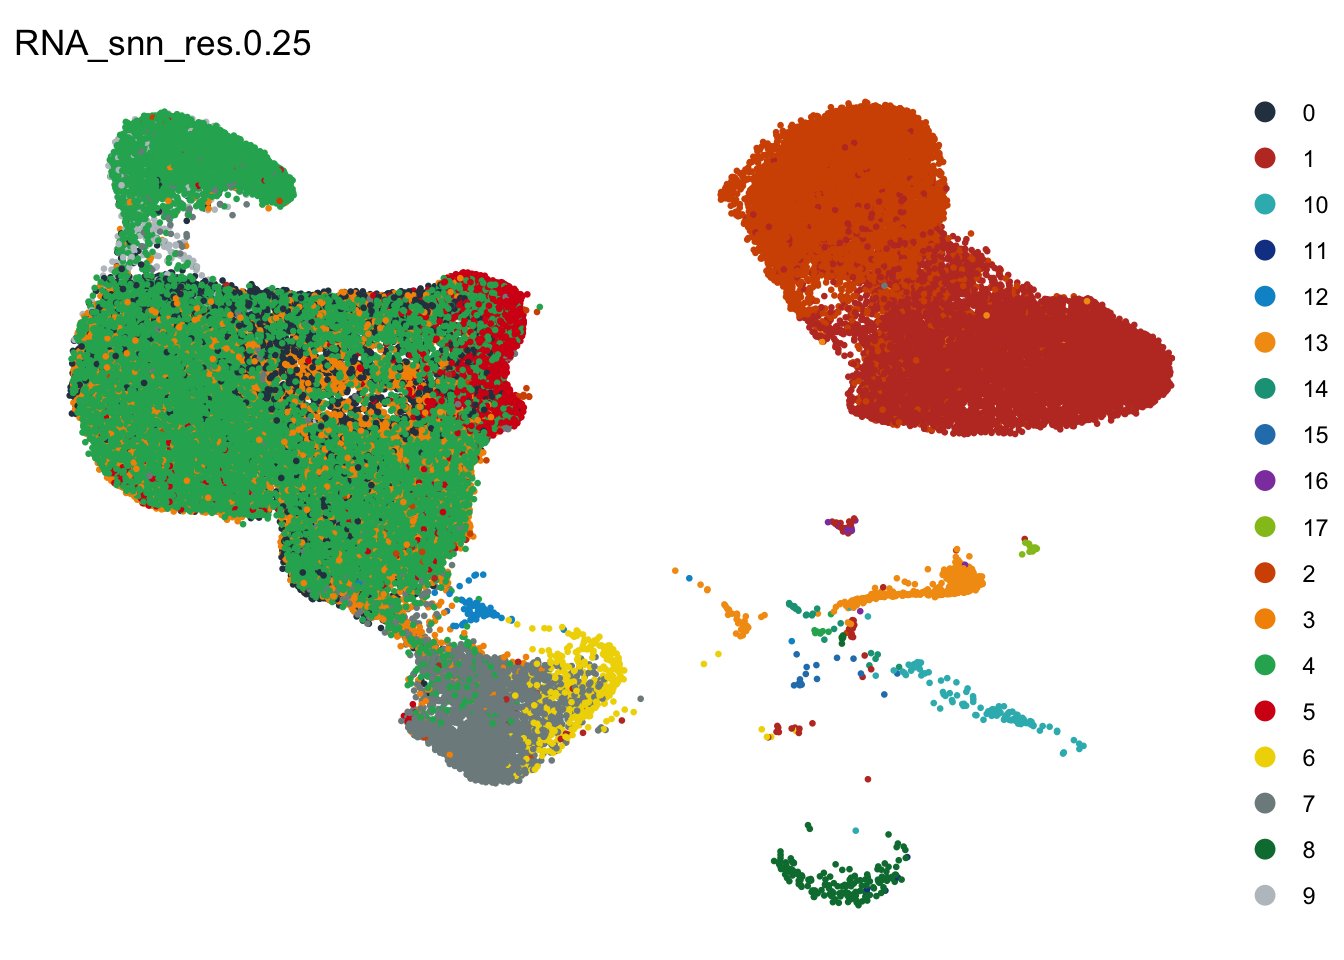
patient
## visualize input data
DimPlot(seurat, reduction = "umap", cols=colPat, group.by = "patient")+
  theme_bw() +
  theme(axis.text = element_blank(), axis.ticks = element_blank(),
        panel.grid.minor = element_blank()) +
  xlab("UMAP1") +
  ylab("UMAP2")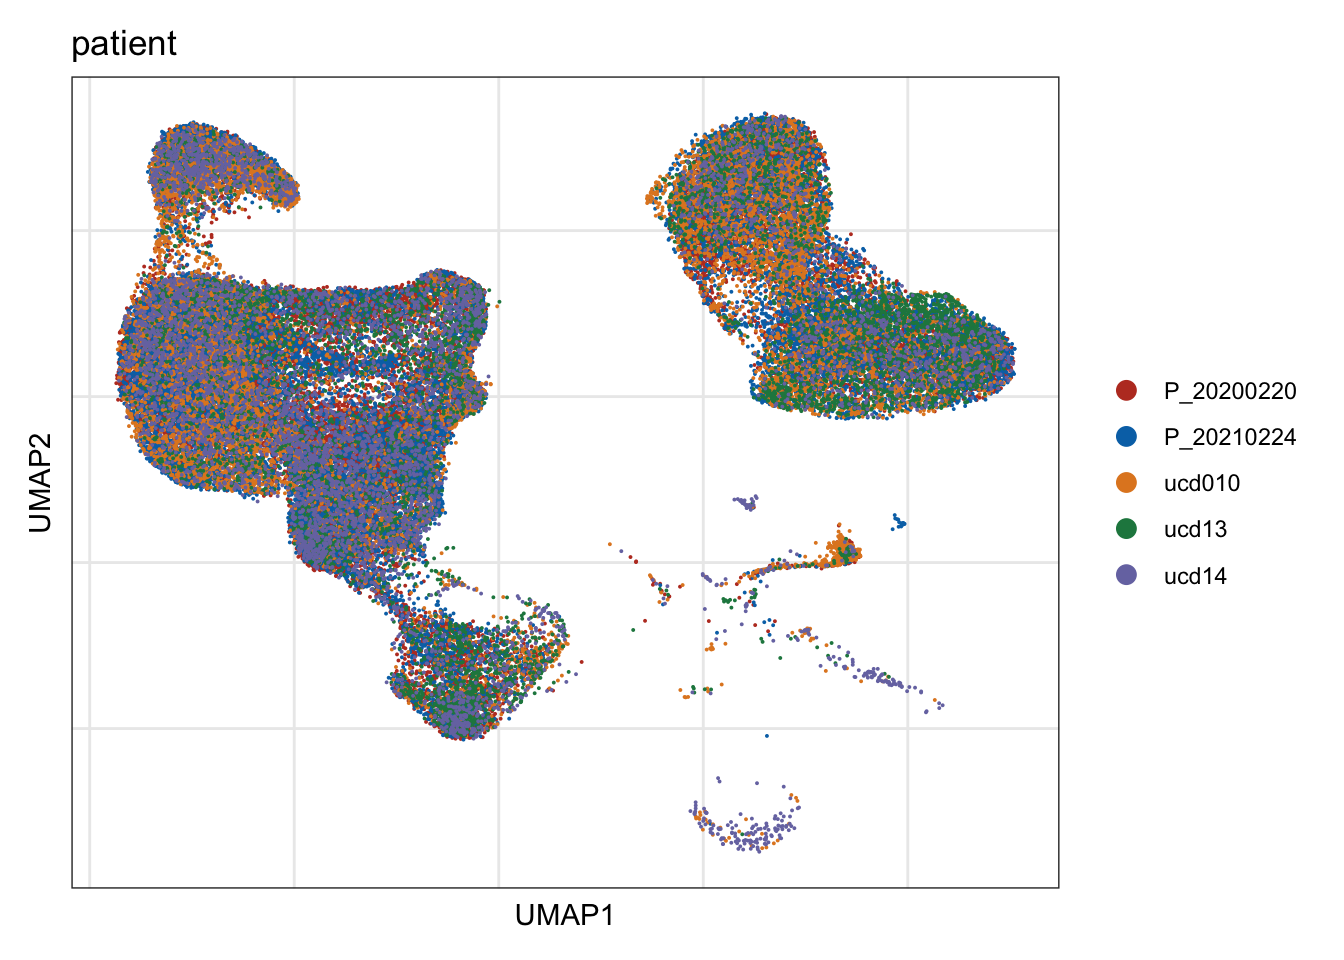
DimPlot(seurat, reduction = "umap", cols=colPat, group.by = "patient",
        pt.size=0.5, shuffle = T)+
  theme_void()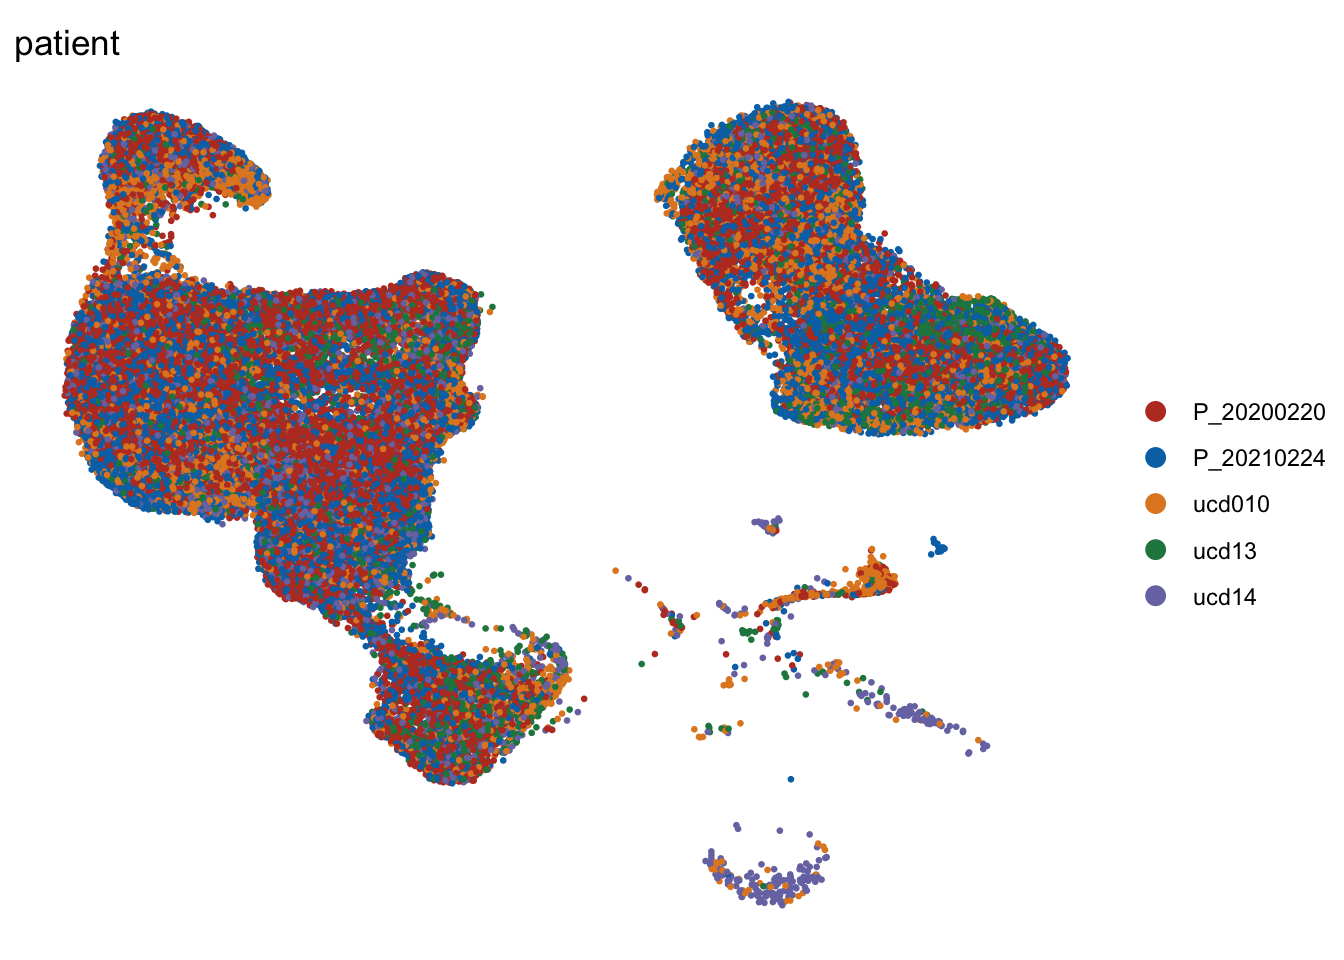
vis selected immune cell marker
genes <- data.frame(gene=rownames(seurat)) %>%
    mutate(geneID=gsub("^.*\\.", "", gene))

selGenesAll <- read_tsv(file = paste0(basedir,
                                      "/data/overallImmuneCellMarker.txt")) %>%
  left_join(., genes, by = "geneID")

seurat$label <- factor(seurat$label, levels = names(colLab))
Idents(seurat) <- seurat$label

# pOut <- avgHeatmap(seurat = seurat, selGenes = selGenesAll,
#                   colVecIdent = colLab,
#                   ordVec=levels(seurat),
#                   gapVecR=NULL, gapVecC=NULL,cc=F,
#                   cr=F, condCol=F)
Dotplot
DotPlot(seurat, assay="RNA", features = rev(selGenesAll$gene), scale =T,
        cluster.idents = F) +
  scale_color_viridis_c() +
  coord_flip() +
  theme(axis.text.x = element_text(angle = 90, hjust = 1)) +
  scale_x_discrete(breaks=rev(selGenesAll$gene), labels=rev(selGenesAll$geneID)) +
  xlab("") + ylab("")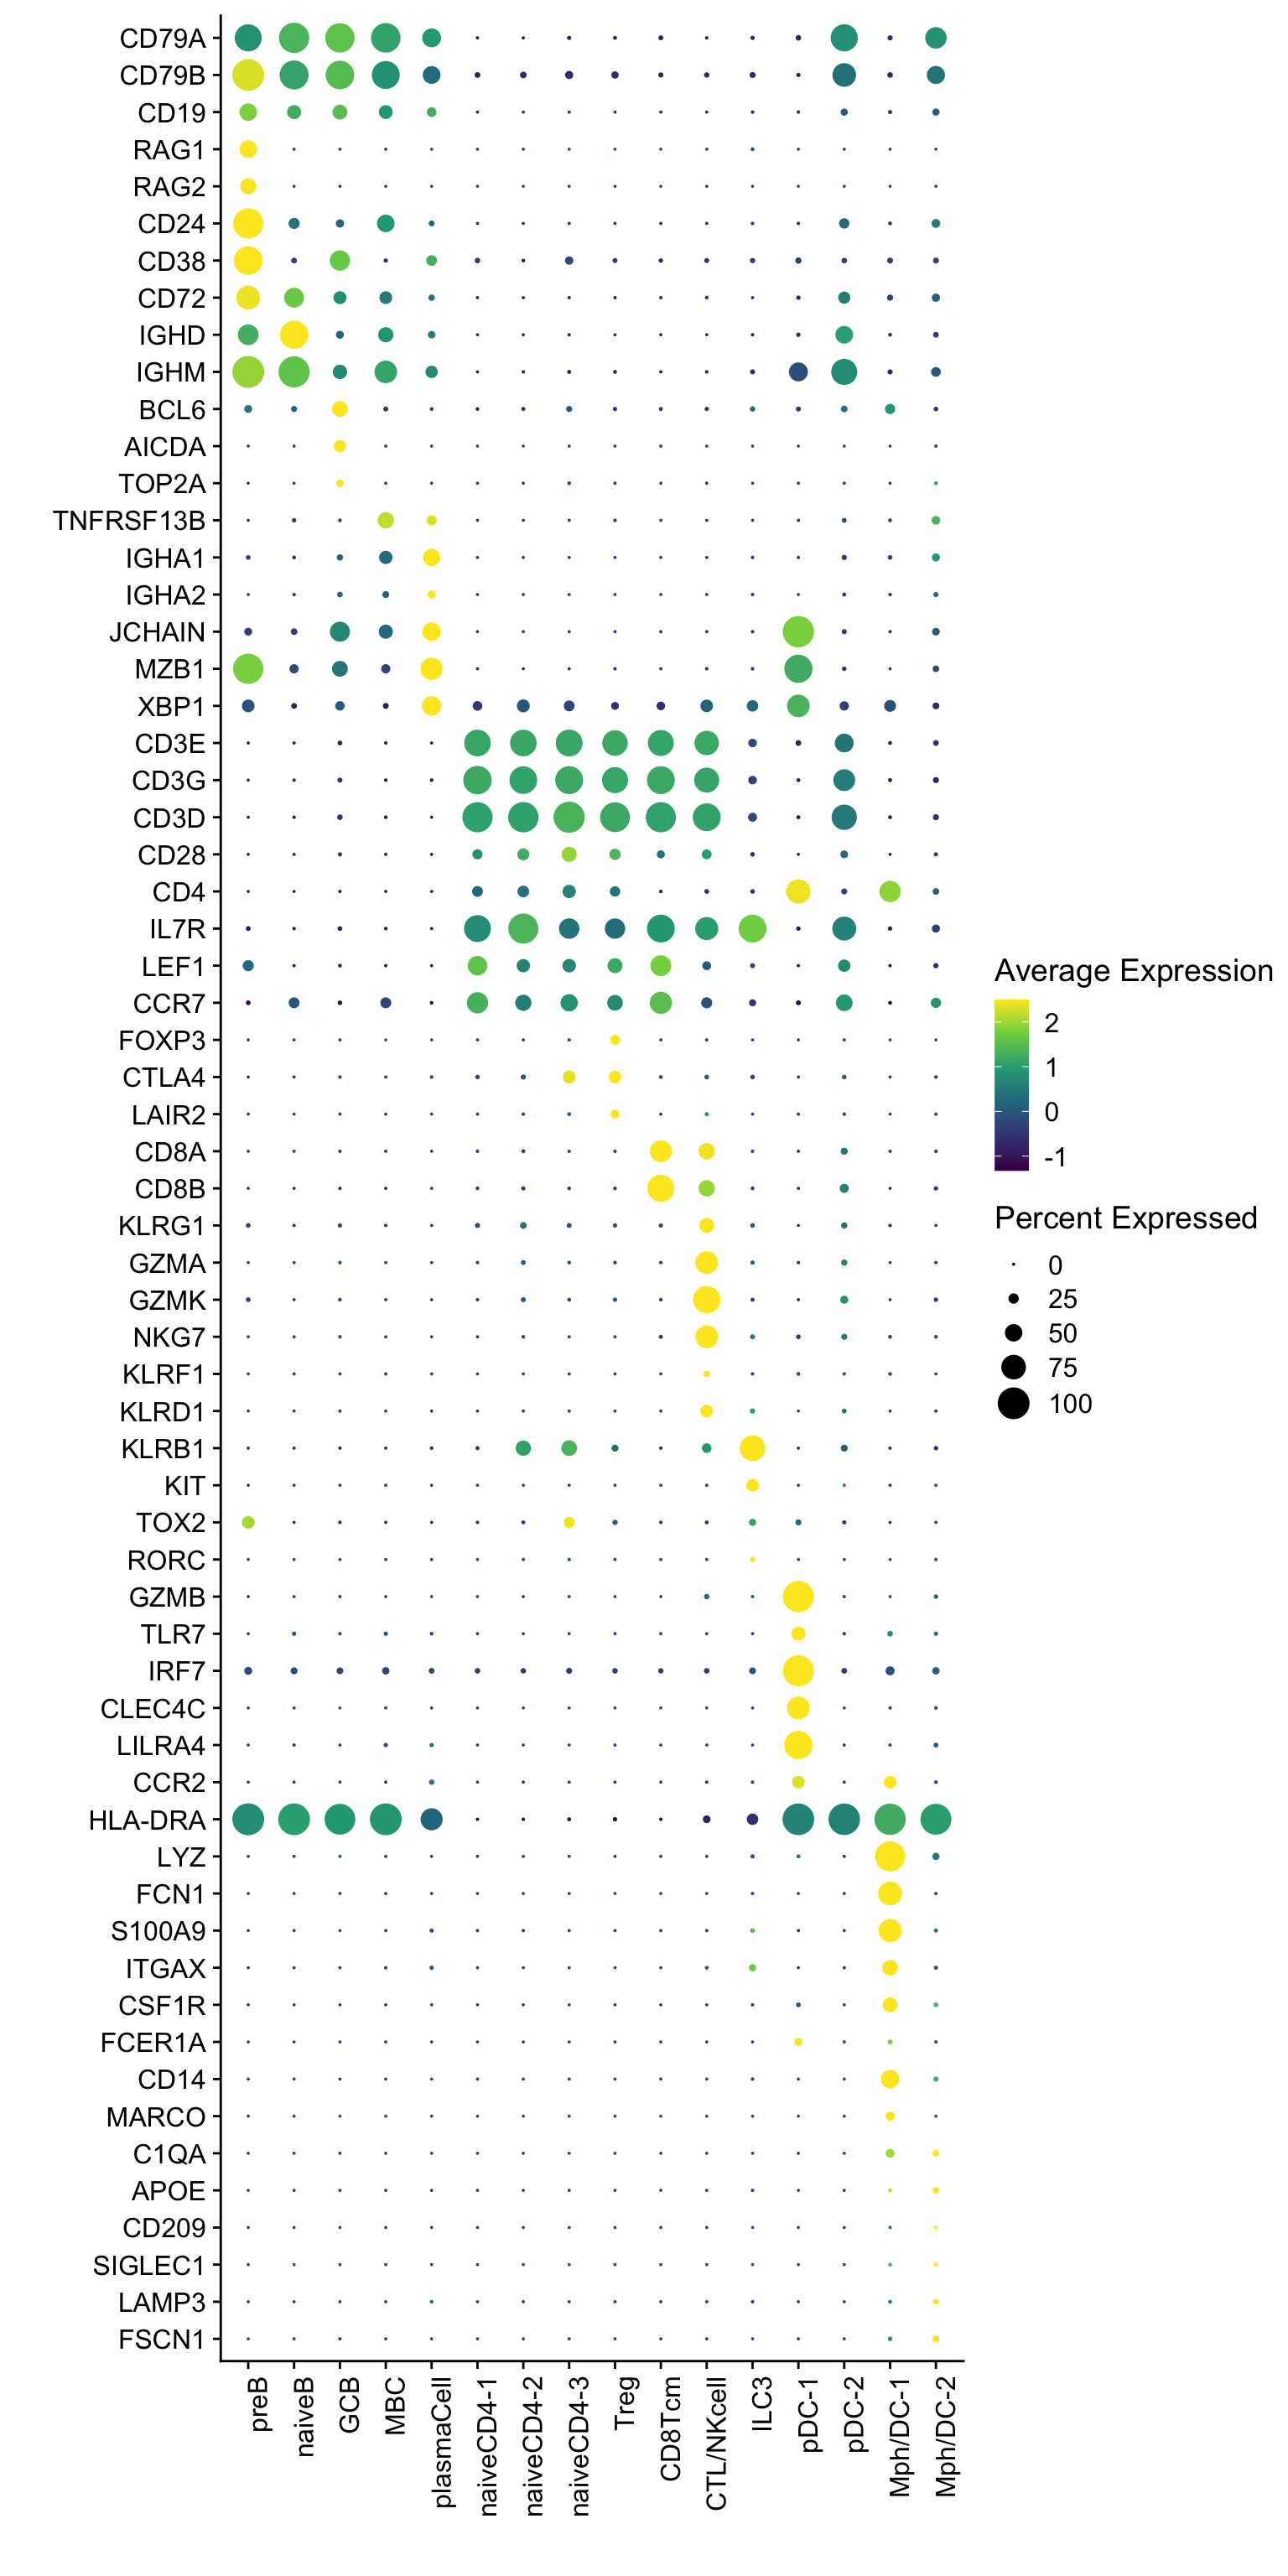
DotPlot(seurat, assay="RNA", features = rev(selGenesAll$gene), scale =F,
        cluster.idents = F) +
  scale_color_viridis_c() +
  coord_flip() +
  theme(axis.text.x = element_text(angle = 90, hjust = 1)) +
  scale_x_discrete(breaks=rev(selGenesAll$gene), labels=rev(selGenesAll$geneID)) +
  xlab("") + ylab("")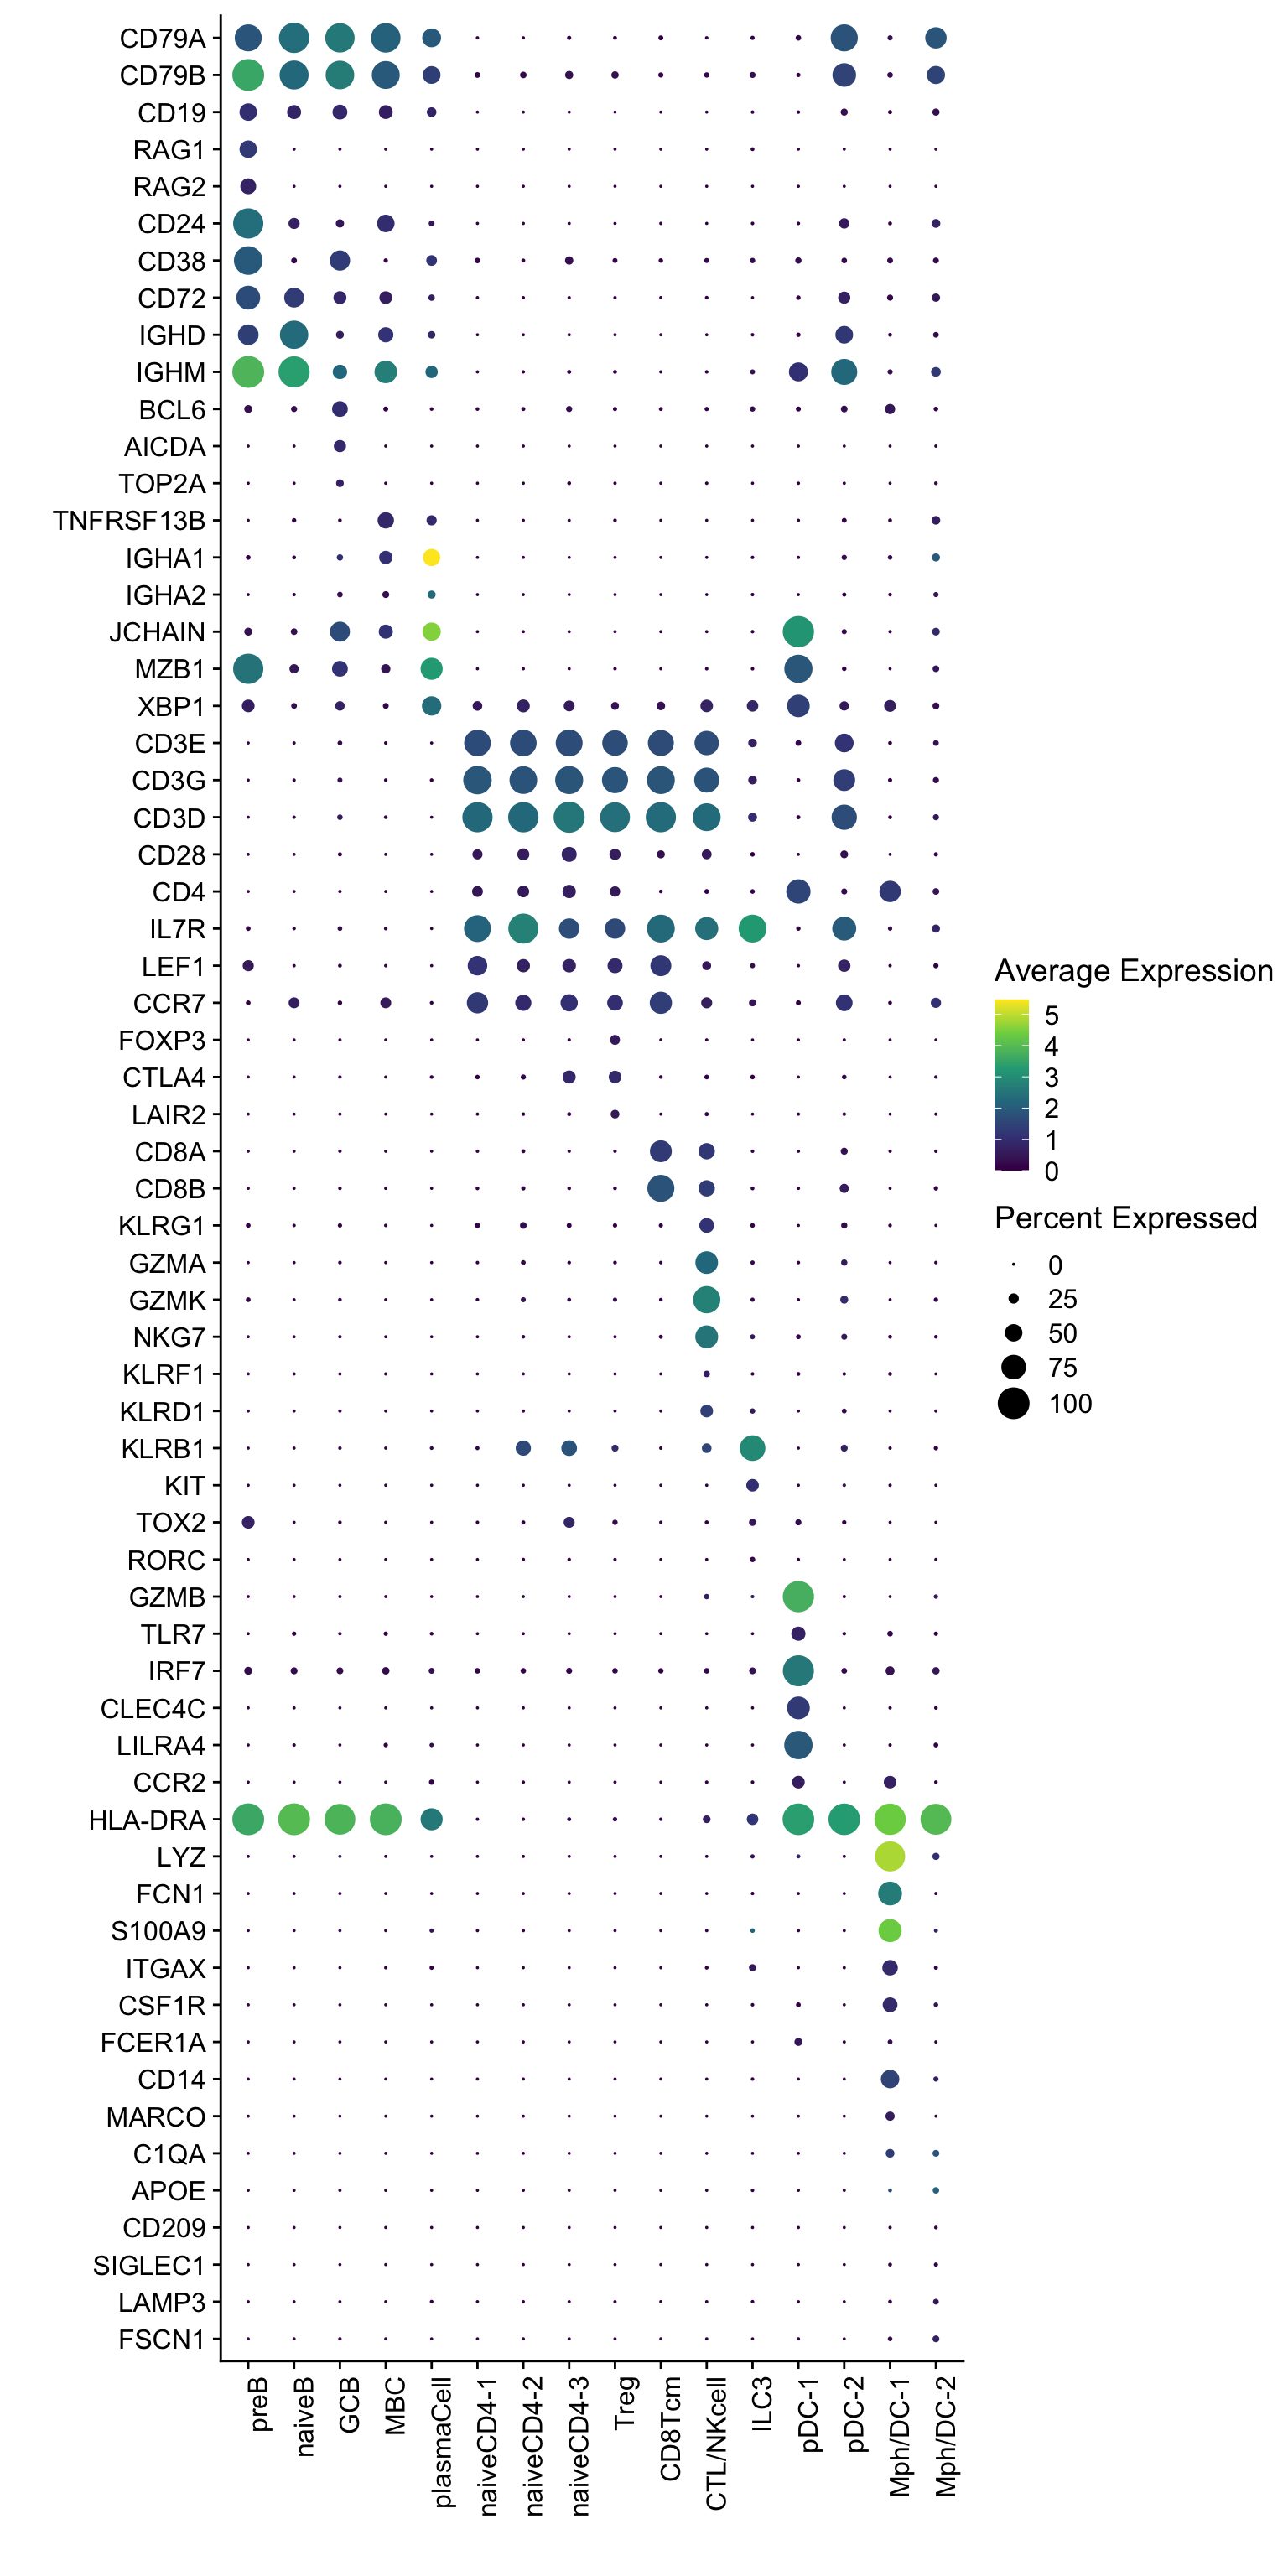
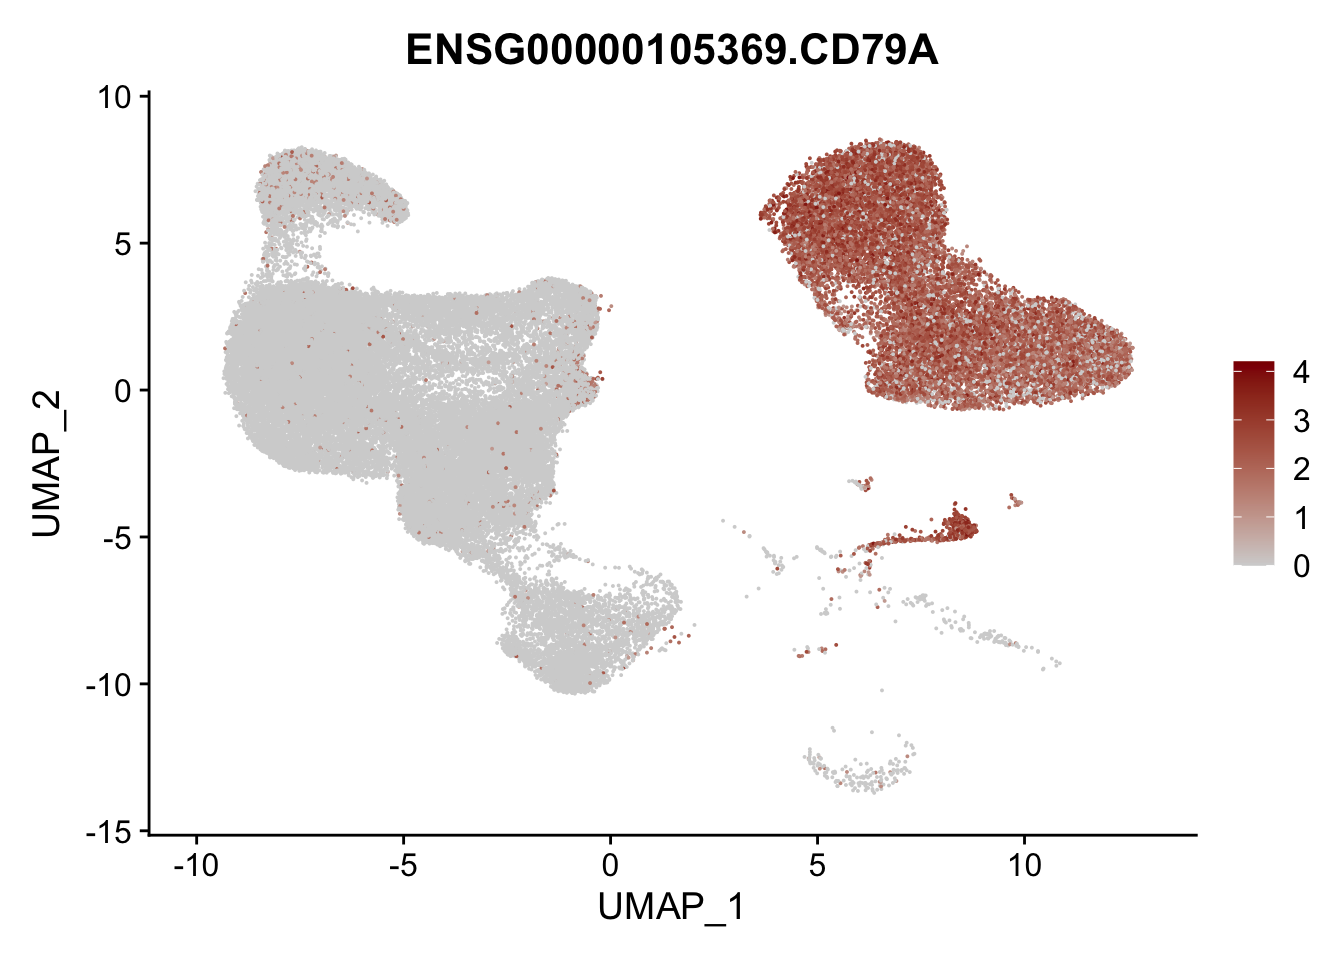
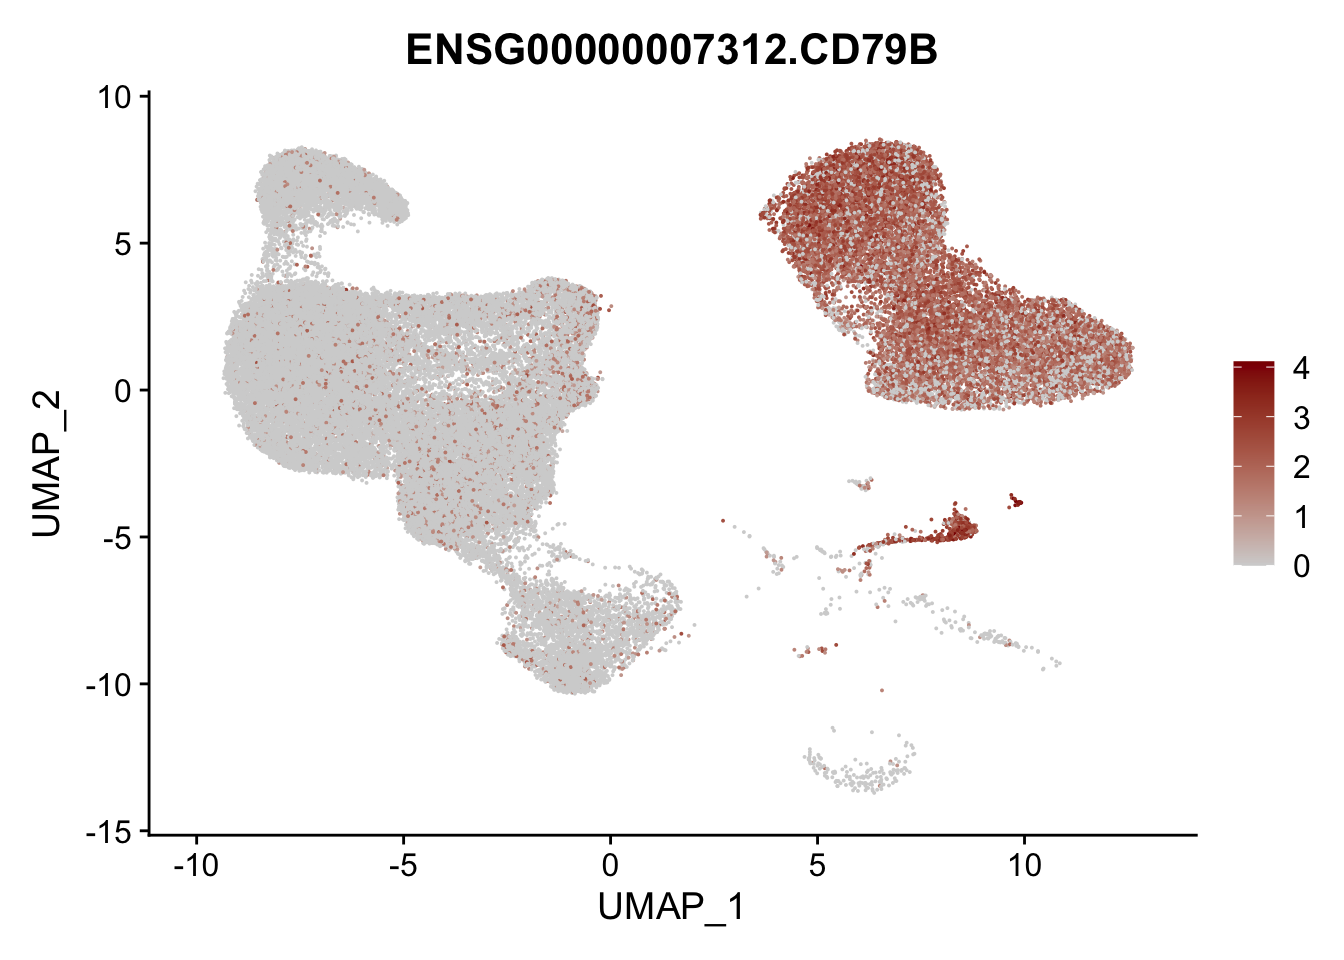
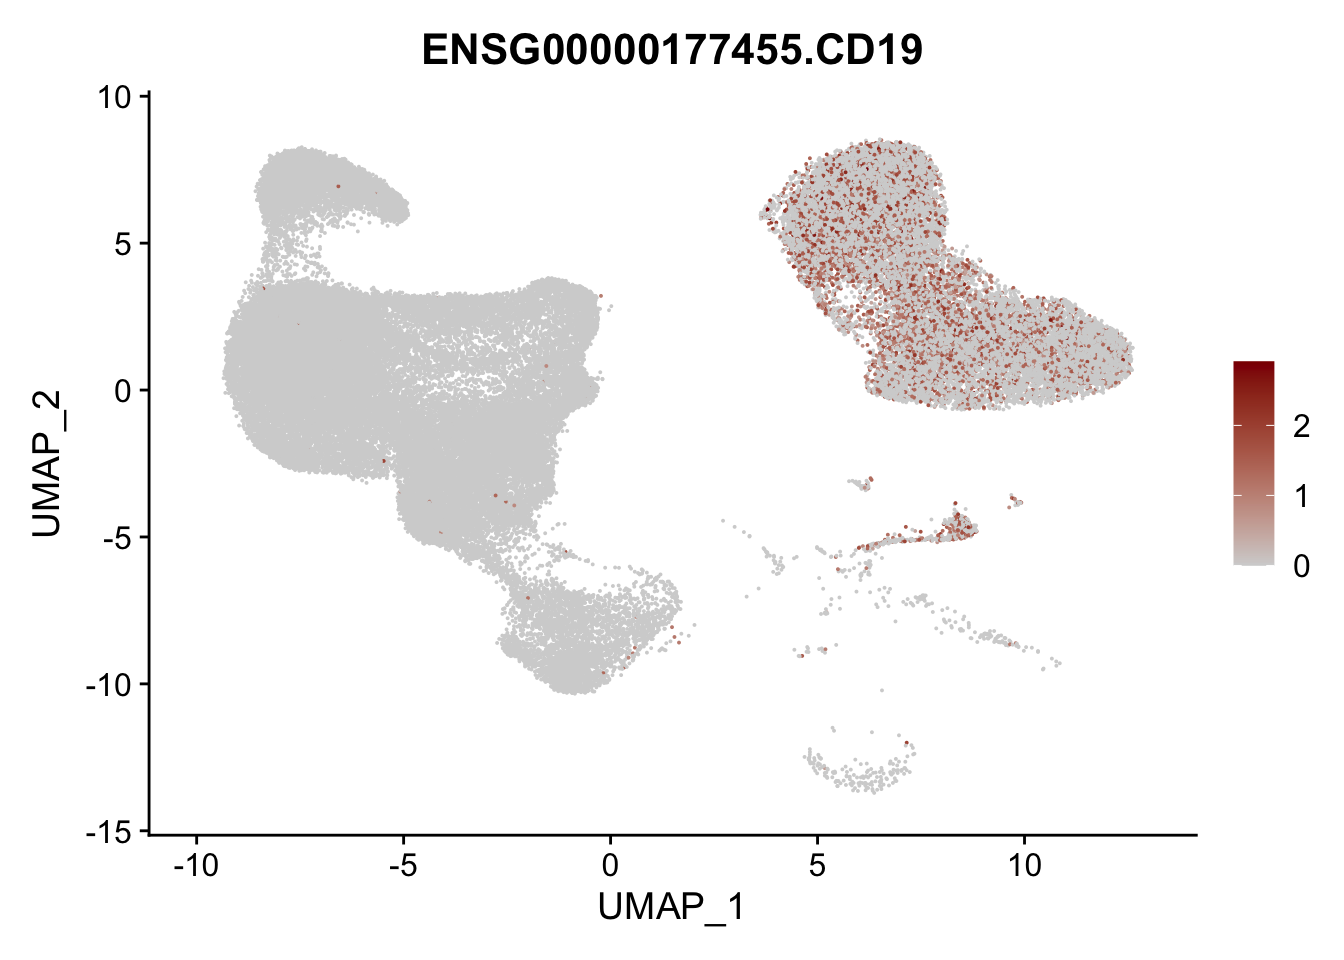
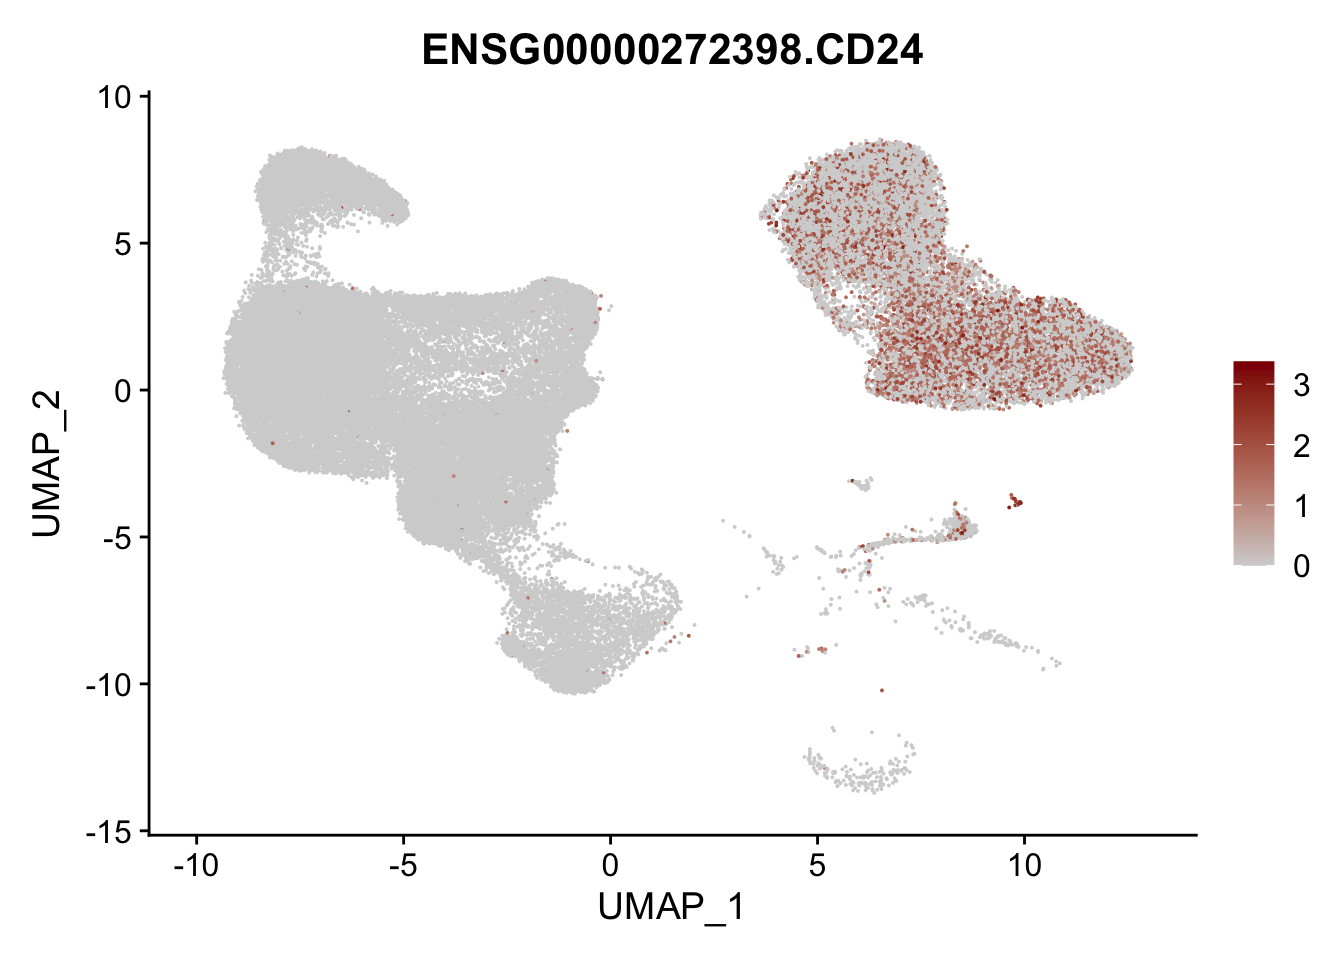
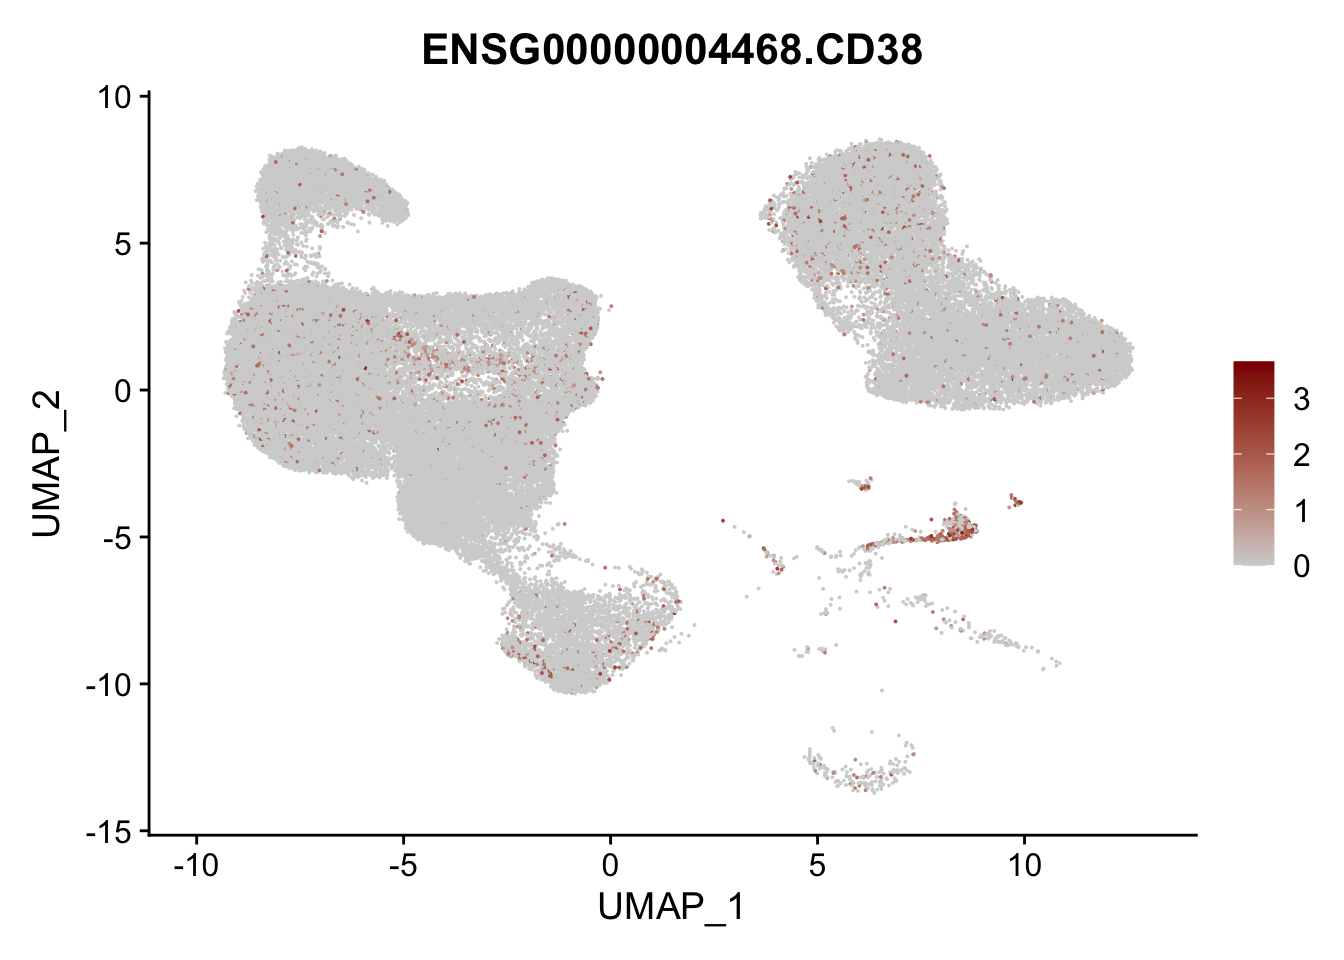
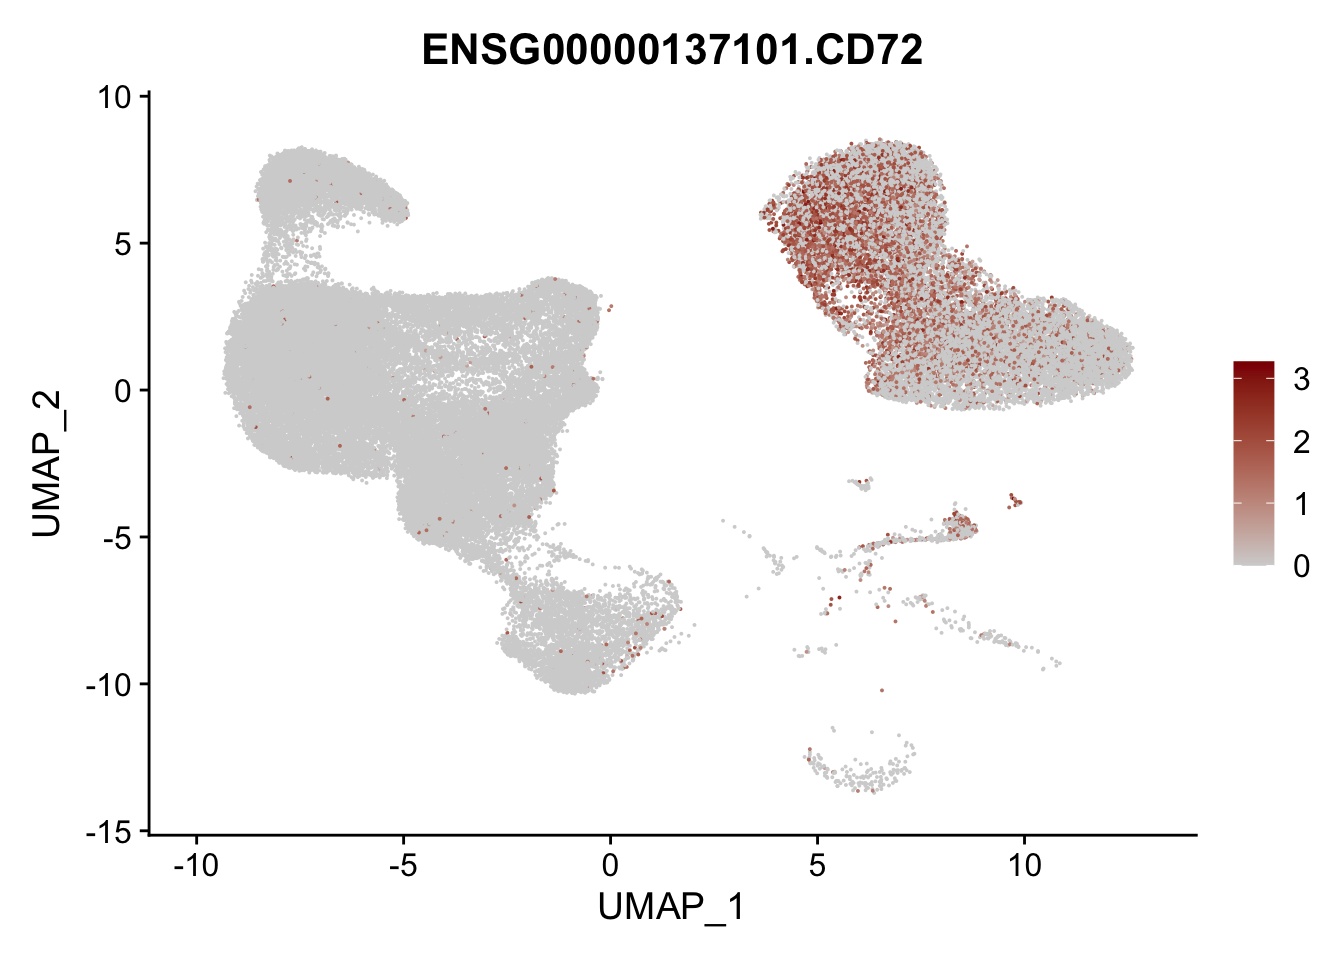
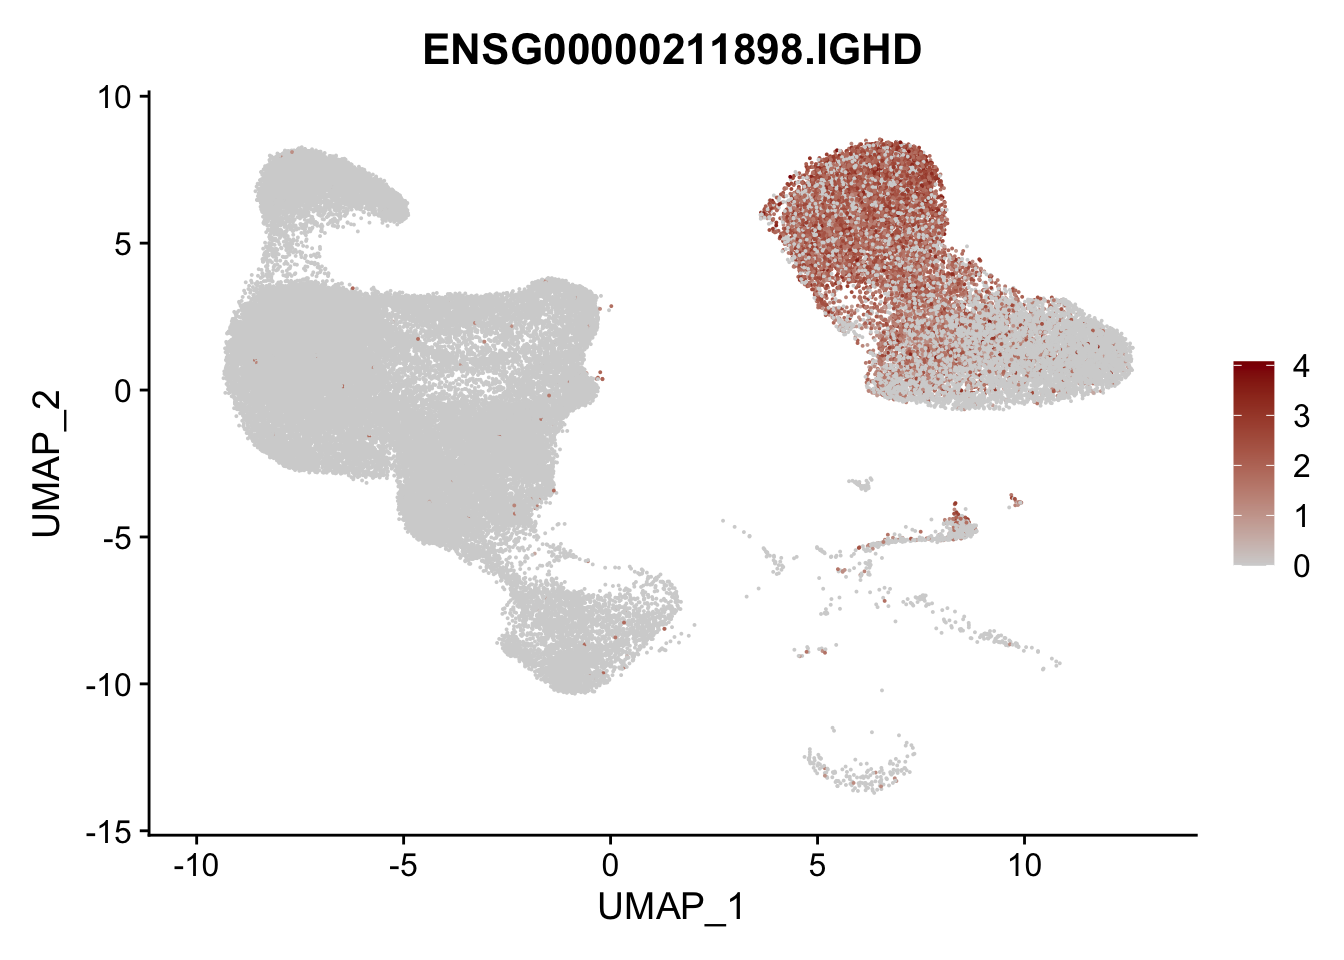
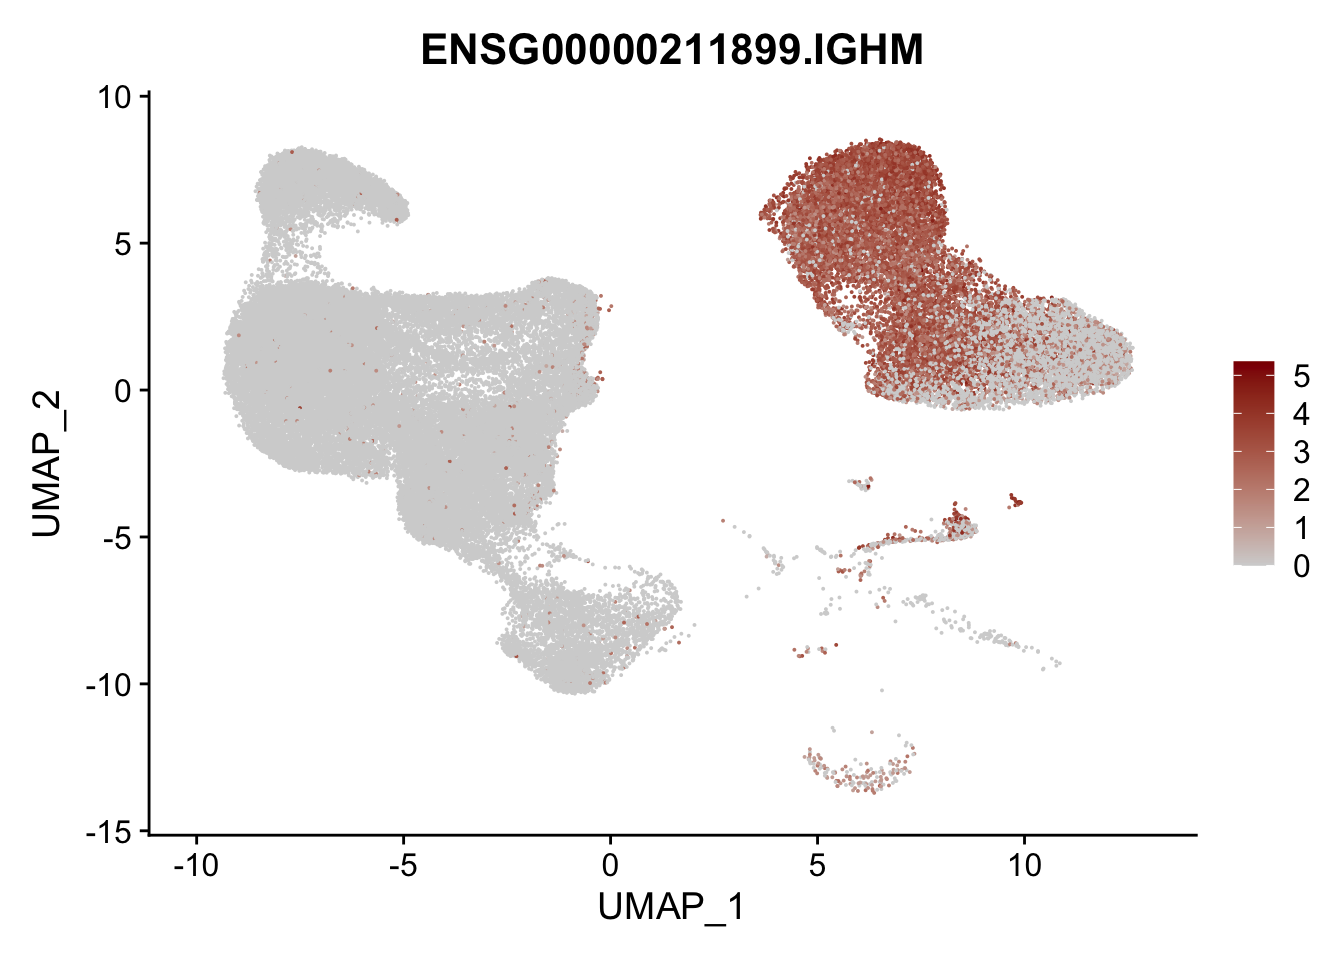
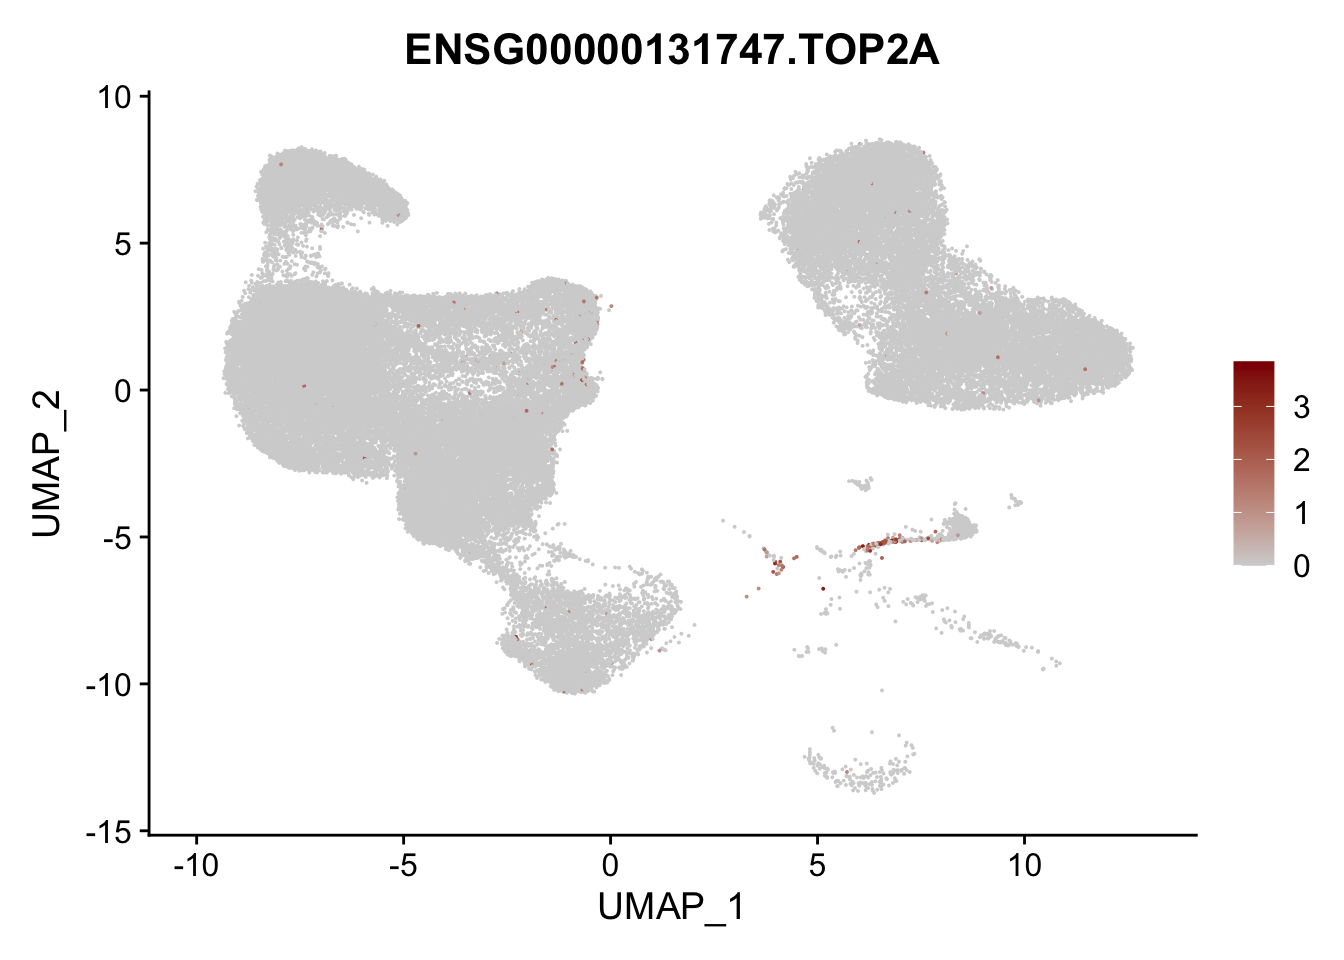
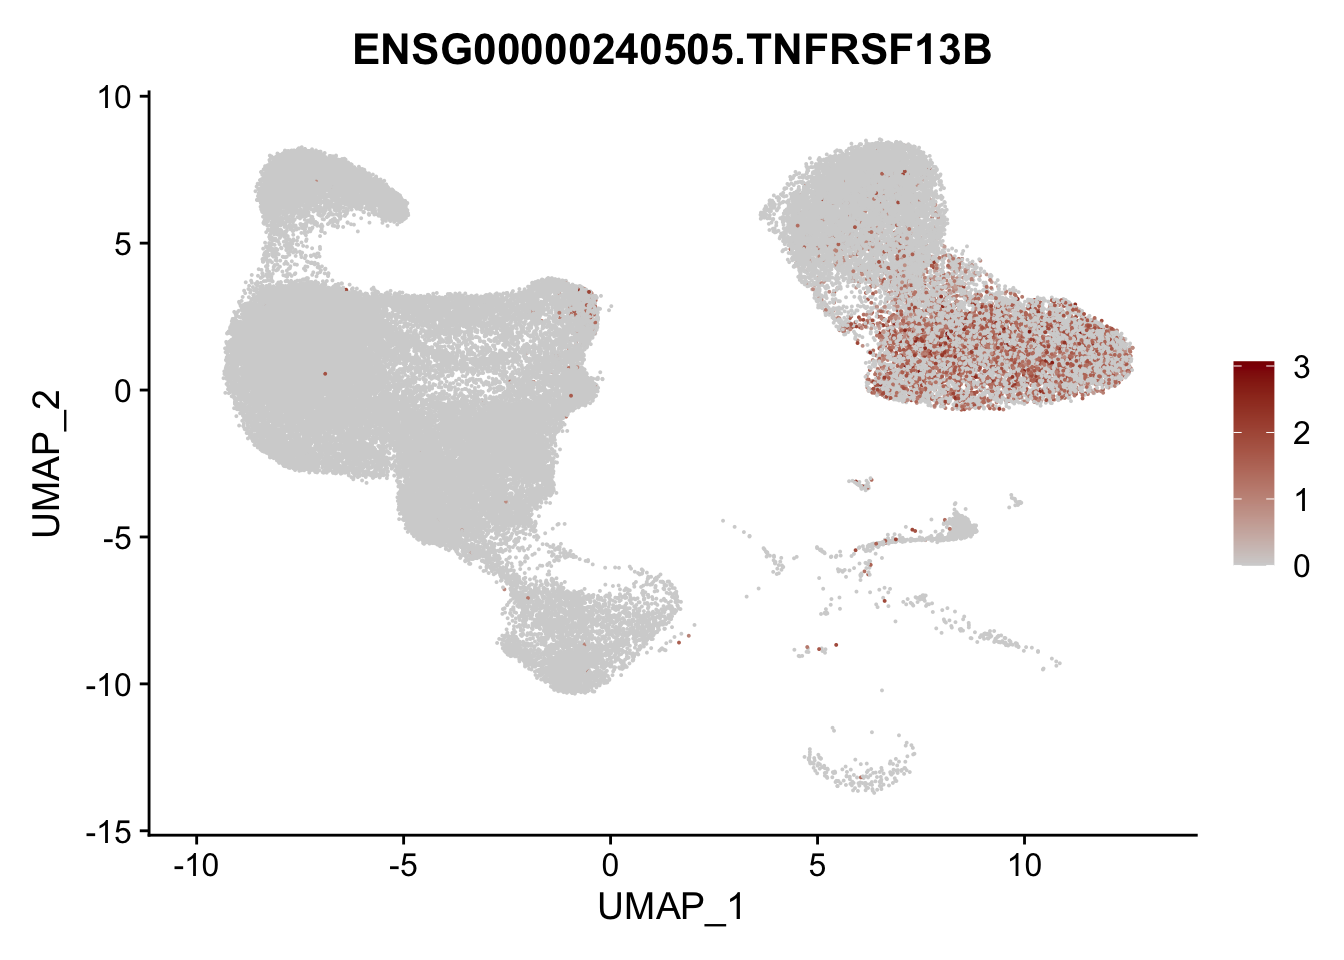
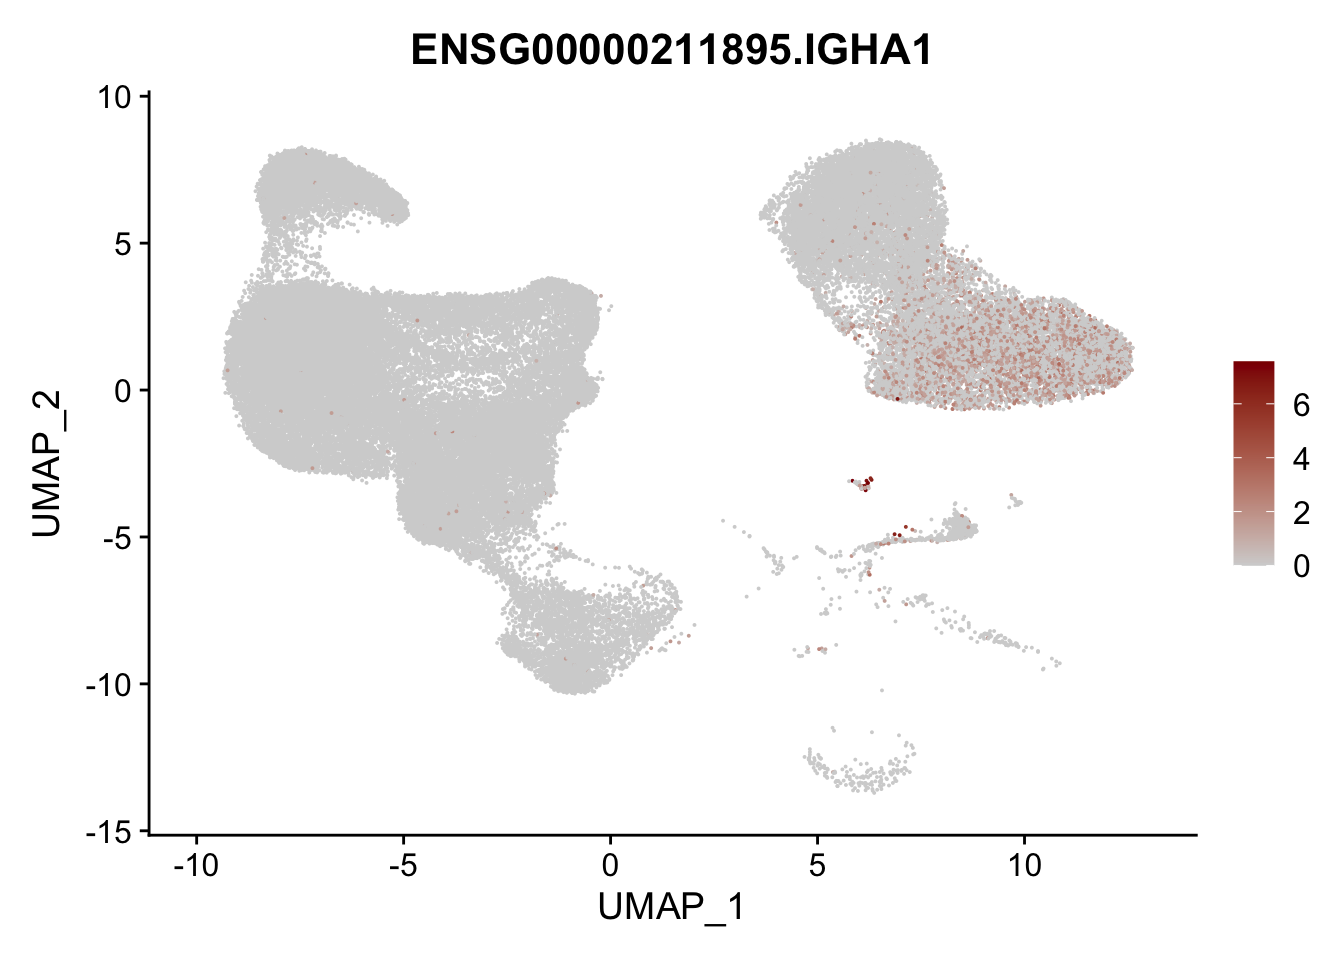
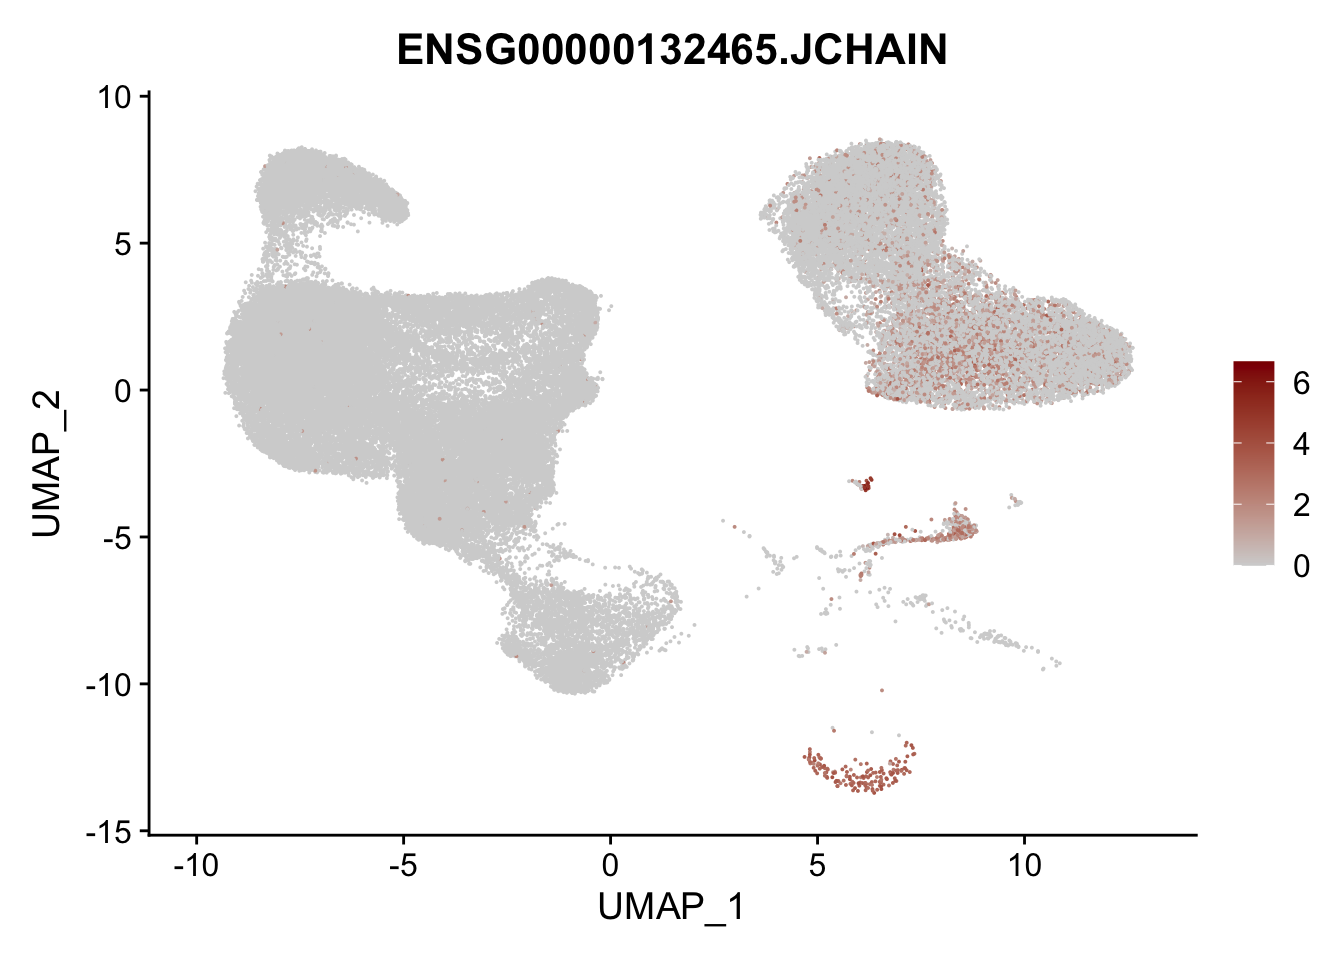
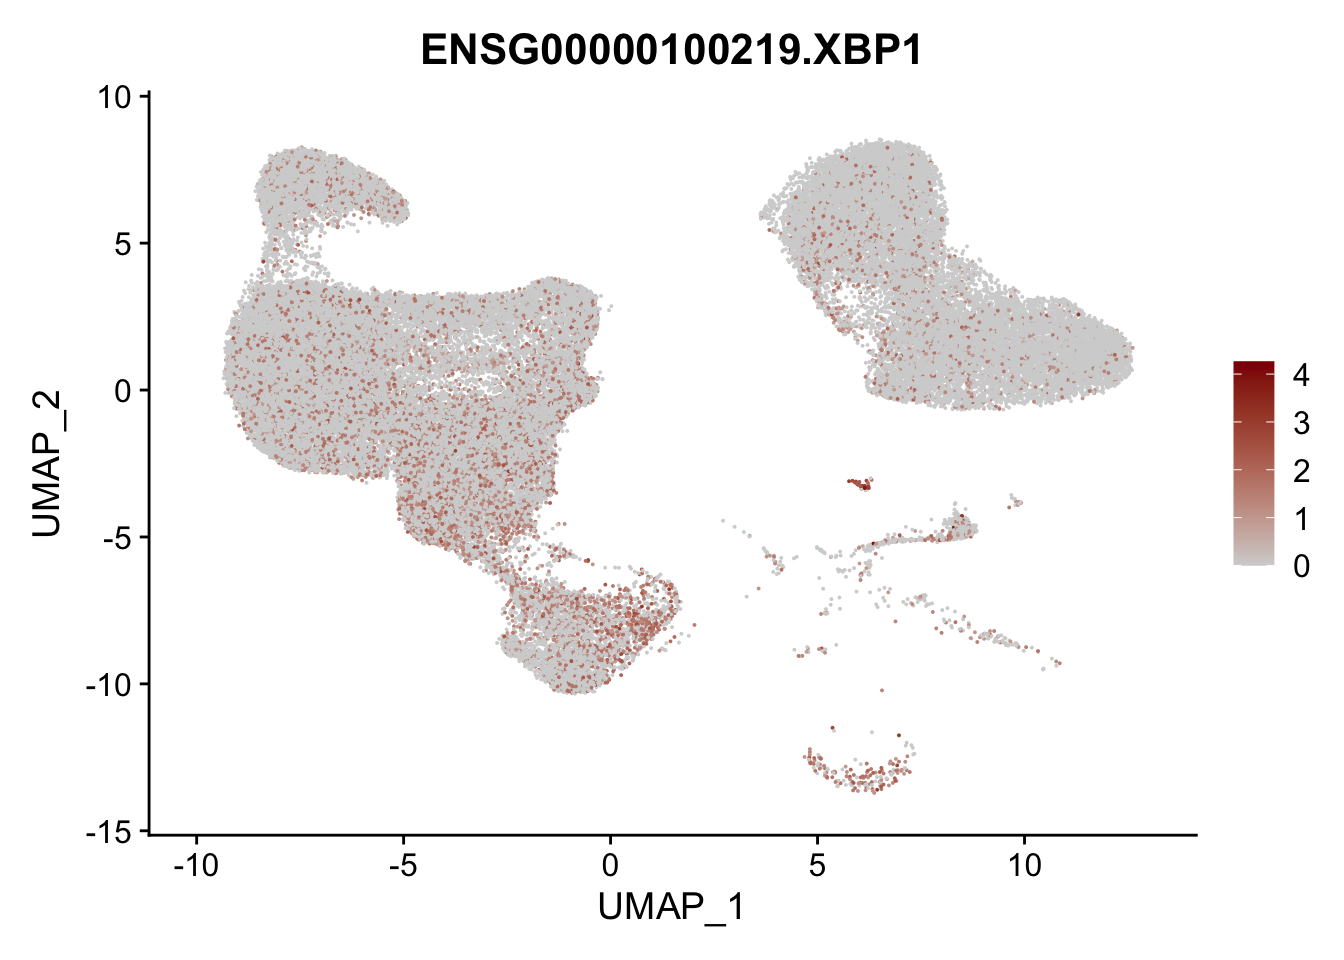
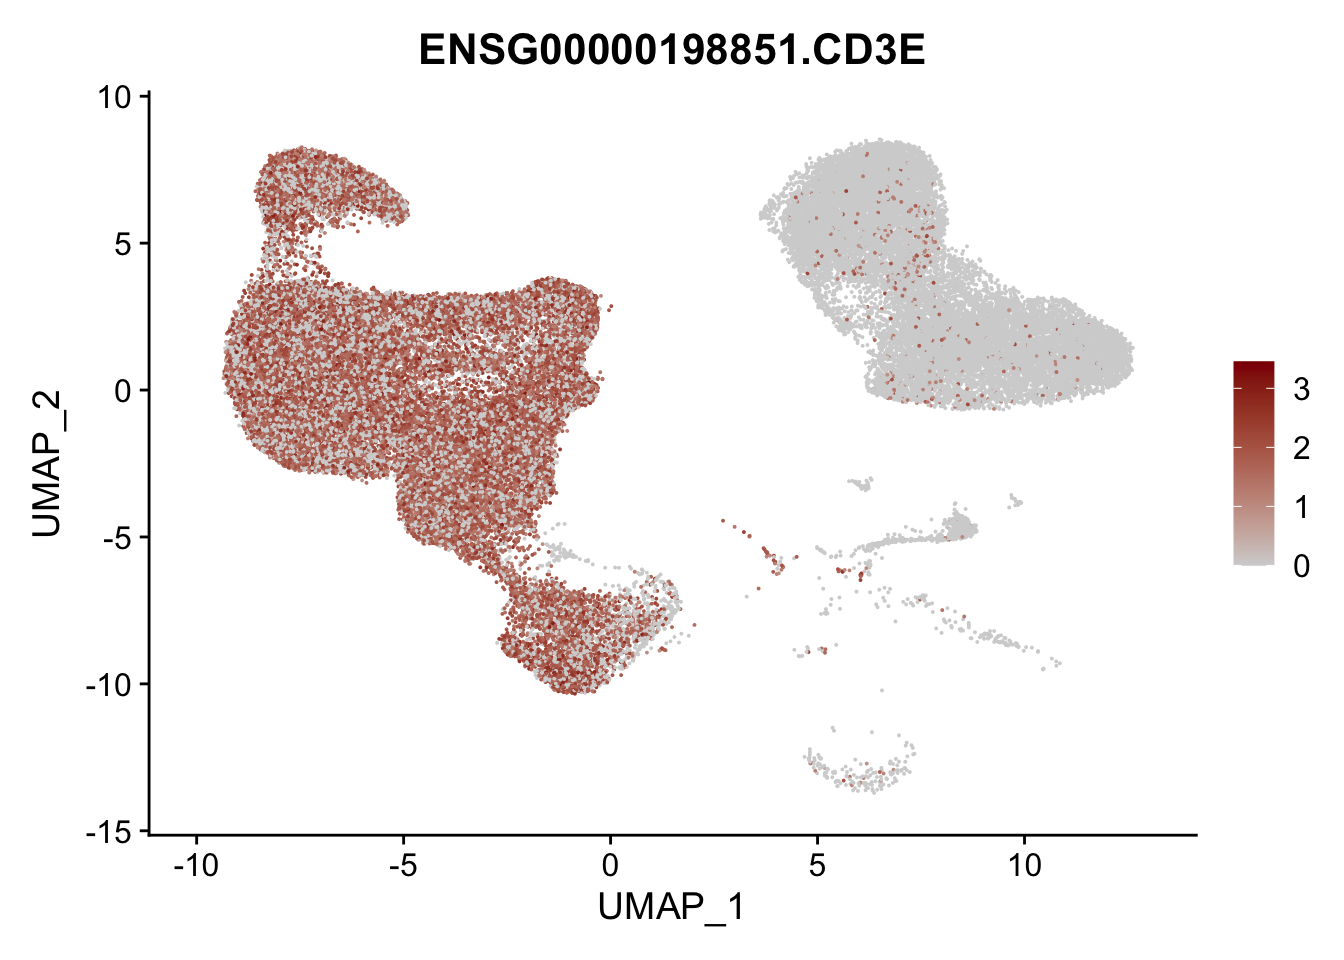
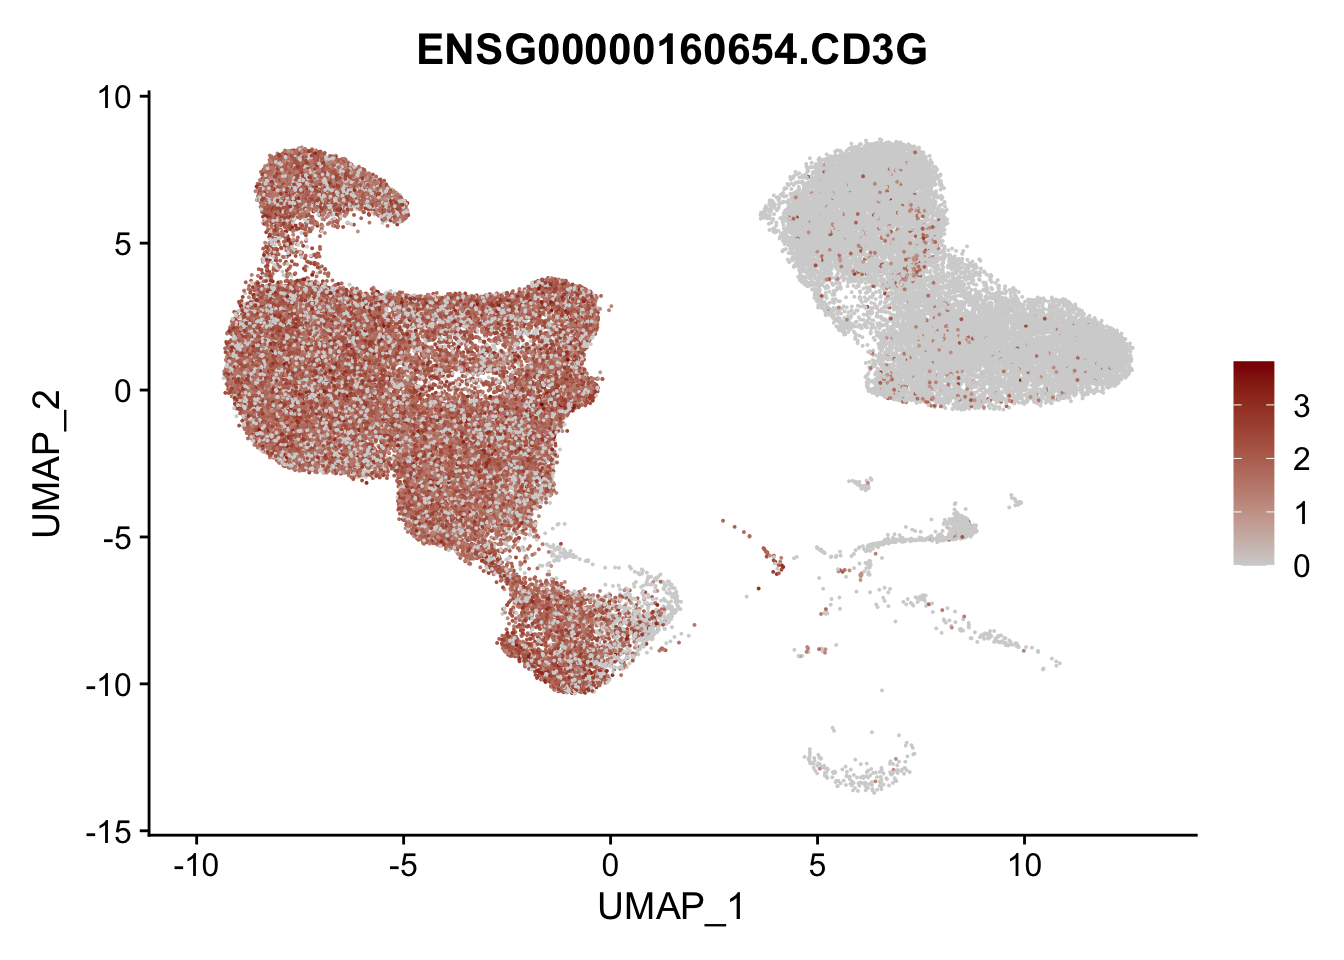
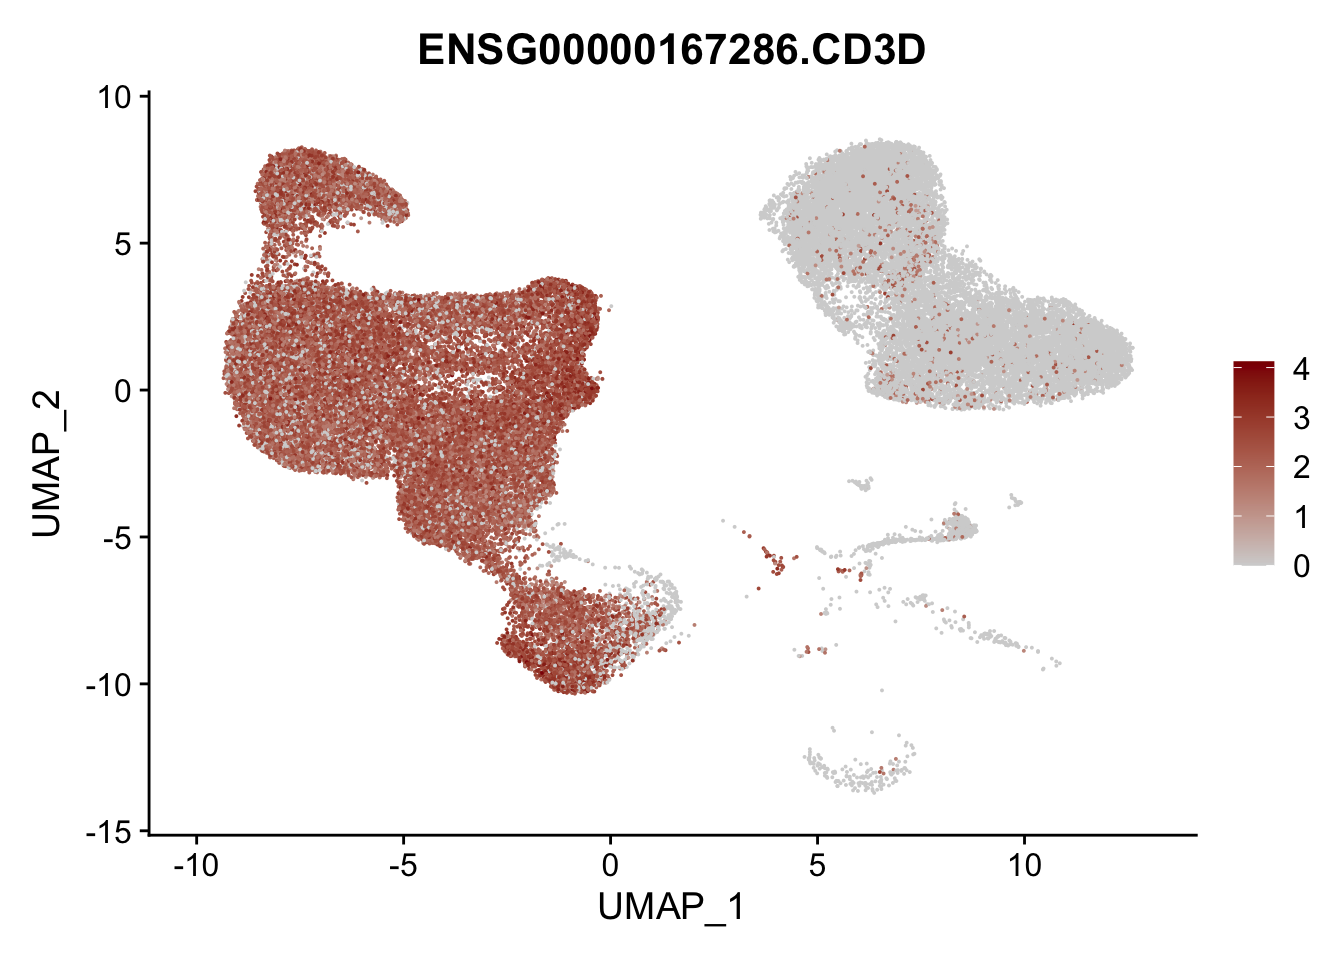
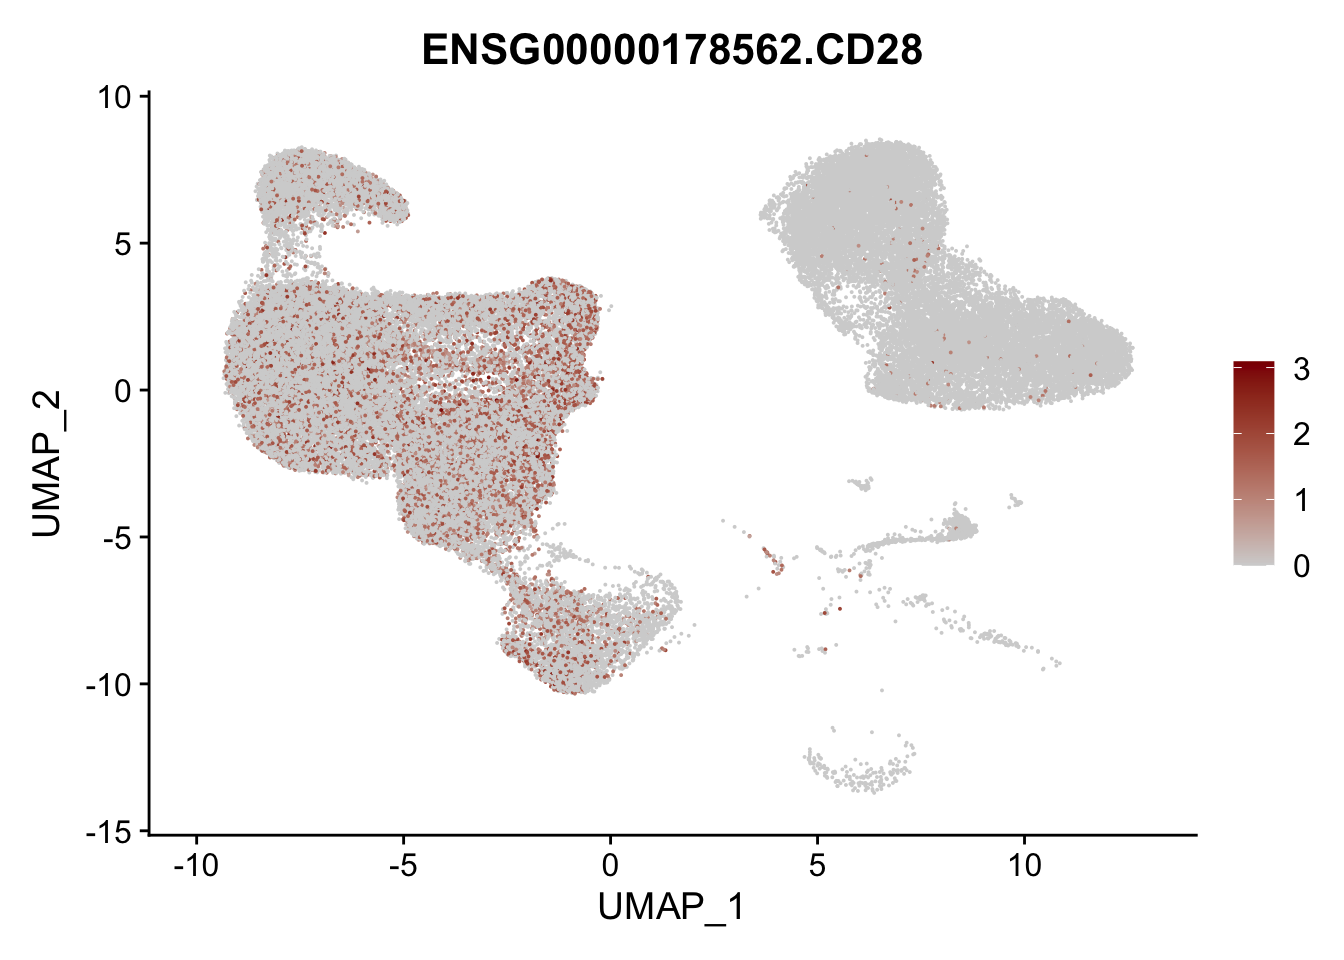
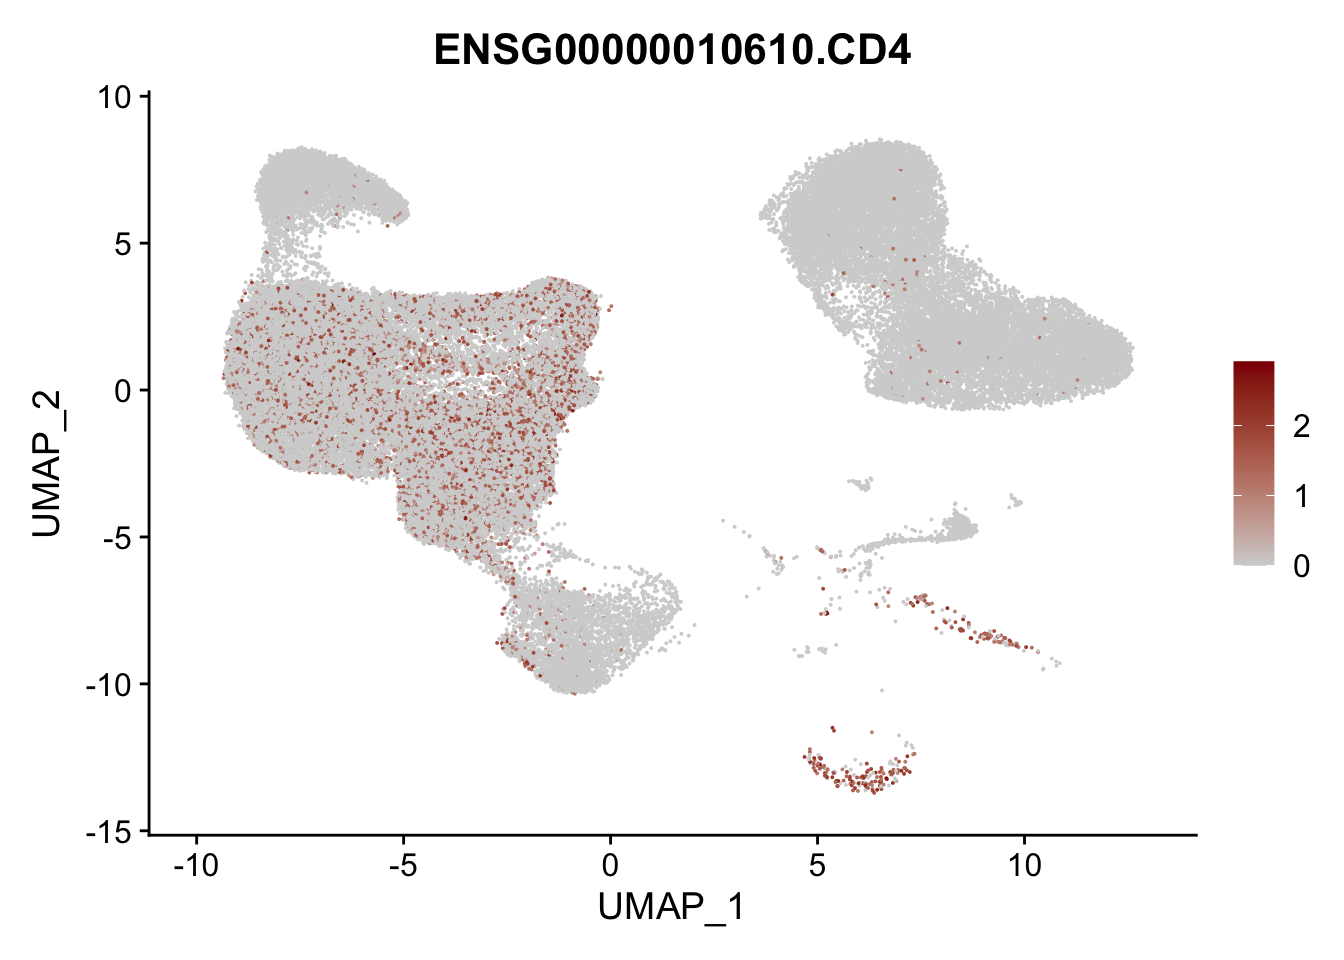
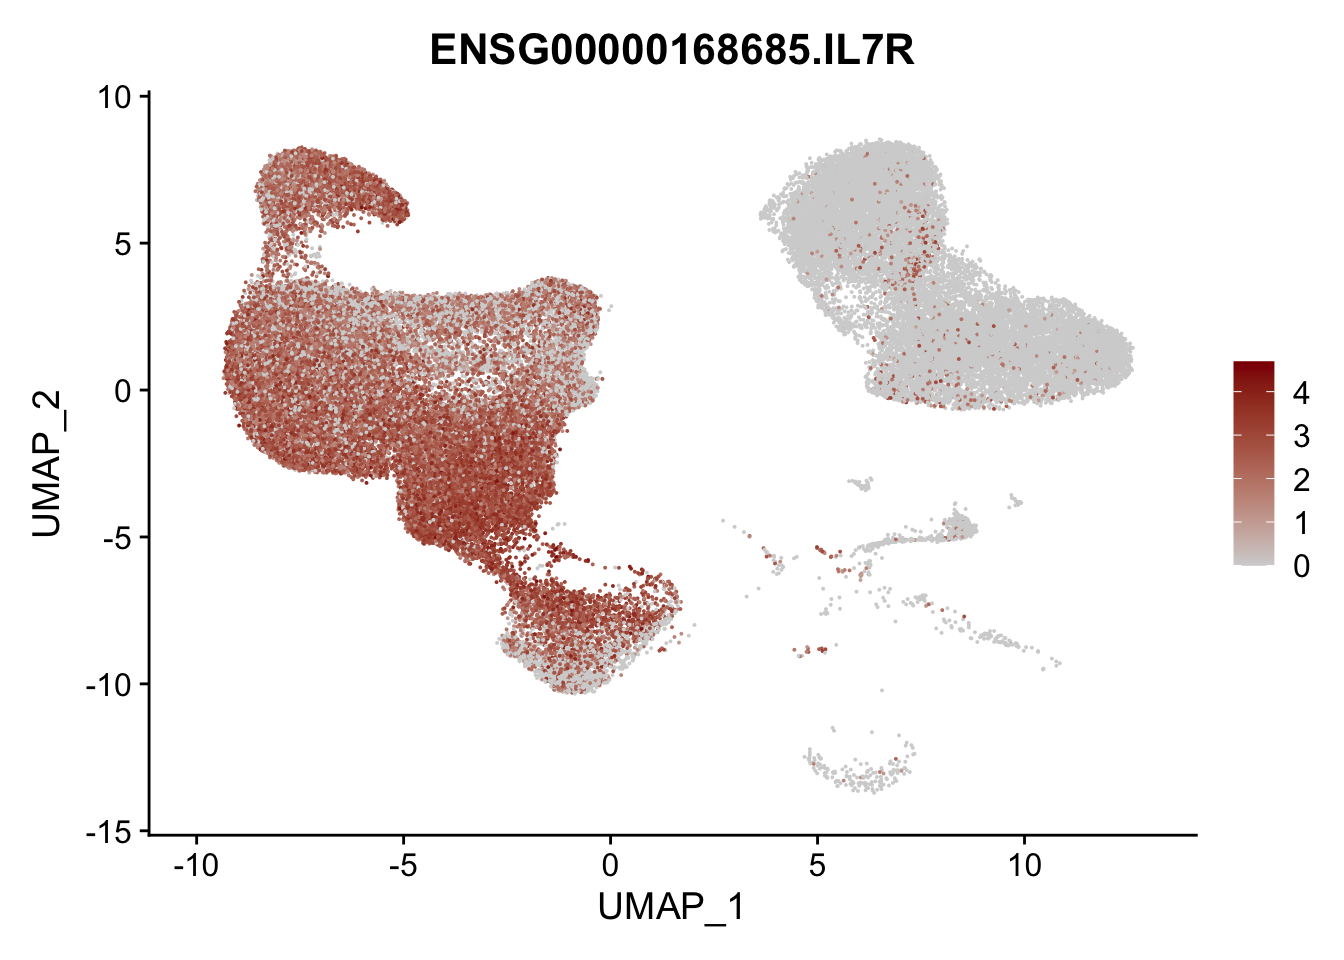
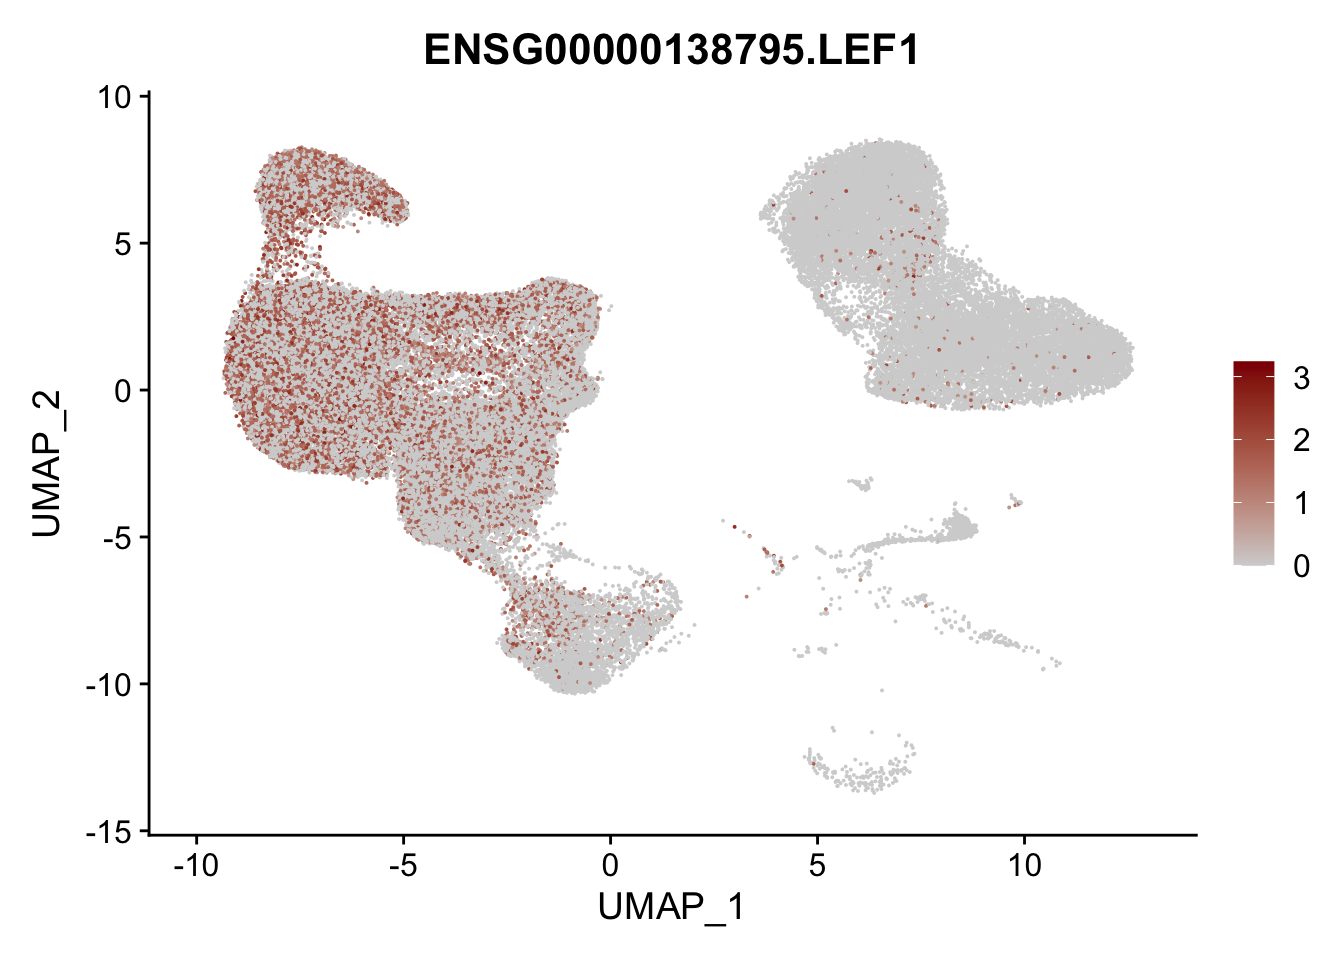
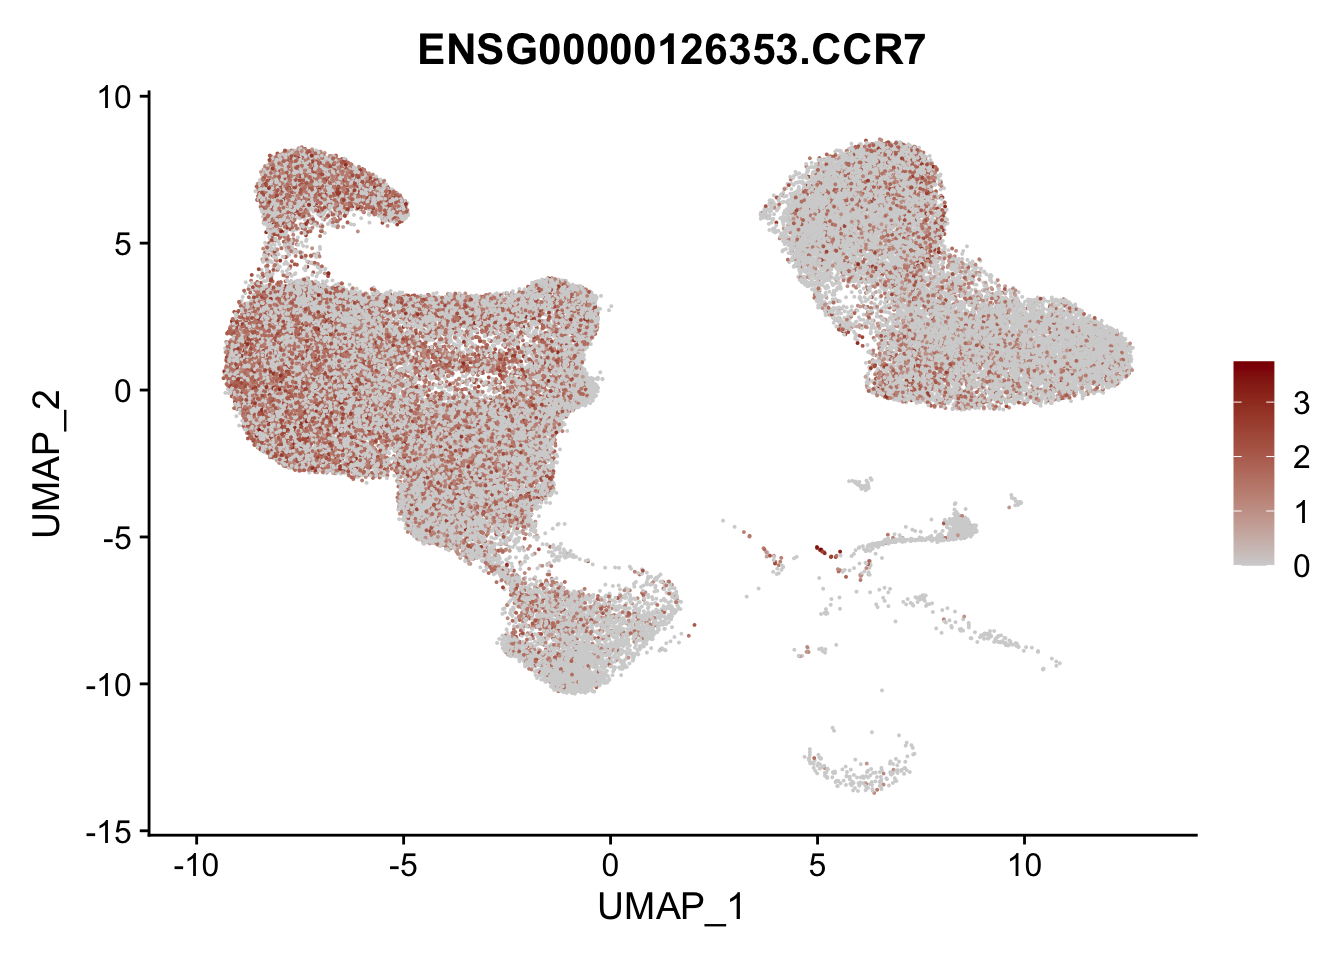
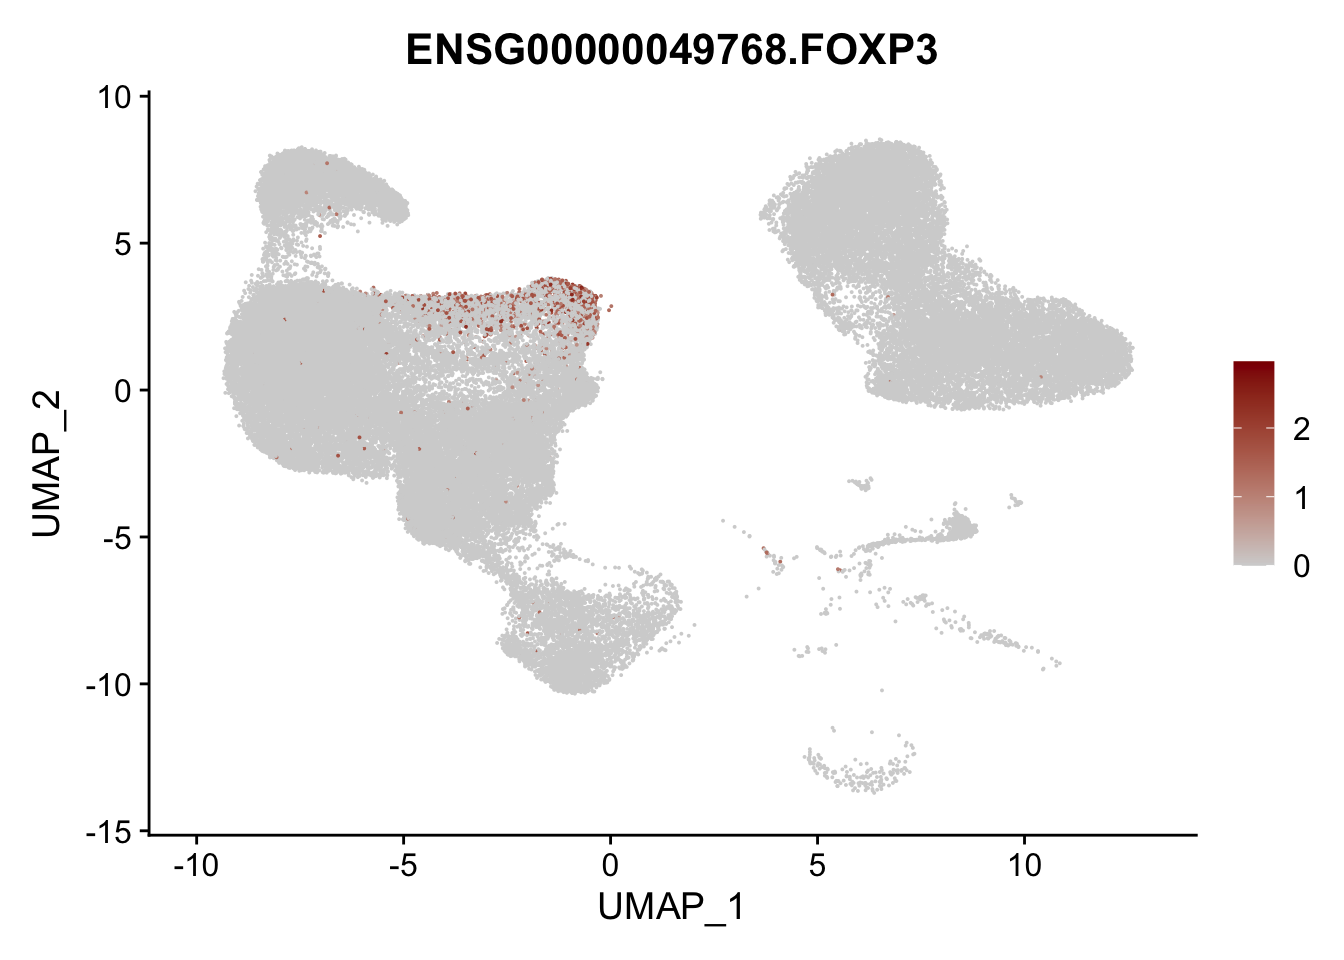
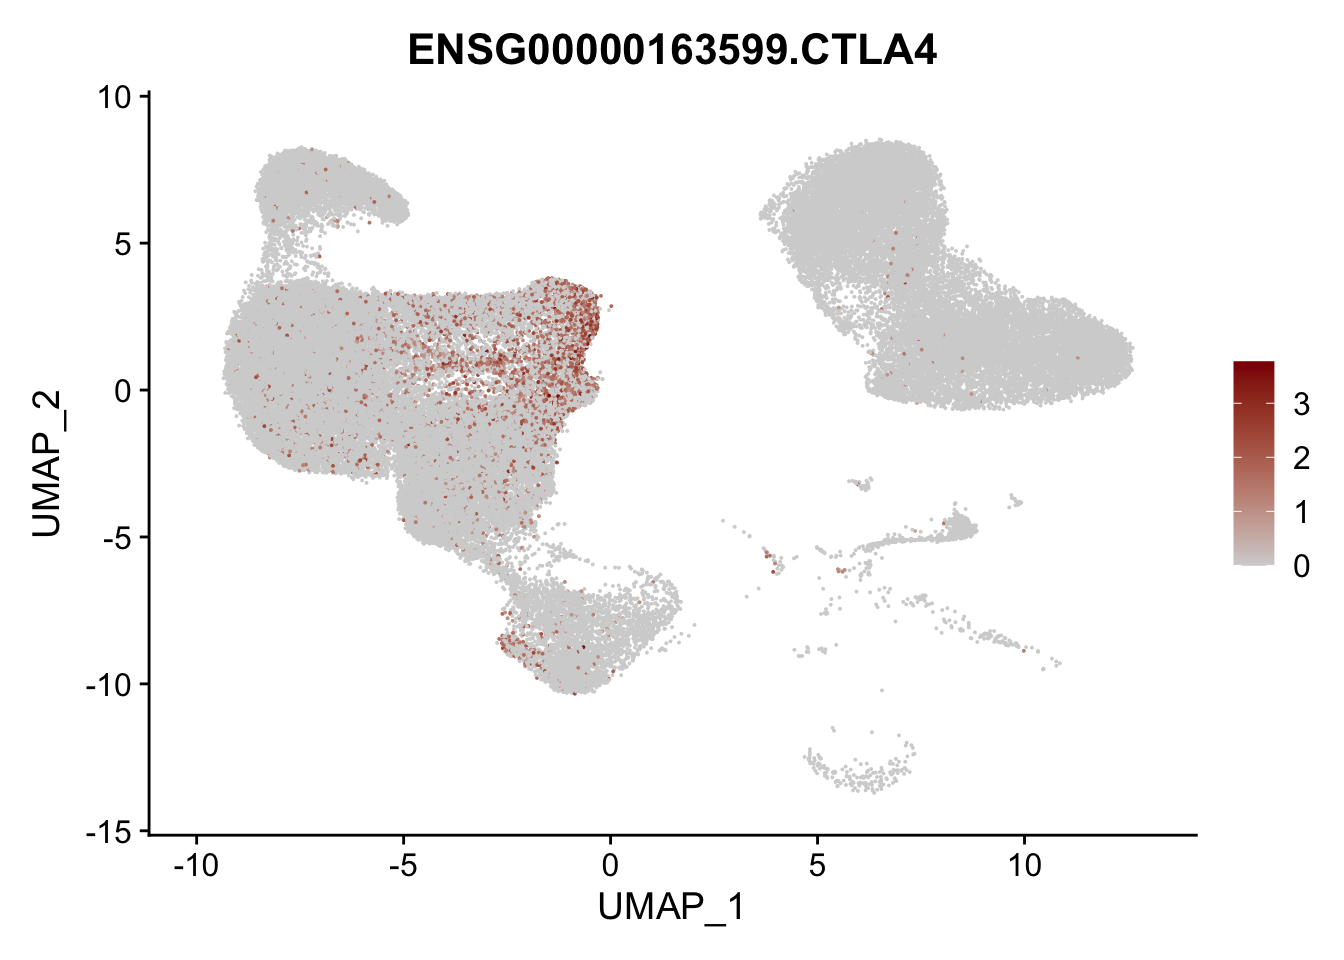
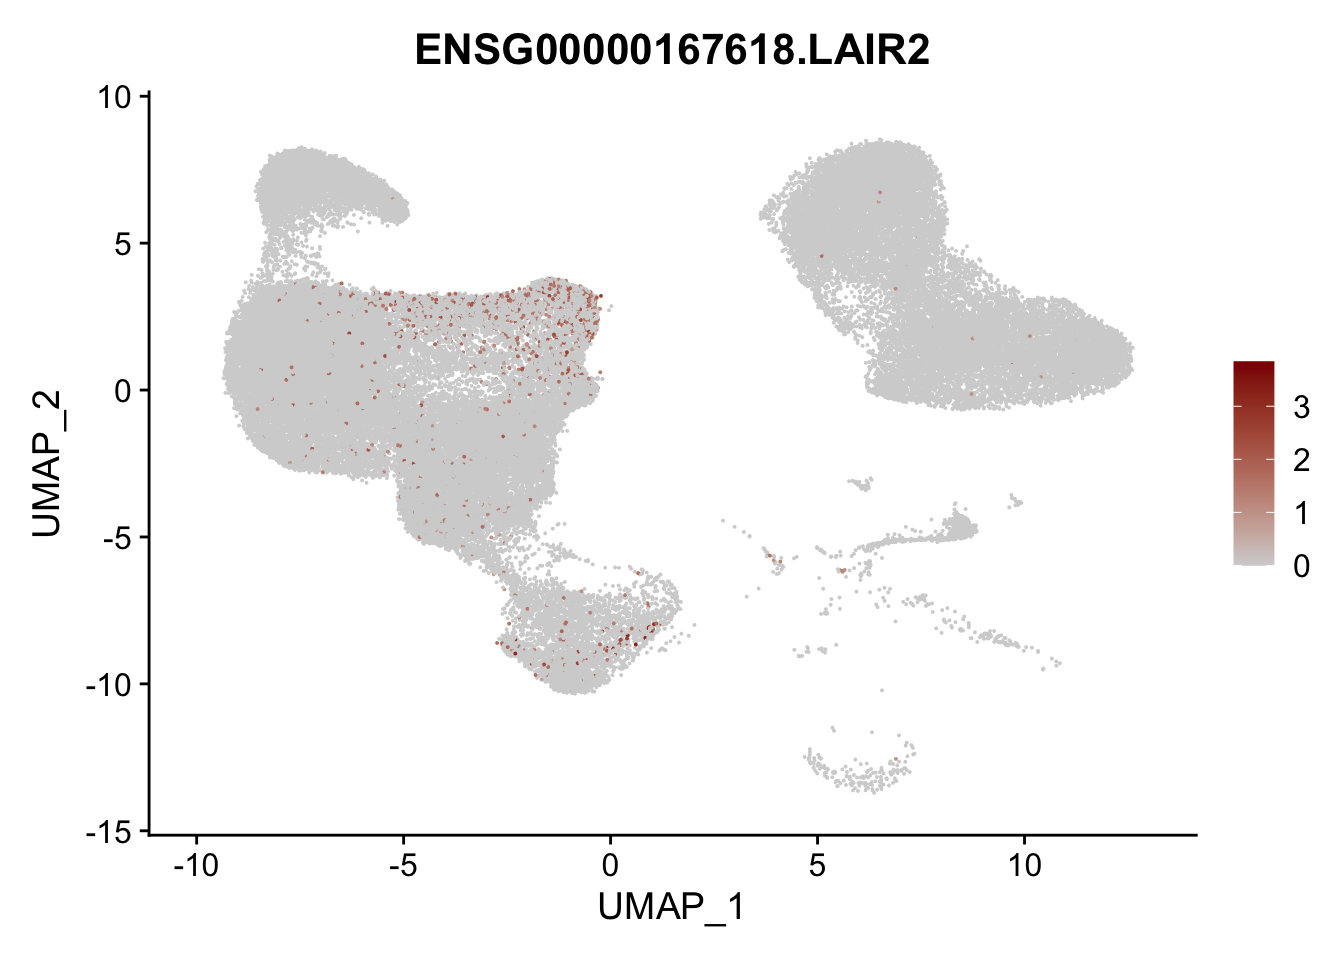
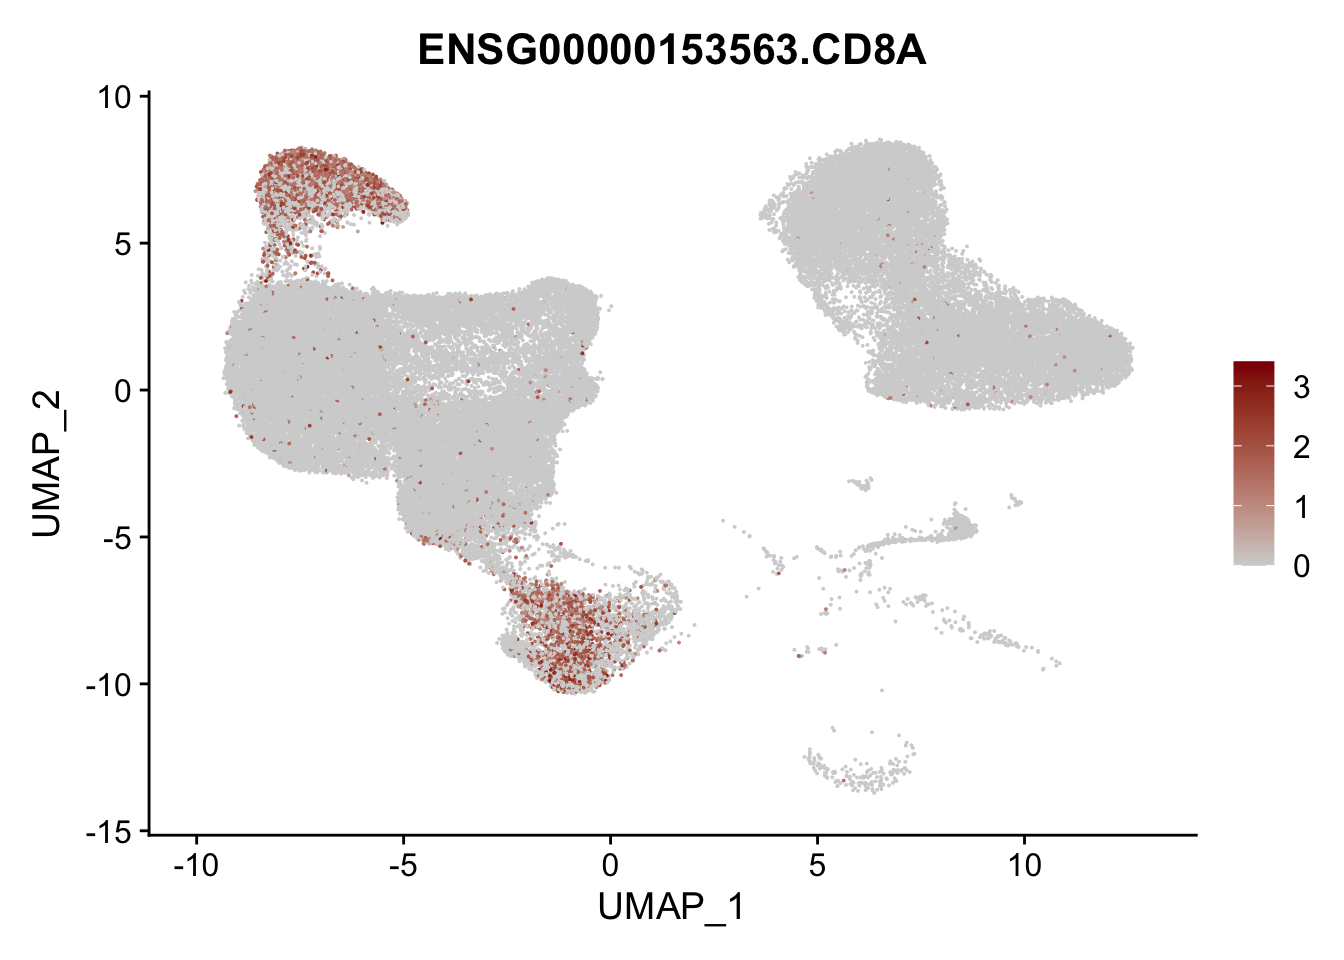
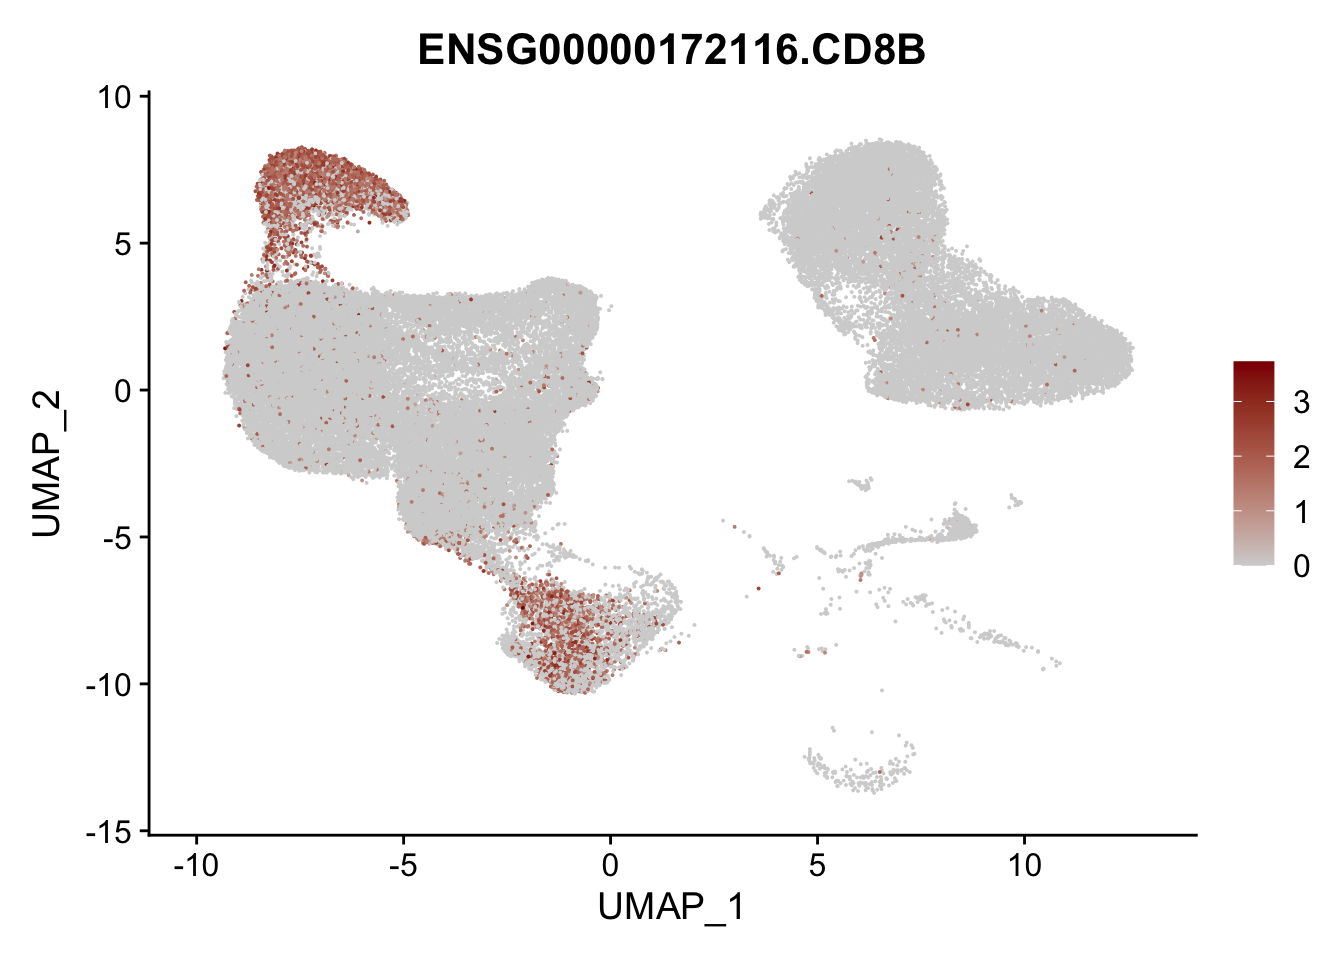
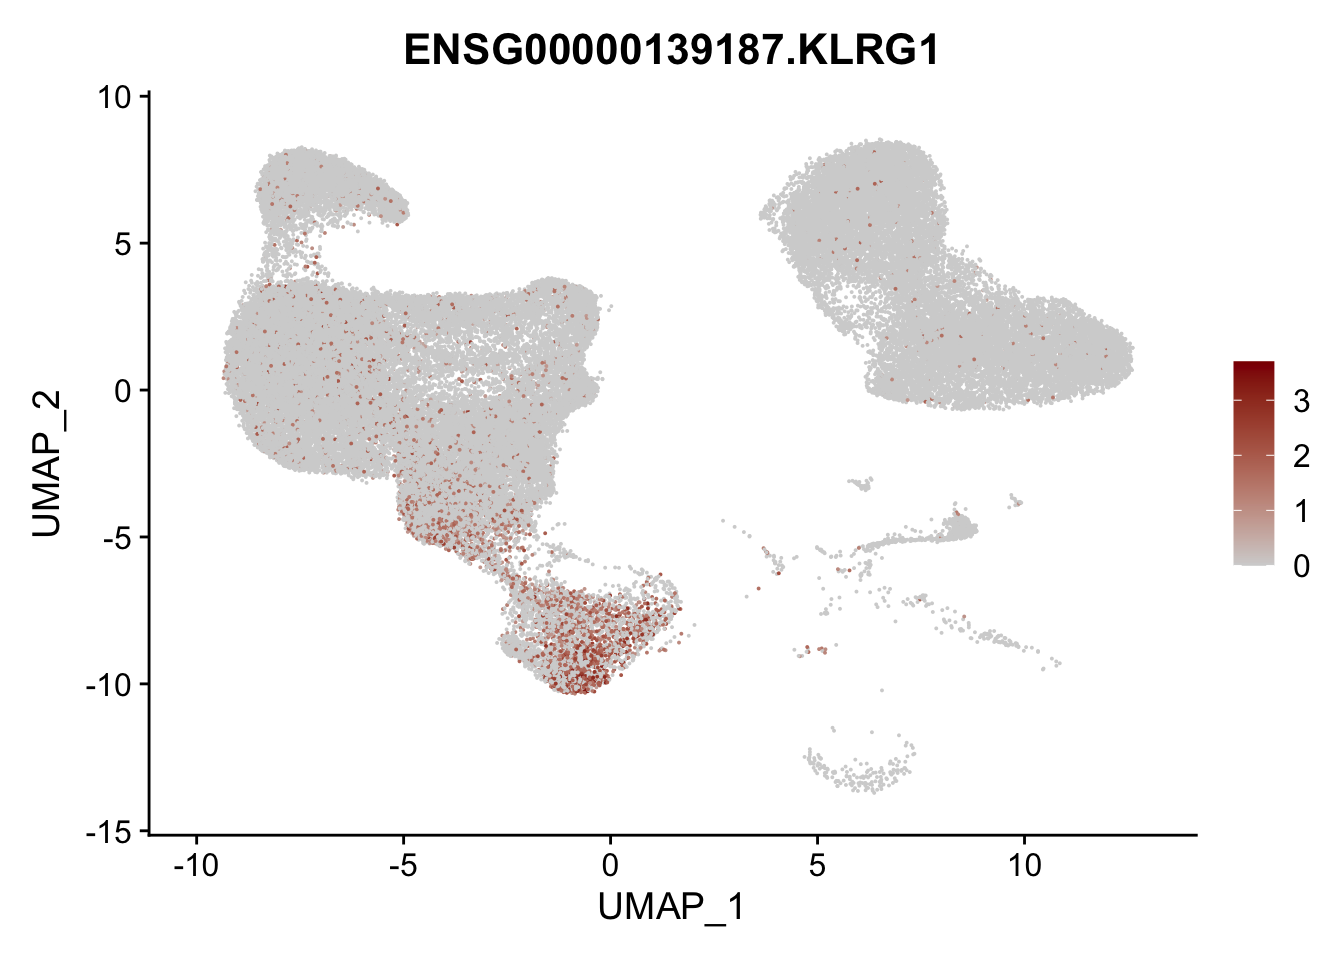
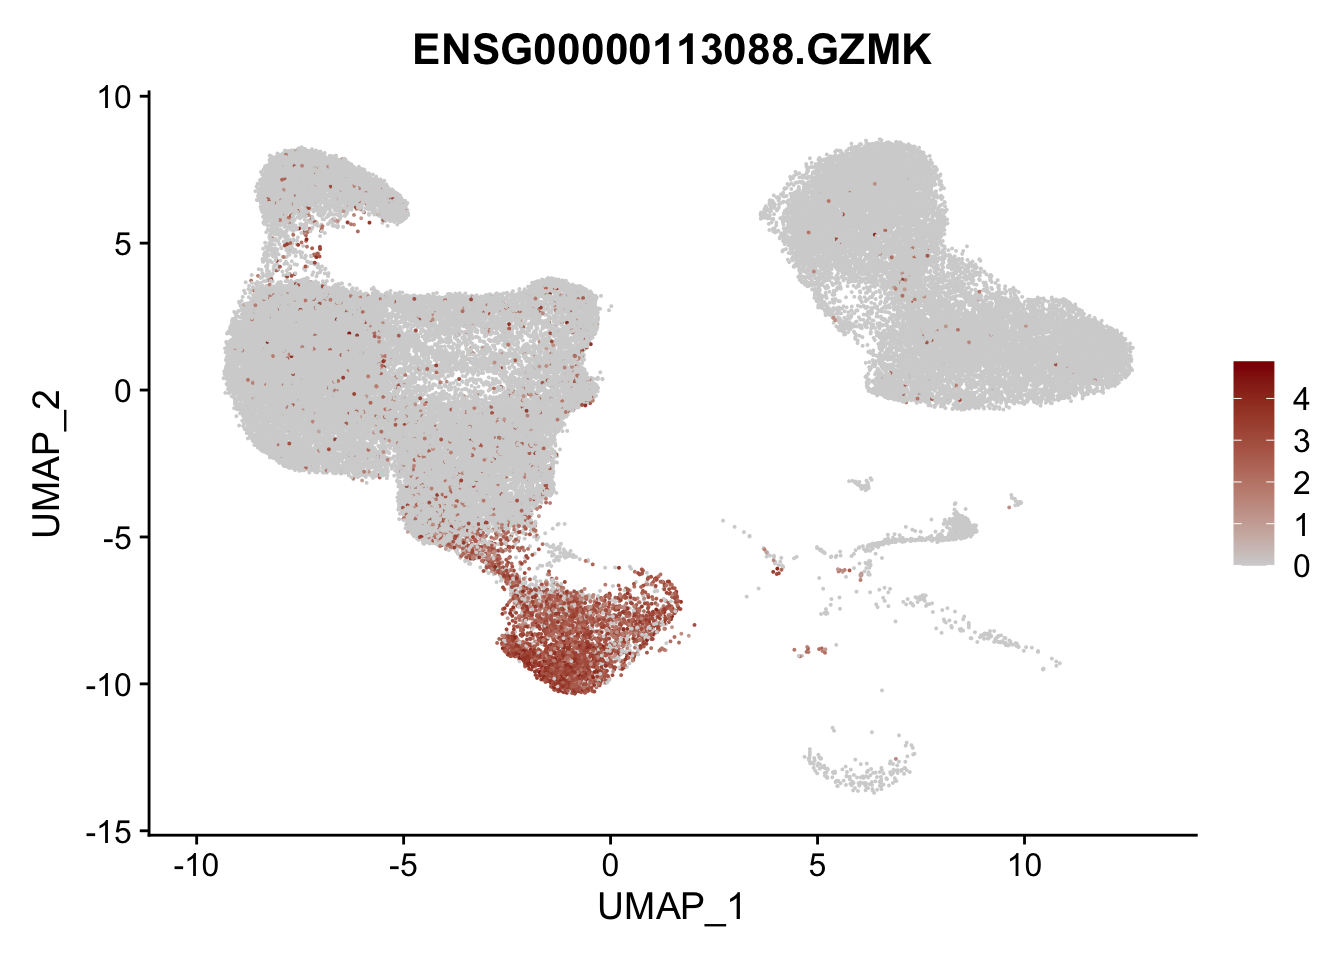
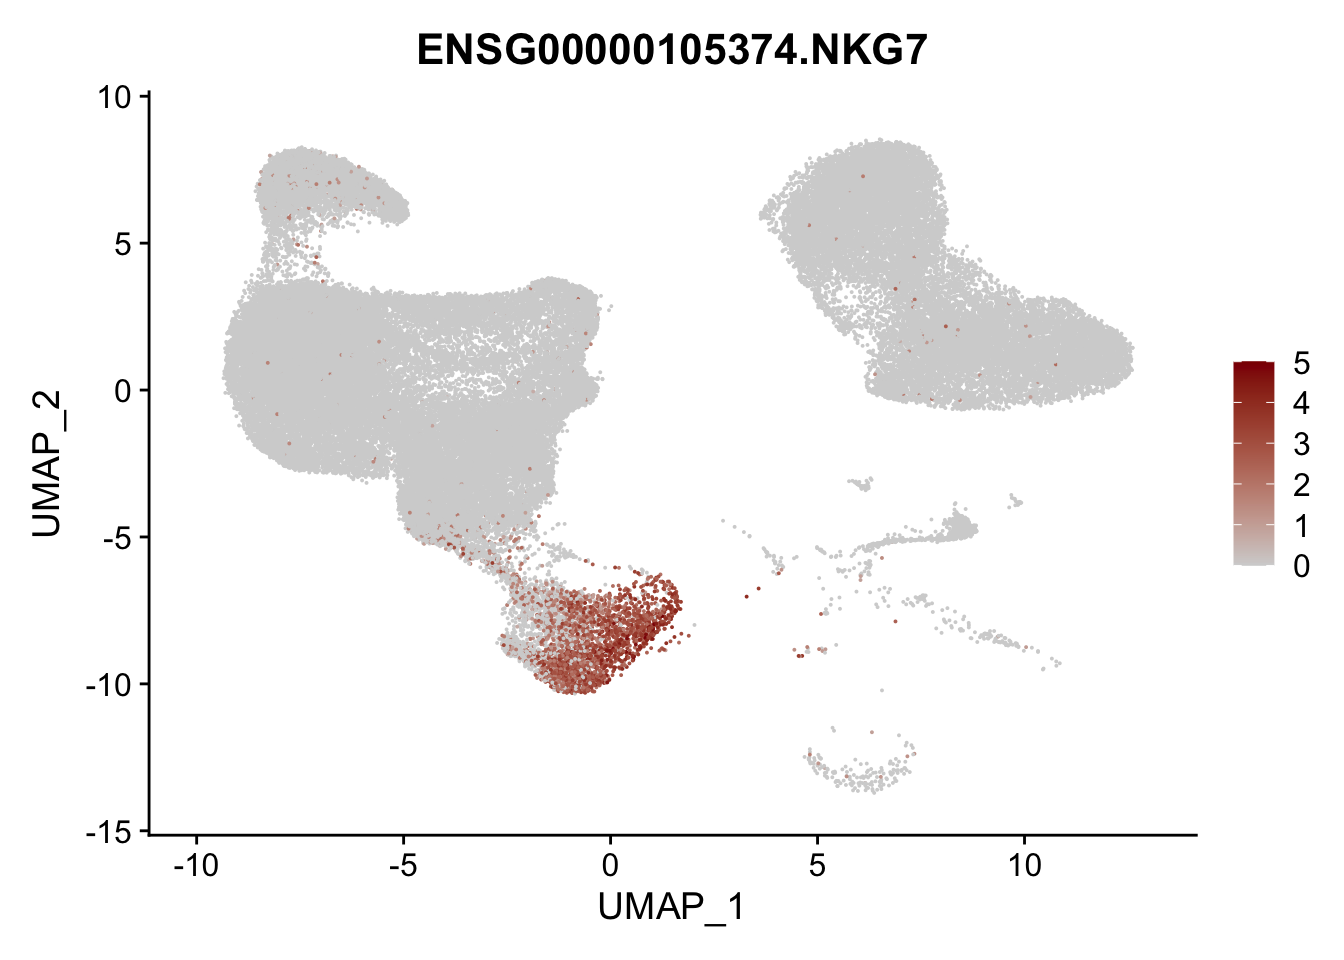
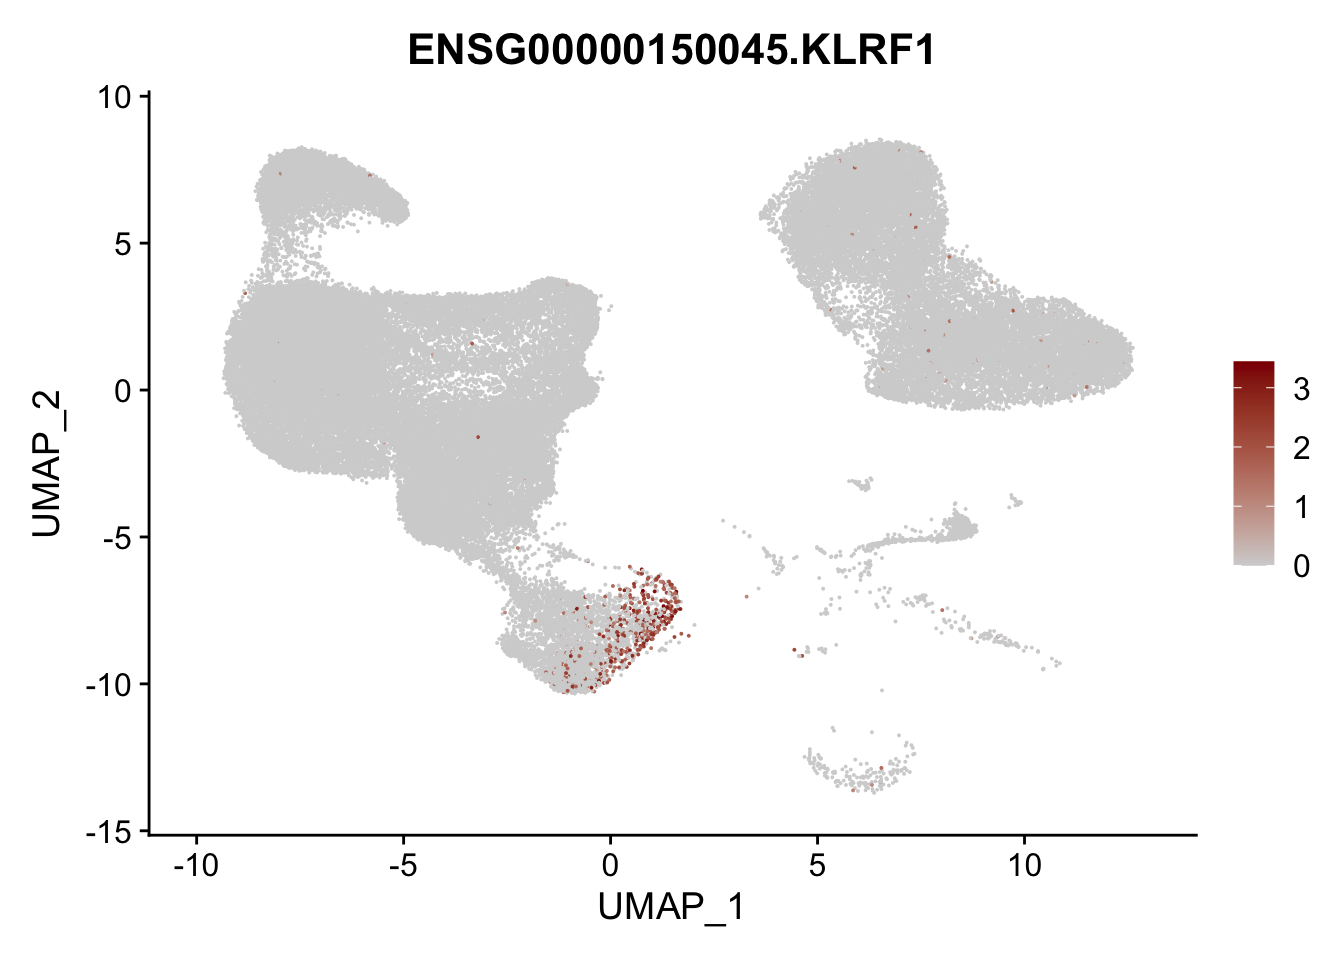
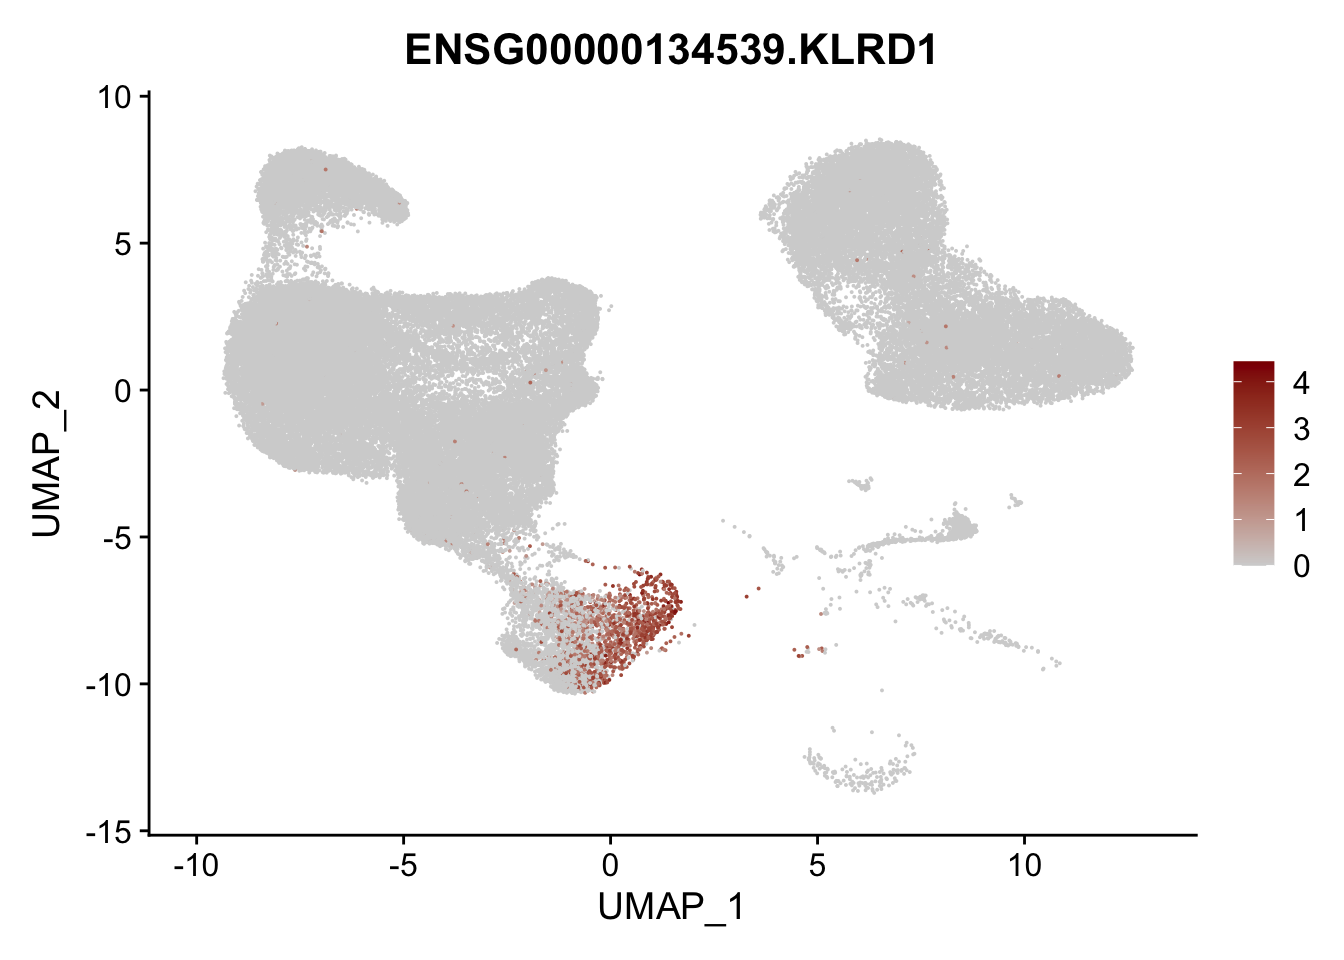
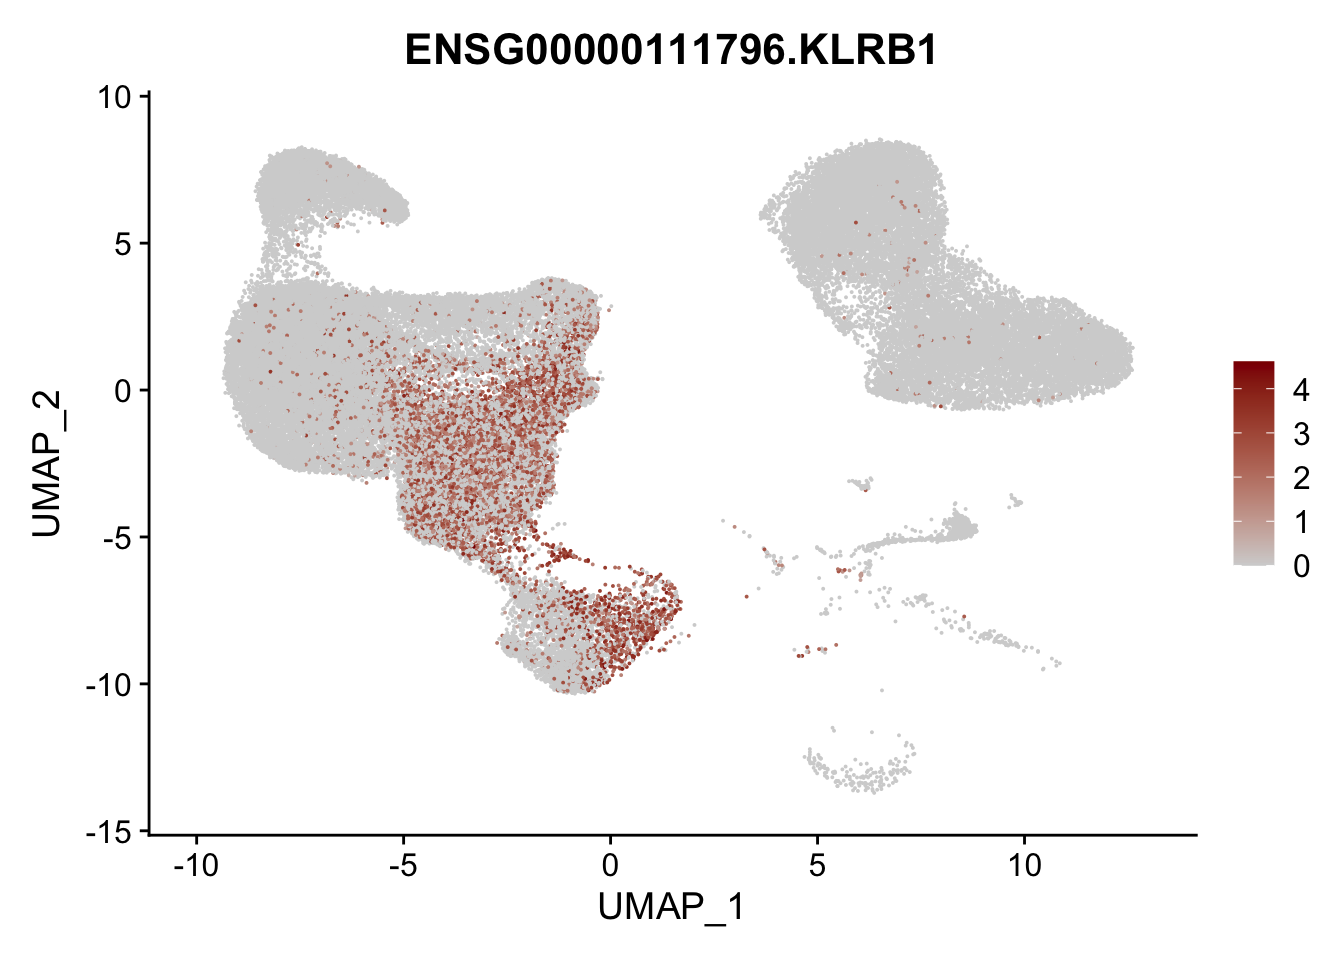
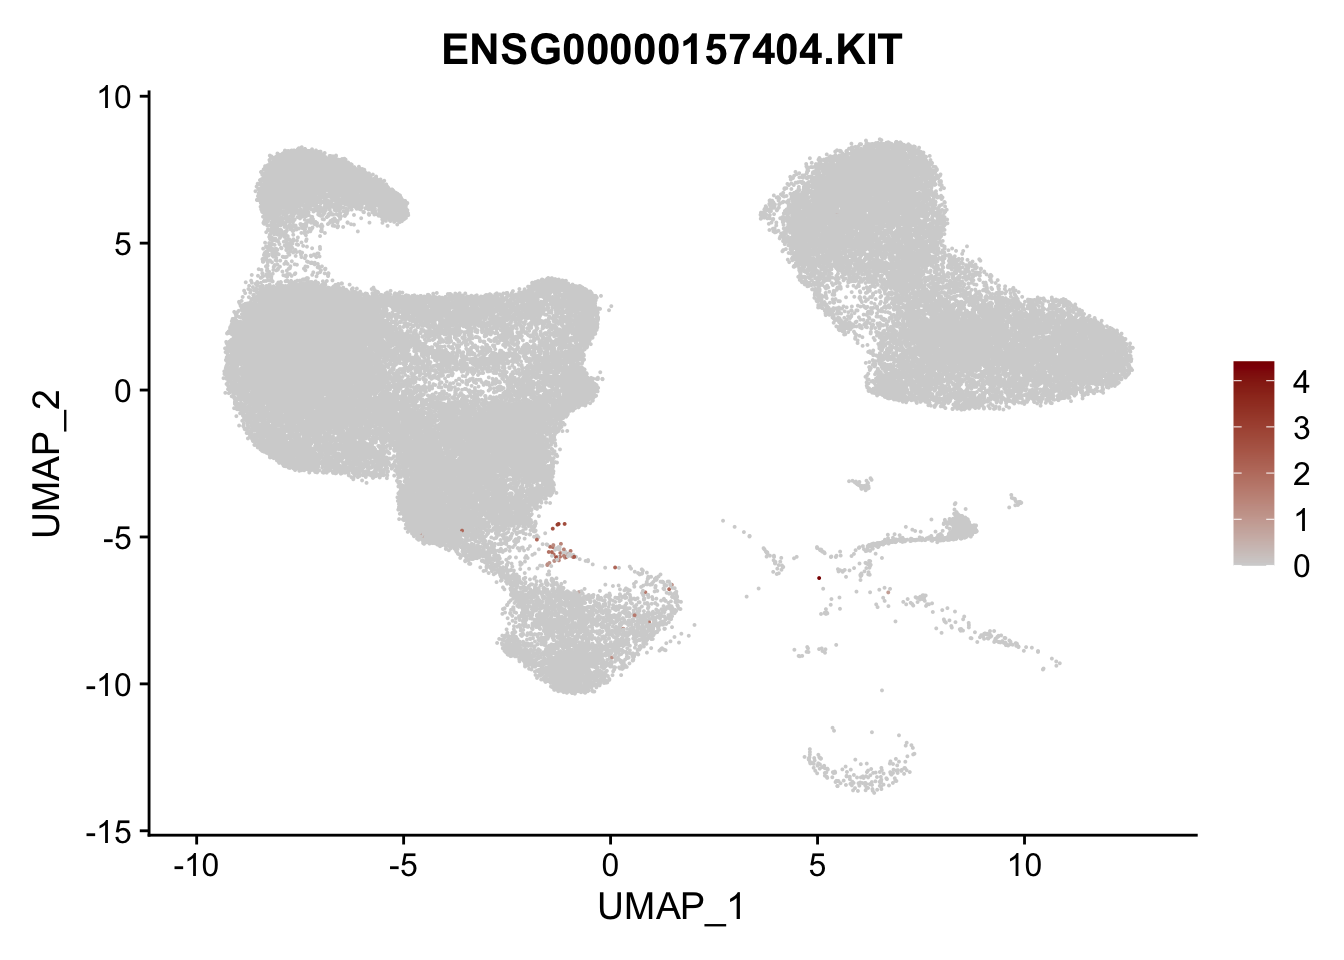
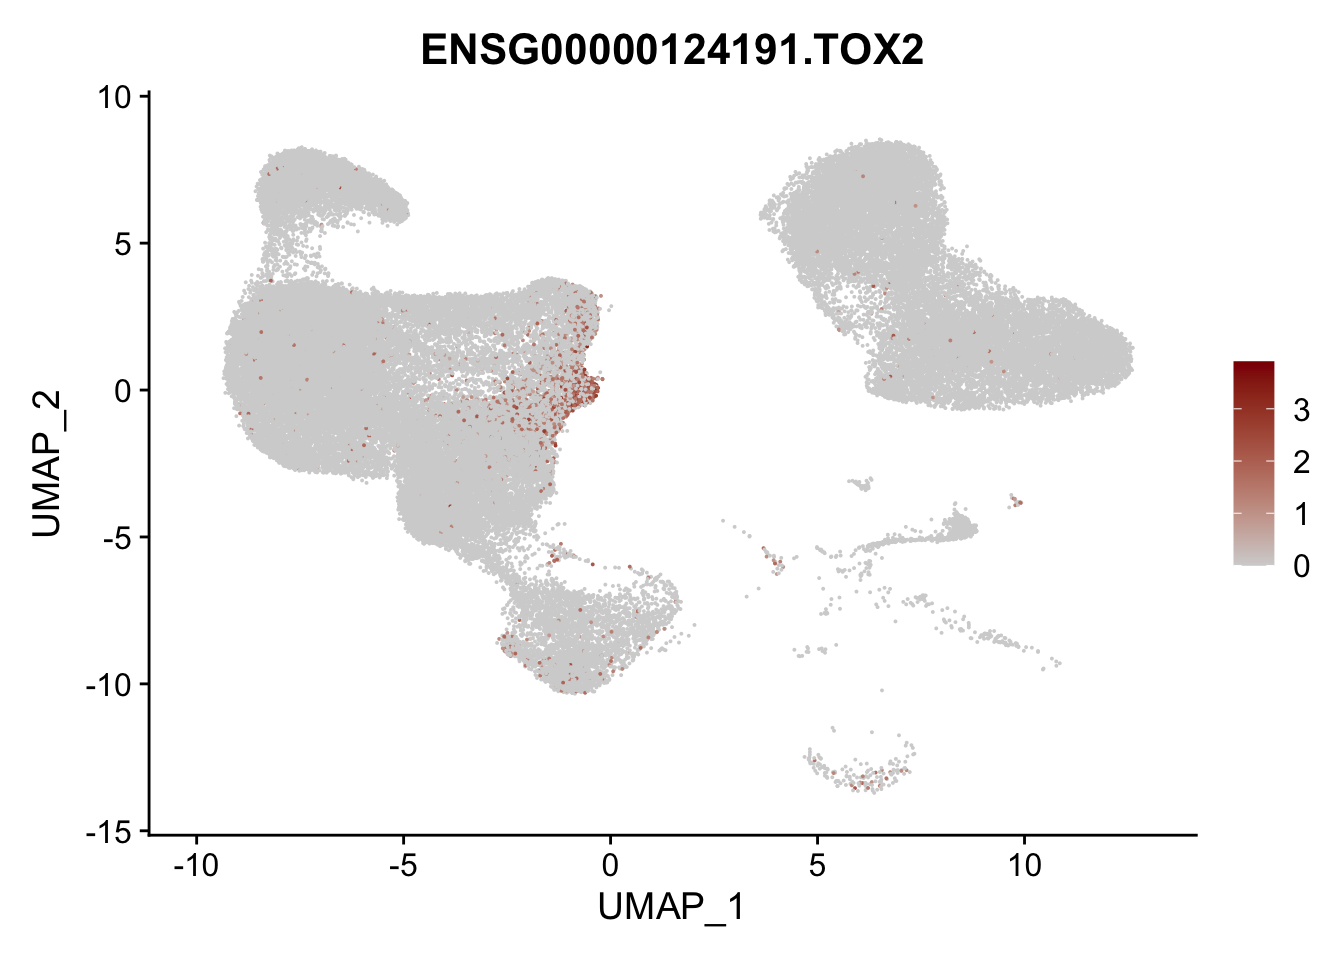
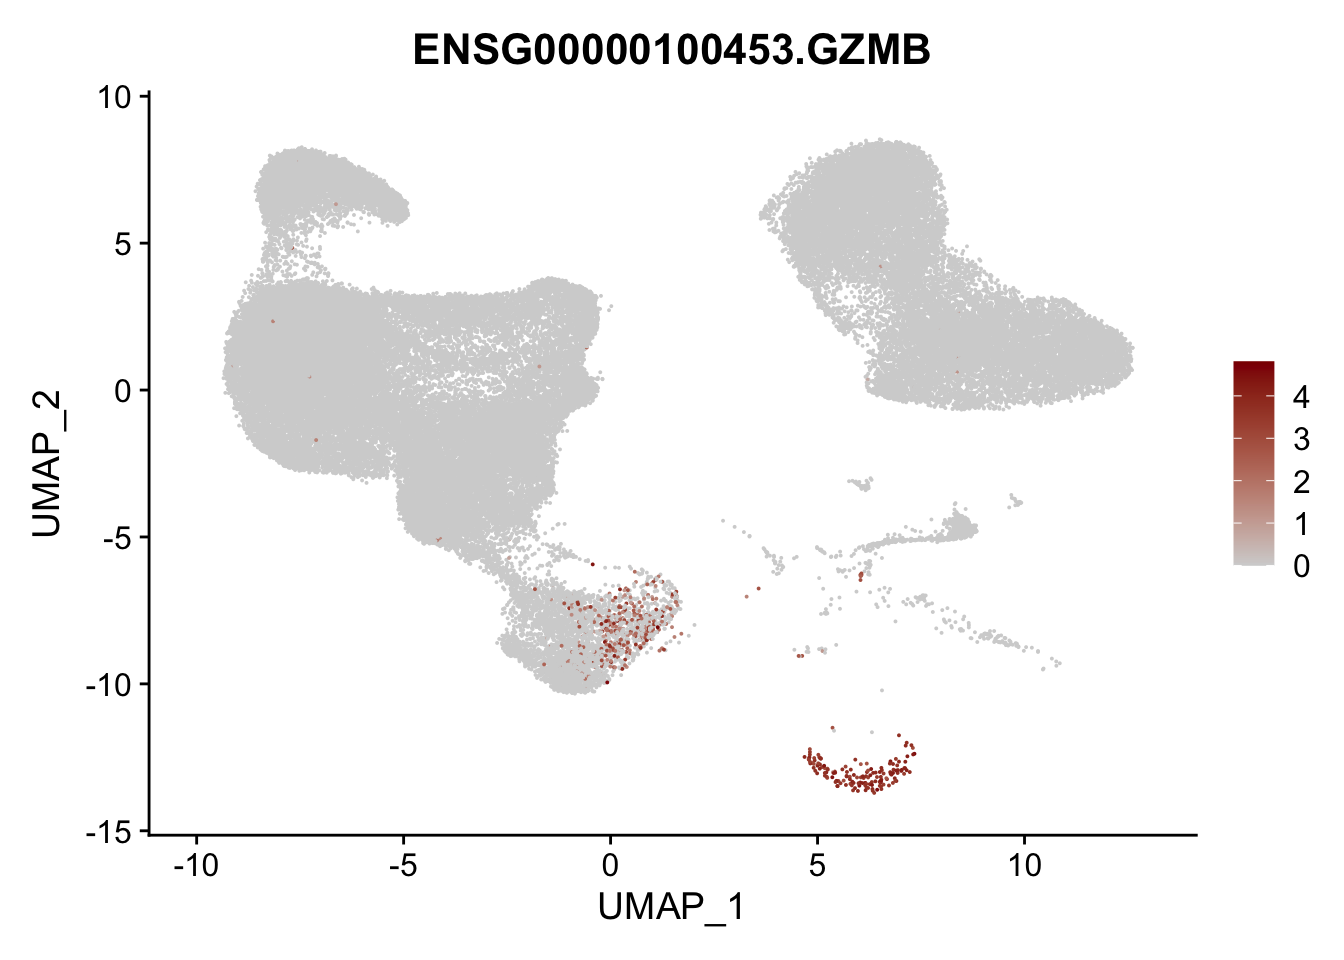
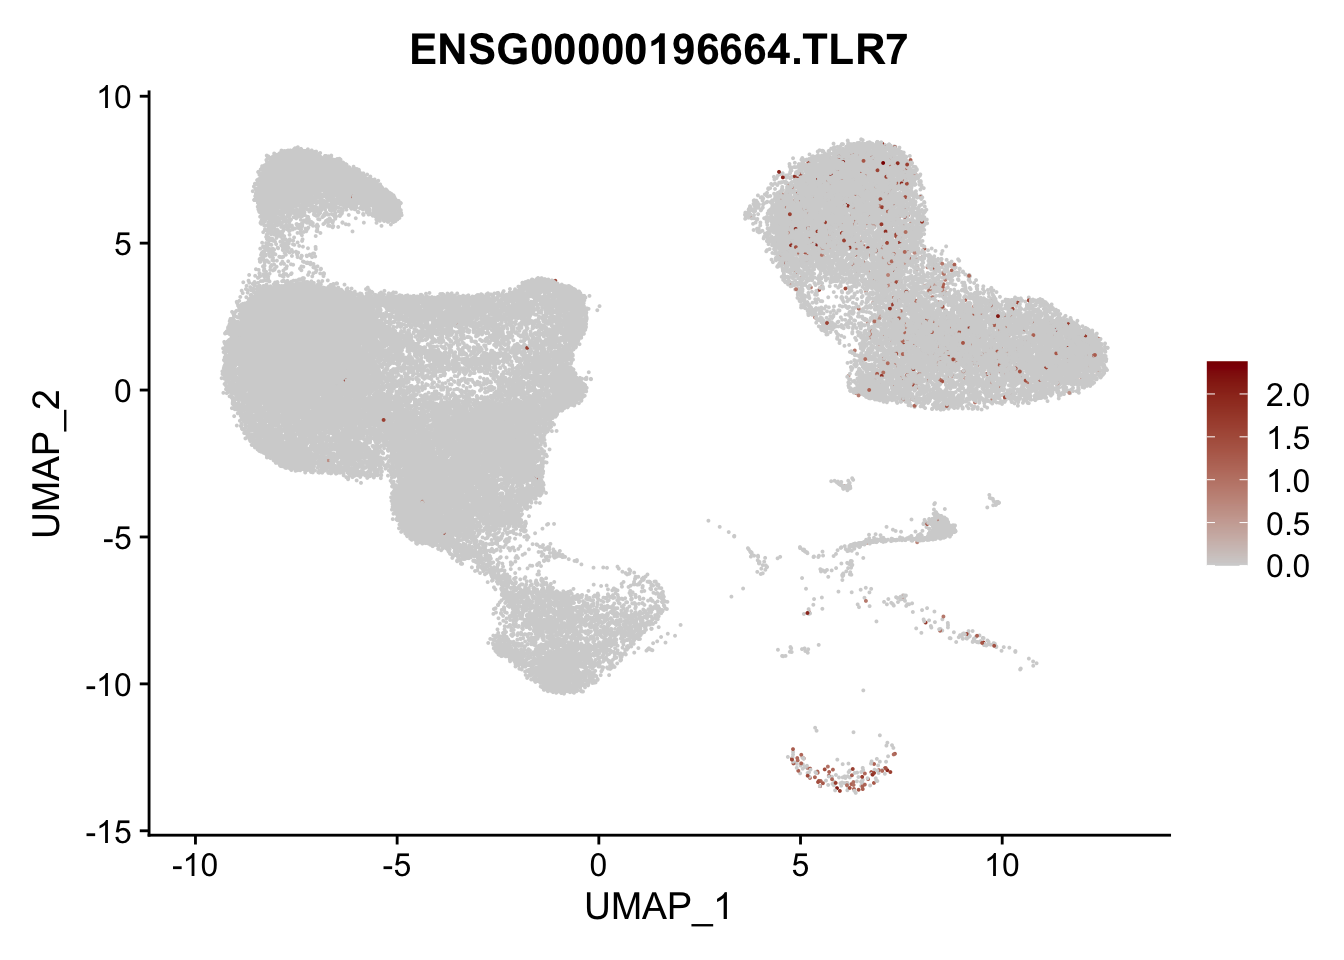
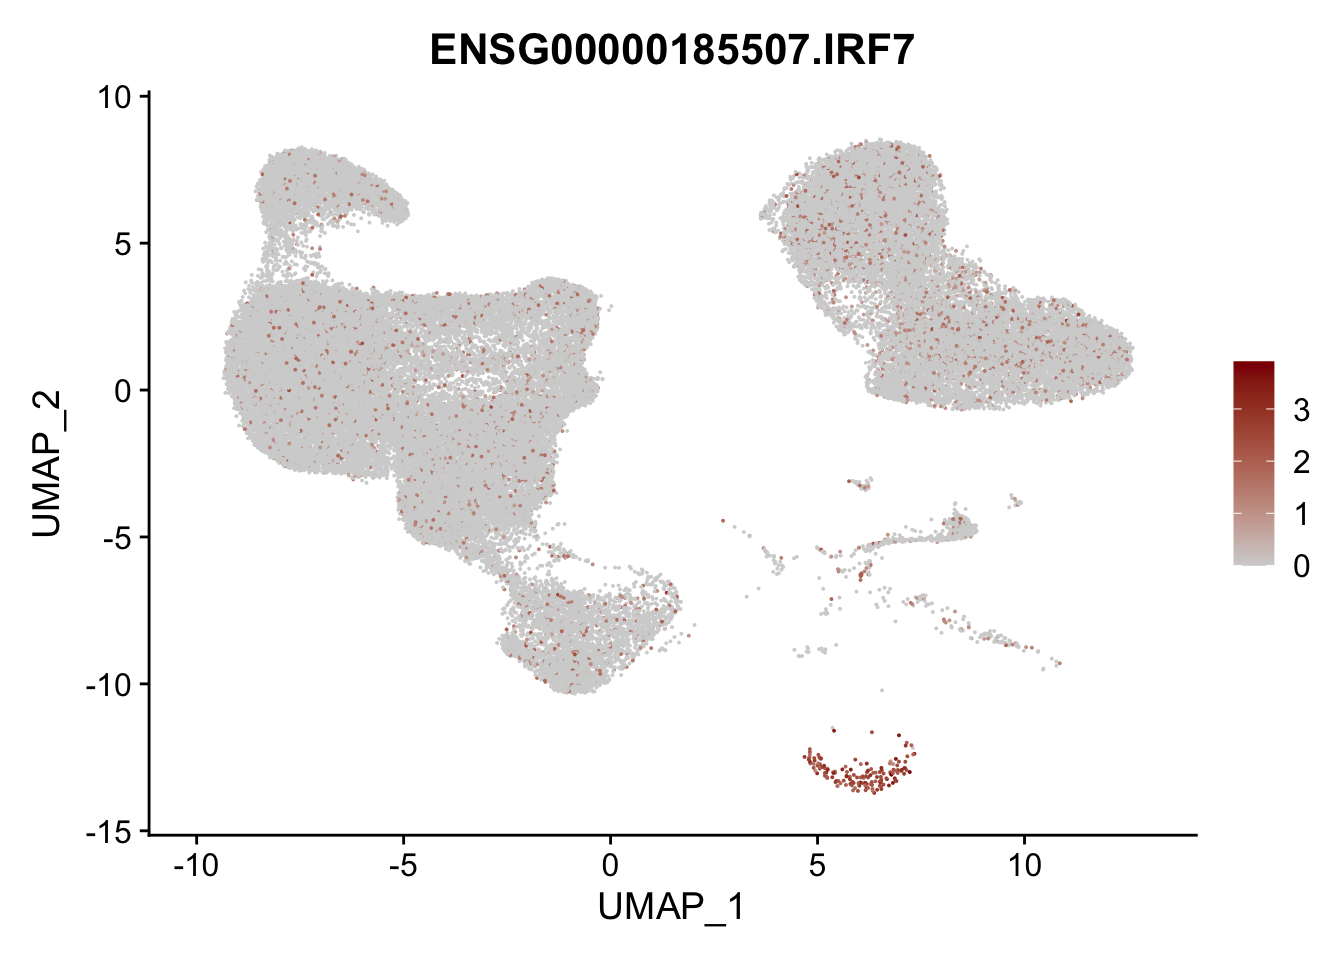
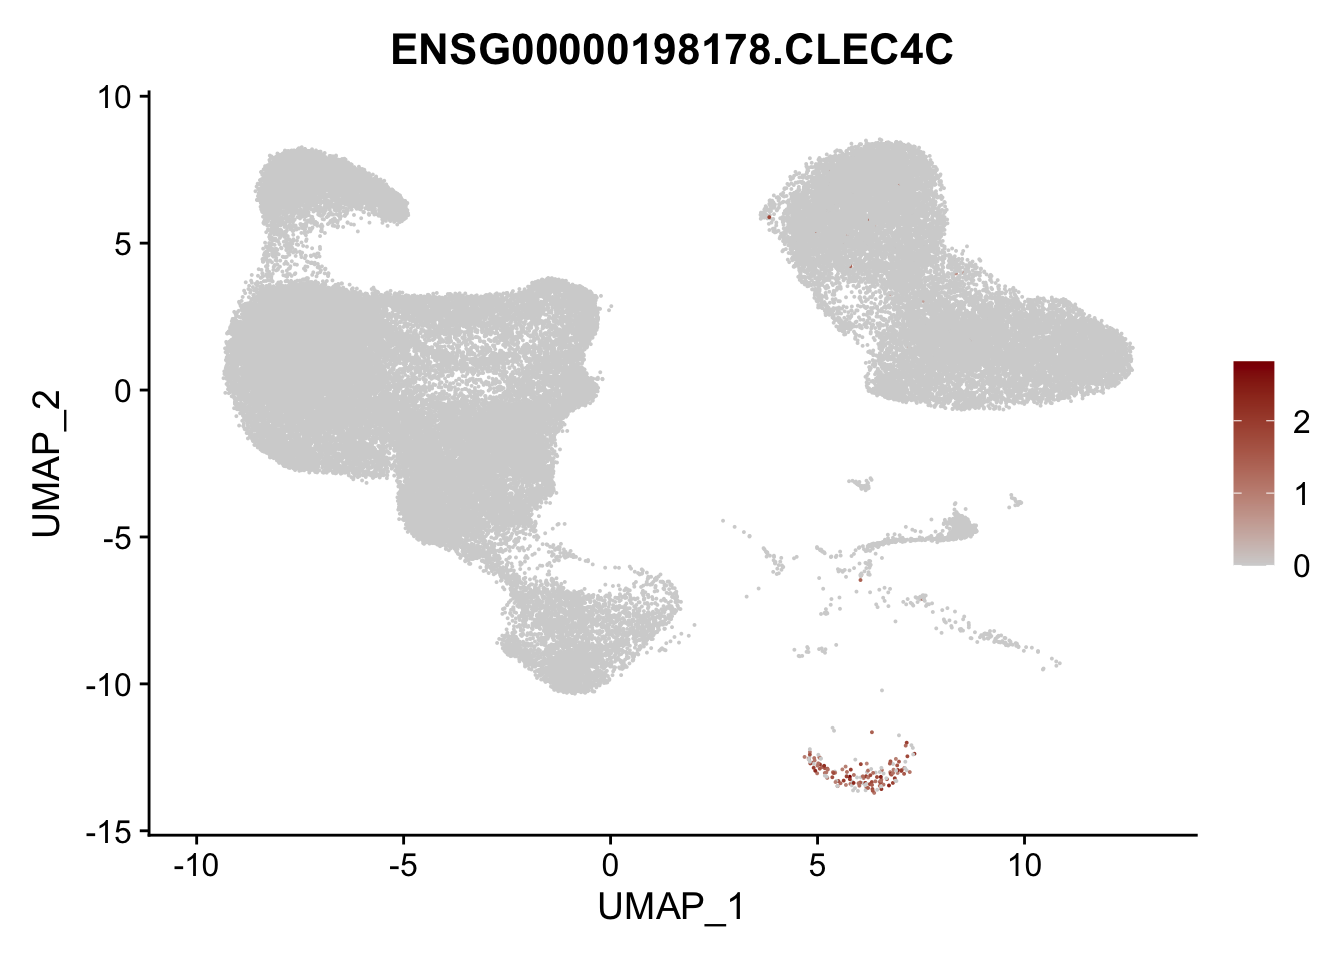
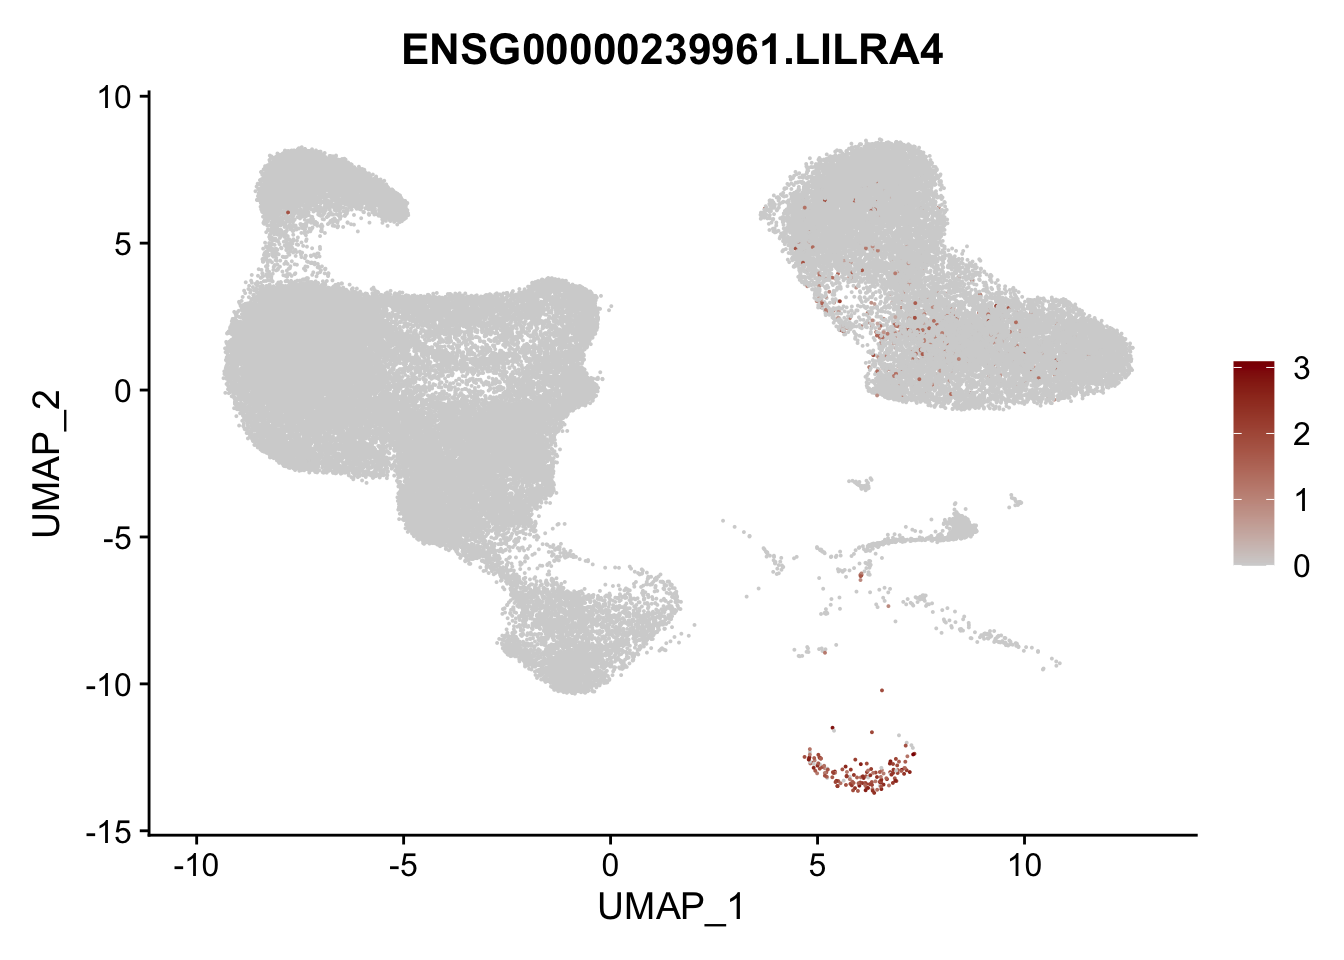
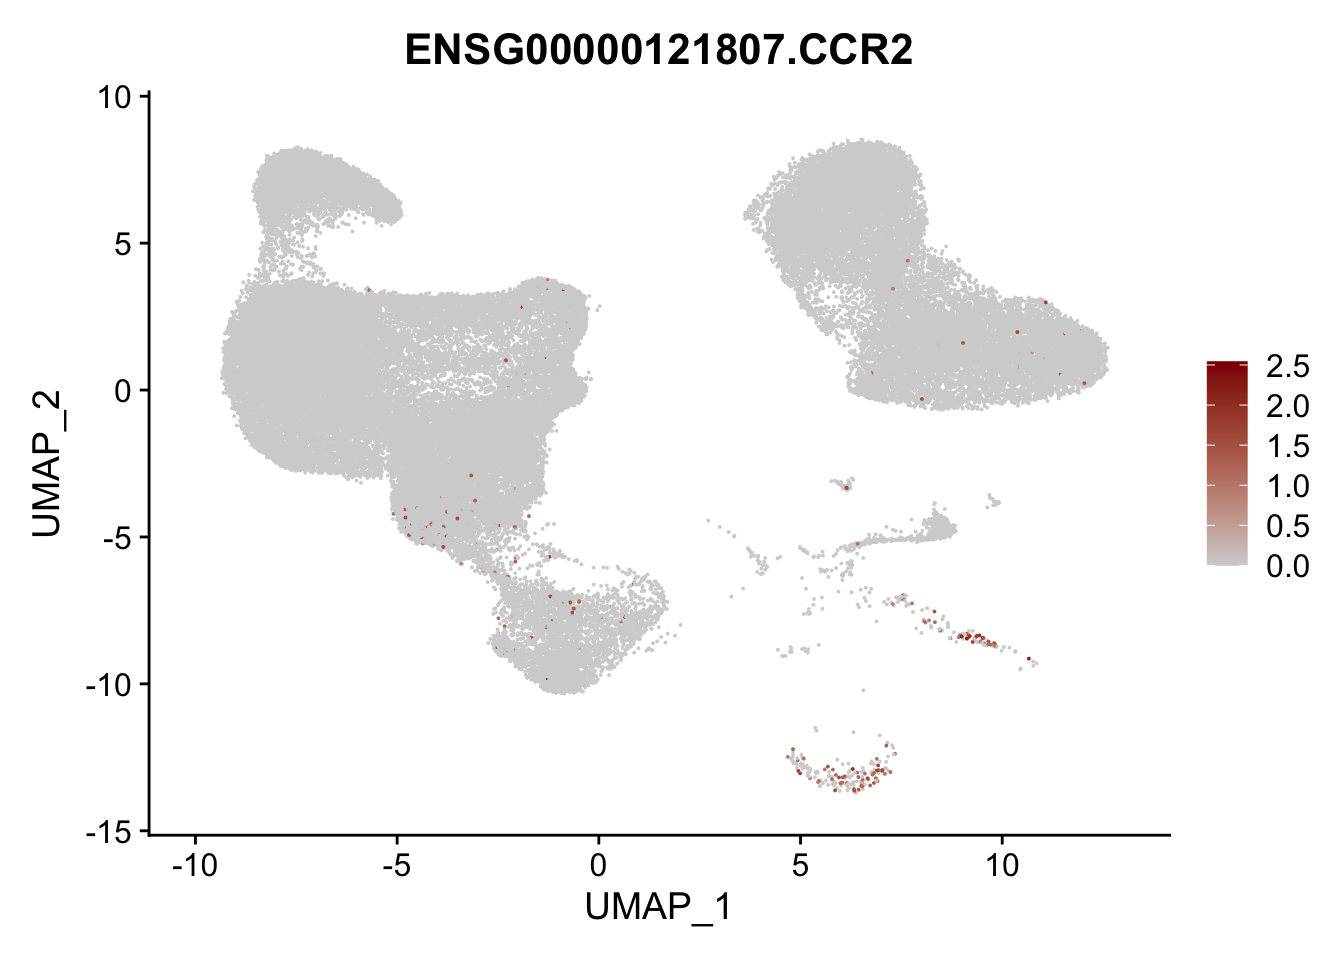
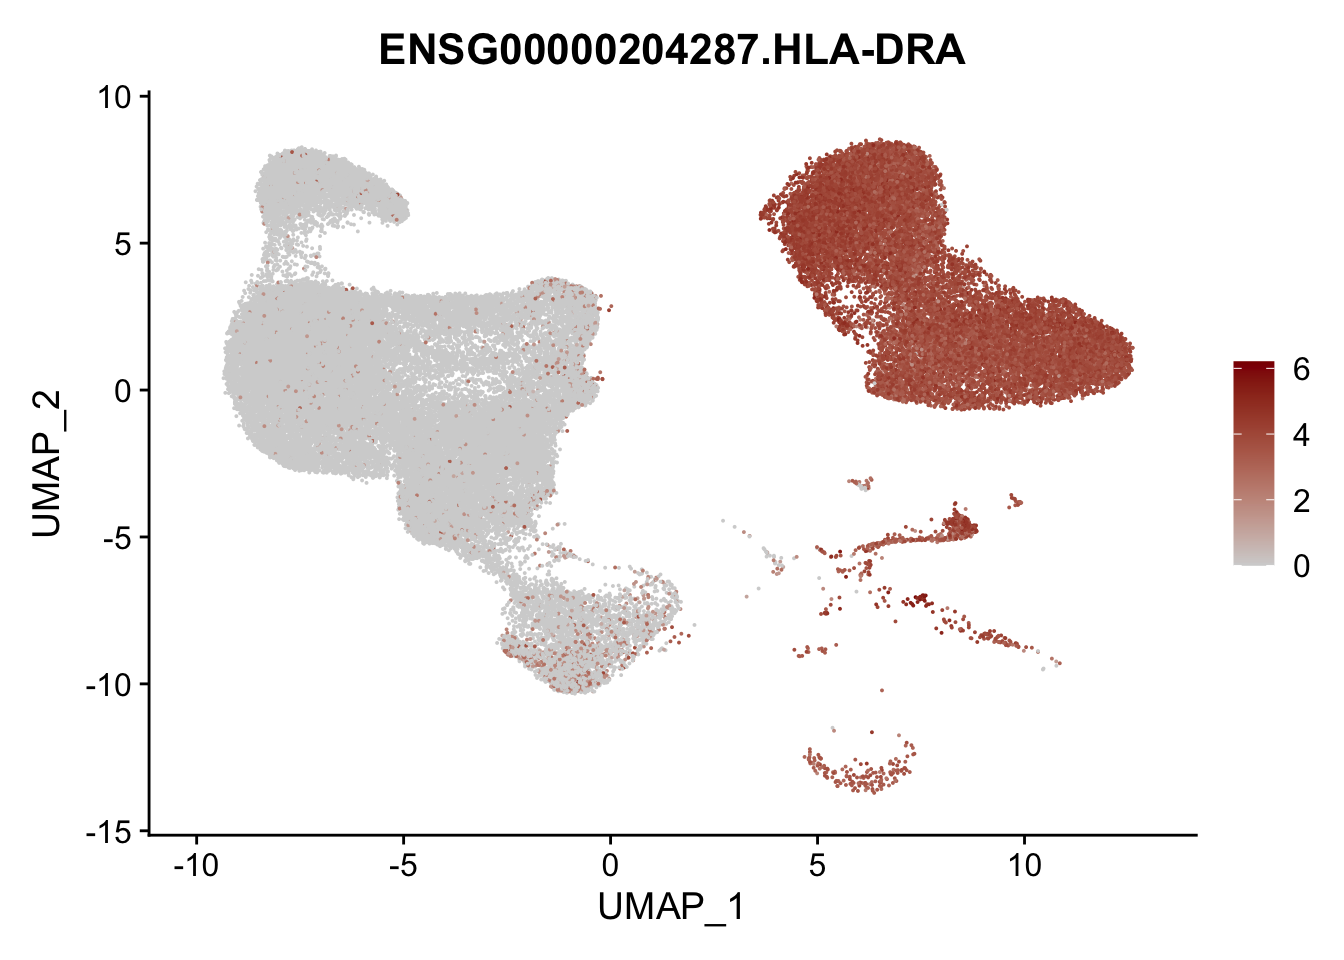
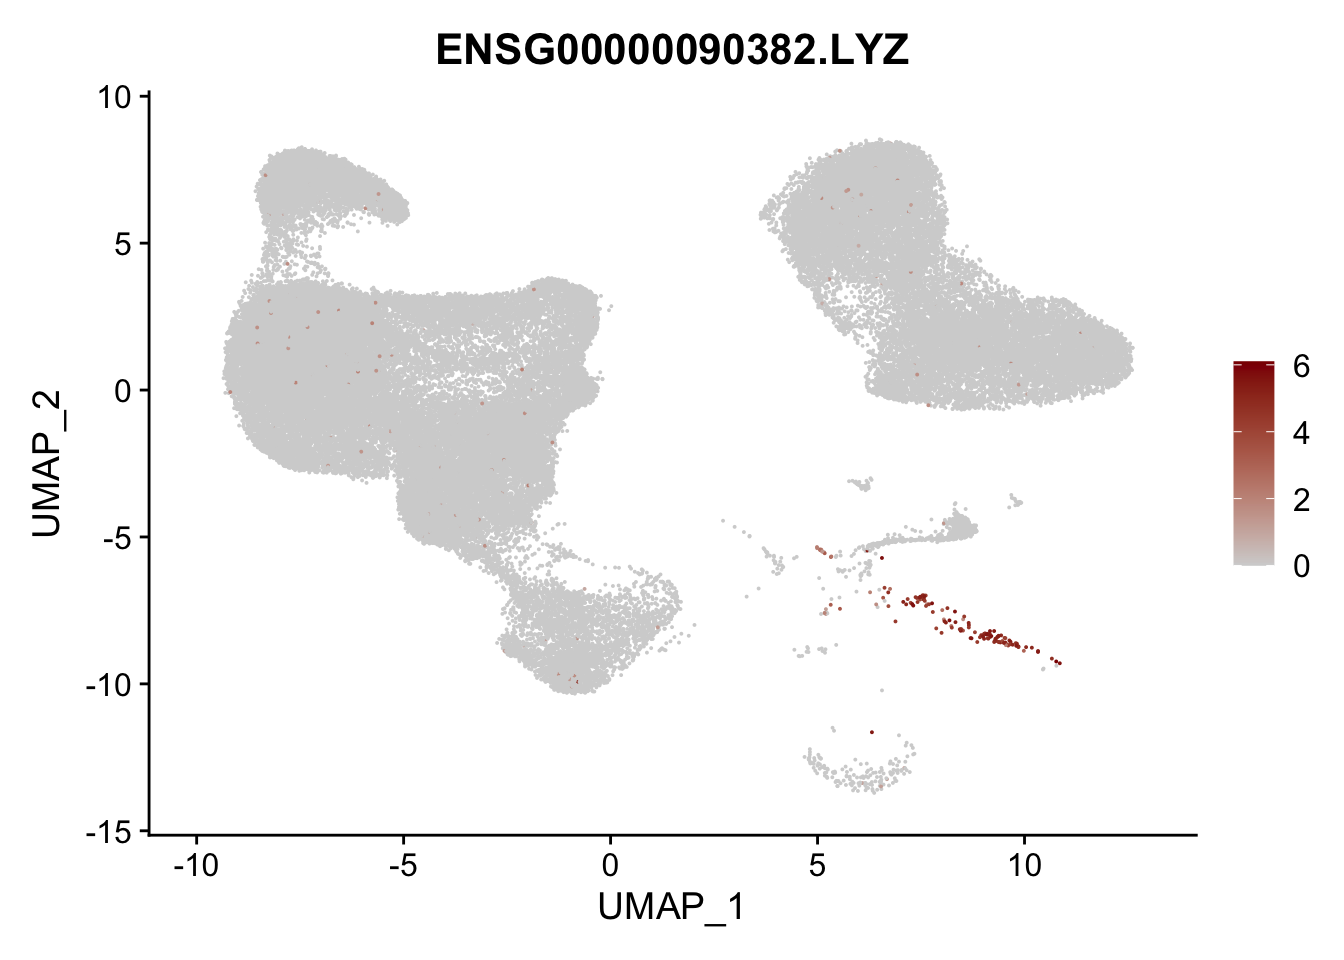
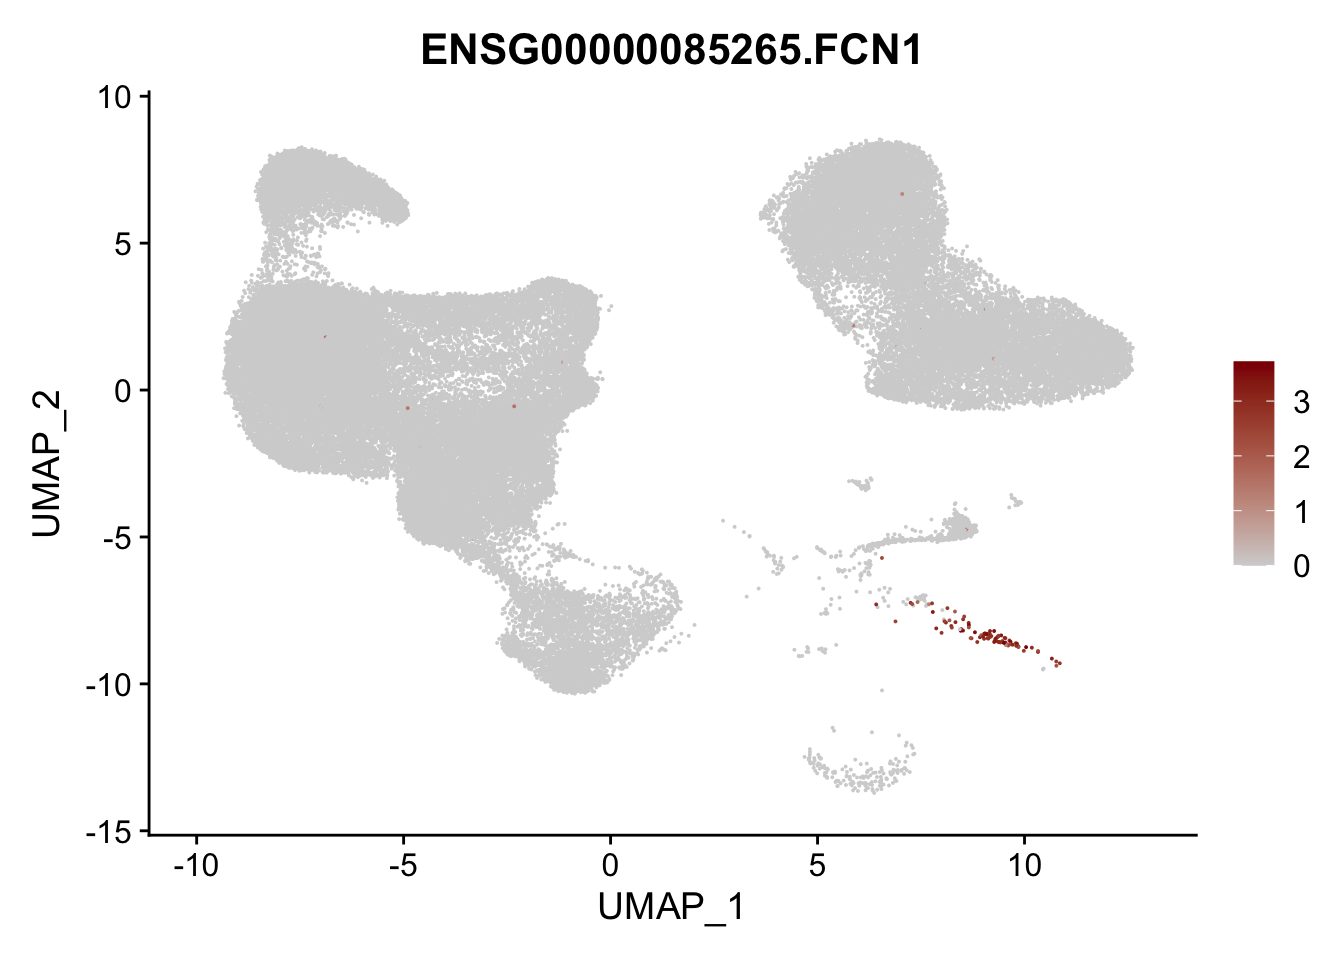
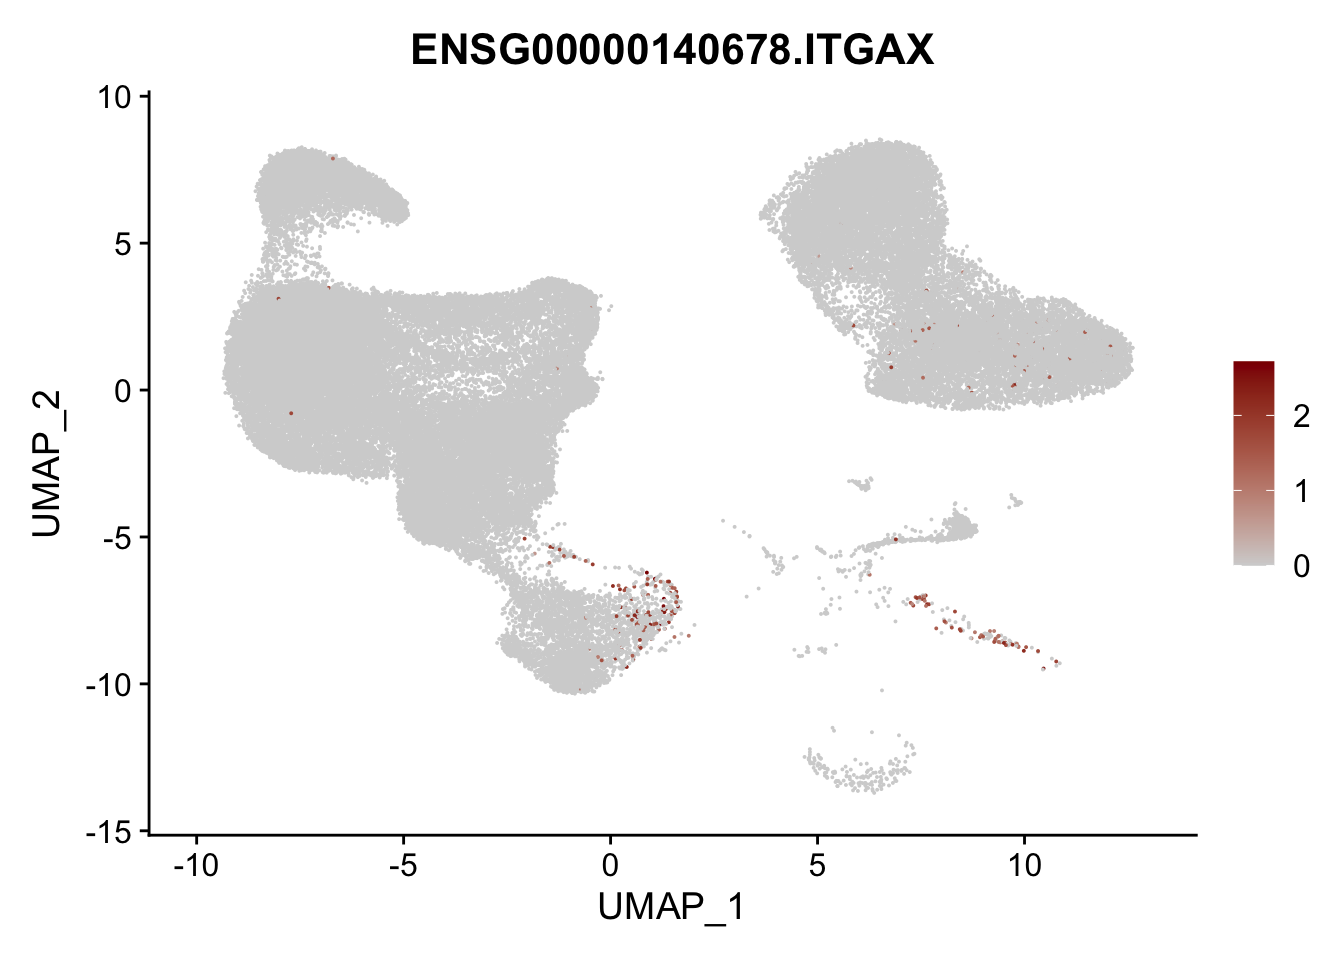
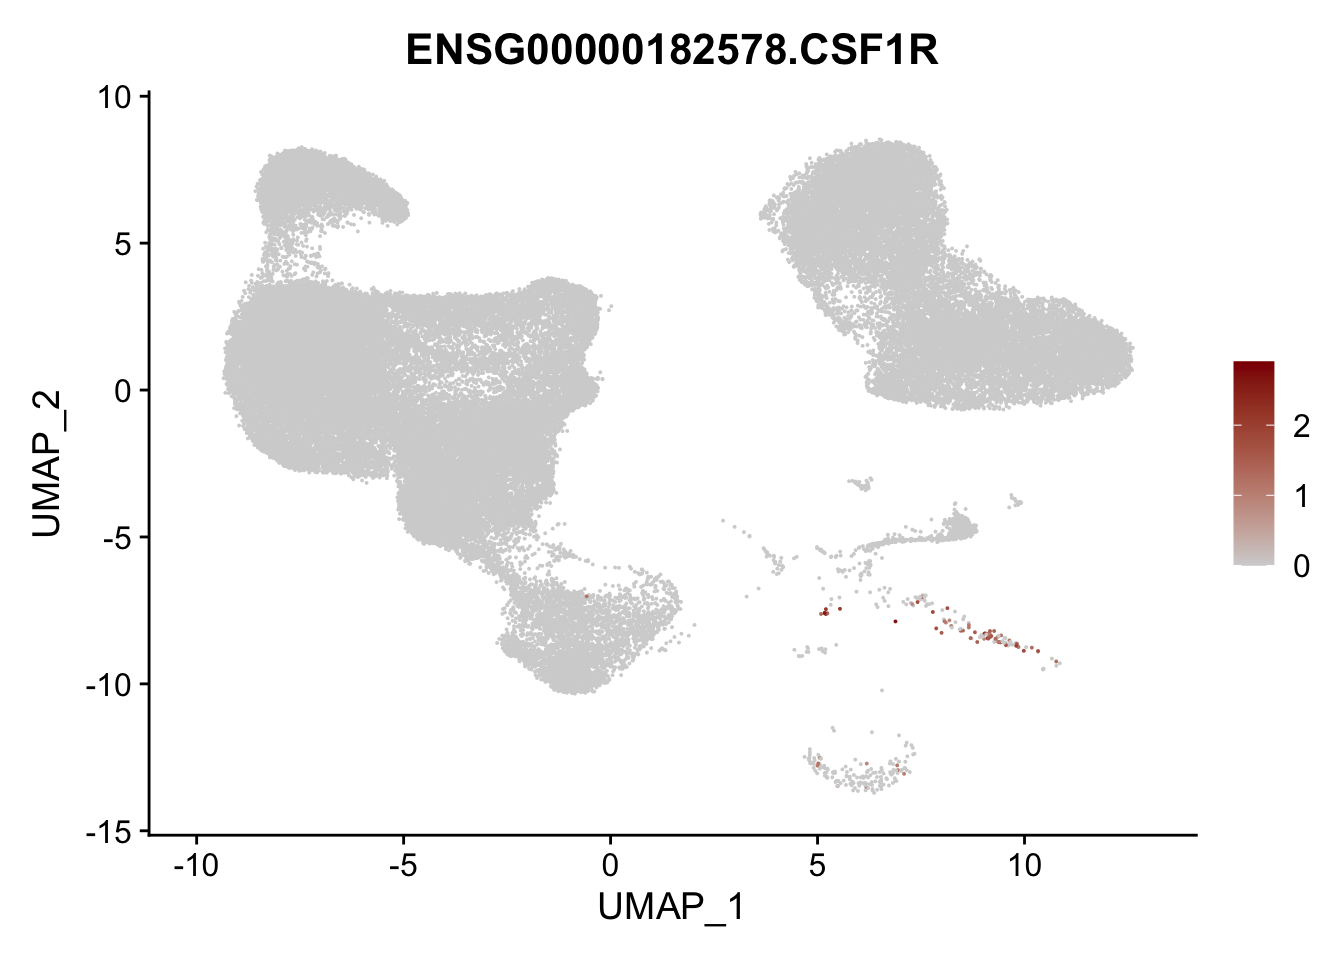
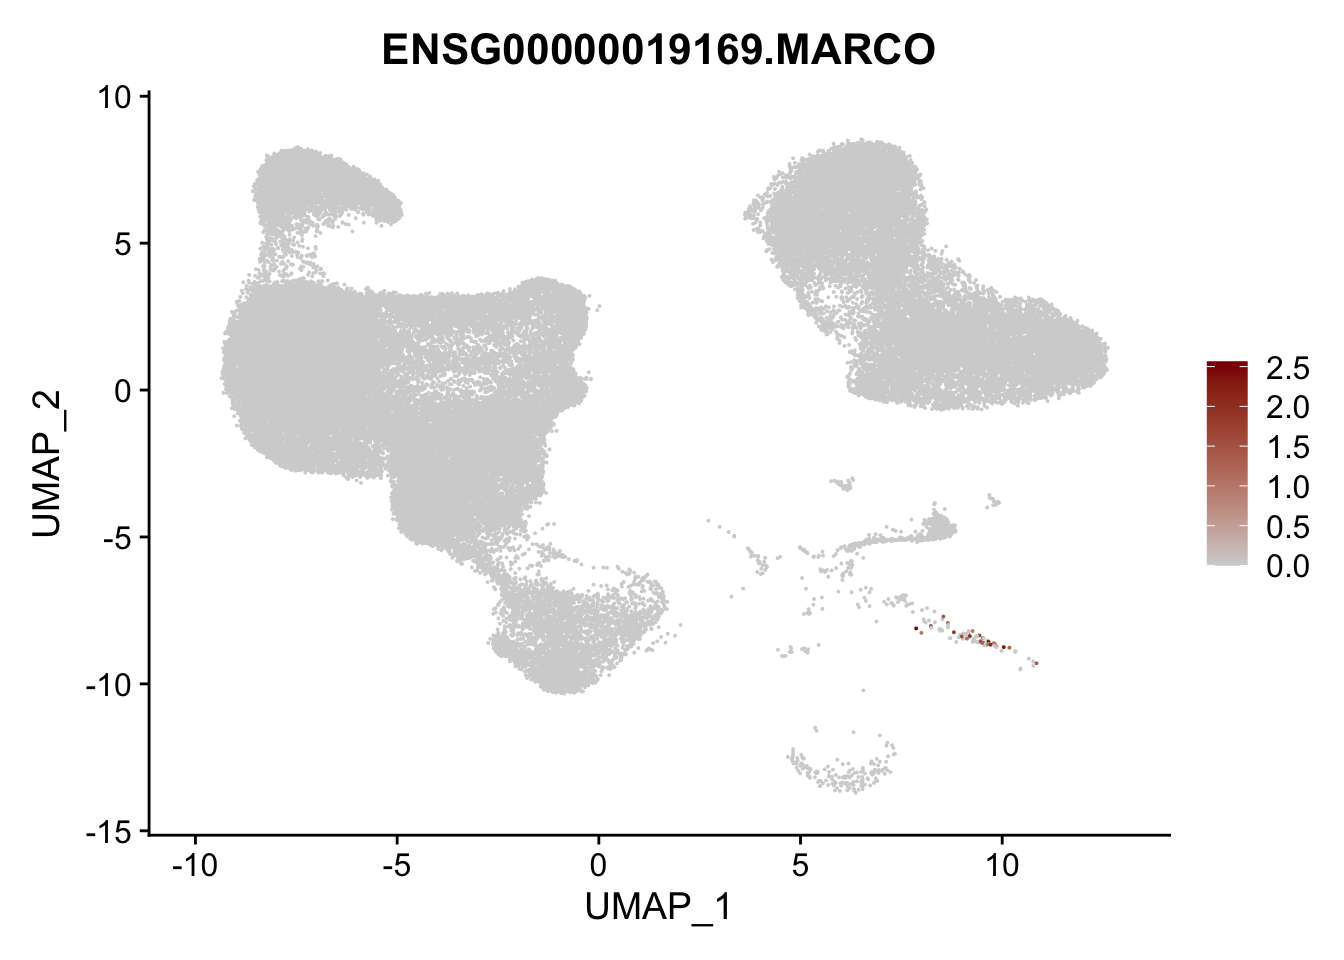
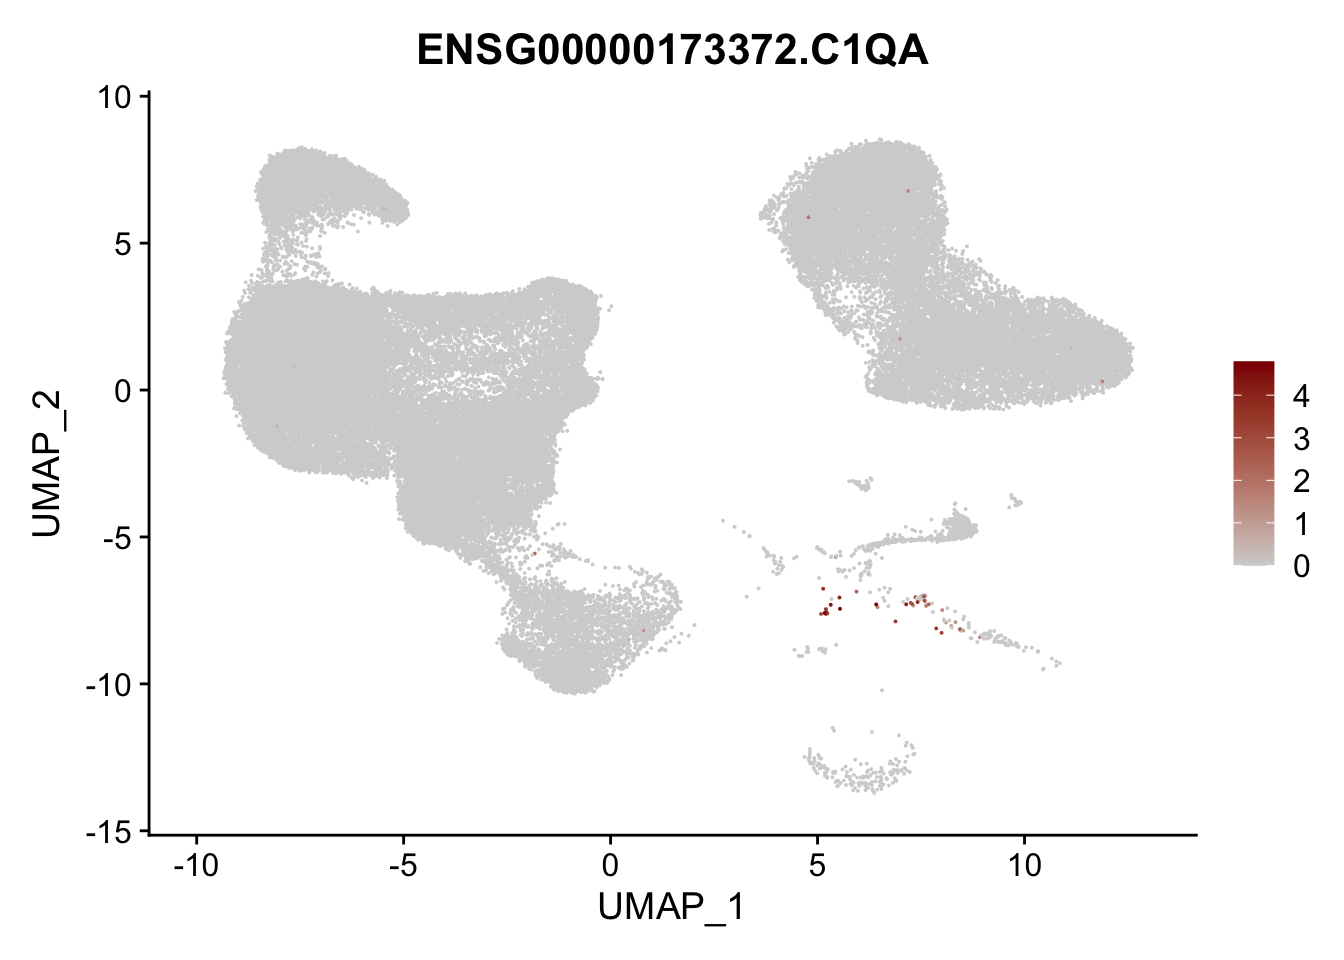
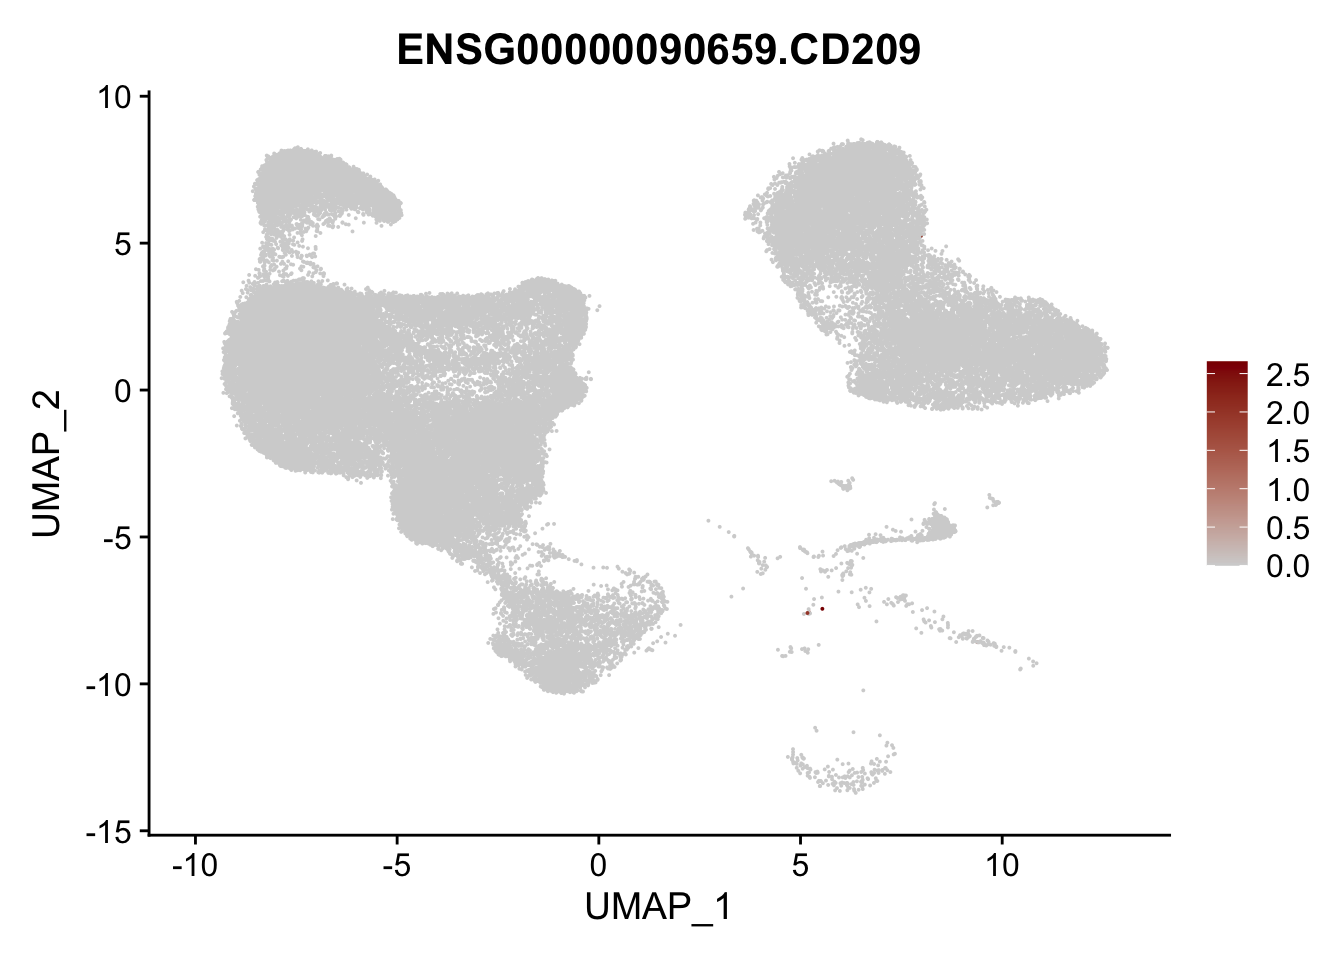
Featureplot
pList <- sapply(selGenesAll$gene, function(x){
p <- FeaturePlot(seurat, reduction = "umap",
            features = x,
            cols=c("lightgrey", "darkred"),
            order = F)+
  theme(legend.position="right")
  plot(p)
})


session info
sessionInfo()R version 4.3.0 (2023-04-21)
Platform: x86_64-apple-darwin20 (64-bit)
Running under: macOS Ventura 13.4.1
Matrix products: default
BLAS: /Library/Frameworks/R.framework/Versions/4.3-x86_64/Resources/lib/libRblas.0.dylib
LAPACK: /Library/Frameworks/R.framework/Versions/4.3-x86_64/Resources/lib/libRlapack.dylib; LAPACK version 3.11.0
locale:
[1] en_US.UTF-8/en_US.UTF-8/en_US.UTF-8/C/en_US.UTF-8/en_US.UTF-8
time zone: Europe/Berlin
tzcode source: internal
attached base packages:
[1] stats4 stats graphics grDevices utils datasets methods base
other attached packages:
[1] scater_1.28.0 scuttle_1.10.3 SingleCellExperiment_1.22.0
[4] SummarizedExperiment_1.30.2 Biobase_2.60.0 GenomicRanges_1.52.1
[7] GenomeInfoDb_1.36.4 IRanges_2.36.0 S4Vectors_0.40.1
[10] BiocGenerics_0.48.0 MatrixGenerics_1.12.3 matrixStats_1.2.0
[13] pheatmap_1.0.12 ggsci_3.0.1 here_1.0.1
[16] runSeurat3_0.1.0 ggpubr_0.6.0 lubridate_1.9.3
[19] forcats_1.0.0 stringr_1.5.1 readr_2.1.5
[22] tidyr_1.3.1 tibble_3.2.1 tidyverse_2.0.0
[25] Seurat_5.0.2 SeuratObject_5.0.1 sp_2.1-3
[28] purrr_1.0.2 cowplot_1.1.3 ggplot2_3.5.0
[31] reshape2_1.4.4 dplyr_1.1.4
loaded via a namespace (and not attached):
[1] RcppAnnoy_0.0.22 splines_4.3.0 later_1.3.2
[4] bitops_1.0-7 polyclip_1.10-6 fastDummies_1.7.3
[7] lifecycle_1.0.4 rstatix_0.7.2 rprojroot_2.0.4
[10] vroom_1.6.5 globals_0.16.2 lattice_0.22-5
[13] MASS_7.3-60.0.1 backports_1.4.1 magrittr_2.0.3
[16] plotly_4.10.4 rmarkdown_2.26 yaml_2.3.8
[19] httpuv_1.6.14 sctransform_0.4.1 spam_2.10-0
[22] spatstat.sparse_3.0-3 reticulate_1.35.0 pbapply_1.7-2
[25] RColorBrewer_1.1-3 abind_1.4-5 zlibbioc_1.46.0
[28] Rtsne_0.17 RCurl_1.98-1.14 GenomeInfoDbData_1.2.10
[31] ggrepel_0.9.5 irlba_2.3.5.1 listenv_0.9.1
[34] spatstat.utils_3.0-4 goftest_1.2-3 RSpectra_0.16-1
[37] spatstat.random_3.2-3 fitdistrplus_1.1-11 parallelly_1.37.1
[40] DelayedMatrixStats_1.22.6 leiden_0.4.3.1 codetools_0.2-19
[43] DelayedArray_0.26.7 tidyselect_1.2.0 farver_2.1.1
[46] viridis_0.6.5 ScaledMatrix_1.8.1 spatstat.explore_3.2-6
[49] jsonlite_1.8.8 BiocNeighbors_1.18.0 ellipsis_0.3.2
[52] progressr_0.14.0 ggridges_0.5.6 survival_3.5-8
[55] tools_4.3.0 ica_1.0-3 Rcpp_1.0.12
[58] glue_1.7.0 gridExtra_2.3 xfun_0.42
[61] withr_3.0.0 fastmap_1.1.1 fansi_1.0.6
[64] rsvd_1.0.5 digest_0.6.34 timechange_0.3.0
[67] R6_2.5.1 mime_0.12 colorspace_2.1-0
[70] scattermore_1.2 tensor_1.5 spatstat.data_3.0-4
[73] utf8_1.2.4 generics_0.1.3 data.table_1.15.2
[76] httr_1.4.7 htmlwidgets_1.6.4 S4Arrays_1.0.6
[79] uwot_0.1.16 pkgconfig_2.0.3 gtable_0.3.4
[82] lmtest_0.9-40 XVector_0.40.0 htmltools_0.5.7
[85] carData_3.0-5 dotCall64_1.1-1 scales_1.3.0
[88] png_0.1-8 knitr_1.45 rstudioapi_0.15.0
[91] tzdb_0.4.0 nlme_3.1-164 zoo_1.8-12
[94] KernSmooth_2.23-22 vipor_0.4.7 parallel_4.3.0
[97] miniUI_0.1.1.1 pillar_1.9.0 grid_4.3.0
[100] vctrs_0.6.5 RANN_2.6.1 promises_1.2.1
[103] BiocSingular_1.16.0 car_3.1-2 beachmat_2.16.0
[106] xtable_1.8-4 cluster_2.1.6 beeswarm_0.4.0
[109] evaluate_0.23 cli_3.6.2 compiler_4.3.0
[112] rlang_1.1.3 crayon_1.5.2 future.apply_1.11.1
[115] ggsignif_0.6.4 labeling_0.4.3 ggbeeswarm_0.7.2
[118] plyr_1.8.9 stringi_1.8.3 BiocParallel_1.34.2
[121] viridisLite_0.4.2 deldir_2.0-4 munsell_0.5.0
[124] lazyeval_0.2.2 spatstat.geom_3.2-9 Matrix_1.6-5
[127] RcppHNSW_0.6.0 hms_1.1.3 patchwork_1.2.0
[130] bit64_4.0.5 sparseMatrixStats_1.12.2 future_1.33.1
[133] shiny_1.8.0 ROCR_1.0-11 igraph_2.0.2
[136] broom_1.0.5 bit_4.0.5 date()[1] "Wed Mar 13 18:55:50 2024"